Part 2: Performance Information
68
DoD Performance and Accountability Report Part 2: Performance Information
Transcript of Part 2: Performance Information

DoD Performance and Accountability Report
Part 2: Performance Information

DoD Performance and Accountability Report
Page intentionally left blank.

DoD Performance and Accountability Report 48 Part 2: Performance Information
FY 2004Target/Actual
FY 2003Actual
? 56% / 53%51.2%
Performance Metric: S ti f tiW ith Military Health Care Pl FY 2004
Target/ActualFY 2003
Actual
> 56% / 53%51.2%
Performance M etric: Satisfaction With M ilitary Health Care Plan
Performance Information
In Part 1, Management Discussion and Analysis, we presented the year in review for the Department of Defense, including our Performance Highlights. Part 2, Performance Information, describes, in detail, more than 70 metrics in use or under development. They are organized by the Risk Management Framework introduced in Part 1.
Risk Management Framework
Our goal is to make sure investments across the Department are balanced among the four risk areas. Each quadrant of the risk management framework is associated with four outcome goals that define leading indicators of successful performance within that quadrant. By monitoring overall performance trends for these important indicators, we can better frame choices on how to balance risks and thus allocate resources across the entire Department.
Each outcome goal has corresponding metrics to track our performance in meeting these goals. They comprise the balance of Section 2, and are organized as follows:
Risk Category
Outcome Goals Performance or Activity metrics
The metrics track two trends: where we are and where we want to go. Accordingly, we monitor metrics for both current outputs and developmental initiatives.
Our performance metrics track current outputs. They set quantitative, annual targets for performance that are measurable.
Sample Performance Metric
Our activity metrics track developmental activities. They are usually qualitative and track key milestones or events in lieu of a specific annual performance target. Activities in the Department of Defense performance plan are initiatives to drive change –when complete, they will result in a new baseline or benchmark, define a new capability, or provide a new performance metric.
Sample Activity Metric
Activity Metric: Optimal Officer Career Patterns
FY 2003 FY 2004
Phase I study complete.Started Phase II. Published Phase I report.
More than half of the metrics in the FY 2004 performance plan are activity metrics—of those, 36 percent are designed to deliver a new capability in support of the Department’s overall goal to transform U.S. forces for the 21st century. Finally, several metrics are labeled as “lagged” or “lagging.” These are metrics for which data becomes available only after publication.
These same metrics and others under development enable a robust evaluation of the FY 2005 performance plan contained in the Annual Report to the President and the Congress.
Annual Performance Goals and Results
Organization of Metrics

DoD Performance and Accountability Report 49 Part 2: Performance Information
Data Quality (Verification and Validation)
General: The Department of Defense is committed to providing clear and reliable data to those who use it for managing, decision-making and for oversight of DoD programs. The Department also ensures, to the greatest extent possible, the data is quantifiable and verifiable by putting in place internal management controls and by being responsive to the insights provided by the Department’s Office of the Inspector General, the General Accounting Office, and others.
Data Integrity Systems and Controls: Performance data for most quantifiable measures are generated as a by product of DoD’s routine operations. Surveyed satisfaction data is produced from statistically valid surveys. Accuracy measures come from validated automated systems and are periodically reviewed and analyzed for accuracy. New metrics or metrics under development will be subject to the same data quality requirements once the metric is established.
Detailed performance information is available at www.dod.mil/comptroller/par/fy2004/06-01_Detailed_Performance.pdf Force Management Risk stems from issues affecting the ability to recruit, retain, train, and equip sufficient numbers of quality personnel and sustain the readiness of the force while accomplishing our many operational tasks. Providing a trained and ready force is the leading business of the Department of Defense. The Department must employ the tools of modern commerce to better manage our military and civilian workforce—more flexible compensation packages, contemporary recruiting techniques, improved training. DoD must guarantee the working and living conditions that will enable our people to perform at
their best. The Department must take care of the future—seek out or create the skilled workforce demanded of a 21st century military force.
The four outcome goals for this risk management quadrant are:
• Maintain a Quality Force • Ensure sustainable military tempo and
maintain workforce satisfaction • Maintain reasonable force costs • Shape the force of the future
More than half the metrics supporting these outcome goals are performance metrics for recruiting and retention, health care, and quality of life. The remaining measures are activity metrics focused on improving recruiting and retention by refining tools to look at skills, grade and occupational category, attributes for civilian and military future skills, improving tempo monitoring tools, and developing additional cost indicators. Outcome Goal: Maintain a Quality Force A quality force is maintained when you recruit quality people and then retain your best. Longstanding metrics that help gauge aptitude, education, and retention, have helped the Department ensure America has the best force in the world. This outcome goal has eleven metrics.
We must forge a new compact with war-fighters and those who support them, one that honors their service, understands their needs, and encourages them to make national defense a life-long career.
Secretary Rumsfeld, September 10, 2001
Force Management Risk

DoD Performance and Accountability Report 50 Part 2: Performance Information
Performance Metric: Active Component End Strength within 2% of Authorization
Service FY 2001 Actual
FY 2002 Actual
FY 2003 Actual*
FY 2004 Authorizeda/
Actualb
Army 480,801
(+0.2%)
486,542
(+1.4%)
499,301
(+4.0%) 482,400/ 500,203 (+3.7%)
Navy 377,810
(+1.4%)
383,108
(+1.9%)
382,235
(+1.7%)
373,800/ 375,521 (+0.5%)
Marine Corps
172,934
(+0.2%)
173,733
(+0.7%)
177,779
(+1.6%)
175,000/ 176,202 (+0.7%)
Air Force
353,571
(-1.0%)
368,251
(+2.6%) 375,062
(+4.4%) 359,300/ 379,887 (+5.7%)
aIn accordance with the FY 2004 National Defense Authorization Act. bThe FY 2004 data are as of the 3rd quarter.
Metric Description. Service end strength authorizations are set forth in the National Defense Authorization Act (NDAA) for the fiscal year. Services are required to budget and execute to that end strength by the end of the fiscal year. The Services’ actual end strength for each quarter will be evaluated against the authorized strength for that fiscal year. By law, the Service Secretaries may authorize operating up to two percent above the authorized end strength, and the Secretary of Defense may authorize Services to be up to three percent above their authorized end strength for that fiscal year, if determined to be in the national interest. Last year was the first year that quarterly comparisons were made. Performance Results for FY 2004. The nation continued to operate in a state of National Emergency by Reason of Certain Terrorist Threats in FY 2004. Consequently, the end strength requirements were waived. The Army and Air Force exceeded the three percent criterion again, while the Navy and Marine Corps ended the third quarter within the two percent criterion. In the spring of 2004, the Army received permission from the Secretary of Defense to operate with 512,400 troops, or 30,000 more than authorized. The Air Force instituted two phases of force shaping in FY 2004 to reduce its operating strength; these programs, combined with a programmed reduced accession mission, will allow Air Force to end FY 2005 at the authorized strength level.
Performance Metric: Reserve Component Selected Reserve End Strength (Congressionally Authorized End Strength)
Reserve Component
FY 2001Actual
FY 2002 Actual
FY 2003Actual
FY 2004 Authorized/
Actual a
Army National Guard (ARNG)
351, 829
(+0.4%)
351,078
(+0.3%)
351,091
(+0.3%)
350,000/
342,970 (-2%)
Army Reserve
(USAR)
205,628
(+0.2%)
206,682
(+0.8%)
211,890
(+3.4%) 205,000/
210,630 (+2.7%)
Navy Reserve (USNR)
87,913
(-1.1%)
87,958
(+1.1%)
88,156
(+0.4%)
85,900/
82,711 (-3.7%)
Marine Corps Reserve (USMCR)
39,810
(+0.6%)
39,905
(+0.9%)
41,046
(+3.8%) 39,600/
40,127 (+1.3%)
Air National Guard (ANG)
108,485
(+0.4%)
112,075
(+3.4%) 108,137
(+1.4%)
107,030/
106,781 (-0.2%)
Air Force Reserve (USAFR)
74,869
(+0.7%)
76,632
(+2.6%) 74,754
(-1.1%)
75,800/
74,369 (-1.9%)
Coast Guard Reserve (USCGR)
7,976
(-0.3%)
7,816
(-2.3%) 7,720
(-14.2%) 10,000/
7,729 (-22.7%)
aThe data provided in the FY 2004 column above represents actual results for the fiscal year as of 3rd quarter.
Metric Description. End strength authorizations for each of the seven Reserve components are set forth in the National Defense Authorization Act (NDAA) for the fiscal year. Components are compelled to budget and execute to that end strength by the end of the fiscal year. The component actual end strength for each quarter will be evaluated against the authorized end strengths for that fiscal year. By law, the Secretary of Defense may authorize the components to vary, by no more than 2 percent, their authorized end strength for that fiscal year, if determined to be in the national interest. It should be noted that while under partial mobilization, the Secretary may, as authorized by the President, waive all end strength limitations, if deemed appropriate. Performance Results for FY 2004. In his Declaration of National Emergency by Reason of Certain Terrorist Threats, the President, among other things, waived the end strength limitations during the time of national emergency. Components, however, have been directed by the Secretary to attempt to meet the 2 percent criterion, though exceptions are authorized based on the operational situation. As of

DoD Performance and Accountability Report 51 Part 2: Performance Information
the end of the 3rd quarter of this fiscal year, four components are at, or exceed, the 2 percent variation. Three of those four components are under their authorizations. The primary reason for the shortfall in strength for these three components is a shortfall in recruiting. However, this is by design in the Navy Reserve because the Navy Reserve is downsizing by almost 10,000 people over the next 5 years, with a 2,500 reduction in FY 2005. Also, the Coast Guard Reserve shortfall appears to be exaggerated because of certain strength accounting rules. The Coast Guard Reserve actually has another 1,022 members who are not counted in their strength, but are being counted in the Active Coast Guard strength because of those accounting rules. Additionally, the Coast Guard Reserve budgeted for an end strength of 8,052 instead of the Congressionally authorized 10,000, which makes their end strength achievement seem very low. Finally, the Coast Guard Reserve comes under the new Department of Homeland Security (DHS) and not the Department of Defense (DoD). One component (the Army Reserve) currently exceeds the 2 percent variance goal at +2.7 percent of authorized. The primary reason is directly attributed to the ongoing mobilization. Based on budgeted manpower ramps, the current end strength status may approximate year-end data. Performance Metric: Active Component Enlisted Recruiting Quality
Category FY 2001 Actuala
FY 2002 Actuala
FY 2003 Actuala
FY 2004 Target/Actual b
Percentage of recruits holding high school diplomas (Education Tier 1)
93 94 95 >90 / 97
Percentage of recruits in AFQT categories I–IIIA
66 70 72 >60 / 76
Percentage of recruits in AFQT category IV
1 0.7 0.2 <4 / 0.2
NOTE: AFQT = Armed Forces Qualification Test. The AFQT is a subset of the standard aptitude test administered to all applicants for enlistment. It measures math and verbal aptitude and has proven to correlate closely with trainability and on the job performance.
a Official High School Diploma Graduates performance excludes 4,000 participants in the Army’s GED+ pilot program, therefore the actual numbers were adjusted to reflect this factor.
b The data provided in the FY 2004 column are as of 3rd quarter.
Metric Description. DoD measures recruiting quality along two dimensions – aptitude and educational achievement of non-prior service
recruits. All military applicants take a written enlistment test called the Armed Services Vocational Aptitude Battery (ASVAB). One component of that test is the Armed Forces Qualification Test, or AFQT, which measures math and verbal skills. The table below shows how AFQT percentiles are grouped into categories:
Armed Forces Qualification Test (AFQT) Categories and Corresponding Percentile Score Ranges
AFQT Category Percentile Score Range
I 93–99
II 65–92
IIIA 50–64
IIIB 31–49
IV 10–30
V 1–9
As shown in the table, those who score at or above the 50th percentile on the AFQT are in categories I-IIIA (CAT I-IIIA). DoD values these higher-aptitude recruits because their training and job performance are superior to those in the lower categories (Category IIIB-IV). DoD also values recruits with a high school diploma because years of research and experience tell us that high school diploma graduates are more likely to complete their initial term of service. Quality benchmarks for recruiting were established in 1992 based on a study conducted jointly by the Department of Defense (DoD) and the National Academy of Sciences.1 The study produced a model linking recruit quality and recruiting resources to the job performance of enlistees. Based on this study, the Department adopted minimum acceptable quality thresholds: 90 percent in education tier 1 (primarily high school graduates), 60 percent in AFQT categories I–IIIA. The Department does not accept more than 4 percent in AFQT category IV, and does not recruit from category V. Adhering to these benchmarks reduces personnel and training costs, while ensuring the force meets high performance standards.
Performance Results for FY 2004. Through June
1 Modeling Cost and Performance for Military Enlistment. National Research Council, Commission on Behavioral and Social Sciences and Education, Committee on Military Enlistment Standards; Bert F. Green, Jr. and Anne S. Mavor, editors; National Academy Press, Washington; 1994

DoD Performance and Accountability Report 52 Part 2: Performance Information
2004, all Active components are on course to meet or exceed their recruiting quality goals for FY 2004, as they did in FY 2003. The next fiscal year, FY 2005, may be more challenging in a war-time environment with an expanding economy, and a depleted delayed-entry pool of applicants. Performance Metric: Reserve Component Enlisted Recruiting Quality
Metric FY 2001 Actual
FY 2002 Actual
FY 2003Actual
FY 2004 Target/ Actualc
Percentage of recruits holding high school diplomas (Education Tier 1)
89 89 87 ≥90/88%a
Percentage of recruits in AFQT categories I–IIIA
64 66 66 ≥60/66%b
Percentage of recruits in AFQT category IV
1 1.1 1.5 <4/1.4%
NOTE: AFQT = Armed Forces Qualification Test. The AFQT is a subset of the standard aptitude test administered to all applicants for enlistment. It measures math and verbal aptitude and has proven to correlate closely with trainability and on the job performance. a Excludes Navy Reserve and Air National Guard; see discussion in Performance Results paragraph. b Excludes Navy Reserve; see discussion in Performance Results paragraph. c The data provided in the FY 2004 column are as of 3rd quarter (estimate).
Metric Description. Like the active component, the reserve component maintains quality benchmarks of at least 90 percent in education tier 1 (primarily high school graduates), 60 percent in AFQT categories I–IIIA (top 50 percentiles), and not more than 4 percent in AFQT category IV. Performance Results for FY 2004. The Reserve components, in the aggregate, are meeting their AFQT I-IIIA goal, but not their Tier 1/High School Diploma Graduate (HSDG) goal for enlisted recruit quality in FY 2004. Moreover, all are facing significant recruiting challenges. More emphasis is being placed on the non-prior service market as the number of individuals affiliating with the Reserve components following active duty service has decreased. The Air National Guard and the Navy Reserve continue to improve in reporting recruit quality data. Efforts are ongoing to correct these data issues. Both of these components have historically far exceeded the DoD benchmarks, and we are confident
that is still the case. The Army National Guard continues to struggle to meet the Department’s quality benchmark for high school diploma graduates. DoD is working with the Army National Guard to examine this issue. The Army National Guard recruit quality will likely continue to remain below the DoD benchmark for the next several years. Performance Metric: Active Component Enlisted Recruiting Quantity
Metric FY 2001Actual
FY 2002 Actual
FY 2003Actuala
FY 2004 Target b /Actual c
Number of enlisted Active Component accessions
196,355 196,472 184,879 181,360/ 128,900
a FY 2003 Actual has been adjusted by two to reflect finalized data. b FY 2004 target has changed since last report because of changes in requirements and recruiting behavior. c The data provided in the FY 2004 column are as of the 3rd quarter.
Metric Description. Department-wide targets for active duty enlisted recruiting represent the projected number of new Service members needed each year to maintain statutory military end strengths and appropriate distributions by rank, allowing for discharges, promotions, and anticipated retirements. As personnel trends change during the year, Active component recruiting objectives may be adjusted. Performance Results for FY 2004. Through June 2004, all Active components are on course to meet or exceed their recruiting quantity goals for FY 2004. Delayed-entry program levels are somewhat depleted, suggesting FY 2005 will be challenging.

DoD Performance and Accountability Report 53 Part 2: Performance Information
Performance Metric: Reserve Component Enlisted Recruiting Quantity
Metric FY 2001 Actual
FY 2002 Actual
FY 2003 Actual
FY 2004 Annual Tgt/
Actuala
Number of enlisted Reserve Component accessions
141,023 147,129 133,075 126,410b/
88,266
aThe data provided in the FY 2004 are as of the 3rd quarter bArmy Reserve and National Guard and Navy Reserve have adjusted their FY 2004 targets downward because trends changed during FY 2003. Therefore, the DoD-wide target decreased from the 139,523 previously reported to 126,410.
Metric Description. Department-wide targets for reserve component enlisted recruiting represents the projected number of new Service members needed each year to maintain statutory military end strengths and appropriate distributions by rank, allowing for discharges, promotions, and anticipated retirements. As personnel trends change during the year, Reserve component recruiting objectives may be adjusted. Performance Results for FY 2004. Three of the six Reserve components have met or exceeded their FY 2004 year-to-date numeric recruiting goals. Overall, the Reserve components recruited 88,266 through June against a goal of 92,491, or 95 percent of their mission. In a difficult recruiting environment, made more difficult by significantly smaller numbers of individuals who affiliate with the Reserve components following separation from the Active force, the Army National Guard, Air National Guard or Air Force Reserve have failed to achieve their numeric goal. The Department expects that all Reserve components except the Army National Guard will achieve their FY 2004 goal by the end of the fiscal year.
Activity Metric: Manning Levels of Critical Skills End-state Metric FY 2001 FY 2002 FY 2003 FY 2004a
The percentage of skills that are deemed critical for retention relative to a DoD-wide benchmark.
No historical data: new metric
Started to define critical skills
Services developed list of critical skills
Established common definition for critical skill
Tested data collection
a The FY 2004 data are final.
Metric Description. The Department is developing a way of measuring how effective we are at recruiting and retaining the military skills most critical to our mission. As a first step, the Department established a common definition and metric to monitor critical skills across the Services. The next step is to test both our data collection methods and the effectiveness of the metric in monitoring manning levels. To be designated as “critical,” a skill must meet two tests: (1) it must be short of its targeted manning and (2) it must be critical to the Service’s mission. The metric we are developing monitors each Service’s ability to retain members in its top ten critical skills. If the Service retains 95 percent or more of its desired goal for a particular skill, it will be deemed “Green.” If the Service retains 86 percent to 94 percent of its goal for a particular skill, it will be deemed “Yellow.” If it retains 85 percent or less of its goal for a particular skill, it will be deemed “Red.” The Service’s overall rating will be no higher than its lowest rated designated critical skill.
Ongoing Research. In fourth quarter FY 2004, Services provided test data for this metric. This test collected information on the top ten most critical skills that meet both parts of the “critical” definition of shortage and mission criticality, as well as data about how well the Service is meeting retention goals for each skill category, and overall manning for each skill. The Department is working to refine the metric definition and its data collection methods.
Timeline for Completion. Beginning in FY 2005, this metric will be added to the monthly Status of Forces review conducted by the Under Secretary of Defense for Personnel and Readiness.
Performance Results for 2004. The Office of Secretary of Defense and Service points of contact

DoD Performance and Accountability Report 54 Part 2: Performance Information
refined data collection procedures in July 2004; the Services tested data collection methods in August 2004.
Performance Metric: Critical Skill Recruit Needs
Metric FY 2001 Actual
FY 2002 Actual
FY 2003 Actual
FY 2004 Target/Actual a
Percent-age of acces-sion mission met for all skills
No historical data: new metric
>95% fill for all skills / 4 of the 63 designated
skills (6%) filled less than 95%
Notes:
1. Accession missions for each skill are set by the Services based upon required manning levels in the current and future force and expected losses in training.
2. Data was not collected for this metric prior to FY 2004.
a The data provided in the FY 2004 column are as of 3rd quarter.
Metric Description. The Department is now implementing a "critical skill recruit needs" metric. Each Service will annually identify the 10 percent of their skills that are most critical for their recruiting force to focus on in the coming year. At this time, the metric is only applied to active duty enlisted recruits. “Critical skill recruit needs” receive extra recruiting emphasis though such tools as enlistment bonuses, college funds, and incentives to recruiters. The skill must meet one or more of the following criteria:
• Is crucial to combat readiness • Is undermanned in the force • Has unfilled training class seats • Requires a high volume of recruits • Has much higher entrance standards than
most skills • Is considered undesirable duty by most
recruits The exact fill rate for each skill will be measured, and each Service will be rated based on the recruit rate of its lowest skill rating. The working group has initially set its target for recruiting critical skills somewhat above the level applied to determine whether units are “Fully
Mission Capable,” deciding to rate each skill as “Green” if its recruiting fill is 95 percent or above; “Yellow” if its recruiting fill is 85 percent to 94 percent; and “Red” if its recruiting fill is 84 percent or below. This is an ambitious rating scale and reflects an assumption that operational units will be best equipped to achieve the desired skill match levels if the recruiting system ensures even greater precision in the job mix of each accession cohort. The Department will reassess this issue as our understanding of the process matures. Performance Results for FY 2004. This measure is new for FY 2004, so predicting the final FY 2004 outcome from third quarter data is difficult. As of the end of third quarter, 4 of 63 designated skills were filled to less than 95 percent. The understanding that our target was very ambitious and all specialties deemed critical skill recruit needs are challenging recruiting tasks, leads us to project from third quarter results that some specialties will not be filled to the desired 95 percent level by year’s end.
DoD Performance and Accountability Report 55 Part 2: Performance Information
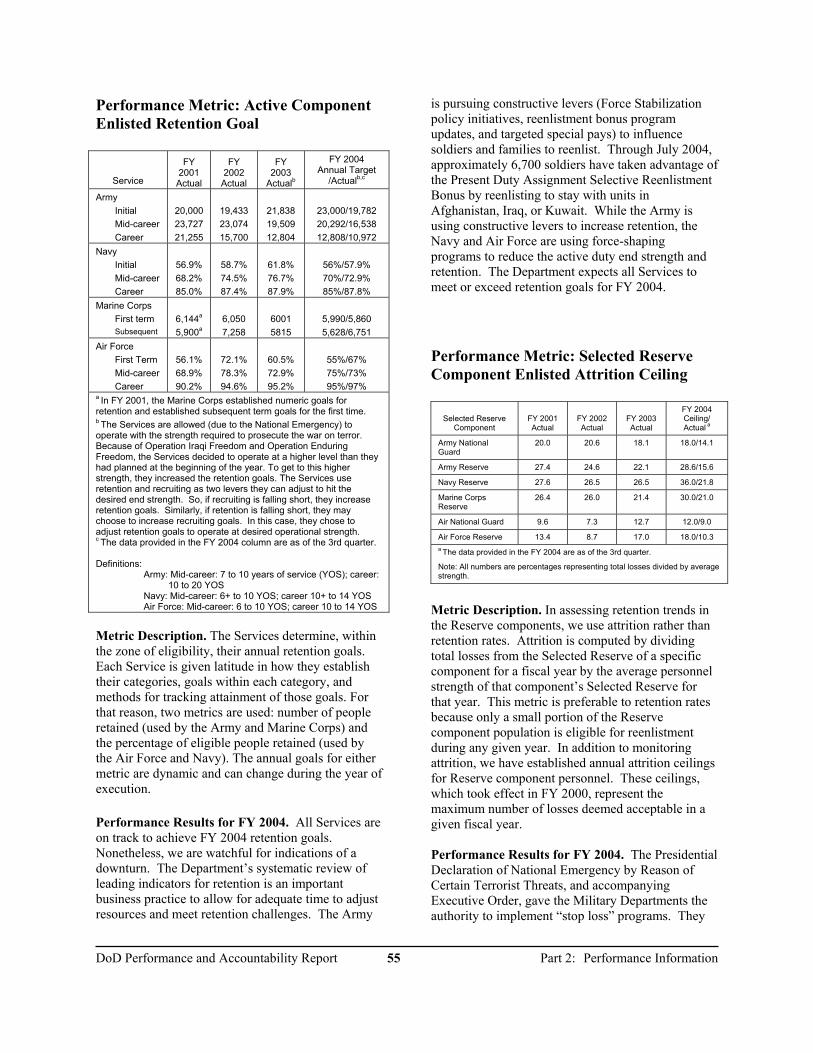
Performance Metric: Active Component Enlisted Retention Goal
Service
FY 2001 Actual
FY 2002
Actual
FY 2003
Actualb
FY 2004 Annual Target
/Actualb,c
Army Initial Mid-career Career
20,000 23,727 21,255
19,433 23,074 15,700
21,838 19,509 12,804
23,000/19,782 20,292/16,538 12,808/10,972
Navy Initial Mid-career Career
56.9% 68.2% 85.0%
58.7% 74.5% 87.4%
61.8% 76.7% 87.9%
56%/57.9% 70%/72.9% 85%/87.8%
Marine Corps First term Subsequent
6,144a
5,900a
6,050 7,258
6001 5815
5,990/5,860 5,628/6,751
Air Force First Term Mid-career Career
56.1% 68.9% 90.2%
72.1% 78.3% 94.6%
60.5% 72.9% 95.2%
55%/67% 75%/73% 95%/97%
a In FY 2001, the Marine Corps established numeric goals for retention and established subsequent term goals for the first time. b The Services are allowed (due to the National Emergency) to operate with the strength required to prosecute the war on terror. Because of Operation Iraqi Freedom and Operation Enduring Freedom, the Services decided to operate at a higher level than they had planned at the beginning of the year. To get to this higher strength, they increased the retention goals. The Services use retention and recruiting as two levers they can adjust to hit the desired end strength. So, if recruiting is falling short, they increase retention goals. Similarly, if retention is falling short, they may choose to increase recruiting goals. In this case, they chose to adjust retention goals to operate at desired operational strength. c The data provided in the FY 2004 column are as of the 3rd quarter. Definitions: Army: Mid-career: 7 to 10 years of service (YOS); career: . 10 to 20 YOS Navy: Mid-career: 6+ to 10 YOS; career 10+ to 14 YOS Air Force: Mid-career: 6 to 10 YOS; career 10 to 14 YOS Metric Description. The Services determine, within the zone of eligibility, their annual retention goals. Each Service is given latitude in how they establish their categories, goals within each category, and methods for tracking attainment of those goals. For that reason, two metrics are used: number of people retained (used by the Army and Marine Corps) and the percentage of eligible people retained (used by the Air Force and Navy). The annual goals for either metric are dynamic and can change during the year of execution. Performance Results for FY 2004. All Services are on track to achieve FY 2004 retention goals. Nonetheless, we are watchful for indications of a downturn. The Department’s systematic review of leading indicators for retention is an important business practice to allow for adequate time to adjust resources and meet retention challenges. The Army
is pursuing constructive levers (Force Stabilization policy initiatives, reenlistment bonus program updates, and targeted special pays) to influence soldiers and families to reenlist. Through July 2004, approximately 6,700 soldiers have taken advantage of the Present Duty Assignment Selective Reenlistment Bonus by reenlisting to stay with units in Afghanistan, Iraq, or Kuwait. While the Army is using constructive levers to increase retention, the Navy and Air Force are using force-shaping programs to reduce the active duty end strength and retention. The Department expects all Services to meet or exceed retention goals for FY 2004. Performance Metric: Selected Reserve Component Enlisted Attrition Ceiling
Selected Reserve Component
FY 2001 Actual
FY 2002 Actual
FY 2003 Actual
FY 2004 Ceiling/ Actual a
Army National Guard
20.0 20.6 18.1 18.0/14.1
Army Reserve 27.4 24.6 22.1 28.6/15.6
Navy Reserve 27.6 26.5 26.5 36.0/21.8
Marine Corps Reserve
26.4 26.0 21.4 30.0/21.0
Air National Guard 9.6 7.3 12.7 12.0/9.0
Air Force Reserve 13.4 8.7 17.0 18.0/10.3 a The data provided in the FY 2004 are as of the 3rd quarter.
Note: All numbers are percentages representing total losses divided by average strength.
Metric Description. In assessing retention trends in the Reserve components, we use attrition rather than retention rates. Attrition is computed by dividing total losses from the Selected Reserve of a specific component for a fiscal year by the average personnel strength of that component’s Selected Reserve for that year. This metric is preferable to retention rates because only a small portion of the Reserve component population is eligible for reenlistment during any given year. In addition to monitoring attrition, we have established annual attrition ceilings for Reserve component personnel. These ceilings, which took effect in FY 2000, represent the maximum number of losses deemed acceptable in a given fiscal year. Performance Results for FY 2004. The Presidential Declaration of National Emergency by Reason of Certain Terrorist Threats, and accompanying Executive Order, gave the Military Departments the authority to implement “stop loss” programs. They

DoD Performance and Accountability Report 56 Part 2: Performance Information
remain in effect as the global war on terror and operations in Iraq continue. The only Military Department pursuing a “stop loss” program is the Army. Depending on the number of members mobilized, this influences attrition rates, since mobilized Army Reserve component members are subject to “stop loss” for the duration of their mobilization, plus a transition period of 90 days after demobilization. Reserve component enlisted attrition remains strong and is well within acceptable limits. There is nothing remarkable or unexpected in attrition figures to date. However, continued vigilance is prudent, especially considering the large rotation of troops in Iraq during FY 2004 and the ongoing Army “stop loss” program. Activity Metric: Retain Balanced Mix of Non-Commissioned Officer (NCO) Grade/Experience
End-state Metric FY
2001 FY
2002 FY 2003 FY 2004 Number of skills/ experiencing deficiencies
Top ten enlisted occupational groups.
No historical data: new metric
Services established a promotion-timing benchmark for 10 most critical enlisted occupational specialties
Completed study of Service retention metrics
Began policy revisions to establish a tie between grade and experience
Metric Description. The metric will measure the number occupational skills or groups experiencing deficiencies. The metric will account for grade requirements and the supply of experience emerging from promotion and retention programs. It will also account for promotion bottlenecks that hinder retention. The performance metric will monitor the top ten enlisted occupational skills/groups that fall outside Service-defined promotion boundaries which include the amount the enlisted member has been in the service (time-in-service), and the time the member has been in his or her grade (time-in-grade). Annual goals are dynamic and can adjust from year to year. The goal for this metric is to minimize skill and experience deficiencies. Though a challenging goal, the information is very useful for evaluating our experience and skill mix and to determine where emphasis should be placed in our professional development, promotion, and retention programs.
Ongoing Research. In support of the DoD Military Personnel Human Resources Strategic Plan, the Department is assessing the Services’ current retention metrics to ensure measurement tools are designed to meet force sustainment goals. The study will focus on validating these metrics and identifying changes needed to help improve forecasting occupational skill strength and grade requirements, program review, and personnel planning. Timeline for Completion. During FY 2005, the Services will establish a long-term baseline/goal to determine the promotion timing benchmark to help focus retention programs and evaluate outcomes. Promotion data is available now; however, the Services need to determine benchmarks for the occupations, such as time-in-service or time-in-grade. Performance Results for FY 2004. During FY 2004 the Department completed a study of Service retention goal-setting in order to understand how Services establish goals today. Based on the results of this study, the Department began the revision of DoD Directive 1304.20, “Enlisted Personnel Management,” to be published in FY 2005. The planned revision will mark a distinct change in Department policy by establishing that grade and experience should be linked. After the Directive is published, a metric will be established.
Outcome Goal: Ensure Sustainable Military Tempo and Workforce Satisfaction. As with many goals, where changes in one goal’s outcome correlate to other goals’ outcomes, our success in maintaining workforce satisfaction will have a magnified impact across the force. Seven existing and developmental metrics help the Department care for our most valuable resource: people. The next two metrics deal with Personnel Tempo. On October 1, 2000, Congress directed the Services to start tracking and reporting individual time away from home (expressed in days), commonly referred to as personnel tempo (PERSTEMPO).

DoD Performance and Accountability Report 57 Part 2: Performance Information
Each of the Services has developed or enhanced existing data collection systems to support the legislative requirements. They will report the number of days each member is deployed with particular emphasis and scrutiny placed on those 10 major occupational groups that have deployed 400+ days out of the preceding two years. The same data is also used to assess PERSTEMPO for the Services and their active and reserve components. Both metrics under development will incorporate a frequency and duration dimension to PERSTEMPO based on changes to the PERSTEMPO legislation in the FY 2004 National Defense Authorization Act. The Defense Management Data Center (DMDC) has spent considerable time with Services to ensure that the PERSTEMPO reporting process is working properly. However, validation and verification is a very difficult and expensive process. Although the Services conducted some initial checks to ensure accuracy of data, the onus is largely on the service member to ensure “deployed days” reported on individual Leave and Earnings Statements are accurate. Accordingly, the Department has asked DMDC to crosscheck the accuracy of its PERSTEMPO information with similar information reported by the Defense Finance and Accounting Service who maintains individual Leave and Earnings Statements.
On October 8, 2001, the Department suspended certain PERSTEMPO management processes in accordance with the provisions of the national security waiver set forth in section 991(d) of Title 10, United States Code.
Activity Metric: PERSTEMPO Across Occupational Groups
End-state Metric
FY 2001
FY 2002 FY 2003 FY 2004a
The percentage of an occupation-al group that surpasses the PERS-TEMPO day constraints.
Services began tracking PERS-TEMPO as directed by Congress.
Published Interim PERS-TEMPO Policy Guidance.
Validated and verified Service data.
Consider-ed Global Joint Rotational Policy.
Began tracking frequency and duration of PERS-TEMPO trends.
Completed initial tracking metric.
a The FY 2004 data are preliminary.
Metric Description. The metric will capture the percentage of an occupational group, as defined by DMDC occupational codes that have exceeded the 400-day PERSTEMPO constraint within the last 730 days and/or the 191-day-consecutive PERSTEMPO constraint, by Service and across the Department. This metric will provide valuable insight into the “high deploying” skills and relate them to the high-deploying/low-density (HD/LD) units, as appropriate. Ongoing Research. The Department has contracted with LMI, a not-for-profit consulting firm, to define and refine key performance indicators. DMDC has been tasked to provide the data to develop the metrics. Timeline for Completion. Development of this metric will be complete in FY 2004; data will be reported in FY 2005. Performance Results for FY 2004. In FY 2004, the Department began tracking PERSTEMPO trends. We expect to establish this metric in time to report on it in FY 2005.
Activity Metric: PERSTEMPO Standards Met
End-state Metric FY 2001 FY 2002 FY 2003 FY 2004a
The percentage of Active and Reserve Components (by Service) that exceed PERS-TEMPO constraints.
Congression-ally directed PERS-TEMPO reporting began.
Published Interim Personnel Tempo (PERS-TEMPO) Policy Guidance.
Validated and verified data.
Consider-ed Global Joint Rotational Policy.
Began tracking frequency and duration of PERS-TEMPO trends.
Completed initial tracking metrics.
a The FY 2004 data are preliminary.
Metric Description. This metric will portray the percentage of the Service Active and Reserve components that exceed the 400-day PERSTEMPO constraint within the last 730 days and/or the 191-day consecutive PERSTEMPO constraint. This metric will provide valuable insight into the “high deploying” tendencies of various Service components.

DoD Performance and Accountability Report 58 Part 2: Performance Information
Ongoing Research. The Department has contracted with LMI, a not-for-profit consulting firm, to help us define and refine key performance indicators. Timeline for Completion. The LMI study effort is to be completed by end of FY 2004. Performance Results for FY 2004. In FY 2004 the Department began tracking PERSTEMPO trends. We will complete the metric by the end of the fiscal year.
The next two metrics are part of three to help address quality of life (QoL) stresses on service members and their families. These activity measures respond to the National Security Presidential Directive–2 (February 2001), “Improving Quality of Life,” and are in line with Secretary of Defense Guidance to track QoL improvements and give priority to the implementation of QoL initiatives.
The Commitment to Military Life index, in combination with a QoL Social Compact Improvement Index and a QoL Per Capita Cost Metric, helps measure the health of QoL programs and services supporting military members and families.
Current deployments and high personnel tempo necessitate robust QoL support for troops and families. In an effort to mitigate force management risk and enhance workforce satisfaction, the Department must transform QoL to meet the needs of changing demographics and expectations of military members and their families.
Activity Metric: Commitment to Military Life Index
End-State Metric
FY 2001
FY 2002 FY 2003 FY 2004 a
Trend data to monitor results in key commitment areas that are predictors of retention and satisfaction.
No historical data: new
metric.
• Reviewed corporate commitment literature.
• Developed commitment factors reflecting military environment and culture.
• Conducted focus groups to validate and expand commitment factors.
• Fielded survey
• Developed final commitment index for military service.
• Fielded commitment index in April 2004 survey of Guard and Reserve members.
• Commitment index included in the August 2004 active duty survey.
a The FY 2004 data provided above is preliminary.
Metric Description. The Commitment to Military Life Index is a new indicator that will track the factors that influence and predict commitment to military service for both active duty members and spouses. This index is modeled after an approach used in corporate America to measure employee commitment.
Retention is a critical problem in the military and commitment has been shown to be a primary predictor of retention decisions. Thus, this effort is directed at developing an index of service member commitment to military service that can be used to track commitment periodically over time. The Department is also developing a complementary index of spousal commitment to the military, thereby acknowledging the importance of both the military member and the family in predicting commitment to the military. The value of the index is to demonstrate the different fluctuations and factors of commitment over time. The commitment indexes contained in the DMDC Reserve component Survey (April 2004) and the DMDC active duty Survey (August 2004) will provide an initial baseline for the commitment index. The index will gain meaning as the factors influencing commitment are tracked over time. The survey instrument will be reviewed and updated as needed and data will be cross-referenced with the QoL Social Compact Improvement Index and

DoD Performance and Accountability Report 59 Part 2: Performance Information
Community QoL Per Capita Cost Metric. Ongoing Research. Work on the index began by reviewing current literature and other applicable research on commitment and developing a set of commitment factors that reflected the needs and environment of the military and its culture. Additionally the Department developed a strategy for validation of the results. Focus groups were conducted at four military installations during the months of June and July 2002 to validate and expand the factors and to garner the information needed to develop the survey instrument. Timeline for Completion. The final commitment index survey instrument was developed in March 2004. The survey was fielded for the first time in April 2004. Performance Results for FY 2004. The Department developed and fielded the final commitment index in the April 2004 DMDC survey of National Guard and Reserve component members. The commitment index was included in the August 2004 active duty survey. The data collected provides baseline commitment data for FY 2005.
Activity Metric: Quality of Life Social Compact Improvement Index
Metric FY
2001 FY
2002 FY 2003 FY 2004 a
Trend data to monitor improvements in leading QoL indicators.
No historical data: new metric.
Developed framework for QoL index
Established baselines and initial performance targets
a The FY 2004 data provided above is preliminary.
Metric Description. The Quality of Life (QoL) Social Compact Improvement Index is the second indicator of the three QoL measures. The index is designed to link QoL programs and services included in the Social Compact. It recognizes the reciprocal partnership that exists between the Department, the service member, and his or her family. The index will track improvements in QoL to ensure the Department underwrites support to families. The index is envisioned to be dynamic with program areas and metrics added or eliminated as
data mature and priorities change. It currently includes six major program areas, and we anticipate no more than 10 functional program areas in the index at any one time. Metrics, baselines, targets and parameters have been established for the six functional areas within the initial index to track improvement in QoL:
• Housing Assignment: Percentage of out-of-pocket housing expenses, percentage of E1 to E4 junior enlisted families living on base, and percentage of single E4s and E5s living on base.
• 24/7 toll free family assistance: Military OneSource - Number of installations with coverage.
• Voluntary education/Tuition Assistance: Out-of-pocket education costs, number of enrollments, and number of degrees or diplomas earned.
• Financial readiness: Percentage of E1-E4s reporting problems paying bills and percentage of E1-E4s who report they have “difficulty making ends meet” or are “in over their heads.”
• Childcare: Number of childcare spaces and percentage of accredited child development centers.
• DoD Educational Activity (DoDEA): Pupil-teacher ratio and student achievement scores.
The Office of the Under Secretary of Defense, Military Community and Family Policy will update the performance data annually. Data will be cross-referenced with the Community QoL Per Capita Cost Metric and Commitment to Military Life Index to ensure QoL programs are keeping pace with the changing expectations of military members and families. Ongoing Research. Service Social Compact functional area teams have addressed each area impacting QoL for military members and families. Beginning in October 2002, the teams began a series of meetings to update functional area goals, establish achievable targets, outcomes, and long-term strategies. The teams developed performance indicators, and identified data sources. This data was incorporated into the QoL Social Compact Improvement Index. The Social Compact is a 20-year strategy requiring continual review and revision to keep pace with the changing needs of the

DoD Performance and Accountability Report 60 Part 2: Performance Information
transforming military. While the Social Compact includes long-term, mid-term and short-term strategies, the index will focus on the short-term. In FY 2004, the Social Compact was modernized to reflect the performance metrics included in the DoD balanced scorecard. Timeline for Completion. The index is scheduled to be completed in FY 2005. Performance Results for FY 2004. Baselines and performance targets were established for housing assignment, Military OneSource–1-800 family assistance coverage, voluntary education/tuition assistance, financial readiness, childcare, and DoDEA.
Metric FY 2003 Baseline
FY 2004 Target
Housing
Percentage of out-of-pocket housing expenses
7.5% 3.5%
24/7 Toll Free Family Assistance–Military
OneSource
Number of installations with coverage
30 300
Off Duty/Voluntary Education
1) Out-of-pocket education costs
2) Number of degrees/ diplomas
1) Meet DoD policy for per unit cap and annual ceiling
2) 33,527
1) Meet DoD policy for per unit cap and annual ceiling
2) 34,676
Financial Readiness
1) Percentage reporting problems paying bills
2) Percentage reporting having difficulty making ends meet or are in over their heads
1) 41.5%
2) 16.5%
1) 39.4%
2) 15.7%
Child Development
1) Number of spaces
2) Percentage of centers accredited
1) 1,741
2) 90%
1) 4,884
2) 95%
DoDEA
1) Pupil to Teacher Ratio
2) Student Achievement – 75% of all students at or above Standard (math, reading, language arts)
3) Student Achievement –8% or fewer of all students fall below Standard (math, reading, language arts)
1) No less than 18.0:1 nor greater than 24.0:1
2) Meet or exceed National Standard
3) Meet or exceed National Standard
1) No less than 18.0:1 nor greater than 24.0:1
2) Meet or exceed National Standard
3) Meet or exceed National Standard.
Performance Metric: Satisfaction with Military Health Plan
Metric FY 2001 Actuala
FY 2002 Actualb
FY 2003 Actualc
FY 2004 Targetd/Actual e
Percentage satisfied with military health plan
44.6% 46.5% 51.2% ≥ 56%/ 53%
a Surveys fielded in January, April, and July 2001. b Surveys fielded in October 2001 and January, April, and July 2002. c The civilian average is based on a representative population from the national Consumer Assessment of Health Plans Survey Database (CAHPSD) for the same time period; this is the target for the Military Health System. (Example: A July 2003 survey would be compared to July 2003 data from the CAHPSD.) Due to the nature of the program, only a DoD-level goal is tracked. d The FY 2004 initial goal was the same as the FY 2003 goal; however, after progress tracking for FY 2003, it was determined that the FY 2004 goal needed to be reset to a yearly goal that would likely be achieved and will match the Defense Health Program Performance plan for FY 2004. Accordingly, the goal changed from ≥ Civilian Average to 56%, which represents closing the gap with civilian plans in three years. All future years goals are updated on an annual basis. e. The data provided in the FY 2004 column are as of the 3rd quarter.
Metric Description. A person’s satisfaction with his or her health plan is a key indicator of the performance of the Military Health System (MHS) in meeting its mission to provide health care to over eight million eligible beneficiaries. For this metric, the following survey item is used:
We want to know your rating of all your experience with your health plan. Use any number from 0 to 10 where 0 is the worst health plan possible, and 10 is the best health plan possible. How would you rate your health plan now?
Satisfaction is measured as the percentage of respondents (weighted by appropriate sampling weights) who answer 8, 9, or 10.
The survey, fielded quarterly, asks respondents questions about the plan during the prior year. Currently, the results for the year are based on the surveys fielded during the fiscal year, which means the results are actually based on the respondent’s interactions with the health system during the prior fiscal year.
The goal established for this metric in FY 2003 is considered a stretch goal that will drive the organization forward, but will likely not be achieved during that year. For FY 2004, the goal has been changed to reflect the desire to make the goal achievable during the current year, while still closing the gap with the civilian sector in three years. These goals are established based on a civilian survey, and will be updated on an annual basis.

DoD Performance and Accountability Report 61 Part 2: Performance Information
Performance Results for FY 2004. The 3rd quarter year-to-date score of 53 percent is 2 percentage points above last year’s score and should continue to improve. For the individuals who have chosen to enroll in TRICARE Prime, their scores for the 3rd quarter report met the goal of 56 percent. During the 3rd quarter reporting, all but one enrollment Service managed to meet the goal. In fact, enrollees to the Managed Care Support Contractor not only met the goal for the year, but also surpassed the Civilian Benchmark for each quarter of FY 2004. Continuous increases in enrollment, along with improvement in the score, demonstrates real progress for the program.
Performance Metric: Satisfaction with Access
Metric FY 2001 Actual
FY 2002 Actual
FY 2003Actual
FY 2004Target/ Actual a
Satisfaction with access
81.8% 80.8% 83.0% >84%/ 82.6%
a The data provided in the FY 2004 column are estimated results for the 3rd quarter.
Metric Description. Access to medical care has always been a significant factor in the overall satisfaction with medical care, and an area for focused improvement. The intent of this metric is to improve satisfaction with access to appointments for those individuals who have chosen to enroll in TRICARE PRIME (similar to a Health Maintenance Organization) within the Military Health System (MHS). This metric is based on a monthly customer satisfaction survey for those individuals who had an outpatient medical visit at a Military Treatment Facility (MTF)—hospital or clinic—during the previous month.2 Although there are a number of measures related to access, ease of making an appointment by phone has been considered a key measure for access and has been tracked over the last couple of years. The metric is based on Question 10a of the customer satisfaction survey:
How would you rate the (Clinic Name) on Ease of Making this Appointment by Phone?
2 The same survey is used for a metric that tracks overall satisfaction with appointments. However, that metric looks at responses to different survey questions and uses scores from all beneficiaries who visited an MTF rather than only TRICARE PRIME enrollees.
The percentage of respondents (weighted by appropriate sampling weights) that answer “Good,” “Very Good,” or “Excellent” on a scale from “Poor” to “Excellent” is computed. The survey is fielded monthly. Because of the fielding period, data collection period, and analysis period, there is a 55-day lag between the appointment date and the posting of data on the web-based reporting site. Reports are produced quarterly. Although information is available by the Military Service branch that is financially responsible for the MTF, only an aggregate MHS score is shown. Performance Results for FY 2004. Satisfaction with Telephone Access is showing a slight decline for the year. While the score remains fairly high overall, the system will not meet the goal for the year. As DoD transitions to the new TRICARE contracts, the appointment process is also in a state of transition. Appointment scheduling responsibility is moving back to the Military Treatment Facilities (MTFs), Hospitals/Clinics, from the Managed Care Support Contractors. In the long run, this should be an improvement for management of the appointments, but it may cause some problems in the short term. Historically, there has been a problem in trying to identify the problem with access to health care appointments at the MTFs, with two different organizations controlling different parts of the process. With the conversion to full MTF management of the appointment process, it will be easier to identify where problems may exist, so that improvement programs can be instituted if needed. During the migration to new contracts, it is anticipated that satisfaction may initially decrease, but should rebound within a year. All TRICARE regions will be converted by November 1st, 2004. Since data currently available does not yet contain the survey results for the first conversion period, the impact cannot be determined.

DoD Performance and Accountability Report 62 Part 2: Performance Information
Performance Metric: Overall Satisfaction with Appointment
Metric FY 2001 Actual
FY 2002 Actual
FY 2003 Actual
FY 2004 Target/ Actual a
Overall satisfaction with appointment
88.5% 87.1% 88.4% >90%/ 87.6%
a The data provided in the FY 2004 column are estimated results for the 3rd quarter.
Metric Description. This metric looks at beneficiaries’ overall satisfaction with their outpatient medical appointments at a Military Treatment Facility (MTF)—hospital or clinic—during the month. Overall satisfaction with the appointment is affected by numerous factors during the visit including the experience of getting an appointment, the wait time at the appointment, the interaction with the provider, and interactions with the pharmacy or ancillary services. This metric is based on a monthly customer satisfaction survey for those individuals who had an outpatient medical visit at an MTF during the previous month.3 The metric is based on Question 12 of the customer satisfaction survey:4
All things considered, how satisfied were you with the (name of clinic) during this visit?
The percentage of respondents (weighted by appropriate sampling weights) who answer “Good,” “Very Good,” or “Excellent,” on a scale from “Poor” to “Excellent,” is computed. The survey is fielded monthly. Because of the fielding period, data collection period, and analysis period, there is a 55-day lag between the appointment date and the posting of data on the web-based reporting site. Results are based on the summation of results for all surveys completed by patients during the year. Although information is available by the Military Service branch that is financially responsible for the MTF, only an aggregate Military Health System (MHS) score is shown.
3 The same survey is used for a metric that tracks satisfaction with access. However, that metric looks at responses to different survey questions and uses scores from only TRICARE PRIME enrollees rather than from all beneficiaries who visited an MTF. 4 Other questions in the survey are used to identify specific areas for improvement.
Performance Results for FY 2004. The objective for this fiscal year was to achieve even higher levels of performance; however the current score surpasses the historical civilian benchmark for this survey. In an effort to improve overall performance on this measure, the Army instituted a provider-level survey program that focuses on individual providers in an attempt to improve the overall score. Since the year is not complete, the full impact of this approach is still unknown. However, preliminary information has not shown significant improvement. A further review of the survey results shows that while satisfaction remains high for retirees and their family members, satisfaction for active duty members and their families is not as high. The survey shows that some of this is attributable to age differences; older individuals tend to be more satisfied than younger individuals. But even considering age differences, the satisfaction level of active duty family members is largely unchanged from FY 2003 to FY 2004. However, there has been a decrease in satisfaction for active duty members themselves. While the data set does not allow for a more detailed review between active duty personnel and Reservists called up in support of Operation Iraqi Freedom, the timeframe does match.
Outcome Goal: Maintain Reasonable Force Costs. It is prudent to carefully watch the cost of day-to-activities—those that take place whether America is at war or not. Recruiting, training, pay, and medical costs are examples. This outcome goal has ten metrics to help the Department manage them. Performance Metric: Cost of Basic Training
Cost Indicator (Constant FY 2004 $)
FY 2001 Actual
FY 2002 Actual
FY 2003Actual
FY 2004 Actuala
Cost of basic training per enlisted recruit $7,393 $8,250 $9,132 $11,462
a The FY 2004 are as of the 3rd quarter (final)

DoD Performance and Accountability Report 63 Part 2: Performance Information
Metric Description. Basic training is the fundamental introductory and indoctrination training provided to enlisted entrants. Each Service has different training pipelines that take different lengths of time to complete. The cost of basic training is a management cost indicator – performance/production targets are accession-driven and vary by Service and year. Funding requirements are projected by fiscal year in the Department’s Future Years Defense Program (via Program Element 804711); this projection includes manpower, support equipment, facilities, and all other costs associated with indoctrinating recruits into military culture, raising their standards of physical conditioning, and instructing them in basic military skills. (Basic training costs do not include expenses associated with initial skills training; initial skills training follows basic training, and its duration and costs vary with each military specialty.)
Performance Results for FY 2004. The basic training cost trend continues to increase by approximately 10 percent per year. Although basic training costs for the Navy, Air Force, and Marines have remained steady for the past several years, the Army’s costs have risen dramatically due to mobilization and deployment of large numbers of Army Reserve and National Guard soldiers for Operations Enduring Freedom and Iraqi Freedom. This has required expansion of the training base and its infrastructure. Construction of training barracks in Afghanistan and Iraq have also added to higher costs but they may be removed from FY 2005 training budget data to better represent the cost to train recruits domestically. The overall increase in Army costs was not entirely due to these factors, however. The increased costs per recruit also reflect the higher costs for TRICARE-FOR-LIFE health care accrual. When coupled with fewer new recruits (accessions), the cost per recruit rises. Without these costs, the Army’s cost per recruit would drop to a more reasonable figure. During the past year, the Department has begun to address anomalies that had existed in the data reporting, thus increasing the integrity of the reporting.
Cost Indicator – Enlisted Training Costs Enlisted Accession Costs (in 2004 Constant Dollars)
FY 2001 Actual
FY 2002 Actual
FY 2003 Actual
FY 2004 Estimate
Total Recruit Training Costs
$1,612M $1,842M $1,932M $2,336M
Army $481 $547 $565 $1,066
Navy $445 $490 $551 $522
Marine Corps $472 $453 $542 $500
Air Force $214 $352 $274 $248
Basic Training Input (non-prior enlistees)
218,084 219,998 211,543 203,855
Army 86,866 87,405 86,046 78,333
Navy 53,976 46,547 43,919 43,200
Marine Corps 36,600 39,999 37,363 35,822
Air Force 40,642 46,047 44,215 46,000
Average cost per recruit trainee
$7,393 $8,250 $9,132 $11,462
Army $5,533 $6,260 $6,566 $13,529
Navy $8,247 $10,520 $12,543 $12,081
Marine Corps $12,905 $11,326 $14,493 $13,972
Air Force $5,270 $7,062 $6,204 $5,383
Performance Metric: Cost Per Enlisted Recruit - Active Component
Cost Indicator
(Constant FY 2004 $)
FY 2000 Actual
FY 2001 Actual
FY 2002 Actual
FY 2003 Actualb
Cost-per-Recruit $11,890a $13,288a $14,030a $14,206 a Methodology and data updated from the FY 2003 performance report. b The FY 2003 data are as of the 4th quarter (final).
Metric Description. The metric is a lagged performance indicator designed to analyze costs and trends over time, not set specific annual performance targets. Each year, the Department enlists about 200,000 new recruits for the Active components. These new Service members provide us with the entry-level manning necessary to meet manning and readiness needs. The cost of recruiting is calculated by dividing a Service’s total number of accessions

DoD Performance and Accountability Report 64 Part 2: Performance Information
(non-prior service + prior service ) into the total expenditures for enlisted recruiting. These resources are made up of recruiting personnel compensation, enlistment bonuses, college funds, advertising, communications, recruiting support (vehicles, equipment, computers, supplies and applicant’s transportation, food and lodging, etc.), and other appropriations resources within the recruiting command/service (i.e., other procurement and research, development, technology and experiment funding).
Performance Results for FY 2003. As stated earlier, this is a macro-level performance indicator that is used in the analysis of Service programs. Recruiting costs are driven by a host of external variables, such as the state of the economy, unemployment, youth propensity to serve, the posture of the delayed-entry program, etc. Although cost-per-recruit increased annually through FY 2002, it has stabilized at about the 2002 level through the FY 2005 President’s Budget.
Performance Metric: Cost Per Enlisted Recruit – Reserve Component
Cost Indicator
(Constant FY 2004 $) FY 2000 Actual
FY 2001 Actual
FY 2002Actual
FY 2003Actualb
Cost-per-Recruit – Reserve $6,185a $6,886a $6,473a $7,585
a Methodology and data updated from the FY 2003 performance report. b The FY 2003 data are as of the 4th quarter.
Metric Description. The lagged metric is designed as an indicator to analyze costs and trends over time, not to set annual targets for performance. Each year, the Department enlists about 200,000 new recruits for the Active components and about 160,000 for the Reserve components. These new Service members provide us with the entry level manning necessary to meet manning and readiness needs. The cost of recruiting is calculated by dividing a Service’s total number of accessions (non-prior service + prior service) into the total expenditures for enlisted recruiting. These resources are made up of recruiting personnel compensation, enlistment bonuses, college funds, advertising, communications, recruiting support (vehicles, equipment, computers, supplies and applicant’s transportation, food and lodging, etc.), and other appropriations resources within the recruiting command/service (i.e., other procurement
and research, development, technology, and experiment funding). Performance Results for FY 2003. This macro-level indicator is used in the analysis of Service programs. Recruiting costs are driven by a host of external variables, such as the state of the economy, unemployment, youth propensity to serve. Costs have risen steadily over the past years, but appear to be leveling in the current budget.
Performance Metric: Military Personnel Costs – Enlisted Pay Gap
Metric FY 2001Actual
FY 2002 Actual
FY 2003Actual
FY 2004Actualb
Percentage of enlisted pay gap closed a
23% 47% 61% 71%
Percentage of remaining gap closed (annually)
N/A 31% 25% 26%
a Relative to FY 2000 baseline b The FY 2004 data are as of the 4th quarter (final).
Metric Description. The goal of military compensation is to provide sufficient military manpower to provide for the national defense. To achieve this end, military compensation must be competitive. The 9th Quadrennial Review of Military Compensation (QRMC) has determined that military pay that matches the 70th percentile of pay earned by comparably experienced civilian workers is an appropriate short-run measure for assessing whether military pay is competitive with civilian compensation. In the past, whenever military compensation was significantly less than the 70th percentile as compared to civilian pay, recruiting and retention problems arose. It is generally very costly, both in terms of dollars and experience mix, to correct recruiting and retention shortfalls after they have appeared. This metric tracks the percentage of the pay gap closed, since FY 2000, between military pay and the comparable 70th percentile for civilian counterparts. For officers, the appropriate comparison group is civilians with college degrees and advanced degrees in managerial and professional occupations. The FY 2000 pay gap for officers was eliminated in FY 2002 through a combination of targeted pay increases, across-the-board raises that exceed the average increase in the private sector, and general

DoD Performance and Accountability Report 65 Part 2: Performance Information
increases in allowances.
Measurement of the enlisted pay gap is based on civilian pay by education and years of experience and enlisted pay by pay-grade and years of service. There still is a measurable pay gap today for enlisted service members. Therefore, our goal is to close at least 25 percent of the remaining gap annually until the gap is eliminated. After the gap is closed, the goal is to ensure military pay remains commensurate with the 70th percentile of comparable civilians. Ratings for this metric will be assigned based on the percentage of the enlisted pay gap closed each year. If at least 25 percent of the remaining gap is closed, the result will be rated “Green.” If at least 15 percent but not 25 percent is closed, the result will be rated as “Yellow.” If the result is less than 15 percent of the remaining gap is closed, the rating will be “Red.” Although a good leading indicator of recruiting or retention trends, this metric alone is not sufficient to gauge the overall efficiency or effectiveness of the military personnel compensation program. Consequently, the Department is also working on monitoring change in total military personnel costs (in current and constant dollars), the probability an enlisted member will remain in service until 15 years, and the average experience at promotion for grades affected by the pay gap. Performance Results for FY 2004. Military members received an average pay raise of 4.15 percent for FY 2004. The average civilian wage as measured by the Employment Cost Index (Private Industry Wages and Salaries) for this period was 3.2 percent. Mid-career enlisted members received wage increases of 3.7 percent to 6.25 percent. The Basic Allowance for Housing, an important component of Regular Military Compensation, increased by 7 percent for FY 2004. The combination of basic pay and basic allowance for housing increased relative to civilian wages and salaries. As a result, the percentage of the pay gap closed from 61 percent to 71 percent. The Department achieved its goal of closing 25 percent of the remaining gap in FY 2004.
Performance Metric: Community Quality of Life Per Capita Metric
Metric (Current $000)
FY 2001Actual
FY 2002 Actual
FY 2003 Actual
FY 2004 Target/Actual
(Budget) a
Community Quality of Life Per Capita Cost Metric
Army $1,125 $1,180 $1,539 $1,559/1370
(-$189)
Navy $1,121 $1,269 $1,391 $1,409/1357
(-$52)
USMC $812 $940 $1,018 $1,031/983
(-$48)
Air Force $1,507 $1,580 $1,642 $1,663/1718
(+$55) a The FY 2004 data are preliminary.
Metric Description. Quality of Life (QoL) per capita is the third of three metrics that, combined with the QoL Social Compact Improvement and the Commitment to Military Life indices, measures the health of QoL programs and services supporting military members and families. This metric also responds to the National Security Presidential Directive–2 (February 01), “Improving Quality of Life,” and is in line with the Secretary of Defense guidance to track QoL improvements and give priority to the implementation of QoL initiatives.
The QoL per capita metric will help us monitor trends in the Department’s QoL funding investment per active duty member over time. The Department also will track individual Service progress towards sustaining or improving funding for critical QoL support.
The metric will calculate per capita cost using financial data submitted annually by the Services and annual active duty end strength data. The majority of funding to support Service QoL activities is identified in specific budget and program exhibits submitted to the Office of the Secretary of Defense on an annual basis. The metric will correlate active duty end strength with Service direct operation and maintenance funding for the following programs: morale, welfare and recreation; child care; family centers; voluntary education and tuition assistance; and youth programs.
Performance Results for FY 2004. FY 2004 performance reflects preliminary data based on budget estimates in the 2005 President’s budget. The budget estimate reveals a decline in per capita

DoD Performance and Accountability Report 66 Part 2: Performance Information
funding for Army, Navy, and Marine Corps QoL programs in FY 2004. The Department is concerned about these planned reductions and will monitor these programs for potential impact on the support provided to troops and their families. FY 2004 actuals will be available in the FY 2006 President’s Budget, which will be submitted to Congress in February 2005.
QoL per capita will become the benchmark for QoL investments as the global basing profile changes. The goal is to keep standards high even as the Department closes, realigns, and relocates installations and units to better fit the global defense mission. QoL per capita is a macro-level indicator that must be analyzed in conjunction with the QoL-Social-Compact-Improvement-Index and the Commitment-to-Military-Life-Index to gain insight into the best ways to support and take care of Service members and their families.
Performance Metric: Medical Cost per Enrollee per Month Metric (Current
$000) FY 2000 Actual
FY 2001 Actual
FY 2002 Actual b
FY 2003 Target c/Actuald
Medical cost per enrollee per Month
$152 N/A / $170
Percentage change
No historical data: new metric.a
N/A
(First Year Data
Reported)
N/A / 11%
a Data used to calculate this metric were not available in FY 1999 or 2000. Additionally, since the metric is based on rolling 12-month expenses from the Medical Treatment Facilities, FY 2002 was the first year when data could be reported. b FY 2002 data have been updated to reflect additional purchased care claims and improper allocation of pharmacy expenses in the calculation. c This is a new metric as of FY 2004; thus, no goal was established for FY 2003. d The FY 2003 data are estimated as of the 4th quarter.
Metric Description. This lagged metric looks at how well the Military Health System manages the care for those individuals who have chosen to enroll in a Health Maintenance Organization (HMO)-type of benefit. It is designed to capture aspects of three major management issues: (1) how efficiently the Military Treatment Facility (MTF) is providing care; (2) how efficiently the MTF is managing the demand of its enrollees; and (3) how well the MTF is determining which care should be provided inside the facility versus that purchased from a managed care support contractor.
The measure is constructed based on the workload consumed by the enrollees for any individual month. For each enrollment location, workload is accumulated for each enrollee, and priced out according to care provided in MTFs, claims paid for purchased care, and mail-order pharmacy.
This aggregate measure helps us monitor how well the MHS is managing the care for TRICARE Prime enrollees. It looks at all Prime enrollees, whether at the MTF or with the health support services contractors. The overall measure can be broken into multiple components that allow for review of utilization factors for both direct care and purchased care, and unit cost information for direct care and purchased care. By reviewing this information, MTFs are able to determine the cost of providing care at the MTF, and how many times the enrollee is receiving care. For an efficient Military Health System, the cost per unit needs to be at or below the cost of purchasing the care, and the utilization of services by the enrollees must be controlled. While the top-level measure is used to track overall performance; detailed measures allow for review and management at the local level.
Due to claims processing times, purchased care workload is projected to completion six months after the fiscal year ends; final results will not be available for approximately three years. Purchased care workload does not allocate care delivered overseas to hospital or clinic areas. Therefore overseas workload is excluded. To ensure consistency across program years, purchased care excludes all resource sharing, continued health care benefit plan, and TRICARE-for-Life purchased care workload. Since data will not be available until six months after fiscal year end, this will be a lagging indicator.
Performance Results for FY 2003. Since this was a new metric established during FY 2003, there was no goal for FY 2003 performance. However, when comparing the 11 percent increase in the MHS medical cost per enrollee to the Kaiser Family Foundation health benefits increase of 13.9 percent, one sees slightly better performance for the Military Health System. Without a performance goal for FY 2003, the results become the baseline for further review with FY 2004 performance where issues regarding unit cost, utilization management, and purchased care management will need to be reviewed.

DoD Performance and Accountability Report 67 Part 2: Performance Information
The current method does not adjust for the various expected health care expenditures for different populations, and the methodology will likely be changed in the future. Since enrollment demographics can vary significantly by Service, and across time, it is important to adjust the measure. For example, as more older individuals enroll, the overall average medical expense per enrollee would likely increase. On the other hand, if relatively more young, healthy active duty personnel are enrolled, the overall average medical expense per enrollee would likely decrease. Through the use of adjustment factors, a comparison across Services and across time can be made more meaningful.
Performance Metric: TRICARE Prime Outpatient Market Share
Metric FY 2001 Actual
FY 2002 Actual
FY 2003 Target/Actual
TRICARE Prime outpatient market share (MTF Enrolled)
84.4% 81.0% N/A a/75.1% b
a This is a new performance measure. b Data are estimated as of the 4th quarter.
Metric Description. Outpatient encounters represent the majority of contacts between the Military Health System (MHS) and its beneficiaries. Accordingly, the market-share metric—a lagging indicator—looks at how much of the care is delivered in the direct system rather than being purchased. There is a large fixed manpower cost related to maintaining the medical readiness mission. Therefore it is vital for proper program management to use resources efficiently and effectively during peacetime operations. Thus, the goal is to have Military Treatment Facilities (MTFs) achieve the targets established in their business plans for each year. Although medical care can be purchased at numerous locations throughout the United States and in overseas locations, the focus of this measure is on enrollees in the United States. Overseas activities are currently excluded from the measure since purchased care data is not available in sufficient detail. Due to the extensive medical capabilities of hospitals compared with ambulatory clinics, the market-share percentage will vary by MTF and military Service.
Over the past couple of years, the downsizing of small hospitals into ambulatory care clinics has affected the clinical capabilities of these facilities, and market share has decreased. This reduction is expected to continue for the next couple of years until the direct-care system stabilizes.
Market-share percentages for the Services are shown based on direct-care workload compared to total purchased-care plus direct-care workload for MTF TRICARE Prime enrollees. This metric will be based on relative value units (RVUs)5 to more accurately compare the relative complexity of care instead of just a visit count.
Like the previous metric, purchased-care workload is projected to completion six months after the fiscal year ends, and final results will not be available for approximately three years. Overseas workload is also excluded here. To ensure consistency across the program years, purchased care excludes all resource sharing, continued health care benefit plan, and TRICARE-for-Life purchased-care workload. Since data will not be available until six months after fiscal year end, this will also be a lagging indicator.
To compensate for factors that cannot be controlled under current program rules, the metric was changed in FY 2004 to focus just on the Medical Treatment Facility TRICARE Prime enrollees. Rules under the TRICARE Prime enrollee program provide more oversight for the MTF in managing the overall health and utilization of this population. During FY 2003, each MTF provided a business plan indicating how much care their enrollees would demand from both direct care and purchased care. This information will be used to set the goal for the FY 2004 TRICARE Prime outpatient market-share metric.
Performance Results for FY 2003. As indicated previously, this metric has been updated for FY 2004 to focus specifically on the TRICARE Prime market. The previous metric targets were:
Metric FY 2001 Actual
FY 2002 Actual
FY 2003 Target/Actual
Outpatient market share (Enrolled and Non-enrolled)
77% 74% >74% / 71%
Direct-care workload in FY 2003 represented only 71 percent of total ambulatory workload for areas surrounding MTFs. While there was some decrease 5 Developed by the Centers for Medicare and Medicaid Services, RVUs approximate the physician resources used during the visit. For example, a returning visit by a patient with a simple problem might be 0.17 RVUs, whereas arthroscopic surgery of the knee might be 16.00 RVUs.

DoD Performance and Accountability Report 68 Part 2: Performance Information
in workload at the MTFs, the most significant reason for the change in market share was related to increases in purchased care. This was due to (1) increases in overall utilization by eligible beneficiaries; (2) the call up of Reserve component members and the addition of their family members to the beneficiary population; and (3) the deployment of MTF specialists to Operation Iraqi Freedom.
With the increased cost of health care benefits in the private sector, the rich benefit offered by the Military Health System attracted more unique users who never used the benefit in the past. A number of those individuals dropped their other health insurance. Due to the limited expansion capabilities of the MTFs, these two factors added to the increase in purchased care during the year.
Additionally, due to the current operations, DoD experienced a change in available providers and a significant increase in Reserve component beneficiaries, including Reserve component family members. These family members are not traditional users of the Military Health System, and the majority of their care is purchased care. The influx of Reserve component users was not anticipated when the performance target for FY 2003 was established.
Performance Results for FY 2004. This is a lagging indicator. Final analysis of the FY 2004 results will be completed by the next reporting cycle.
Performance Metric: Primary Care Provider Productivity
Metric FY 2001 Actual
FY 2002 Actual
FY 2003 Actual
FY 2004 Target/Actualb
Relative Value Units (RVUs) per primary care provider per day
13.6 13.8 a 14.0 >14.5 / 14.1
a FY 2002 has been updated to a final number from the 13.6 estimate reported in the 2003 Annual Defense Report. b The FY 2004 data are estimated as of the 3rd quarter.
Metric Description. To run a premier Health Maintenance Organization (HMO), the critical focus area is primary care. The primary care provider frequently is the first medical interaction between the beneficiary and the HMO. In this role, the primary care provider is responsible for the majority of preventive care to keep beneficiaries healthy and away from more costly specialty care. While the HMO has a goal to reduce the overall number of
encounters per beneficiary, an additional goal is to ensure that the dollars spent on medical care are used efficiently. The targets for this metric represent stretch goals that were instituted to move the organization forward, but likely will not be achieved in FY 2003 or FY 2004. This metric looks at the complexity of care and the number of patients seen by the primary care providers each day, with a goal of increasing the complexity, number, or both, of patients seen each day by the provider.
Like the previous metric, this one also uses relative value units (RVU) to measure the complexity of care to approximate physician resources used during a visit.
Due to the nature of its reporting, the metric results will lag actual performance by one quarter.
Performance Results for FY 2004. Improvements in productivity have continued in FY 2004, but the system is not expected to meet the “stretch” goal of 14.5 RVUs. Currently two of the three Services are at or approaching the goal for the year. The goal is more aggressive than the historical trend. The desire is to move the organization forward in a manner that requires dramatic improvements to the system.
Even with the possibility that two of the Services may reach their individual goals, there are a number of issues that cause problems when interpreting the results. First, there has been an emphasis to improve medical coding and to enforce medical coding guidelines that have resulted in a 6 percent decrease in the average level of complexity being reporting in the medical record. That drives down the RVUs used in the numerator of the metric.
Additionally, as part of the effort to improve coding and overall operations at an MTF, a new clinical information system began deployment during the year. Part of the reason for adjusting the goal at the beginning of the year was the expectation that this would have a small impact on the performance related to physician training and implementation. However, the impact appears to be much larger than expected. Concerns with the performance of the system have placed a temporary hold on future deployments and the full impact is not known.
Since these factors can have a significant impact on the overall performance, the fact that two of the three Services are approaching their goals represents a positive improvement in performance. The aggressive nature of the goals will likely result in performance below the goal level, but the

DoD Performance and Accountability Report 69 Part 2: Performance Information
Department expects performance to continue to improve.
Performance Metric: Civilian Force Costs
Civilian force costs
(Current Year $000)
FY 2001 Actual b
FY 2002 Actual c
FY 2003 Actuale
FY 2004 Projected f
Total a
Basic pay
Premium pay d
Overtime pay
Holiday pay
Other pay
Benefit pay
Separation pay
42,258,733
31,887,999
1,985,502
—
—
—
8,066,742
318,490
44,867,328
33,376,576
—
1,173,810
53,772
1,119,919
8,822,937
320,049
47,227,585
34,947,575
—
1,215,873
46,787
1,105,238
9,501,778
410,333
48,803,246
36,532,535
—
834,760
46,052
1,146,133
10,010,975
232,790
a Totals may not add due to rounding.
b FY 2001 data are from DoD component summary of President’s Budget FY 2003. c FY 2002 data are from FY 2004 President’s Budget. d Premium pay includes overtime pay, holiday pay, and other pay. It was reported only as an aggregate number in FY 2001. e FY 2003 through FY 2005 data are from FY 2005 President’s Budget, OP 08 Exhibit.
f FY 2004 is projected based on FY 2005 President’s Budget, OP 08 Exhibit (February 2004), and represents actual results as of the 2nd quarter.
Metric Description. In the past, civilian force costs reflected those reported annually to the Office of Personnel Management (OPM) in the 1351 Report, “Work Years and Personnel Costs.” However, this resource is not timely. Currently, OPM has FY 2001 costs available to its users, and FY 2002 is still being analyzed and not yet available. No call has been made for FY 2003 data. Beginning in FY 2004, DoD sought a more useful alternative and determined that the OP 08 Exhibit of the President’s Budget provided a better source of current and projected workforce cost data. Consequently, beginning in FY 2002, premium pay costs are presented with more specificity in these categories: overtime, holiday, and other pay.
Although this metric provides only a broad overview of civilian compensation costs, it may become a baseline for evaluating National Security Personnel System (NSPS) costs. However, it is not an effective measure of the success of any individual personnel program or benefit. For example, additional benefit costs do not indicate successful use of recruitment or retention incentives. Furthermore, increased recruitment bonus or retention allowance payments would only measure usage rates, not the change in
recruitment or retention based on payment of the incentive.
The metric monitors trends in the following pay categories:
• Basic pay (Office of Management and Budget (OMB) Object Classes 11.1 and 11.3) represents the aggregate personnel compensation for full-time permanent, full-time temporary, and part-time/intermittent appointments.
• Premium pay (OMB Object Class 11.5) represents personnel compensation for: overtime, holiday, Sunday, night differential, hazardous duty, post differential, staffing differential, supervisory differential, physicians comparability allowance, remote work site allowance, cash awards, and other.
• Benefit pay (OMB Object Class 12.1) represents personnel compensation for: health insurance, life insurance, retirement, social security, workers' compensation, uniform allowances, overseas allowances, non-foreign cost-of-living allowance (COLA), retention allowance, recruitment bonus, relocation bonus, and other.
• Separation pay (OMB Object Class 13.0) represents personnel compensation to involuntarily separated employees and payments made through the $25,000 voluntary separation incentive pay program (e.g., buyout bonuses).
Performance Results for FY 2004. In FY 2004, DoD changed the source of our civilian cost trend data to increase the timeliness of reporting. The Department also is displaying workforce costs in “constant dollars” to more clearly define trends in compensation. Currently, the trend is relatively a flat line. Full-Time Equivalent work years were added to the metric in order to tie dollars and work years together for a more complete representation, i.e. civilian force cost per Full-Time Equivalent work-year.

DoD Performance and Accountability Report 70 Part 2: Performance Information
Activity Metric: Total Costs for Contractor Support
End-state Metric FY 2001 FY 2002 FY 2003 FY 2004 a
Trend data showing the percentage increase or decrease in costs associated with contract support
No historical data: new metric
Army assigned pilot program to contractor manpower and costs
Implement pilot program within Army.
a The FY 2004 data are preliminary.
Metric Description. The contractor workforce is important to accomplishing the Department’s mission. Contractor costs will grow as DoD continues its efforts to balance personnel investments by outsourcing non-core functions, allowing us to return military manpower to operational tasks that can only be performed by a trained soldier, sailor, airman, or Marine. The purpose of the contract support cost indicator is to provide visibility into the total funding burden of contracted personnel across the Department. To do this, we must find ways to capture data about the contracted work performed, the associated costs, and the unit supported. This information is needed to satisfy fiscal accountability standards as well to help us discover where our contractor investments overlap, allowing us to propose alternative solutions, as needed. Unfortunately, our existing financial and procurement systems do not capture contractor workforce data such as direct labor hours, direct labor costs, and the unit supported. Thus, we are working to establish a systematic method to capture this data across DoD; the final cost indicator will allow us to monitor the trends in contracted direct labor costs for all military Services. Ongoing Research. In summer 2002, the Department approved an Army pilot program to capture contractor manpower and associated costs. The Army is testing a Contractor Manpower Reporting Application, documenting lessons learned, and developing a proposal for DoD-wide use.
Timeline for Completion. The Army Pilot program is scheduled for completion in September 2006. Likewise, a DoD-wide version of the program is completing its final steps with implementation expected by 2008.
Performance Results for FY 2004. At the time of writing, the Army was awaiting Secretary of the Army approval to issue and implement guidance to the field.

DoD Performance and Accountability Report 71 Part 2: Performance Information
Outcome Goal: Shape the Force of the Future. America needs a force trained and ready to meet future asymmetric threats and international challenges. We know that status quo personnel policies won’t suffice, so we will need modern personnel systems, and better ways to use the Reserve component. The eight metrics described here, which include discussions of the Civilian and Military Human Resource Strategic Plans, provide ways to ensure DoD shapes itself to effectively meet future challenges.
Activity Metric: Active Component/Reserve Component Force Mix
End-state Metric
FY 2001
FY 2002 FY 2003 FY 2004a
Benchmark of the proper balance between Active and Reserve Component Forces
No historical data: new
metric
Identified force rebalancing requirements
Identified areas of stress on the force
Identified areas which can be civilianized
a The FY 2004 data are final.
Metric Description. The FY 2001 Quadrennial Defense Review directed a comprehensive study of the proper mix of Active and Reserve component (AC/RC) forces. That study was completed in December 2002. It concluded we could enhance overall military capability by rebalancing both AC/RC force mix and mission assignments. The purpose of this rebalancing is to create a structure which uses the Reserve component more effectively. Some initiatives in support of rebalancing will likely require legislative changes and take several years to implement.
Ongoing Research. A variety of initiatives are underway. A study of the stress on the Reserve component forces examined all specialties mobilized for current operations (Operations Noble
Eagle/Enduring Freedom/Iraqi Freedom) and comparing the data against previous operations (Desert Shield/Desert Storm) and recent Presidential Reserve Call-ups (Bosnia, Kosovo, Southwest Asia). The study measured stress using three factors: frequency of call-ups; duration of call-ups; and percentage of inventory used (i.e., how much of the force capability was employed). The results of this study helped us better balance the Army’s AC/RC capabilities mix in the FY 2005 budget. We also identified over 100,000 positions that could be realigned to reduce the need for involuntary Reserve component mobilization and relieve the stress on high-demand Reserve component capabilities.
We also are exploring other alternatives to mitigate stress on the force. Some of these alternatives will require legislative or policy changes to implement. For example, we are pursuing the concept of “reachback.” Reachback is defined as the ability to connect electronically to sites in the Continental United States or other locations around the world to accomplish essential tasks and missions in an effort to reduce the number of forward-deployed personnel needed to support combat troops during an operation.
We are looking beyond near-term efficiencies to address stress on the force. We are planning to put in place better global force management and Reserve component mobilization processes, new technologies, and more modular units to underpin the force’s transformation. These actions will not only relieve stress on the force today, but will have long lasting, positive impacts on our ability to manage peak demands on our military in the future.
Other working groups are exploring ways to streamline processes and policies, such as the mobilization process and force management policies, which might also mitigate stress on the force. Successes here may reduce the need for certain force rebalancing actions.
Finally, the Secretary of Defense identified 148 “Stress on the Force” actions to be addressed by future action plans and metrics.
Timeline for Completion. Our timeline for completing this metric has been adjusted to December 2004 to allow for the many ongoing actions to mature. We are also in the process of identifying up to 300,000 military positions for possible “civilianization.”
Performance Results for FY 2004. During FY 2004, more detailed and frequent “stress on the force” analyses have been conducted, with enhanced

DoD Performance and Accountability Report 72 Part 2: Performance Information
data accuracy. They have provided insight into those areas where force rebalancing is necessary. Supported by these “stress” analyses, up to 30,000 military billets will have been restructured by the end of FY 2004. Up to 10,000 military infrastructure positions will have been identified for civilianization by the end of FY 2004. Legislative proposals to reduce stress on the force through enhanced volunteerism have been submitted in the Department’s FY 2005 Omnibus bill.
Performance Metric: Military Human Resource Strategic Plan
Metric FY 2001 Actual
FY 2002 Actual
FY 2003 Actual
FY 2004 Target/Actuala
Percentage of scheduled tasks completed
No historical data: new
metric
1 7 80%b/100%
a FY 2004 data are as of the 4th quarter (estimate). b In 2002, 25 funded or in-house studies were programmed to be completed by the end of FY 2005. However, in 2003, this metric was changed to be consistent with the Civilian Human Resource Strategic Plan metric. Beginning with FY 2004, the measure is the percentage of tasks (funded or in-house) scheduled for completion that we completed during the fiscal year.
Metric Description. This metric compares the number of tasks scheduled for completion under the Military Human Resources Plan with those actually completed. If 80 percent of tasks are completed, the result is considered “on track” for achieving plan goals. Beginning in FY 2004, the percentage target will be calculated by dividing the number of projects completed in a fiscal year by the number scheduled to be completed that fiscal year. As described below, tasks are removed from the plan as they are completed. The Military Human Resources Strategic Plan has six main goals:
• Increase the willingness of the American public to recommend military service to our youth.
• Recruit the right number of quality people. • Develop, sustain, and retain the force. • Seamlessly transition members to and from
Active and Reserve status. • Develop a flexible, integrated human
resources management information system. • Sustain continuous human resource process
improvement.
Each goal has subordinate objectives and actions. The plan is a living document, so the number of tasks varies from year to year. As studies of new ideas or proposals are completed, one of four actions is taken: the idea is abandoned (typically because it is ineffective or inefficient); legislation is requested to implement the idea; the idea is implemented and applicable metrics established; or the idea is scheduled for further study. A task that resulted in a decision for action is considered completed, and removed from the plan. New ideas also are added to the document. In FY 2002, the plan contained a total of 40 tasks. Currently, there are 30 resourced tasks associated with the six goals in the plan. Of these tasks, 7 are on-going actions, 7 were completed in FY 2003; 16 tasks are scheduled for completion in FY 2004 or FY 2005. This plan establishes priorities for the next several years:
• Accessing enlisted personnel with the right level of education and aptitude.
• Ensuring the force is manned with the right number of military members in the appropriate skills.
• Implementing a two-year pilot program, putting into place an “up-and-stay” promotion process for certain high-investment specialties.
Performance Results for FY 2004. We expect to achieve 100 percent of our goal by completing all 10 scheduled tasks; one task previously scheduled for FY 2004 was expanded in scope and extended until FY 2005. In addition, we used in-house resources to develop a set of leading indicators the Department can use to predict recruiting and retention problems.

DoD Performance and Accountability Report 73 Part 2: Performance Information
Activity Metric: Implement New Reserve Component Management Paradigm
End-state Metric
FY 2001
FY 2002 FY 2003 FY 2004a
A new baseline for managing Reserve Component forces
No historical data: new metric
Established goals such as promoting volunteerism and reachback capabilities.
Employed five initiatives geared to support creating a seamless flow between Active and Reserve Components.
Introduced legislative proposals.
Introduced linguist program.
a The FY 2004 data are final.
Metric Description. The FY 2001 Quadrennial Defense Review directed a comprehensive review of the use of Reserve component forces. That study, completed in December 2002, proposed a concept called “continuum of service.” Under this concept, a Reservist who normally trains 38 days a year could volunteer to move to full-time service for a period of time – or some increased level of service between full-time and his or her normal Reserve component commitment, without abandoning civilian life. Similarly, an active duty Service member could request transfer into the Reserve component for a period of time, or some status in between, without jeopardizing his or her full-time career and opportunity for promotion. Military retirees with hard-to-find skills could return on a flexible basis and create opportunities for others with specialized skills to serve. The purpose of the new management paradigm is to create a comprehensive management system that will better facilitate flow between Active and Reserve component service, and enhance Reserve component usage. Some of the initiatives in the study recommended will require legislative, policy, or regulatory changes and, therefore, will take several years to implement. Ongoing Research. Our efforts are geared to support: (1) creating a seamless flow between Active and Reserve components forces; (2) encouraging volunteerism and establishing new affiliation programs; (3) simplifying rules for accessing, employing, and separating Reserve component personnel; (4) increasing flexibility of the Reserve component compensation system; and (5) enhancing
combined Active and Reserve component career development. We have not settled on a means for measuring the success of this new paradigm. Possible metrics are: (1) number of approved tasks completed (on time) compared with the number of approved tasks; (2) percentage of legislative proposals approved; and (3) number of force management initiatives identified by each Service to better integrate and remove barriers compared with the number approved.
However, at this time, these do not appear to provide valid evaluation tools for effectively measuring the efforts undertaken to implement the continuum of service concept. Efforts to determine valid, useful performance measures will continue as we move forward with these multiple initiatives.
Timeline For Completion. Undetermined at this time because specific measures have not yet been developed.
Performance Results for FY 2004. During FY2004 we established the Army’s 09L (Arabic linguist/translator) program. Two hundred three individuals have been recruited into the program; 102 of them have been sent to training; 52 have completed (or are in) training. Approximately 25 members have graduated and have been deployed to Iraq or Afghanistan.
The civilian employer information requirement has met legal requirements and is now on-line. The system allows for direct input by the Reserve component member. Data collection is in its initial stages.
Certain Service-specific programs have been initiated, such as the Air Force’s additional blended/associated units; Air Force-sponsored Reserve component base operations and support; the Army’s “stressed” career fields initiative; the Navy’s Sea Warrior program; and the Marine Corps’ increased use of volunteers.
The Department has submitted a series of FY 2005 legislative proposals in its Omnibus Bill to enhance Reserve component use, promote volunteerism, and provide flexibility in management.
Overall, there has been significant activity in this area, but we have not yet determined how to measure progress since we have not yet determined the optimum outcome required for long-term, high-level performance.

DoD Performance and Accountability Report 74 Part 2: Performance Information
Activity Metric: Identify Future Critical Skills
End-state Metric FY 2001 FY 2002 FY 2003 FY 2004a
Outcome goals that establish standards for emerging critical skills.
No historical data: new metric. Established
common definitions of critical fill needs.
Considered alternative metric development.
Agreed to common definition of critical skills.
Identified most critical needs for recruitment and retention.
a The FY 2004 data are preliminary.
Metric Description. We need to be able to identify those skills which will be critical to the future force with enough lead time to ensure that, when they are needed, there are Service members in these skills who are trained and ready. The skill and experience combinations that are deemed critical will vary from Service to Service. Because of this variability, it is not possible for us to fully understand what makes these skill/experience combinations so important. Without this knowledge, we cannot adequately assess our capability to identify, recruit, train, retain, and sustain service members in these skills. Ongoing Research. The Officer and Enlisted Personnel Management (OEPM) Directorate is responsible for designating a common set of criteria for “critical skills.” In addition to a set of common criteria, each Service will use its own criteria to determine those skills, or skill/experience combinations, that are critical to individual Service missions.
As part of Phase I of the study to understand how to set future critical skills, we sought to establish a metric to track progress on determining current “critical skills.” In Spring 2004, we established a common definition of “critical skill.” By the end of FY 2004, a metric for “critical skills” should be in place. The metric will provide a comprehensive list of the most common critical skills across the Department. While the final product will be Service-specific; the final list will meet a common DoD definition of “critical skill.” Phase II of the study will review the Services’ transformation programs and the Department’s vision of military strategy and responsibilities for the next 25 years. Specifically, we will need to address what
skills are going to be required to support this future strategy and which of those skills will be catalogued as “critical” (e.g., foreign area specialists, information operators, space experts) based on the criteria established in the study. The follow-on questions are many, such as: How will personnel be recruited in these skills? What programs will be required? Will we need special incentives? Could more wide-spread use of lateral entry options ease skill shortages? Is the training base adequately resourced with experienced personnel to provide entry level and advanced training? What retention incentives are going to be required to retain them? What jobs and education are required to provide for a viable and rewarding career path? This metric has a “yes” or “no” outcome. We are not positing that in order to answer “yes” for the metric that the answer be a list of critical skills and plans and programs outlined to answer all the questions addressed; rather, the desired outcome is a planning document which lays out what has to be accomplished in order for the Department to begin the process to recruit, train, retain and sustain personnel for a future critical skill. Timeline for completion. Three months after the Phase I study is complete, we will draft a study plan for Phase II. A final report will be published six months after the Phase II study begins. Performance Results for FY 2004. A DoD-wide definition of “critical skill” was established in Spring 2004, and the corresponding metric will be complete during 2004.
Activity Metric: Optimal Officer Career Patterns
End-state Metric FY 2001 FY 2002 FY 2003 FY 2004a
Percentage of officers on optimal career path for retention
No historical data: new metric.
Phase I of RAND study complete.
Started Phase II.
Published Phase 1 report.
a The FY 2004 data are preliminary.
Metric Description. Objective 3.4 of the Military Personnel Human Resources Strategic Plan is to “conduct studies on officer career and promotion

DoD Performance and Accountability Report 75 Part 2: Performance Information
management that will extend time in job and service tenure.” Consequently, we commissioned a study to assess the management and policy implication of potential changes in officer career management, given officer requirements. We expect legislative changes will be required to implement such changes. Ongoing Research. RAND is currently conducting a study to develop alternative management processes, plans, and policies that consider:
• The cap on officer career lengths • The feasibility and advisability of longer
assignments • The effects of different grade and position
tenures on retention or performance • Past officer assignment length patterns • Patterns of promotion and career tenure • Existing system dynamics military
manpower models to reflect selected changes to current officer management
• The implications of selected changes to policy for officers' career paths
• The need for different or additional compensation and incentives to support any changes in existing personnel practices.
Phase I of the study addressed General and Flag Officer careers; Phase II is addressing careers of officers in the grade of Colonel and below.
After Phase II is complete, an implementation plan will be developed. This plan may depend on legislative requests and policy changes.
Timeline for Completion: The Phase I study was completed in July 2003 and the report published in January 2004. The Phase II study began at the end of FY 2003. The final report, “Future Officer Force Modeling and Analysis,” is expected by the end FY 2005. As appropriate, policy or legislative changes will be compiled in FY 2005 and FY 2006, and metrics developed in FY 2006. The timeline has slipped by approximately one year, because the scope of the project was increased to include at least one Air Force community, in addition to Army and Navy communities. Performance Results for FY 2004. The Phase I RAND report was published in January 2004. So far this year, two Phase II communities have been modeled: Navy Surface Warfare Officers and Army Infantry. Progress reports were completed in January and June 2004 and subsequently passed to the Army and Navy.
Performance Metric: Civilian Human Resources Strategic Plan Metric FY 2001
Actual FY 2002 Actual
FY 2003 Actual
FY 2004 Target/Actual
98%
(40 of 41 tasks
completed)
80%/53%
(32 of 60 tasks
completed) a
Percent-age of Civilian HRStrategic Plan tasks completed
No historical
data: new
metric
90%
(26 of 29 tasks
completed)
(includes three FY 2002 carryover tasks)
(includes one FY 2003 carryover task)
a The FY 2004 data are as of the 3rd quarter (final)
Metric Description. Good human capital management is one of the key tenets of the Department’s transformation initiative. The DoD Civilian Human Resources Strategic Plan is the roadmap that provides direction and outlines the standards for achieving those transformational results. This plan links to agency mission and goals that cascade throughout the Department. We measure progress quarterly.
We judge success by comparing the number of tasks scheduled to the number completed on a quarterly and annual basis. To be rated as successful, 80 percent of tasks scheduled must be completed annually. (This target changed in FY 2003 to be consistent with how progress under the Military Personnel Human Resources Strategic Plan was being measured.) To provide more qualitative information about the overall effect of our annual activities, we are now working to replace task-dependent output measures with task-dependent outcome measures.
The process of refreshing the strategic plan is dynamic and necessary to ensure implementation of any requirements levied by law, policy, or best practice. The total number of tasks identified for any given reporting period is not static over time, but remains fairly consistent in the short term.
Our strategic planning process is effectively integrated with the combined program and budget and Unified Legislative Budget processes. The Human Resources Strategic Planning Senior Steering Group meets at least annually to refresh the plan and ensure that new and emerging initiatives are considered and receive the highest level of support and recognition.
Performance Results for FY 2004. As of the end of the third quarter of FY 2004, 32 of 60 activities were

DoD Performance and Accountability Report 76 Part 2: Performance Information
completed. As of the date of publication, the Department exceeded the FY2004 scheduled quarterly expectations and expected to meet 4th quarter expectations by completing at least 21 of 26 scheduled activities. One exception will be to carryover the Department’s scheduled July 2004 fielding of the DoD Civilian Satisfaction Survey to October 2004. The FY 2004 target of 66 was adjusted by four to reflect the shift in National Security Personnel System responsibilities to a Program Executive Office. Two tasks were moved to FY 2005.
Activity Metric: Civilian Recruiting Cycle Time
End-State Metric
FY
2001
FY
2002 FY 2003 FY 2004 a
Trend data to monitor the number of days appropriated fund positions are vacant.
No historical data:
new metric
• Draft Performance Measures
• Benchmark with Fortune 500
• Issue reporting requirements for measure
• Integrate OPM reporting requirements into DoD reporting requirements.
a The FY 2004 data provided above is preliminary.
Metric Description. This measure provides a standard performance metric and a standard data collection method for evaluating the efficiency of civilian recruiting cycle time across the Department. It is linked to the Office of Personnel Management (OPM) Human Capital Standards for Success, the Office of Management and Budget (OMB) scorecard, and is benchmarked to the “time to fill” metric used by Fortune 500 companies. Once data is collected, the Department will be able to determine, for appropriated fund placement actions, the average number of days from the date the position became vacant to the effective date of the placement action.
The time it takes to fill a vacancy can seriously affect an organization’s ability to accomplish its mission. OPM’s Human Resources Management (HRM) Accountability System Standards issued on January 4, 2002, lists “time to hire” as an example of a measure of human resources operational efficiency. The HRM Accountability System Standards may be viewed at: http://www.opm.gov/account/standards.asp.
Ongoing Research. On May 6, 2004, OPM imposed a new requirement to report on their 45-day hiring model. The OPM model tracks the number of working days from the date the vacancy announcement closed to the date the job offer was made. Since the OPM 45-day hiring requirement is a subset of the DoD “Time to Fill Metric” DoD plans to combine the DoD and OPM requirements into a single reporting requirement.
Timeline for Completion. This metric is scheduled to be fielded in FY 2005.
Performance Results for FY 2004. Representatives from Office of the Secretary of Defense (OSD) and the components participated in a working group to develop standard performance metrics for human resources as part of the DoD Civilian Human Resources Strategic Plan. This group considered the various aspects of a metric that would measure civilian recruiting cycle time, and revised the performance measures to mirror human resources metrics used by Key Fortune 500 organizations.
Activity Metric: Meeting Civilian Critical Fill Goals
Metric FY
2001 FY
2002 FY 2003 FY 2004 a
Number of critical positions encumbered as compared to number of critical positions authorized equals percentage.
No historical data: new metric
• Reviewed previously identified DoD critical positions, by core mission and critical support occupations
• Issued reporting requirements
• Analyzed data at DoD and Component level.
• Reported results of analysis
a The FY 2004 data are preliminary.
Metric Description. This measure monitors the fill rate of critical positions by core mission occupations and critical support occupations. Core mission occupations are those that most directly affect the Department’s ability to accomplish its mission over the long term. Critical support occupations are those that provide support for the core mission occupations.
The ability of an organization to fill critical positions in support of its core functions affects how efficiently and effectively it can accomplish its mission. Thus, fill rate is an integral part of human capital

DoD Performance and Accountability Report 77 Part 2: Performance Information
management. As early as 1999, the Government Accountability Office asked us to list our core mission and critical support occupations. We subsequently surveyed the Military Departments and Defense Agencies to identify core mission and critical support occupations and identified 13 core mission occupations and 23 critical support occupations:
Core Mission Occupations Critical Support Occupations
Occupational Series Series Title
Occupational Series Series Title
0602 Medical Officer
0018 Safety and Occupational Health
0800 Engineering Professions
0080 Security Administration
1101 General Business
0083 Police
1102 Contracting 0085 Guard
1152 Production Control
0201 Personnel Management
1300 Physical Science Professions
0260 Equal Employment Opportunity
1520 Mathematics 0301 Miscellaneous Administration
1550 Computer Science
0343 Management Analyst
1910 Quality Assurance
0346 Logistics Management
2001 General Supply
0391 Telecommunications Manager
2003 Supply Management
0501 Financial Administration
2010 Inventory Management
0505 Financial Management
2030 Distribution Management
0510 Accounting
0560 Budget Analyst
1670 Equipment Specialist
1710 Education and Vocational Training
1712 Training Instruction
1811 Criminal Investigating
2101 Transportation Specialist
2130 Traffic Management
2150 Transportation Operations
2161 Marine Cargo
2210 Computer Specialist
Ongoing Research. Due to changing mission requirements and the variety of missions within DoD, the Military Departments have been asked to review the DoD list of critical positions and provide, by
FY 2005, their “Top Ten List” of short-term critical mission occupations. Currently, we have no reliable, consolidated, automated system for collecting position authorization data; we continue to explore automated methodologies.
Timeline for Completion. By the end of FY 2005, we will develop civilian fill targets by occupation, as well as short-term “Top Ten” lists of critical positions by Service and defense agency.
Performance Results for FY 2004. As of the 3rd quarter FY 2004, the overall fill rate for core mission occupations was 96.98 percent, and for critical support occupations was 99.83 percent. The Services and defense agencies fill rates were: Core Mission occupations -
• Army – 102.88% • Navy – 101.15% • Air Force – 80.13% • Defense agencies – 93.02%
Critical Support occupations –
• Army – 106.99% • Navy – 99.62% • Air Force – 81.14% • Defense agencies – 95.16%

DoD Performance and Accountability Report 78 Part 2: Performance Information
Operational risk results from factors shaping the ability to achieve military objectives in a near-term conflict or other contingency. In simplest terms, it is about whether we can overcome today’s threats—about our ability to create plans that can be adapted quickly as events unfold, train for the next mission, and supply the warfighters with what they need now. It is about achieving near-term objectives, not long-term outcomes—thus, it is an important dimension of the defense strategy, but not the entire strategy. The four outcome goals of this risk management quadrant help the Secretary of Defense answer the following questions:
• Do we have the right forces available? • Are our force postured to succeed? • Are our forces currently ready? • Are our forces employed consistent with our
strategic priorities? All of the measures in this quadrant are activity metrics and reflect efforts currently underway within the Department to develop new joint baselines, new joint capabilities, or new performance metrics for joint readiness.
Outcome Goal: Do we have the right forces available? A pivotal tenet—to be able to respond rapidly, set conditions for deterrence, or swiftly defeat an adversary—is having the right forces in the right place at the right time. This means having: • Forces forward stationed, or in-theater rotating
forces. First Responders • Forces that fly-in or fall-in on prepositioned
equipment. Immediate Response • Forces that flow quickly into theater Rapid
Response The following metric is under development but is designed to help the Department follow this tenet.
Activity Metric: Operational Availability
End-state Metric
(New Baseline) FY
2001 FY
2002 FY
2003 FY 2004 a
Integrated data and management systems that can be used to assess percentage of force ready for specific joint tasks
No historical data: new metric.
• Tested prototype process for Global Force Management system.
• Approved adaptive planning concept and prototype.
• Developed two current and two future analytic baselines.
a The FY 2004 data are preliminary.
Metric Description. Today we increasingly rely on forces that are capable of both symmetric and asymmetric responses to current and potential threats. We must prevent terrorists from doing harm to our people, our country, and our friends and allies. We must be able to rapidly transition our military forces to post-hostilities operations, and identify and deter threats to the United States while standing ready to assist civil authorities in mitigating the consequences of a terrorist attack or other catastrophic event. These diverse requirements will demand that we integrate and leverage other elements of national power, such as strengthened international alliances and partnerships.
Operational Risk
“Most agree that to win the global war on terror, our Armed Forces need to be flexible, light and agile—so they can respond quickly to sudden changes. ”
Secretary RumsfeldFebruary 5, 2003

DoD Performance and Accountability Report 79 Part 2: Performance Information
To meet these new missions, and to hedge against an uncertain future, we are developing a broader portfolio of capabilities, and realigning our forces using a building-block approach to match those capability portfolios with mission goals. Among the most important initiatives are:
• Global Force Management. This initiative will provide a database and management system that can be used to monitor U.S. force postures worldwide. It will account for ongoing operations and constantly changing unit availability, and will allow us to do the kinds of analyses needed to ensure we allocate the right force for specific missions, at the right place and time.
• Adaptive Planning. Our goal is to produce war and contingency plans that are more timely, adaptive, and responsive to the current security environment, thus providing relevant options to the President and Secretary of Defense. We are working toward having a networked capability to produce plans on demand via the global information grid by 2008.
• Analytic Baselines. To guide analyses for both the near- and far-term, we are creating a set of common scenarios and data. These analytic baselines will underpin our strategic assessments, and guide decisions on joint warfighting issues and policy.
Ongoing Research. See the discussion of these activities elsewhere in this document.
Timeline for Completion. These and related initiatives, including the Defense Readiness Reporting System, are slated to complete development and enter fielding during FY 2005 through FY 2008.
Performance Results for FY 2004. During FY 2004, we made steady, positive progress in establishing Global Force Management, notably by making the U.S. Joint Forces Command responsible for developing global, joint sourcing solutions for conventional forces in support of Combatant Commander requirements – independent of unit assignment to a specific Combatant Command. We also made progress toward our adaptive planning goals by using the concept to construct force flows for the Operational Availability 2004 simulation
models (THUNDER, Integrated Theater Engagement Model, and Joint Integrated Contingency Model). Finally, we began work on a study entitled, “Operational Availability FY 2005 (OA 05).” To support this study, we will develop two future-year analytic baselines: Major Combat Operation-1 and the Baseline Security Posture. In addition, other major combat operations studies, as well as small-scale contingency studies, will use the OA-05-developed Baseline Security Posture for analysis. A more detailed discussion of each of these three initiatives is provided in separate metrics.
Outcome Goal: Are our forces postured to succeed? The ability to globally manage the location and apportionment of air, sea, and land forces and do so in a manner that meets worldwide commitments, while strengthening our ability to meet security challenges, is the focus of efforts being measured to have our forces postured to succeed.
Activity Metric: Global Force Management
End-state Metric
FY 2001
FY 2002 FY 2003 FY 2004a
Real-time operational availability and risk assessment to guide decisions on how to source joint force capabilities
No historical data: new
metric.
Developed Global Force Management construct.
Established Force Management Functional Capabilities Board.
Tested prototyped process to source FY 2005-2006 commitment.
a The FY 2004 data are final.
Metric Description. In 2003, the Secretary of Defense directed the Chairman of the Joint Chiefs of Staff to develop an integrated force assignment, apportionment, and allocation methodology. The Secretary also directed the U.S. Joint Forces

DoD Performance and Accountability Report 80 Part 2: Performance Information
Command (USJFCOM) to develop a means for monitoring joint force operational availability. In response, we have initiated the Global Force Management (GFM) process, designed to continuously manage the process that provides forces to conduct operational missions (called “sourcing”). It uses analytically based availability and readiness management methodologies. GFM provides comprehensive insight into U.S. force postures worldwide, and accounts for ongoing operations and constantly changing unit availability. GFM leverages the most responsive, best-positioned force at the time of need; it forms the basis of Joint Presence Policy that guides the allocating of Service forces that rotate into theater. GFM provides senior decision-makers the means to assess risk in terms of forces available for Combatant Commanders’ war plans and likely stress on the force. When mature, this metric will describe our ability to rapidly source joint force capabilities with the right units providing the right capability. Ongoing Research. There are several ongoing initiatives in support of GFM. The Joint Staff is leading the standardization and web-enabling of Service and Combatant Command force structure data as a key enabler to reliable, visible, and responsive global force availability information. In another GFM-related initiative, USJFCOM is assuming the role of the primary joint force provider and thus the single voice to source commitments. A final initiative is the codification of the Global Force Management Board – this Joint Staff-led study team is establishing the roles, missions, and functions of this board that will support the GFM process.
Timeline For Completion. The Global Force Management Data Initiative is expected to achieve initial operational capability by FY 2006. By December 2004, USJFCOM requirements in support of the joint force provider functions will be determined and the GFM Board will be codified.
Performance Results for FY 2004. During FY 2004, we made steady, positive progress in establishing GFM. A major development was the decision by the Secretary to establish USJFCOM as the primary joint force provider. USJFCOM is now responsible for developing global, joint sourcing solutions for conventional forces in support of Combatant Commander requirements – independent of unit assignment to a specific Combatant Command. We also integrated the previously stove-piped assignment, allocation and apportionment processes under a single integrated document entitled
Global Force Management. This document is a critical step in attaining the GFM goals of ensuring the most available, best positioned force supports Combatant Commander requirements, while measuring risk incurred to standing contingencies and plans based on sourcing recommendations. A final development this year was the establishment of the Force Management Functional Capabilities Board under the Joint Capabilities Integration and Development System process. This board oversees a myriad of GFM actions to ensure validated operational requirements are supported, and to provide the military advice to the Secretary on force management issues.
Activity Metric: Theatre Security Cooperation
End-state Metric FY
2001 FY
2002 FY 2003 FY 2004 a
Annual assessment of how theater security cooperation plans are contributing to DoD strategic goals
No historical data: new
metric.
Initial security cooperation guidance developed and approved.
Combatant commands and Services developed strategies.
FY 2005 plans completed.
FY 2004 strategies successfully completed.
a The FY 2004 data are final.
Metric Description. Recently, we initiated a comprehensive security cooperation strategy review that focused the activities of Combatant Commands, the Services, and defense agencies on the common goals that we need to achieve if we are to build the right defense partnerships with friends and allies. Security cooperation embraces all defense interactions with foreign defense establishments, and is our primary means of building relationships that promote specific U.S. security interests. Security cooperation activities help our allies develop military capabilities for self-defense and coalition operations. They also provide information, intelligence, and peacetime access to enroute infrastructure and other access in the event of a contingency. Theater security cooperation is a subset of defense security cooperation and encompasses activities Combatant Commands conduct to further our national goals and priorities.

DoD Performance and Accountability Report 81 Part 2: Performance Information
Ongoing Research. We are currently researching appropriate assessment metrics to determine effectiveness of the security cooperation program, and evaluating the capabilities required for security cooperation. This analysis will help us shape an associated Joint Operating Concept. Timeline for Completion. Initial metrics are slated for completion during FY 2005, in time to be used to develop the FY 2006 plans. Performance Results for FY 2004. In FY 2004, we continued to focus efforts on the six major defense policy themes: combating terrorism, influencing the direction of key powers, transforming the relationships with key powers, cooperating with parties to regional disputes, supporting realignment, and strengthening alliances for the future. Combatant Commands successfully executed the first generation of theater security cooperation plans. A detailed assessment of completed FY 2004 strategies was used as a point of departure for updating FY 2005 plans. The most important result from FY 2004’s theater security cooperation efforts is that the Services, functional and Combatant Commands, and defense agencies are coordinating their security cooperation efforts. This has created a collaborative planning environment and improved the quality of the overall security cooperation program.
Outcome Goal: Are our forces currently ready? The most basic information the President and Secretary of Defense must know about America’s Armed Forces is whether they are ready to perform their next mission.
To enhance current readiness reporting, four metrics are currently under development in support of this outcome goal. One helps leadership assess our ability to produce plans that are more timely, adaptive, and responsive to the current security environment. One helps create a foundation for strategic analyses. Another tells us how well we are learning lessons from current operations, and another fundamentally changes the way force readiness issues are measured, reported, and resolved.
Activity Metric: Adaptive Planning
End-state Metric FY
2001 FY
2002 FY 2003 FY 2004a
Percentage of deliberate and crisis plans networked as “living plans” in a collaborative joint command and control environment
No historical data: new
metric.
Tested prototype of adaptive planning tool
Approved adaptive planning concept and matured operational prototype.
a The FY 2004 data are final.
Metric Description. As a result of a Combatant Commander’s conference, the Secretary of Defense directed the Chairman of the Joint Chiefs of Staff to develop a new system to replace existing deliberate and crisis planning methods. The goal is to produce plans that are more timely, adaptive, and responsive to the current security environment, providing relevant options to the President and Secretary of Defense. Our long-term goal is to have a networked capability to produce plans on demand via the global information grid by 2008.
Adaptive planning will be implemented in three phases. The initiation phase (now through FY 2006) will deploy new tools and exercise portions of the adaptive planning construct on select priority plans. The implementation phase (FY 2006 - 2008) will produce electronic plans for all contingencies in a collaborative joint command and control (JC2) environment. The integration phase (beyond FY 2008) will produce and continually update “living” plans in a collaborative JC2 environment.
Ongoing Research. The Chairman has established an implementation working group to provide direction to adaptive planning activities and procedures. We continue to test and refine the web-based Collaborative Force Sustainment and Transportation (CFAST) tool to build campaign plans. We are also developing other tools to enable a collaborative planning environment. Adaptive planning efforts continue to be synchronized with numerous other Department transformational initiatives such as Global Force Management, the Standing Joint Force Headquarters, and the Defense Readiness Reporting System.
Timeline for Completion. Implementation plan, initial tools assessment, and CFAST version 3.0 should be complete by FY 2005. CFAST version 3.0 is a key component to successful testing of adaptive planning in its initiation phase.

DoD Performance and Accountability Report 82 Part 2: Performance Information
Performance Results for FY 2004. The Department made significant progress advancing the adaptive planning concept. The Secretary approved the concept and we established a team to ensure successful implementation throughout the Department. The U.S. Joint Forces Command conducted a formal test and evaluation of CFAST that resulted in modifications, improvements, and corrections to identified flaws. The Joint Staff used adaptive planning to construct force flows for the Operational Availability FY 2004 simulation models (THUNDER, Integrated Theater Engagement Model, and Joint Integrated Contingency Model). CFAST significantly decreased the planning time, increased the force flow accuracy and prototyped the collaborative planning environment.
Activity Metric: Analytic Baselines
End-state Metric FY
2001 FY
2002 FY 2003 FY 2004a
Number and quality of analytic baselines used to support the Quadrennial Defense Review and other major department studies.
No historical data: new
metric
Developed two future baselines.
Developed two current and two future baselines.
a The FY 2004 data are final.
Metric Description. In his annual planning guidance, the Secretary of Defense directed that we create a foundation for strategic analyses that relied on common scenarios and data. These analytic baselines are intended to provide senior staff responsive and analytically sound insights to help them make decisions on joint warfighting issues and policy. Analytic baselines support readily available and collaboratively generated analyses, documentation, and results for use throughout the Department. They are a common starting point for the Department’s most important studies. The current-year baselines accelerate the deliberate planning process and are based on existing Combatant Commander war planning efforts and concepts of operation; future-year baselines are primarily developed for use in Department-wide studies such as Operational Availability FY 2005.
Ongoing Research. The Joint Staff is currently conducting Operational Availability FY 2005 (OA 05). To support this study, we will develop two future-year analytic baselines: Major Combat
Operation-1 (MCO-1), “Swiftly Defeat the Effort,” and the Baseline Security Posture (BSP). Additionally, other MCO and small-scale contingency studies will use the OA-05-developed BSP baseline for analysis.
Timeline for Completion. A current-year baseline is under development with a final report due early FY 2005. In mid-FY 2005, a second current-year baseline is tentatively scheduled to support the development of a Combatant Commander’s Concept of Operations Plan (CONPLAN). The OA-05 study will develop two future-year baselines, with the final report due December 2005.
Performance Results for FY 2004. Two Combatant Commanders developed current-year baselines in FY 2004 to support development of their contingency plans. The OA-04 study produced future-year analytic baselines for two separate “Swiftly Defeat the Effort” campaigns.
Activity Metric: Operational Lessons Learned
End-state Metric FY 2001 FY 2002 FY 2003 FY 2004a
Percentage of lessons-learned captured, analyzed, and implemented to improve joint warfighting capabilities.
No historical
data: new
metric.
Released lessons learned develop-
ment concept.
Released DoD
Training Transfor-mation
Implemen-tation Plan.
Approved enhanced
Joint Lessons Learned Program Study.
a The FY 2004 data are final.
Metric Description. The Secretary of Defense and the Chairman of the Joint Chiefs of Staff have both highlighted the importance of an effective joint lessons-learned program. The DoD Training Transformation Plan (June 2003) identifies the need to ensure that lessons-learned are integrated into the development of new training processes and systems (see www.t2net.org). To do this, lessons-learned from operational missions must be systematically captured and injected into the full range of preparatory and planning activities, ongoing experimentation, concept development, doctrine, and joint tactics, techniques, and procedures development. To be effective, lessons-learned must be implemented at the lowest organizational level. When mature, this metric will monitor our progress toward effectively enhancing joint warfighting

DoD Performance and Accountability Report 83 Part 2: Performance Information
capability by quickly distributing and incorporating relevant operational lessons-learned. Ongoing Research. The Joint Staff finalized lessons-learned from Operation Iraqi Freedom and introduced the first five, priority lessons-learned into the Joint Capabilities Integration and Development System. The Chairman directed the U.S. Joint Forces Command (USJFCOM) to expand the lessons-learned program by collecting and analyzing lessons-learned data collected by Combatant Commands, Services, and defense agencies. Performance Results for FY 2004. During FY 2004, the Enhanced Joint Lessons Learned Program (JLLP) Study was completed; this initiative analyzes existing capabilities to capture lessons-learned and develop alternative courses of action. USJFCOM established the Joint Center for Operational Analysis–Lessons Learned; joint lessons-learned specialists were placed in the individual Services’ lessons-learned centers to assist with the collection, analysis, and distribution processes. The Joint Staff began updating the Joint Lessons-Learned Program instruction to reflect the changes in the collection, analysis, implementation and follow-up procedures to include the replacement of the Remedial Action Program with the institutionalized Doctrine, Organization, Training, Material, Leadership, Personnel and Facilities (DOTMLPF) change processes. The Joint Staff and USJFCOM sponsored the Worldwide Joint Lessons-Learned Conference in July 2004 to shape evolving policies, demonstrate success stories already impacting warfighters, receive input from allies, and promulgate changes to the overall lessons-learned program.
Activity Metric: DoD Readiness Reporting System (DRRS) Implementation
End-state Metric (New Baseline)
FY 2001
FY 2002 FY 2003 FY 2004 a
A new DoD-wide readiness reporting system
No historical data: new
metric
Awarded development contract.
Reached Initial operating capability.
Conducted technical capability review.
Provided an operational version.
a The FY 2004 data are preliminary.
Metric Description. The 2001 Quadrennial Defense Review directed us to fundamentally change the way force readiness issues are measured, reported, and resolved. DoD Directive 7730.65, DoD Readiness Reporting System (DRRS), signed on June 3, 2002, launched a series of important changes to policy and procedures that will allow us to develop and field a new readiness reporting and assessment system. The Secretary of Defense receives periodic updates on progress toward fully implementing DRRS across the Department. When mature, DRRS will provide a capabilities-based, adaptive, near-real-time readiness reporting system for all military units. Readiness will be assessed from the perspective of the Combatant Commanders. This is important because Combatant Commanders first describe their roles and responsibilities in terms of mission essential tasks (METs), assigned missions, and core tasks, and then they assess their ability to conduct these tasks. Ongoing Research. The Under Secretary of Defense for Personnel and Readiness is managing a comprehensive research effort being conducted by several development teams:
• Booz Allen Hamilton (development team) • Camber Corporation (training readiness
development team) • Dynamics Research Corporation (plan-to-
task study team) • Alion Science and Technology
(development team)

DoD Performance and Accountability Report 84 Part 2: Performance Information
• Computer Sciences Corporation (functional architecture)
• Northrop Grumman (munitions requirements)
Timeline for Completion. DRRS achieved initial operational capability at the end of FY 2004; full operational capability is expected by the end of 2007.
Performance Results for FY 2004. The Under Secretary of Defense for Personnel and Readiness is managing a comprehensive research effort being conducted by several development teams. In FY 2004, a project office and development team was identified and employed; the team has successfully demonstrated that DRRS 1.0 is operational. They also completed concept of operations, project management, and strategic plans; conducted an initial DRRS functionality test; established an initial DRRS network infrastructure; and developed a readiness markup language (RML) specification. An initial scenario-to-unit METs methodology was completed and the Enhanced Status of Resources and Training System (ESORTS) prototype was fielded. The team also successfully conducted a technical capability review of the “Build MET,” “Assess MET,” “TurboMET,” and “Portal” applications. Finally, a DRRS Support Center was established at U.S. Pacific Command.
Outcome Goal: Are our forces employed consistent with our strategic priorities? As our defense strategy changes, it is important to update our operation and contingency plans accordingly. When there are large changes, such as the Department’s decision to leverage joint training and operations, it means new concepts and tools must be developed to enhance the planning process.
The following measures are designed to help us gauge our success at achieving this goal.
Activity Metric: Joint Concepts
End-state Metric FY
2001 FY
2002 FY 2003 FY 2004a
Number of concepts approved to link strategic guidance to warfighting capabilities
No historical data: new
metric
Joint Operations Concepts construct approved.
Endorsed 2 of 4 Joint Operating Concepts.
Approved 5 functional concepts.
a The FY 2004 data are final.
Metric Description. Joint concepts guide the transformation of the joint force so that it is prepared to operate successfully over the next 10-20 years. The Joint Operations Concepts (JOpsC) document describes how the future military will operate as we transition from a threat-based to a capabilities-based force. It provides the operational context for the transformation of the U.S. Armed Forces by bridging the gap between strategic guidance and the Department’s resourcing strategy for capabilities. JOpsC also assists in structuring joint force experimentation and assessment activities that we use to validate capabilities-based requirements. It is the overarching framework that defines the construct for the development of subordinate Joint Operating Concepts, Joint Functional Concepts, and Joint Integrating Concepts.
Joint Operating Concepts (JOCs): • major combat operations, • stability operations, • homeland security, and • strategic deterrence... …describe how a Joint Force Commander will plan, prepare, deploy, employ, and sustain a joint force to accomplish a strategic objective for a given operation. Each concept identifies broad principles and essential capabilities and provides the operational context for JFC and JIC development and experimentation.
Joint Functional Concepts (JFCs): • joint command and control, • battlespace awareness, • force application, • focused logistics, and • protection...
…describe how a Joint Force Commander will integrate a set of related military tasks to attain required capabilities.

DoD Performance and Accountability Report 85 Part 2: Performance Information
Finally, the Joint Integrating Concepts (JICs): • undersea superiority, • joint forcible entry, • joint urban operations, • global strike, • sea basing, • joint command and control, • integrated air and missile defense, and • joint logistics… …describe how a Joint Force Commander integrates functional means to achieve operational objectives. They integrate essential battlespace effects with concepts of operation to transition from what needs to be done—to how to actually do it.
Ongoing Research. The Joint Staff is revising the JOpsC with stakeholders from across the Department. The JOCs, JFCs, and JICs are being developed or revised by various working groups. The Joint Staff and U.S. Joint Forces Command are introducing a process to schedule experimentation on approved JICs.
Timeline For Completion. The JOpsC, JOCs, and JFCs are planned to be on a two-year update cycle. The Chairman approved a plan to revise the JOpsC for Secretary of Defense approval by March 2005, and to revise the JOCs by early FY 2006. The current JFCs and three new JFCs (net-centric warfare, force management, and training management) are scheduled to be complete by early FY 2005, with an update scheduled by the end of FY 2006. The JICs are in various stages of development.
Performance Results for FY 2004. During FY 2004, two of four JOCs (homeland security and strategic deterrence) were endorsed by the Chairman and forwarded to the Secretary for approval. The remaining two JOCs (major combat operations, stability operations) are being staffed for the Chairman’s endorsement. The Joint Requirements Oversight Council approved all five JFCs. Work began on the eight JICs in FY 2004.
Activity Metric: Enhanced Planning Process (EPP)
End-state Metric (New baseline)
FY 2001
FY 2002
FY 2003 FY 2004
An annual assessment of issues and alternatives for providing the Department’s highest priority joint capabilities.
No historical data: new metric
• EPP chartered by Secretary of Defense.
• Resource guidance captures EPP results.
Metric Description. For the first time in FY 2004, major planning and resource issues presented for decision to the Secretary of Defense were formulated and assessed using an improved collaborative joint planning process—called the Enhanced Planning Process or EPP. By considering needs and costs simultaneously, the EPP was able to propose cost-effective programmatic options for achieving the Department’s strategic policy objectives. Accordingly, the EPP underpins the framework of executable Joint Programming Guidance (JPG). The JPG provides shared planning and resource assumptions used in annual updates to the defense program and budget.
An analytic baseline is being developed in concert with the Chairman of the Joint Chiefs of Staff and the Under Secretary of Defense for Policy. This baseline will establish common planning assumptions to be used in warfighting models, acquisition analysis, and other shared analysis tools.
Ongoing Research. An analytic baseline is being developed in concert with the Chairman of the Joint Chiefs of Staff and the Under Secretary of Defense for Policy. This baseline will establish common planning assumptions to be used in warfighting models, acquisition analysis, and other shared analysis tools.
Timeline for Completion. The first EPP was completed in May 2004 as a proof-of-concept. The full test of the EPP will occur during the next quadrennial defense review cycle, scheduled to begin during FY 2005.
Performance Results for FY 2004. The EPP supported the FY 2005 combined program and budget review. Twelve major issues,6 plus 15 issues consolidated from the Combatant Commanders Integrated Priority Lists (IPLs), were examined by
6 Defined as program changes of interest.

DoD Performance and Accountability Report 86 Part 2: Performance Information
means of the new process. Given the timeline and scope of the major issues, only two of the 12 were resolved in the FY 2005 President’s Budget; the remainder have been carried over to the FY 2006 cycle. However, all IPL issues were resolved and solutions directed in the JPG. Institutional risk stems from the management practices and controls that affect the efficiency with which resources are used and that shape the effectiveness of the Defense establishment. Just as we must transform America's military capability to meet changing threats, we must transform the way the Department works and what it works on. A new idea ignored may be the next threat overlooked. Every dollar squandered on waste is one denied to the warfighter. . The four outcome goals for this risk management quadrant are:
• Streamlined decision process, improved financial management, and acquisition excellence.
• Overhead and direct costs are managed. • Readiness and quality of key facilities are
improved. • Realigned support to the warfighter.
Just over half the metrics in the institutional risk management quadrant are performance metrics. They track improvements in facility quality and recapitalization rates, cost growth for major acquisition programs, logistics response time, and the
status of technology objectives. The activities in this quadrant focus on developing new facility baselines and new management tools.
Outcome Goal: Streamline the decision process, improve financial management, and drive acquisition excellence. We know that we must transform the way the Department works and on what it works. This means taking clear, specific action to streamline our decision process—our leaders cannot act wisely unless they can get the information they need, when they need it. The Secretary’s performance priorities for institutional excellence are to…
• Streamline DoD processes, • Optimize intelligence capabilities, and • Enhance the Interagency process, focus, and
integration. We know that the technology revolution has not yet fully taken hold in the defense economy, and that financial systems are decades old and incompatible with one another. We know from the 1998 BRAC that we have 25 percent more installation and facilities capacity than we need, costing an unnecessary $3 billion to $4 billion dollars annually. The President’s Management Agenda – has set targets for the Department of Defense in each of five government-wide initiatives to improve management and service to our citizens.
• Human Capital • Improved Financial Performance—BMMP • Competitive Sourcing • E-Government • Budget and Performance and Performance
Integration
This means we must… • Drive change from the top. • Set measurable goals. • Standardize and integrate business processes
and financial management systems agency wide.
• Achieve Acquisition Excellence.
We have the ability—and, therefore, the responsibility—to reduce waste and improve operational efficiency on our own.
Secretary RumsfeldSeptember 10, 2001
Institutional Risk

DoD Performance and Accountability Report 87 Part 2: Performance Information
The next four measures will help lead the way.
Performance Metric: Support Acquisition Excellence Goals
Metric (Excellence
Goal)
FY 2001
FY 2002
FY 2003 FY 2004a
Acquisition Excellence with Integrity
Progress demonstrated in the following DoD scorecard metrics: Major Defense Acquisition Program (MDAP) Cycle Time, MDAP Acquisition Cost Growth, and MDAP operations and sustainment (O&S) Cost Growth.
Logistics: Integrated and Efficient
Progress demonstrated in the following DoD scorecard metric: Customer Wait Time.
Systems Integration & Engineering for Mission Success
No historical data for FY 2001-2002; established goal but did not measure data for FY 2003.
• Established senior- level forum.
• Established framework and formal plan.
• Developed 3 continuous-learning courses.
Technology Dominance
No historical data for FY 2001-2002. Progress FY 2003 to present demonstrated via the following DoD scorecard metrics: Balanced and Focused Science and Technology and Status of Defense Technology Objectives.
Resources Rationalized
No historical data for FY 2001-2002. Progress FY 2003 to present demonstrated via the following DoD scorecard metric: Base Realignment and Closure 2005.
Industrial Base Strengthen-ed
No historical data for FY 2001-2002. In FY 2003, increased competition by relieving contractors from covering government shortfalls in research and development.
• Identified industrial base issues in battle space awareness and command and control.
• Published roadmap for Transforming the Industrial Base.
Motivated, Agile Workforce
No historical data for FY 2001-2002. In FY 2003, supported Civilian Acquisition Workforce Personnel Demonstration (AcqDemo) Project.
Transitioned from the AcqDemo Project to the National Security Personnel System.
aThe FY 2004 information is preliminary.
Metric Description. The focus of the Department in the area of acquisition, technology and logistics has changed from one of “reform” to “excellence.” “Excellence” stresses making the current system function better, and then institutionalizing the improved process. The Department faces many challenges in identifying, retailoring, and institutionalizing the system’s strengths to perform better.
We are working to achieve three primary outcomes: • Leveling the playing field for all contractors,
giving us greater exposure to new ideas. • Invigorating the fiscal well being of the defense
industry by rewarding good performance. • Encouraging the strong competition vital to
maintaining a healthy industrial base.
Performance Results for FY 2004. Our results for this fiscal year include:
1. Acquisition Excellence with Integrity – Our long-term objective is to shorten the system acquisition cycle by using evolutionary acquisition and spiral development, maximizing the use of mature and commercial technology, and expanding the use of technology demonstrations. At the same time, we are striving to increase the accuracy and credibility of cost estimates and thus fund all Major Defense Acquisition Programs (MDAPs) at the Cost Analysis Improvement Group (CAIG) estimate, if appropriate. We plan to bring a joint capabilities perspective to acquisition, and will conduct senior leadership reviews of each functional capability area.7 Next, we will enforce the results of senior leadership reviews in the resource process as we transition from “systems-focused” to “capabilities-based” Defense Acquisition Executive Summary reviews. The metrics we are using to measure progress against this goal are MDAP Cycle Time, MDAP Acquisition Cost Growth, and MDAP Operations and Support (O&S) Cost Growth. They are described in detail later.
2. Logistics: Integrated and Efficient – The
Department is striving for integrated and efficient logistics. We will adopt initiatives that reduce logistics handoffs and ensure reliable delivery of products and services; develop weapon-system support strategies based on performance-based logistics; design logistics requirements using high-reliability systems; reduce the deployable logistics footprint of operational and support forces;
7 Force protection, battle space awareness, command & control, focused logistics, network-centric warfare, force management, joint training, and force application make up the eight functional area capabilities.

DoD Performance and Accountability Report 88 Part 2: Performance Information
and reduce logistics costs of operations. The Customer Wait Time metric is used to measure progress against this goal; it is described in detail later.
3. Systems Integration and Engineering for
Mission Success – We need to focus our systems integration and engineering activities on mission success. To do this, we need to employ integrated architectures, plans, and roadmaps, and establish a clear mission context for Defense Acquisition Board reviews. It is important that we continue to foster interoperability, enhancements to joint and coalition capabilities, and improve the systems engineering environment. We need to sustain a professional systems engineering workforce, and give them the policies and analytic tools they need to assess system readiness. We must continue to conduct high-standard operational tests and evaluations. Finally, we need to aggressively work to reduce life-cycle costs. The metric we will use to measure progress for this goal has not yet been established.
4. Technology Dominance – To dominate in
future conflicts, we must have technologically superior military systems. To achieve this dominance, we will employ activities such as fully leveraging Advanced Concept Technology Demonstrations, closely linking high pay off science and technology efforts to enhance joint warfighting capabilities and align with strategic defense initiatives. We need to establish a new science and technology career field to better focus human capital resources. The metrics used to measure progress against this goal are Maintain a Balanced and Focused Science and Technology Program and Monitor the Status of Defense Technology Objectives.
5. Resources Rationalized – We are working
to enhance our joint warfighting capabilities by funding key programs sufficiently, rationalizing infrastructure, and pursuing fundamental business process improvements. These improvements include business process streamlining, outsourcing, and competitive sourcing.
The result will be a re-sized and reconfigured facilities footprint. BRAC 2005 will help us measure our progress toward this goal. The BRAC is described in detail later in this report.
6. Industrial Base Strengthened – One of our
enduring goals is to ensure a defense industrial base that is focused on and capable of supporting 21st century warfighting. To do this, we are establishing cross-feed mechanisms for major industrial base assessments, evaluating industrial sufficiency for key capabilities, developing industrial policy that creates and retains surge capacity for essential materials, and accessing emerging suppliers for innovative solutions. The metric for this goal has not yet been established.
7. Motivated, Agile Workforce – We are
continuing the Congressionally mandated DoD Civilian Acquisition Workforce Personnel Demonstration (AcqDemo) project. AcqDemo is designed to give employees a flexible, responsive personnel system that rewards contributions and provides line managers with greater authority over personnel actions. Key features of the demonstration project include streamlined hiring, broad banding,8 a simplified classification system, and a personnel system that links compensation to employees’ contributions to the mission through annual performance appraisals. The Department will be transitioning personnel from the AcqDemo Project into the National Security Personnel System (NSPS) in FY 2005. During this transition, we will be integrating best practices from the AcqDemo into the NSPS. Additional information on the AcqDemo initiatives is at www.acq.osd.mil/acqdemo.
Activity Metric: Improve the Transparency of Component Submissions
8 Broad banding collapses a number of salary ranges within a traditional salary structure into a few broad bands.

DoD Performance and Accountability Report 89 Part 2: Performance Information
for Alignment of Program Review to Strategic Trades
End-state Metric FY
2001 FY
2002 FY 2003 FY 2004a
A DoD-wide transactional data collection process
Established initial database integration criteria.
Established single collection point for operation and maintenance data.
Streamlined Planning, Programming, Budgeting and Execution (PPBE) process
No historical data new metric
• Streamlined and combined the program and budget review.
• Instituted streamlined process for developing the FY 2005 budget.
Continued with streamlining effort, placing more emphasis on planning and less on resourcing decisions.
a The FY 2004 information is final.
Metric Description. Improving the transparency of component program and budget submissions will help ensure our resource plans comply with the Secretary’s strategic guidance. It will provide our senior-level decision makers with the insight they need to make better-informed decisions. This is because transparency fosters an agreement of facts. Accordingly, alternatives and the associated trade space can be bounded by the agreed-upon facts. This, in turn, provides a consistent baseline that serves as a common point of departure for making resource trades.
To achieve a consistent baseline, we must first streamline the flow of data. Each data element should be collected only once by a single authoritative source collection system and reused as needed. The agreement of all parties on data accuracy, validity, and source authority facilitates this “collect-once” capability
Our efforts to improve transparency have been under way for several years. However, we have never documented or quantified metrics we can use to monitor our progress. Accordingly, evidence of our success to date is mostly anecdotal. However, one area where we can measure progress is in our Programming Data Requirements (PDR) data collection and reuse initiative, which we hope will serve as the pilot for the development of measures to be applied more broadly.
To determine how accurate our resource data are, we will rely on fiscal and budgetary controls, combined with assessments of whether the data comply with strategic guidance. Where possible, we have established business rules to ensure existing data structures are used appropriately. We also will validate data by having analysts and subject-matter experts monitor particular groups of resources or programs. A major tenet of the Streamlined Planning, Programming, Budgeting, and Execution process is the disciplined review of component programs to ensure resource compliance with strategic guidance.
Ongoing Research. Refining the submission of programming and budgeting data are tasks in progress with the Services, defense agencies, and the DoD Comptroller. Streamlining the data flow to eliminate dual submissions between budget and programming systems will reduce workload and improve data quality. Requirements will be standardized and reduced. PDR data requirements have been reduced from 139 distinct formats in FY 2000 to 39 distinct formats in the FY 2003 cycle. This degree of reduction needs to be achieved in other areas as permitted by legal and external agency reporting requirements.
Evaluating, validating, and improving the current program and budget data structures will significantly contribute to the alignment of programming and budgeting activities. The data structures must facilitate compliance with reporting requirements; better support business and policy decisions; allow for easier management of the structures to ensure validity of the data; and support the overlay of taxonomies for specific analytic purposes in support of strategic reviews.
Connections to the lower-level, component-maintained source data would provide further transparency as issues arise. The solution should provide the ability for analysts supporting a decision maker to find data at a finer level of detail maintained by the components.
The criteria that we will use to measure improvement in transparency might include:
• Data requirements: the reduction in the number of distinct data requirements requested at each point in the cycle.
• Data structure management: the level of human effort required annually to keep the structure accurate; the amount of time and effort to create a new element.

DoD Performance and Accountability Report 90 Part 2: Performance Information
• Consistency of program reporting: the degree to which resource plans provide a non-ambiguous result when viewed from different perspectives; the time to create new mappings and the accuracy of the mappings to emerging requirements.
Timeline for Completion. The DoD Business Management Modernization Program (BMMP) has set a target of full deployment of the systems supporting this metric by 2010; a unified information architecture will be implemented by FY 2008.
Performance Results for FY 2004. Database integration efforts are ongoing. For example, we now have a single collection system for operations and maintenance data that feeds decisions for both the program and budget development.
Activity Metric: Increase Visibility of Trade Space
End-state Metric FY 2001 FY 2002 FY 2003 FY 2004 a
Estimates of the cost of trade guidance within the context of the overall Defense Program.
No historical data: new metric.
Conducted Joint Defense Capabilities Study.
• Published strategic planning guidance.
• Initiated enhanced planning process.
• Issued joint programming guidance using initial analytical findings.
a The FY 2004 data are final.
Metric Description. The annual planning guidance of the Secretary of Defense is the primary tool for directing how defense programs and budgets will be shaped. Previous guidance provided a list of projects of interest, and it set priorities across the defense program. However, it did so with little fidelity. The result was fiscally unsound and unclear planning guidance. This made it difficult to ensure compliance.
In FY 2003, we dramatically increased the Secretary’s ability to influence Service and agency programs and budgets directly by restructuring the annual guidance update to clarify where more risk or less risk should be taken across the defense program. This revised structure directed the Services and
agencies to apply explicit criteria for risk management, and to align their resource plans accordingly. Then, during the annual program and budget review, any resource proposal that varied from guidance was corrected in the President’s Budget.
During the next planning cycle, we further strengthened the guidance as a resource decision tool by adding more details on how Services and defense agencies were expected to meet the Secretary’s intent within fiscal constraints. The guidance—renamed Strategic Planning Guidance or SPG—marked the first attempt to estimate the direct cost of program priorities with the context of the overall defense program. However, shortfalls still exist. It is still difficult to develop a truly independent cost estimate of planning priorities, or to accurately assess all the variables associated with estimating the potential trade space created by accepting increased risk in some areas of the defense program. The SPG replaces the policy and strategy sections of the old consolidated defense guidance.
The newly initiated Enhanced Planning Process (EPP) will provide a continuous, open and collaborative analytic forum to closely examine issues of greatest interest to the Secretary. The EPP is intended to produce programmatic recommendations that will be documented in a new annual publication—the Joint Programming Guidance (JPG). The JPG replaces the programmatic elements of the old consolidated defense guidance.
Ongoing Research. The Department continues to improve this performance metric but several factors will influence progress:
• Defining “visibility” and its gradations. We need the ability to accurately estimate the costs associated with programmatic and budget trades. We must be able to frame the trade space discussion within the context of the overall defense program. We must also ensure we are clear about the impact of making trades within and among the four risk management areas of the defense strategy.
• Developing an index for measuring compliance. One approach to measuring increased visibility is measuring its effect (output)—that is, the degree of compliance. This metric might be measured in dollars failing to conform to guidance or in the number of issues of noncompliance that are raised in the program and budget review. Either

DoD Performance and Accountability Report 91 Part 2: Performance Information
index can provide a trend to show progress in achieving visibility of the trade space.
• Classification and the pre-decisional nature of document. The Secretary’s planning guidance is pre-decisional, and thus not releasable. In addition, much of the guidance is classified. It is likely that some or portions of any trade-space metric would also be subject to these restrictions.
Timeline for Completion. Proposed metrics are expected to be developed by December 31, 2004.
Performance Results for FY2004. The inaugural SPG dramatically improved the Secretary’s ability to shape the investment choices made by the Services and defense agencies by assigning specific priorities that have to be achieved within fiscal constraints. It identified areas for accepting increased risk or divesture in order to stay within those constraints. It also directed several analytic efforts be undertaken during the remainder of FY 2004 and in FY 2005 to gain insight into how programs must be structured to achieve synergy in joint operations, and how performance metrics can be better defined to help evaluate programs in a joint context. The JPG used the initial findings of the EPP studies to describe specific program changes and priorities to guide the FY 2006 President’s Budget and FY 2006- 2011 Future Years Defense Program.
Activity Metric: Provide Explicit Guidance for Program and Budget Development End-state Metric(New Baseline)
FY 2001
FY 2002 FY 2003 FY 2004 a
Revised planning,
programming, and budgeting
decision process
No historical data: new
metric.
Conducted DoD-wide
study of joint defense
capabilities.
• Combined the program/budget review process.
• Implemented new joint perspective in planning and program guidance.
• Added execution reviews to formal process.
a The FY 2004 data are final.
Metric Description. Section 113 of Title 10, U.S. Code, requires the Secretary of Defense to give the heads of the Military Departments and defense agencies the resource levels projected to be available for the period of time for which national security objectives, policies, and military missions established as priorities under the defense strategy are to be effective. In March 2003, the Secretary of Defense chartered a broad review of our planning and resource decision process. A study team chaired by the Honorable E.C. "Pete" Aldridge, former Under Secretary of Defense, explored ways to make the existing defense decision process less cumbersome, more responsive, and more helpful to the Secretary’s attempt to focus on managing and enhancing joint capabilities.
The Joint Defense Capabilities Study was completed in November 2003. It recommended focusing the Secretary’s annual planning and programming guidance on high-level strategic issues, and framing resource alternatives as capabilities rather than programs. The study also recommended that actual results become a formal part of the overall assessment process. Accordingly, the DoD Planning, Programming, and Budgeting System (PPBS) added a final “Execution” phase to the overall process to become the PPBES.
Ongoing Research. We have enhanced our planning process to focus on issues that are strategic and joint, and address core military capabilities. Our goal is to use disciplined, joint analysis to propose programmatic alternatives and subsequently formulate joint program and budget guidance.

DoD Performance and Accountability Report 92 Part 2: Performance Information
Timeline for Completion. The revised process will have its first full proof-of-concept for the next quadrennial defense review cycle, which will begin in FY 2005.
Performance Results for FY 2004. During FY 2004, we published our revised planning guidance—the Strategic Planning Guidance, which documented key resource planning assumptions for formulating resource plans. We also released the first Joint Programming Guidance, which described program areas where planners should either accept or reduce risk. Finally, we combined the program and budget review, and increased our emphasis on integrating lessons-learned into the overall decision process. For example, Services and defense agencies could not make major changes from the approved FY 2004 defense baseline for FY 2005 absent an explicit rationale that considered actual performance results.
Outcome Goal: Manage overhead and direct costs. By carefully managing overhead and direct costs, the Department ensures resources are directed to accomplishing its mission, and conducting its most important core functions. The following metrics help us monitor achievement of this outcome goal.
The Department manages this outcome goal with the help of two important metrics: • Reduce the percentage of the DoD budget spent
of infrastructure. By doing so, the Department ensures maximum resources are allocated to our mission, core competencies, and critical functions.
• Link Defense resources to key performance goals. Closely related to the first metric, this metric gauges our progress toward the use of automated techniques for transforming vast amounts of data into usable resource allocation information.
Performance Metric: Reduce Percentage of DoD Budget Spent on Infrastructure
Metric FY 2001 Actual
FY 2002 Actual
FY 2003 Target/Actual
FY 2004 Target
Percentage of DoD budget spent on infrastructure
46 44 42/42 41
Note: This is a lagged indicator. Projections are based on the FY 2005 President’s Budget Future Years Defense Program.
Metric Description. The share of the defense budget devoted to infrastructure is one of the principal measures the Department uses to gauge progress toward achieving its infrastructure reduction goals. A downward trend in this lagged metric indicates that the balance is shifting toward less infrastructure and more mission programs. In tracking annual resource allocations, we use mission and infrastructure definitions that support macro-level comparisons of DoD resources. The definitions are based on the 2001 Quadrennial Defense Review (QDR), the Future Years Defense Program (FYDP), and an Institute for Defense Analyses report (DoD Force and Infrastructure Categories: A FYDP-Based Conceptual Model of Department of Defense Programs and Resources, September 2002) prepared for the Office of the Secretary of Defense. The definitions are consistent with the Goldwater-Nichols Department of Defense Reorganization Act of 1986 (P.L. 99-433). This act requires that combat units, and their organic support, be routinely assigned to the Combatant Commanders and that the Military Departments retain the activities that create and sustain those forces. This feature of U.S. law provides the demarcation line between forces (military units assigned to Combatant Commanders) and infrastructure (activities retained by the Military Departments). In addition to more precisely distinguishing forces from infrastructure, the force subcategories have been updated to reflect current operational concepts. The infrastructure subcategories, likewise, have been updated and streamlined.
Fully half our resources go to infrastructure and overhead, and in addition to draining resources from warfighting, these costly and outdated systems, procedures and programs stifle innovation as well.
Secretary Rumsfeld, September 10, 2001

DoD Performance and Accountability Report 93 Part 2: Performance Information
Performance Results for FY 2003. FY 2004 accomplishments will be available by the second quarter of FY 2005. In FY 2003, we allocated about 42 percent of total obligational authority to infrastructure activities, down from about 44 percent in the preceding year. The reduction in percentage terms stems from two sources. First, the Department continued to increase its allocation of resources to forces in fighting the global war on terror and meeting other operational requirements. Second, efficiencies have resulted from QDR and defense reform initiatives, including savings from previous base realignment and closure rounds, strategic and competitive sourcing initiatives, and privatization and reengineering efforts. We expect a continued reduction in expenditures on infrastructure as a share of the defense budget in FY 2004 and FY 2005. The following tables illustrate, by mission and infrastructure categories, their relative share of DoD Total Obligation Authority (TOA).
Department of Defense
TOA by Force and Infrastructure Category
Constant FY 2005 $ (Billions)
FY 2000 FY 2001 FY 2002 FY 2003
Mission Categories
Expeditionary Forces 135 141 151 197
Deterrence & Protection Forces 8 9 13 14
Other Forces 30 32 34 49
Defense Emergency Response Fund 0 0 14 1
Forces Total 173 183 213 261
Infrastructure Categories
Force Installations 24 24 27 34
Communications & Information 5 5 6 8
Science & Technology Program 9 9 10 11
Acquisition 9 9 9 9
Central Logistics 21 19 20 27
Defense Health Program 20 18 26 23
Central Personnel Administration 11 11 8 12
Central Personnel Benefits Programs 8 8 9 9
Central Training 27 27 30 34
Departmental Management 15 16 17 20
Other Infrastructure 3 8 3 4
Infrastructure Total 151 154 166 190
Grand Total 324 337 379 451
Infrastructure as a Percentage of Total 47% 46% 44% 42%
Source: FY 2005 President's Budget and associated FYDP with Institute for Defense Analyses FYDP normalization adjustments. Note: TOA = Total Obligational Authority

DoD Performance and Accountability Report 94 Part 2: Performance Information
Mission and Infrastructure Categories Used for Tracking the Portion of the DoD Budget Spent on Infrastructure
Mission Categories
Expeditionary forces. Operating forces designed primarily for non-nuclear operations outside the United States. Includes combat units (and their organic support) such as divisions, tactical aircraft squadrons, and aircraft carriers.
Deterrence and Protection Forces. Operating forces designed primarily to deter or defeat direct attacks on the United States and its territories. Also includes agencies engaged in U.S. international policy activities under the direct supervision of the Office of the Secretary of Defense.
Other forces. Includes most intelligence, space, and combat-related command, control, and communications programs, such as cryptologic activities, satellite communications, and airborne command posts.
Infrastructure Categories
Force installations. Installations at which combat units are based. Includes the Services and organizations at these installations necessary to house and sustain the units and support their daily operations. Also includes programs to sustain, restore, and modernize buildings at the installations and protect the environment.
Communications and information infrastructure. Programs that provide secure information distribution, processing, storage, and display. Major elements include long-haul communication systems, base computing systems, Defense Enterprise Computing Centers and detachments, and information assurance programs.
Science and technology program. The program of scientific research and experimentation within the Department of Defense that seeks to advance fundamental science relevant to military needs and determine if the results can successfully be applied to military use.
Acquisition. Activities that develop, test, evaluate, and manage the acquisition of military equipment and supporting systems. These activities also provide technical oversight throughout a system’s useful life.
Central logistics. Programs that provide supplies, depot-level maintenance of military equipment and supporting systems, transportation of material, and other products and services to customers throughout DoD.
Defense health program. Medical infrastructure and systems, managed by the Assistant Secretary of Defense for Health Affairs, that provide health care to military personnel, dependents, and retirees.
Central personnel administration. Programs that acquire and administer the DoD workforce. Includes acquisition of new DoD personnel, station assignments, provisions of the appropriate number of skilled people for each career field, and miscellaneous personnel management support functions, such as personnel transient and holding accounts.
Central personnel benefit programs. Programs that provide benefits to service members. Includes family housing programs; commissaries and military exchanges; dependent schools in the United States and abroad; community, youth, and family centers; child development activities; off-duty and voluntary education programs; and a variety of ceremonial and morale-boosting activities.
Central training. Programs that provide formal training to personnel at central locations away from their duty stations (non-unit training). Includes training of new personnel, officer training and service academies, aviation and flight training, and military professional and skill training. Also includes miscellaneous other training-related support functions.
Departmental management. Headquarters whose primary mission is to manage the overall programs and operations of DoD and its components. Includes administrative, force, and international management headquarters, and defense-wide support activities that are centrally managed. Excludes headquarters elements exercising operational command (which are assigned to the “other forces” category) and management headquarters associated with other infrastructure categories.
Other infrastructure. Programs that do not fit well into other categories. They include programs that (1) provide management, basing, and operating support for DoD intelligence activities; (2) conduct navigation, meteorological, and oceanographic activities; (3) manage and upgrade DoD-operated air traffic control activities; (4) support warfighting, war-gaming, battle centers, and major modeling and simulation programs; (5) conduct medical contingency preparedness activities not part of the defense health program; and (6) fund joint exercises sponsored by the Combatant Commanders (COCOMs) or JCS directed. Also included in this category are centralized resource adjustments that are not allocated among the programs affected (e.g., foreign currency fluctuations, commissary resale stocks, and force structure deviations).
Activity Metric: Link Defense Resources to Key Performance Goals
End-state Metric FY 2001 FY 2002 FY 2003 FY 2004 a
Common resource data lexicon
No historical data: new metric
Developed draft data framework and common business rules.
a The FY 2004 information is final.
Metric Description. In FY 2003 we opened a program office dedicated to combining or aligning program and budget databases that previously had been managed separately. We are now engaged in a major review of the Department’s program and budget data structure. This review, to be completed during FY 2005, will ensure our common resource management database:
• More directly aligns with Congressional and other external reporting requirements,
• Better supports internal business and policy decisions by allowing an overlay of issue taxonomies that support strategy development and reviews, and,
• More easily manages data structures and improves our ability to validate data.
This review covers almost 4,000 areas. We will modernize or replace outdated activity definitions, and consolidate or create others. Already we are seeing that today’s new strategic approach is merging and blurring the traditional lines between tooth (deployable operational units) and tail (non-deploying units and central support). When the study is complete, we will have a more flexible analysis interface with defense data, allowing us to build alternative ways of mapping our programming data structure and making it easier to crosswalk performance results to resource investments.

DoD Performance and Accountability Report 95 Part 2: Performance Information
Ongoing Research. Two working groups comprising representatives from each Service, a lead policy office, and select defense agencies are reviewing the data structures and definitions for DoD’s program data and acquisition resource data.
Timeline for Completion. By the end of FY 2006, we will develop standard data definitions to be used throughout the Department and implement a revised data framework that allows a unified program and budget data architecture.
Performance Results for FY 2004. During FY 2004, we conducted extensive line-by-line reviews of the existing data structure, and developed:
• A draft programming and budget framework based upon the four quadrants of the DoD risk management framework,
• Draft business rules for using the program and budget framework, and,
• A common set of DoD business definitions.
Outcome Goal: Improve the readiness and quality of key facilities. For too long, we neglected our facilities, postponing all but the most urgent repairs and upgrades until the long term health of our entire support infrastructure was in jeopardy. Therefore, over the past several years, we’ve invested substantial sums in sustaining, restoring, and modernizing—cutting the previous recapitalization rate by almost a third and improving our sustainment rate. The Secretary’s mandate to transform America’s defense for the 21st century will be impossible unless we shed unneeded infrastructure now on our books, and streamline operations at remaining facilities. On 15 November 2002, Secretary Rumsfeld signed a memorandum establishing the process for recommending base closures and realignments in 2005. The goal is to present recommendations to Congress by May 2005. Four metrics are designed to help the Department achieve this outcome goal.
Activity Metric: Base Realignment and Closure (BRAC) in FY2005 End-state Metric(New Baseline) FY 2001 FY 2002 FY 2003 FY 2004a
A new DoD facility footprint
BRAC cited as a key element of DoD transforma-tion.
Legislative authority for BRAC establish-ed.
• 2005 BRAC initiated by the Secretary of Defense.
• Manage-ment structure and seven joint cross-service groups established.
• Final selection criteria establish-ed.
• Data collection and certifica-tion begun.
a The FY 2004 data are final.
Metric Description. An early priority of the Secretary of Defense was to transform America's defense for the 21st century by shifting defense planning from the "threat-based" model that had dominated thinking to a "capabilities-based" model for the future. Our transformation charter reinforced our long-standing commitment to streamlining and upgrading of defense infrastructure by explicitly calling for “…another round of infrastructure reductions to reduce unneeded facilities.” Accordingly, we were able to persuade Congress to grant authority in the FY 2002 National Defense Authorization Act for a Base Realignment and Closure (BRAC) round in 2005.
On November 15, 2002, the Secretary signed a memorandum entitled, “Transformation Through Base Realignment and Closure,” that officially initiated the process for BRAC 2005. The document outlines the expectations and importance of reshaping DoD’s infrastructure to better support future force structure. It established two senior level groups to manage and oversee the process, provided for the analysis of common business-oriented functions separate from service-unique functions, and required specific delineation of functions to receive joint analysis within 150 days.
An Infrastructure Executive Council, headed by the Deputy Secretary of Defense, provide policy and oversight. A lower-level Infrastructure Steering Group, headed by the Under Secretary of Defense for Acquisition, Technology and Logistics, oversees the joint analysis of common business-oriented support functions and ensures those efforts are coordinated

DoD Performance and Accountability Report 96 Part 2: Performance Information
with Service reviews of service specific operation functions.
Each of the Services and defense agencies have established procedures and designated appropriate personnel to certify that data and information collected for use in the BRAC 2005 analyses are accurate and complete. This certification process is subject to audit by the Government Accountability Office and DoD auditors.
Ongoing Research. The Secretary, in his memo kicking off the 2005 BRAC process, directed that joint teams be created to review common business-oriented functions. Subsequently, the Secretary approved seven Joint Cross-Service Groups and associated functions for joint review.
Timeline for Completion. We will provide any needed revisions to the 20-year force structure plan to Congress not later than March 15, 2005. By May 16, 2005, we will send closure and realignment recommendations to the BRAC Commission and congressional defense committees.
Performance Results for FY 2004. We met our milestones for the fiscal year by providing the final BRAC base selection criteria to Congress in February 2004; we also began collecting and certifying facility data. Our projection of the Department’s 20-year force structure and the necessary associated infrastructure and excess capacity was provided to Congress with the FY 2005 President’s Budget. This report also certified the need for BRAC 2005 and that an additional round of BRAC would result in annual net savings for each Military Department no later than FY 2011.
We also developed an Internal Control Plan and a data certification process to satisfy statutory requirements for use of certified data in developing closure and realignment recommendations. The Military Departments and Joint Cross-Service Groups also completed development of their respective Internal Control Plans. Military Department auditors and auditors from the DoD Inspector General reviewed these plans.
Performance Metric: Eliminate Inadequate Family Housing by 2007
Metric FY 2001Actual
FY 2002 Actual
FY 2003 Actualc
FY 2004 Targetb/Actual
Number of inadequate family housing units
170,314 143,608 119,980 93,294/NAd
Percentage of total family housing unitsa
59 53 47 NAd
a Targets are not established for the percentage of total family housing units. b Targets were based on Service military construction and family housing budget estimates for FY 2005. c Changes reported reflect final budget numbers. d FY 2004 results not available until after the FY 2006 President’s Budget is submitted.
Metric Description. Our goal is to eliminate all inadequate family housing in the continental United States by the end of FY 2007 (and by FY 2009 for overseas bases). In general, inadequate housing is any unit that requires a major repair, component upgrade, component replacement, or total upgrade. Each Service has evaluated its housing and identified inadequate units. Each Service has then developed a plan to eliminate inadequate housing through a combination of traditional military construction, operations and maintenance support, and privatization. The plans are updated annually with the President’s Budget.
Performance Results for FY 2004. Through the end of FY 2003, we reduced inadequate family housing by 23,628 units through revitalization, demolition, and privatization. The total number of inadequate housing eliminated through privatization from the start of the program through FY 2003 is 44,961. Results for FY 2004 will not be available until the President’s Budget for FY 2006 is submitted to Congress in February 2005.

DoD Performance and Accountability Report 97 Part 2: Performance Information
Performance Metric: Fund to a 67-year Recapitalization Rate by 2007
Metrics FY 2001 Actual
FY 2002 Actual
FY 2003 Actual
FY 2004 a,c
Actual
Facilities recapitalization metric–FRM (years)
192 101 149 111
Facilities sustainment model–FSM
70%b 89%b 93% 94%
a Three defense agencies (Defense Logistics Agency, DoD Education Activity, and Tri-Care Medical Activity) were included beginning in FY 2004, but excluded in previous years. b Estimated (FSM was first fielded in FY 2003) c The FY 2004 data are as of the FY 2005 President’s Budget.
Metric Description. The facilities recapitalization metric (FRM) measures the rate at which an inventory of facilities is being recapitalized. The term “recapitalization” means to restore or modernize facilities. Recapitalization may (or may not) involve total replacement of individual facilities; recapitalization often occurs incrementally over time without a complete replacement.
The performance goal for FRM equals the average expected service life (ESL) of the facilities inventory (estimated to be 67 years, based on benchmarks developed by a panel of Defense engineers – see the installations portion of the 1997 Quadrennial Defense Review). The ESL, in turn, is a function of facilities sustainment. “Sustainment” means routine maintenance and repair necessary to achieve the ESL. To compute a normal ESL, full sustainment levels must be assumed. Less than full sustainment results in a reduced ESL. For this reason, the metrics for facilities recapitalization and facilities sustainment are unavoidably linked and should be considered together.
Sustainment levels required to achieve a normal ESL are benchmarked to commercial per unit costs; for example, $1.94 per square foot annually is needed to properly sustain the aircraft maintenance hangar inventory for a 50-year life cycle. The facilities sustainment model (FSM) adjusts these costs to local areas and assigns the costs to DoD components and funding sources.
The recapitalization rate—measured by FRM in years—is compared to service life benchmarks for various types of facilities. For example, the ESL of a pier is 75 years, and the ESL of a dental clinic is 50 years (again, provided the facilities are fully sustained during that time). The average of all the ESL benchmarks, weighted by the value of the
facilities represented by each benchmark, is 67 years. Weighting is required to normalize the ESL. For example, without weighting, 50 years is the ESL of a hypothetical inventory consisting of administrative buildings (75-year ESL) and fences (25-year ESL). But fences are insignificant compared to administrative buildings—DoD has $22 billion worth of administrative buildings, but only $3 billion worth of fences and related structures—and should not have equal weight. The ESL of this hypothetical inventory when weighted by plant replacement value is 68 years, not 50 years.
For evaluating planned performance, both metrics (FSM and FRM) are converted to dollars (annual funding requirements) and compared to funded programs in the DoD Future Years Defense Program (FYDP). The sustainment rate can be measured through execution; the recapitalization rate, which is primarily—but not exclusively—a function of multi-year military construction appropriations, is not tracked for execution on an annual basis.
Performance Results for FY 2004. These metrics do not capture “actual” expenditures, as the term “actual” is normally understood. For recapitalization, there is no reporting process for determining the “actual” (i.e., executed) recapitalization rate in a given year, and there is little reason to do so. Appropriations for military construction projects—which make up the bulk of the recapitalization investment—are good for five years, and are typically executed over more than one year. Additionally, Congressional additions, rescissions, reprogrammings, and late project adjustments all alter the “actual” recapitalization rate. There is no system as yet to capture these changes at the DoD level, and an annual rate of execution for military construction appropriations has little meaning.
For sustainment, a system is in place to capture the “actual” sustainment expenditure at the DoD level. However, FY 2003 was the first year for the system and the initial results are unreliable. In FY 2003, and continuing into FY 2004, the global war on terror has skewed execution results such that they are presently not useful. The DoD execution tracking system, as currently used, is unable to properly distinguish sustainment expenses for the normal DoD facilities inventory from sustainment expenses strictly related to contingency operations. For example, the system cannot tell the difference between sustaining facilities at Langley Air Force Base (AFB) and sustaining contingency facilities in Iraq. The facilities at Langley AFB are part of the computed DoD sustainment requirement, but the palaces in Iraq are

DoD Performance and Accountability Report 98 Part 2: Performance Information
not; hence, the reported execution totals cannot be properly compared to the budgeted or targeted rates. This issue has impacted heavily on the Air Force. On the other hand, the war has also drawn off sustainment funding for other non-sustainment purposes, making the estimated execution rate somewhat unusual. This issue has impacted the Army most heavily. All these issues are presently being addressed so that in the future, perhaps as early as FY 2005 or 2006, execution results for sustainment will be more reliable. For this report, the table above continues to show budgeted rates, not executed rates.
The results shown for FY 2004—111-year recapitalization rate and 94 percent sustainment rate—demonstrate continuing improvement from FY 2003. However, these results are projected based on budget values—actual execution may be different. Final execution results will be as of the FY 2006 President’s Budget. One of the most notable accomplishments, which is not visible in the table, is that all the military Services and major defense agencies are funded equally at 95 percent of standard, DoD-wide benchmarks. The only exception remains the Defense Logistics Agency (DLA), which is funded via working capital funds. Special studies are underway to determine a solution for DLA, especially for the fuels infrastructure that is under DLA’s purview.
Although performance, as measured by the budgeted recapitalization and sustainment rates, continued to improve from FY 2001 levels, the targets (67-year recapitalization rate and full sustainment) were not achieved in either budget. As a result of not achieving full sustainment levels, the estimated service life of the inventories (67 years) suffered another incremental reduction. As a result of not achieving a 67-year recapitalization rate, obsolescence in the facilities inventories increased incrementally. The cumulative and compounding effect of these shortfalls is measured by the number of deteriorated, obsolete, or otherwise inadequate facilities (referred to as C-3 or C-4 facilities in DoD readiness terminology) reported in the Department’s readiness reports. Two thirds of facility classes are reported as having serious deficiencies that adversely impact mission performance. Because of the way these metrics are constructed, the underperforming results in earlier years do not directly affect the sustainment and recapitalization performance targets for FY 2005 and FY 2006. The goal for sustainment remains full sustainment. For example, a 6 percent shortfall in programmed
sustainment in FY 2004 cannot be offset with 6 percent overage in FY 2005. The interim goal for recapitalization remains 67 years, even though past performance has already reduced the service life of the facilities inventory. The direct effect of under-sustainment and under-recapitalization is captured in an accelerated—and more costly—recapitalization rate required to restore readiness to adequate levels by 2010.
Activity Metric: Restore Readiness of Key Facilities by 2010
End-state Metric
FY 2001
FY 2002 FY 2003 FY 2004 a
Percentage of DoD facilities restored to a high state of military readiness
No historical data: new
metric.
Chartered effort to standardize facility records and improve Installations Readiness Report (IRR) summaries.
Implemented revised condition reporting process.
Began IRR re-engineering.
Conducted a special study to determine whether the FY 2010 goal is still achievable.
a The FY 2004 data are preliminary.
Metric Description. Our goal, first articulated with the 1997 update to the defense strategy, is to restore facilities readiness as currently measured by the Installations Readiness Report (IRR) to a readiness rating of at least C-2 (defined as adequate condition), such that the sum of all necessary restoration and modernization costs is >10 percent but ≤20 percent of the average replacement value of the facility by the end of FY 2010.
The existing IRR is a summary of ratings by facility class. While serving as a good indicator of general conditions, the IRR does not itself provide a way to determine appropriate investment levels or to target investments. There is no relationship between the official real property inventories and the IRR, which limits confidence in the IRR ratings. In addition, the IRR, with its emphasis on readiness rather than just condition, may skew the costs needed to restore facilities to adequate conditions. The goal is to eliminate deteriorated, obsolete, or otherwise inadequate facilities by accelerating recapitalization and restoring key facilities to at least an adequate condition (C-2). An earlier estimate based only on

DoD Performance and Accountability Report 99 Part 2: Performance Information
summary IRR ratings indicates that the FY 2010 goal might be achievable for most of the military Services if resources are made available for a full sustainment program coupled with accelerated recapitalization. However, a more precise and auditable condition assessment mechanism is needed to assess overall funding requirements and to track progress.
Ongoing Research. The Office of the Under Secretary of Defense for Installations and Environment is conducting a special study of facilities restoration. A revised condition reporting process, similar to a facilities condition index commonly found in other government agencies, has been developed by a cross-Department working group under the Installations Policy Board, and is in the process of being implemented. However, this will require coding of more than 500,000 individual facility records and will be addressed in phases over about two years. This process will standardize reporting by individual facility record in real property inventories, which will provide improved data quality and better support readiness ratings. Draft policy has been developed in financial management regulations and in an updated DoD Instruction 4165.14 on real property reporting. The first round of new data is expected to be available in October 2004 from the Department of the Navy. Additional data will follow from the Departments of the Army and Air Force.
Timeline for Completion. A standard for common condition reporting was completed in November 2002. The first common condition reports are to be released in October 2004. During 2005, we will develop a concept for mission-impact rating (M-ratings), and complete an initial validation and verification of the new condition factor (Q-rating). A complete submission of common conditions reports is scheduled for October 2005. The first report under the new system is planned for January 2006.
Performance Results for FY 2004. During FY 2004, we began adding a mission impact factor (M-rating) to the new condition factor (Q-rating), so that the readiness of facilities to support various missions at specific locations can be computed in a less subjective and more standardized, auditable, and automated way.
We also began incorporating facilities and installation information into the Defense Readiness Reporting System (which is simultaneously being re-engineered), such that facilities will be more closely integrated with other readiness reporting methodologies.
We began reporting Q-ratings for Navy and Marine Corps inventories; the first reports are expected at the close of the fiscal year. The Army and Air Force are re-designing their systems during FY 2004 to accommodate Q-ratings and will report to the Office of Secretary of Defense within 12 months following the close of the fiscal year.
We also awarded a contract to upgrade the facilities recapitalization metric, which assists in forecasting funding requirements to restore readiness from a simple metric to a more robust web-based model. New benchmarks are under development that may impact the timeline for achieving the FY 2010 goal.
Finally, we re-initiated a DoD-level facilities demolition and disposal program, which will assist in accelerating achievement of the C-2 equivalency goal.
Outcome Goal: Realign support to the warfighter. The Department continues to transform its business processes and infrastructure to both enhance the capabilities and creativity of its employees and free up resources to support the warfighter. Transformation of our military forces hinges on being able to reduce redundancy, focus organizations on executive goals, flatten hierarchies, and cut cycle times in the decision and delivery processes. Finding ways to make real progress in these areas will result in gains in technology transfer and drive more effective operational performance. Three current metrics and one metric under development will help us support the warfighter.

DoD Performance and Accountability Report 100 Part 2: Performance Information
Performance Metric: Reduce Customer Wait Time (Days)
Metric FY 2001 Actual
FY 2002 Actual
FY 2003 Actual
FY 2004 Target/ Actual a
Customer wait time (in days)
18 16 19 15/24
a The FY 2004 data are as of the 2nd quarter.
Metric Description. Customer wait time (CWT) measures the elapsed time from when a customer orders an item of material to its receipt. The customer’s order may be filled from assets on hand at the customer’s military installation or naval vessel, or through the DoD wholesale logistics system. For purposes of this enterprise-level metric, CWT data includes orders for spare and repair parts ordered by organizational maintenance activities. CWT data captured for orders below enterprise level are maintained by each of the military Services and the Defense Logistics Agency.
Performance Results for FY 2004. Through the second quarter of FY 2004, we experienced an average CWT of 24 days. We do not expect to realize much reduction in CWT until the conclusion of Operation Iraqi Freedom.
Performance Metric: Reduce Major Defense Acquisition Program (MDAP) Annual Rate of Acquisition Cost Growth
Metric FY 2001 Actual
FY 2002 Actual
FY 2003 Actual
FY 2004 Targetb
Percentage annual growth +13.9a +6.4 +5.0 Downward trend
toward 0% aThe December Selected Acquisition Report (SAR), which reflects the President’s budget, is used for calculating acquisition cost growth. There were no December 2000 SARs, because a Future Years Defense Program was not included in the FY 2002 President’s Budget. Thus, the FY 2001 actual reflects acquisition cost growth for a two-year period (FY 2000 and FY 2001). cResults for FY 2004 will be available in April 2005.
Metric Description. Acquisition cost growth measures the amount that acquisition costs grow from year to year. It is computed by taking the difference between the acquisition costs in the current-year’s President’s Budget and the previous-year’s budget, divided by the acquisition costs for the previous-year’s budget, expressed as a percentage. The population is all Major Defense Acquisition Programs (MDAPs) common to both current-year
and previous-year budgets. A dollar-weighted average is calculated for the common MDAPs and adjusted for inflation and changes in quantity. Acquisition cost growth can occur for various reasons, including technical risk, schedule slips, programmatic changes, or overly optimistic cost estimates. The Department’s reform initiatives seek to reduce cost growth from all sources, providing an output target for procurement managers of individual systems, as well as for the aggregate procurement programs of the individual Services. The objective is to be on a downward trend toward the ultimate goal of no (0 percent) acquisition cost growth. Managerial responses are expected to include both specific cost-control initiatives and process changes.
Performance Results for FY 2004. Results for FY 2004 will be available with the release of the SARs in April 2005.
Performance Metric: Reduce Major Defense Acquisition Program (MDAP) Acquisition Cycle Time
Metric (months) FY 2001 Actual
FY 2002 Actual
FY 2003Actual
FY 2004Targeta
Acquisition cycle time (for new starts from FY 1992 through FY 2001)
102 103 102 <99
Acquisition cycle time (for new starts after FY 2001)
Not applicable 76 <66
a Results for FY 2004 will be available in April 2005.
Metric Description. Acquisition cycle time is the elapsed time, in months, from program initiation—when the Department makes a commitment to develop and produce a weapon system—until the system attains initial operational capability (IOC). This metric measures the average cycle time across all Major Defense Acquisition Programs (MDAPs). During the 1960s, a typical defense acquisition took seven years (84 months) to complete. By 1996, a similar acquisition required 11 years (132 months) to complete. To reverse this trend, the Department established an objective to reduce the average acquisition cycle time for MDAPs started since 1992 to less than 99 months, a reduction of 25 percent. DoD achieved that initial objective through rapid acquisition with demonstrated technology, time-phased requirements and evolutionary development, and integrated test and evaluation. To continue to improve, the Department now seeks to reduce the

DoD Performance and Accountability Report 101 Part 2: Performance Information
average cycle time to less than 66 months for all MDAPs started after FY 2001. To achieve that objective, the Department is introducing improvements to development and production schedules similar to those it initiated for managing system performance and cost. Rapid development and fielding of weapon systems—leveraging new technologies faster—will enable U.S. forces to stay ahead of potential adversaries.
Performance Results for FY 2004. FY 2004 results will not be available until the release of the SARs with the FY 2006 President’s Budget in April of 2005.
Activity Metric: Reduce Major Defense Acquisition Program (MDAP) Operating & Support (O&S) Cost Growth
End-state Metric FY
2001 FY
2002 FY 2003 FY 2004a
Percentage of annual cost growth
No historical data: new metric
Established metric baseline by collecting data to establish the first data point.
Collecting data to establish the second data point on which to determine growth.
aThe FY 2004 data are preliminary.
Metric Description. Operating and support (O&S) costs are those resources required to operate and support a system, subsystem, or major component during its useful life in the operational inventory. This metric measures the amount that O&S costs for Major Defense Acquisition Programs grow from year to year. It is computed by taking the difference between the total O&S cost estimates reported in the current-year Selected Acquisition Report (SAR) against the previous-year’s SAR, then dividing by the total O&S cost estimates reported in the previous-year SAR, expressed as a percentage. The population is all MDAPs common to both current-year and previous-year budgets that report O&S cost estimates in the SAR. A dollar-weighted average is calculated for the common MDAPs.
Estimated O&S cost growth can occur for various reasons, including technical or programmatic changes, changes in the support strategy/concept, or overly optimistic cost estimates. The objective is no (0 percent) O&S cost growth. Managerial responses
are expected to include both specific cost-control initiatives and process changes.
Ongoing Research. Data on MDAP O&S cost growth estimates are collected from SARs submitted by the Department to the Congress pursuant to Section 2432, Title 10, U.S. Code. SARs summarize the latest estimates of cost, schedule, and technical status. Subsequent quarterly exception reports are required only for those programs experiencing unit cost increases of at least 15 percent or schedule delays of at least six months. Quarterly SARs are also submitted for initial reports, final reports, and for programs that are re-baselined at major milestone decisions.
To further develop this metric, the Consolidated Acquisition Reporting System (CARS) was modified to produce a new data table in the SAR. This new table contains the data needed to measure the O&S cost growth metric.
Timeline for Development. The data to populate this table is collected from the December SARs.
Performance Results for FY 2004. FY 2004 results will not be available until the release of SARs in April 2005.

DoD Performance and Accountability Report 102 Part 2: Performance Information
Future challenges risk derives from issues affecting the ability to invest in new capabilities and develop new operational concepts needed to dissuade or defeat mid- to long-term military challenges. By definition, transformation is the enduring process of change. It is not about change for its own sake, nor is it about canceling the pursuit of one technology for another. Accordingly, static measures of success can mislead or misinform—today’s “right” solution may as easily be a barrier as a gateway to tomorrow’s innovation. How then do we know if we are, in fact, “transforming” to meet the future? The most reliable barometer of transformation in the defense community is to observe how the culture is changing. How and why are things done differently than in the past? How are those changes redefining what we believe we need to accomplish next? The four outcome goals we are pursuing in this risk management quadrant are:
• Drive innovative joint operations. • Develop more effective organizations • Define and develop transformational
capabilities • Define skills and competencies for the future
The majority of the measures in this risk management quadrant are activity metrics that focus on developing new measurement tools for intelligence, networked information, and new warfare concepts. The remaining performance metrics monitor science and
technology investments, training transformation, and technology development.
Outcome Goal: Drive Innovative Joint Operations. The Department continues to develop the ability to integrate combat organizations with forces capable of responding rapidly to events that occur with little or no warning. These joint forces are scalable and task-organized into modular units to allow the Combatant Commanders to draw on the appropriate forces to deter or defeat an adversary. The development and incorporation of joint operating concepts is our leading priority for transformation. Joint forces, which are lighter, more lethal and maneuverable, survivable, and more readily deployed and employed in an integrated fashion, are ripe with opportunities for concept innovation. Measuring our progress towards these goals, as well as measuring how the military Services’ budget proposals demonstrate innovation and experimentation, helps advance innovative joint operations.
Activity Metric: Experiment with New Warfare Concepts
End-state Metric FY 2001 FY 2002 FY 2003 FY 2004a
Percentage of goals met
No historical
data: new
metric
Developed guidance.
Released guidance.
• Conducted four major experimentation exercises.
• Submitted joint experimentation plan for approval.
• Fielded Standing Joint Force Headquarters prototypes.
a The FY 2004 data are final.
Metric Description. The goal of the Department’s experimentation program is to rapidly convert innovative warfighting concepts to prototypes to fielded capabilities. Accordingly, the April 2003 Transformation Planning Guidance directed the development of the Joint Concept Development and
Future Challenges Risk
We are working to promote a culture that rewards unconventional thinking—a climate where people have freedom and flexibility to take risks and try new things…one that does not wait for threats to emerge and be "validated," but rather anticipates them before they emerge—and develops and deploys new capabilities quickly, to dissuade and deter those threats.
Secretary RumsfeldFebruary 5, 2003

DoD Performance and Accountability Report 103 Part 2: Performance Information
Experimentation (JCDE) Campaign Plan to describe the role of joint experimentation as a major generator of transformational change.
JCDE follows two paths: joint concept development and joint prototyping.
• The joint concept development program explores innovative concepts for improving future joint warfighting. These concepts result from an iterative experimentation program that relies on frequent, small-scale sets of experiments conducted in a joint wargaming environment. Once concepts prove viable, they are transferred to the prototype team.
• The joint prototype program improves current warfighting capabilities and matures new capabilities through continuous experimentation as part of Combatant Command joint exercise programs. JCDE will identify capabilities proposals for rapid prototyping and provide actionable recommendations for future resource investments based on experimentation results.
Ongoing Research. The Joint Operations Concept is the overarching concept of how the joint force intends to operate in the next 10-20 years; it is currently being developed with associated functional and integrating concepts. The primary prototype under development is the Standing Joint Force Headquarters, with associated prototypes for a collaborative information environment, an operational net assessment, effects-based operations, a Joint Interagency Coordination Group, a joint fires initiative, and a common relevant operating picture. Other prototype efforts include the joint deployment process and joint intelligence, surveillance, and reconnaissance.
Timeline for Completion. The Secretary is expected to sign the JCDE Campaign Plan in FY 2005. The concepts development schedule is contained in the Joint Operations Concepts activity metric description. Prototypes are at various stages of development.
Performance Results for FY 2004. The JCDE Campaign Plan was approved by the Chairman of the Joint Chiefs of Staff and submitted to the Secretary of Defense. As of the end of the 3rd quarter of FY 2004, the U.S. Joint Forces Command co-sponsored four major exercises with each of the Services that included multi-national partners. We have substantially improved experimentation results by increasing the participation of Combatant
Commands and inter-agency representatives. Standing Joint Force Headquarters prototypes were introduced at each of the regional Combatant Commands; the exception is the U.S. Central Command, where participation has been delayed due to ongoing contingency operations. The results from Unified Course 04, Thor’s Hammer, Multinational Experiment 3, and Unified Engagement 04 exercises will be incorporated into developing concepts, further experiments, or introduced as prototypes.
Performance Metric: Maintain Balanced and Focused Science and Technology
Metric FY 2001 FY 2002 FY 2003 FY 2004a
Percentage of S&T budget
Basic research 16% 14.8% 14% 12.8% Applied research 42.7% 42% 38% 35.9% Advanced technology development 41.3% 43.2% 48% 51.3% a The FY 2004 data are final
Metric Description. The DoD science and technology (S&T) program consists of research and development investments in Basic Research, Applied Research, and Advanced Technology Development.9 This metric is designed to ensure a balanced and focused investment by funding these at 15 percent, 35 percent, and 50 percent, respectively, of the total annual S&T budget.
Determining the right level of investment is not a precise science; rather it is a strategic decision. Our ultimate objective is to fund S&T at a level adequate to ensure our technological superiority—specifically, sufficient to provide the technology foundation we need to modernize our forces, and to develop the “leap ahead” technologies that produce transformational capabilities. Accordingly, we must continue to invest broadly in defense-relevant technologies, because it is not possible to predict in which areas the next breakthroughs will occur or what specific capabilities will be required to meet the challenges of the uncertain future. Performance Results for FY 2004. The balance achieved between the funding levels for FY 2005 in
9 Basic Research falls under Budget Activity (BA) 1, Applied Research under BA 2, and Advanced Technology Development under BA 3.

DoD Performance and Accountability Report 104 Part 2: Performance Information
Basic Research, Applied Research, and Advanced Technology Development is sufficiently close to the DoD goals.
Outcome Goal: Develop more effective organizations. Being ready and capable of changing our organizations to meet current and future challenges is the hallmark of an agile Department. These metrics are designed to measure that capability and guide improvements.
Activity Metric: Enhance Homeland Defense and Consequence Management End-state
Metric (New baseline)
FY 2001
FY 2002 FY 2003 FY 2004a
Strategy and an associated resource and technology roadmap.
No historical data: new
metric
• Established an Assistant Secretary for Homeland Defense.
• Established U.S. Northern Command.
• Began developing first homeland defense strategy.
• Developed initial resource and technology roadmaps.
a The FY 2004 data are final.
Metric Description. Our highest priority is protecting the U.S. homeland from attack—we must be able to succeed at the full range of tasks associated with an active defense-in-depth that includes military operations in forward regions, the U.S. approaches, the U.S. homeland, and the global commons. Specifically, we must be able to:
• Conduct military missions to prevent, deter, defend, and defeat attacks on the United States, our population, and our defense critical infrastructure (homeland defense).
• Support civil authorities directed by the
President or Secretary of Defense as part of a comprehensive national response to prevent and protect against terrorist
incidents or manage the consequences of attack or disaster (homeland security).
• Enhance contributions of domestic and
foreign partners to homeland security and homeland defense.
Ongoing Research. To guide our efforts to meet the challenges of the post-9/11 threat environment, the Secretary of Defense directed the development of the first comprehensive, defense-wide strategy for homeland defense and civil support. This new strategy will rely on an integrated threat assessment to define DoD’s strategic goals, key objectives, and core capabilities for homeland defense and civil support. The strategy also will describe associated force structure, technology, and resource implications.
By providing an overarching suite of strategic goals aligned with resource and technology plans, we will add coherence and direction to the disparate activities across the Department that currently deter and prevent attacks, protect critical defense and designated civilian infrastructure, provide situational understanding, and prepare for and respond to incidents.
The completed strategy will articulate a number of actions for immediate implementation to transform DoD’s capabilities for homeland defense and civil support in each of the core capability areas:
• Maximum threat awareness, • Interdiction and defeat of threats at safe
distance, • Mission assurance, • Improved interagency and international
capabilities, and • Consequence management (managing the
consequences of a chemical, biological, radiological, nuclear or explosive incident).
Timeline for Completion. We expect to complete the strategy by the first quarter of FY 2005.
Performance Results for FY 2004. The initial research and writing of a comprehensive homeland defense strategy is ongoing. Real world events such as the G-8 Summit at Sea Island, Georgia, the national political conventions, and the period of heightened threat during August 2004 have delayed coordination of the document. The completion of the strategy is set for the early part of FY 2005.

DoD Performance and Accountability Report 105 Part 2: Performance Information
Activity Metric: Establish a Standing Joint Force Headquarters
End-state Metric
(New baseline) FY 2001 FY 2002 FY 2003 FY 2004a
The ability to rapidly execute transformational command and control functions for joint force operations.
Development of Standing Joint Force Headquarters (SJFHQ) directed in 2001 Quadrennial Defense Review
Concept released.
• Experiments conducted
• Implementa-tion guidelines developed
SJFHQ established and staffed
a The FY 2004 data are final.
Metric Description. In 2003, the Secretary of Defense directed Geographic Combatant Commands (GCC) to establish Standing Joint Force Headquarters (SJFHQ) by FY 2005. These SJFHQs reflect standards established by U.S. Joint Forces Command (USJFCOM) and incorporate the lessons learned from the Millennium Challenge ’02 joint exercises. Each GCC has a 58-person core SJFHQ that serves as a planning staff during day-to-day operations. In the event of a crisis, the in-place SJFHQ is immediately prepared to execute command and control functions for the integrated employment of air, land, maritime, and information forces. The SJFHQ is made up of joint-trained personnel skilled in using computer-based analysis tools and joint information and processes. To operate in the field, each deployable SJFHQ must have a Deployable Joint Command and Control (DJC2) capability.
Timeline For Completion. All the regional Combatant Commands will have SJFHQ organizations established in FY 2005; the exception is the U.S. Central Command, where participation has been delayed by the ongoing contingency. As an operational reserve to the GCCs, USJFCOM will establish a deployable surge-capable SJFHQ during FY 2005.
Performance Results for FY 2004. The Secretary of Defense approved an exemption to the 15 percent major headquarters personnel reduction for the GCCs that allowed them to retain 58 personnel to man their SJFHQ organization. Subsequently, the Department approved $1.6M per GCC for the operations and maintenance of their SJFHQs. The GCCs conducted initial training, procured appropriate facilities, and installed garrison equipment for their SJFHQs. The GCCs have completed plans to conduct a full-scale joint training event in FY 2005 that will serve as the “graduation” event for their new joint command and control capability. The DJC2 program delivered an initial concept and procedures development set to USJFCOM in September 2004 and is on schedule to
deliver the first operational set to U.S. Pacific Command in FY 2005. USJFCOM also developed draft Standard Operating Procedures and Tactics, Techniques, and Procedures for the 58-person core element.
Performance Metric: Transform DoD Training
Metric
FY 2001
FY 2002
FY 2003
FY 2004 Target/Actual a
Percentage of military officers in critical positions certified as joint-trained or educated
No historical data: new metric.
50% / 52%
a The FY 2004 data are as of the 3rd quarter.
Metric Description. Our vision for training transformation is to provide dynamic, capabilities-based training in support of national security requirements across the full spectrum of service, joint, interagency, intergovernmental, and multinational operations. In 2003, the Secretary of Defense tasked the Under Secretary of Defense for Personnel and Readiness with overseeing the initiative across the Department. When the initiative was launched in FY 2003, our metrics were activity-based and measured progress toward milestone tasks. Starting in FY 2004, we began transitioning to outcome-based measures.
Our long-term goal is to be able to measure training “value” by evaluating (1) throughput, (2) innovation, and (3) transparency of training. These three performance indicators align with the Department’s risk management scorecard, and provide a framework for possible DoD-wide reporting.
One of the leading indicators of training transformation is the overall percentage of the force that have received joint-certified training or had joint education. A higher percentage correlates to increased performance in jobs that require knowledge of joint capabilities, such as joint or combined command and control and tactics. Although the entire force is not measurable at this time, the critical positions filled by officers at Combatant Command staffs are currently being measured.
To be joint-certified, an officer must complete a two-year joint duty assignment. An officer is considered to have received joint education if he or she graduates from a course certified as Joint Professional Military Education Phase 2.

DoD Performance and Accountability Report 106 Part 2: Performance Information
Our goal for FY 2009 is to ensure that all deployable units are trained at Joint National Training Center-certified events, and that all individual personnel receive relevant and certified joint education. We also are developing specific outcome measures of training value to assess the efficiency and effectiveness of primary sources of joint education and training for both individual and unit based training evolutions. Measures are being developed for each of the three leading initiatives of training transformation:
• Joint Knowledge Development and Distribution Capability (JKDDC) metrics will focus on the ability to think intuitively joint and to create a “reach back” capability, and subsequently to assess the associated effect on the forces’ readiness.
• Joint National Training Center (JNTC) measures will evaluate the live, virtual, and constructive joint training environment and its ability to increase unit readiness prior to arrival at the Combatant Commands.
• Joint Assessment and Enabling Capability (JAEC) metrics will consider the overall outputs of the JNTC, JKDDC, and transformation as a whole. They will use the JAEC architecture to assess throughput, innovation, and transparency of training, education, and experience in individual and unit categories.
Performance Results for FY 2004. The JAEC had planned on shifting exclusively toward outcome-based metrics in 2004, but the policies and infrastructure required to measure outcomes against their associated standards do not yet exist. By the end of FY 2005, the JAEC will have performed its first block assessment of training transformation, and expects to have a complete set of outcome-based measures and assessments by that time. Currently, the JAEC is using a combination of activity-based measures (milestones) and outcome-based measures where they are available. The completion of the Defense Integrated Manpower and Human Resources System and Defense Readiness Reporting System databases will be the primary data sources for JAEC assessments.
The JKDDC is on track to receive initial operating capability by January 2005. During FY 2004, we verified the JKDDC requirement and created a distribution federation.
The JNTC is on track to achieve initial operating capability by October 2004. At that time, the U.S. Joint Forces Command will have certified that the types of training we are doing are appropriate and responsive to the needs of the Combatant Commanders. In the long term, after the JNTC has achieved its initial operating capability and we have a validated ability to provide an appropriate level of joint context, The Joint Warfighting Center will work with the Combatant Commands and Services to identify and qualify organizations that can conduct JNTC-accredited events. This effort will require the continued close cooperation between JNTC-accreditation representatives at Joint Warfighting Center and their Combatant Command and Service counterparts. The JNTC accreditation process is expected to continue through full operational capability in FY 2009.

DoD Performance and Accountability Report 107 Part 2: Performance Information
Outcome Goal: Define and develop transformational capabilities. The metrics that will help us achieve the ability to know whether we are transforming along the right path are all under development. Nevertheless, achieving this goal is one that must be pursued despite the challenges of foreseeing future threats.
Activity Metric: Deny Enemy Advantages and Exploit Weaknesses End-state Metric FY 2002 FY 2003 FY 2004a
Explicit strategic outcomes and effectiveness measures for DoD counter-intelligence activities
Established the Defense Counter-intelligence Field Activity
Established an Under Secretary of Defense for Intelligence
• Developed, managed and executed the polygraph program in support of Joint Task Force Guantánamo Bay, Cuba.
• Identified 22 directives and instructions related to counterintelligence for revision.
• Implemented common DoD policy for special access programs, industrial security, and safeguarding of biological select agents and toxins.
• Developed standards for horizontal integration activities.
• Established an Intelligence Campaign Plan concept and timeline for implementation.
a The FY 2004 data are final.
Metric Description. Denying enemy advantages and exploiting weaknesses is at the core of the work by the Under Secretary of Defense for Intelligence. Our long-term goal is to establish strategic outcomes and efficiency measures to help us gauge the effectiveness of our intelligence activities, and thus improve our training and associated program structures. However, intelligence is a vast enterprise. Many domestic, international, and organizational variables contribute to the success of the overall program. Thus, the task of developing enduring outcome goals and measures involves a significant amount of developmental research and analysis.
There are four fundamental areas that contribute to the success of any counterintelligence program: (1) ensuring that the defense intelligence security, strategy, policy and processes are aligned for maximum effectiveness and efficiency; (2) ensuring
the horizontal integration of defense intelligence activities – that is, the communication among and within agencies – promotes increased information sharing; (3) aligning counterintelligence plans and architectures with the goals of military operations and overall national security; and (4) supporting the warfighter in the most efficient and effective manner possible.
Our horizontal integration roadmap attempts to rationalize all these activities within a single framework. Specifically, horizontal integration describes the processes and capabilities to acquire, synchronize, correlate, and deliver to the National Security Community (defense, intelligence, and homeland security) the kind of timely, comprehensive, and integrated information needed to improve decision-making and subsequently operational effectiveness. The kinds of data integrated within the horizontal integration framework extend across all missions, all disciplines, and all domains. However, the full effect and potential of such integration will be realized only when there is a mission-centric construct focused on outcomes, and data “usability” maximizes value to consumers across the national security enterprise. We also must ensure all consumable data meet network-centric standards and are broadly available to all users. This means providing end-to-end management and integration of information and intelligence functions.
The centerpiece of our ongoing initiative to remodel defense intelligence is a new intelligence concept known as Intelligence Campaign Planning or ICP. ICP is a comprehensive methodology for integrating intelligence into a Combatant Commander’s adaptive planning and operations process. The ICP will make intelligence an operational and shaping tool for the commander, not just a supporting staff function. Accordingly, this approach will help integrate intelligence into the commander’s adaptive planning process by:
• Producing a complete ICP that can be used by a Theater Director of Intelligence (J2) for campaign design, operational plan(s), operational sequencing, and operational synchronization.
• Enabling intelligence estimates to flow dynamically and continuously throughout all phases of an operation;
• Creating a global ISR (intelligence, surveillance, and reconnaissance) process

DoD Performance and Accountability Report 108 Part 2: Performance Information
that is adaptable, agile, and flexible enough to support commanders at every echelon.
• Establishing a network-centric approach to collection, analysis, and dissemination.
Ongoing Research: The cornerstone of horizontal integration efforts is a common lexicon and understanding of the problem. Therefore, the first priority for this overall suite of activities is to complete a definitive review of all existing policies or directives relating to counterintelligence. The review is being conducted within the collaborative framework for intelligence activities provided by our recently established horizontal integration roadmap.
Timeline for Completion: The policy review and final approval of the horizontal integration roadmap will be completed by the end of FY 2005.
Performance Results for 2004: Progress is underway in each of our four main areas of counterintelligence activity:
• Ensuring that the defense intelligence security, strategy, policy, and processes are aligned. Over the last year, we identified 22 directives and instructions related to counterintelligence that need to be revised or rewritten. We also worked with various agencies to address policy shortfalls and develop consistent, defense-wide intelligence policy for special access programs, industrial security, and for safeguarding select biological agents and toxins. The goals and standards for successful horizontal integration were reflected in the Secretary’s annual planning guidance, in our national space policy for space support missions, and in the strategic plans and architectures of the combat support agencies. Through the end of this fiscal year, we will extend these goals and standards into other policy documents, including personnel evaluations and congressional responses.
• Ensuring the horizontal integration of defense intelligence activities. During FY 2004, and in response to a Congressionally directed action, we developed an ISR Roadmap. The ISR Roadmap is now in mid-level coordination, and should be issued in early FY 2005. This roadmap cuts across the defense intelligence community and synchronizes a large number of ISR platforms and capabilities that require integration. In addition, the Under Secretary for Intelligence now chairs the ISR Integration Council that oversees integration policy for defense ISR activities. We also launched the Demonstration
and Exercise Project designed to champion or sponsor Advanced Technology Demonstrations that could enhance intelligence horizontal integration. A series of tabletop “war games” were conducted to identify issues and explore cross-functional insights and innovative ideas.
• Aligning counterintelligence plans and architectures with the goals of military operations and overall national security. During the past fiscal year, we began a study of Pentagon counterintelligence needs, and we are working closely with Pentagon security officials to complete the study and resolve any shortfalls. The early findings of another study of the DoD counterintelligence polygraph program provided insights when we were asked to develop, manage, and execute the polygraph program in support of the Joint Task Force Guantánamo Bay.
• Support to the warfighter. During FY 2004, we directed the U.S. Joint Forces Command to provide a fielded ICP capability within 2 years. We also developed the Joint Intelligence Operations Center organizational concept, which is designed to integrate the intelligence function of the Combatant Commander’s intelligence and operations staffs. Finally, we initiated a study of insider threats, using a model developed by one of the national labs.
Activity Metric: Make Information Available on a Network that People Depend On and Trust
End-state Metric FY
2001 FY
2002 FY
2003 FY2004 a
• Number of systems that support the Internet Protocol Version 6 (IPv6)
• Number of systems that meet information assurance standards
No historical data: new metric
Began transition of selected systems and weapons to IPv6.
a The FY 2004 data are final.
Metric Description. Moving information securely, quickly, and accurately, is a vital combat multiplier. Our ability to build a worldwide information net, populate it with information needed by military commanders, and then use the network for command

DoD Performance and Accountability Report 109 Part 2: Performance Information
and control has been limited by the amount of information that can flow through the network and be processed at any given time. In response, we have set a goal to build a Global Information Grid (GIG) to allow us to:
• Achieve a ubiquitous, secure, and robust network.
• Eliminate bandwidth, frequency, and computing capability limitations.
• Deploy collaborative capabilities and other performance support tools.
• Secure and assure the network and the information.
Ongoing Research. The Director, Strategic Resource Planning for the Assistant Secretary of Defense for Networks and Information Integration is currently working with the Deputy CIO and the MITRE Corporation to develop outcome and output metrics to measure progress toward achieving the strategic planning goals of DoD’s Information Technology (IT) Plan.
Timeline for Completion. Metric development should be complete by the end of FY 2005.
Performance Results for FY 2004. In March 2004, the Secretary of Defense issued guidance for the implementation of measures for building the GIG transport. Components were directed to use the Internet Protocol Version 6 (IPv6) Transition Plan to ensure IPv6 is implemented on appropriate IT, C4ISR (command, control, communications, computers and intelligence, surveillance, and reconnaissance), and weapons systems, with a goal of transitioning all defense systems to IPv6 by CY 2008.
Performance Metric: Monitor the Status of Defense Technology Objectives
Metric FY 2001 Actual
FY 2002 Actual
FY 2003Actual
FY 2004 Target/Actuale
Percentage of defense technology objectives (DTOs) evaluated as progressing satisfactorily toward goalsa
96 97 96 >70/94
DTO evaluated in biannual reviewb
180 149c 163c 180
Total number of DTOsb,c,d 326 401 386 404 a “Progressing satisfactorily” includes DTOs rated as “green” or “yellow.” b The number of DTOs evaluated and the total number of DTOs are provided for information only; no targets are established. c The numbers for DTOs evaluated in FY 2002 and FY 2003 were transposed in the FY 2003 PAR. d The total number of DTOs is the sum of all DTOs contained in the Joint Warfighting Science and Technology Plan and the Defense Technology Area Plan, dated February of the calendar year prior to the fiscal year the reviews are conducted. e The FY 2004 data are final.
Metric Description. Technological superiority has been, and continues to be, a cornerstone of our national military strategy. Technologies such as radar, jet engines, nuclear weapons, night vision, smart weapons, stealth, the Global Positioning System, and vastly more capable information management systems have changed warfare dramatically. Today’s technological edge allows us to decisively prevail across a broad spectrum of conflicts and with relatively few casualties. Maintaining this technological edge has become even more important as the size of U.S. forces decreases and high-technology weapons are now readily available on the world market. Future warfighting capabilities will be substantially determined by today’s investment in science and technology (S&T).
Our S&T investments are focused and guided through a series of defense technology objectives (DTOs) developed by senior planners working for the Secretary of Defense, the Chairman of the Joint Chiefs of Staff, the Military Departments, and defense agencies. Each of these objectives highlights a specific technological advancement that will be developed or demonstrated, the anticipated date the technology will be available, the specific benefits that should result from the technological advance, and the funding required (and funding sources) to achieve the new capability. These objectives also specify milestones to be reached and approaches to be used, quantitative metrics that will indicate progress, and the customers who will benefit when the new technology is eventually fielded. This metric measures the percentage of DTOs that are progressing satisfactorily toward the goals established for them.

DoD Performance and Accountability Report 110 Part 2: Performance Information
Technology Area Review and Assessment (TARA) teams—independent peer review panels composed of approximately six experts in relevant technical fields from U.S. government agencies, private industry, and academia—assess the DTOs for each program every two years. The reviews are conducted openly; observation by stakeholders (typically, senior S&T officials, members of the joint staff, and technology customers) is welcomed.
The TARA teams assess the objectives in terms of three factors—budget, schedule, and technical performance—and rate the programs as follows: • Green—progressing satisfactorily toward goals. • Yellow—generally progressing satisfactorily, but
some aspects of the program are proceeding more slowly than expected.
• Red—doubtful that any of the goals will be attained.
The benefits of these ratings are many. Not only do they reflect the opinions of independent experts, but also they are accepted and endorsed by stakeholders. These reviews result in near real-time adjustments being made to program plans and budgets based on the ratings awarded.
The TARA Chairman’s findings are briefed to the Defense S&T Advisory Group (DSTAG) for further resolution of programmatic and technical issues. Adjustments are made to program plans and budgets based on the ratings and recommendations from the DSTAG. The DTO ratings are semi-quantitative metrics.
Performance Results for FY 2004. The Department met its performance target and no shortfall is projected for FY 2005. Although actual performance continues well above target, the target will be maintained at 70 percent due to the inherent high risk of failure in technology development.
Activity Metric: Populate the Network with New, Dynamic Sources of Information to Defeat the Enemy
End-state Metric FY 2001 FY 2002 FY 2003 FY2004 a
Percentage of DoD information available via net-centric solutions.
No historical data: new metric.
• Published net-centric checklist.
• Began portfolio management.
a The FY 2004 data are final.
Metric Description: Our military commanders use information of all kinds—not only intelligence data—to “see” the battle space, and thus outwit and overcome our adversaries. The net-centric enterprise architecture we are building will allow commanders to engage the network at anytime from anywhere using a military version of the Internet search engine, without needing cumbersome base support. Data will be posted and ready for download and analysis as soon as it arrives, anywhere on the network. The metric being developed will ultimately measure progress toward this goal.
The mission of DoD’s Chief Information Officer (CIO) is to support the Secretary’s transformation goals by advancing net-centric operation through policies, program oversight, and resource allocations. The key attributes of the CIO’s strategy are:
• Ensuring data are visible, available, and usable—when and where needed—to accelerate decision-making.
• “Tagging” all data (intelligence, non-intelligence, raw, and processed) with metadata to enable discovery of data by users.
• Posting all data to shared spaces to provide access to all users except when limited by security, policy, or regulations.
• Advancing interoperability from point-to-point interfaces to “many-to-many” exchanges typical of a modern network environment.
Ongoing Research. The CIO for the Department is the Assistant Secretary for Network Information and Integration. The CIO heads a defense-wide effort to define processes for assessing a program’s transition to a net-centric environment. The CIO also helps Services, defense agencies, and program managers incorporate net-centric attributes, implement data information assurance strategies, and align programs with the Joint Technical Architecture and the Net-Centric Operations Warfare Reference Model. This will ensure priorities and transition plans of all defense activities are in line with Global Information Grid (GIG) enterprise services within their respective programs. The Director, Strategic Resource Planning is responsible for developing this metric, working with the Deputy CIO and the MITRE Corporation.
Timeline for Completion. This metric will be completed in FY 2005.

DoD Performance and Accountability Report 111 Part 2: Performance Information
Performance Results for FY 2004. The July 2003 CIO memorandum, “Joint Net Centric Capabilities,” directed the review of any C4ISR (command, control, communication, computers, intelligence, surveillance and reconnaissance) programs affecting one of 13 specific activities.
In February 2004, the Net-Centric Checklist was issued to assist program managers in understanding net-centric attributes required for programs to move into the GIG’s net-centric environment.
In March 2004, the Secretary of Defense approved DoD-wide guidance for populating the GIG with data, and directed compliance with the CIO net-centric data strategy, the GIG architecture, and the Net-Centric Operations and Warfare Reference Model. Services and defense agencies were directed to apply the business rules established by the Department’s common enterprise domains, and to integrate Net-Centric Enterprise Services to avoid duplicating capabilities.
That same month, the Deputy Secretary issued “Information Technology Portfolio Management,” which institutionalized portfolio management for information technology. This will ensure information technology solutions are analyzed, selected, controlled, and evaluated consistent with the GIG Integrated Architecture.
Outcome Goal: Define skills and competencies for the future. The Department has launched a two-phase research initiative to define a conceptual framework for the development of skills, knowledge, and competencies necessary for a networked organization employing mature information age capabilities. Paramount to the research objectives is understanding key aspects of human and organizational behaviors. Basic research completed in Phase I highlighted the key relationships between the Physical, Information, and Cognitive Domains for Network Centric Operations (NCO). Phase II research, which is ongoing, is expected to identify a series of behavioral trends and key competencies that can then be incorporated within the Universal Joint Task List and the Joint Training Master Plan.
These efforts and others will be measured by the following metrics.
Activity Metric: Attract, Recruit, Retain, and Reward High Quality People from Government, Industry, and Academia
End-state Metric FY 2001 FY 2002 FY 2003 FY 2004 a
• Recruiting and retention targets for specific skills
• Percentage fill by skill category No historical data: new
metric
• Designated the Office of the USD for Intelligence as a Defense Civilian Intelligence Personnel System organization.
• Developed an interim policy for common human resources system for DoD intelligence community.
a The FY 2004 data are preliminary.
Metric Description. To accomplish our ambitious goals, the defense intelligence community needs the best people we can find. We need people with broad and varied experiences who are agile problem solvers, who can operate in an environment that changes as the threat changes. Legislation such as the National Security Personnel System (NSPS) will give us the ability to hire the people we need. Accordingly, on May 2, 2004, the Deputy Secretary of Defense designated the Under Secretary of Defense for Intelligence (USD(I)) as a Defense Civilian Intelligence Personnel System (DCIPS) organization, dedicated to attracting the best and brightest to careers in defense intelligence. The authorities granted by the NSPS and DCIPS will allow us to tie performance to the defense intelligence strategy, and strive to improve job satisfaction by providing clear direction and quantitative objectives against which an employee can measure his or her progress.
A key first step – and an ongoing effort – is the development of an overarching directive establishing a common human resources system for the DoD intelligence community.
Ongoing Research. Develop community goals and standards for subcomponents of the DCIPS common human resource program.

DoD Performance and Accountability Report 112 Part 2: Performance Information
Timeline for Completion. Development work will continue through the end of FY 2005, with initial fielding slated for FY 2006.
Performance Results for 2004. The DCIPS covers the Department of Defense, the National Security Agency, the Defense Intelligence Agency, the National Geospatial Agency, the National Reconnaissance Office, the Military departments, the Office of the Under Secretary of Defense for Intelligence, the Counterintelligence Field Activity, and the General Counsel. During FY 2004, a working group from all of these agencies and components completed 11 subchapters of an overarching policy plan. This plan will serve as interim authority to implement the process pending formal coordination and publishing of the subsequent chapters.
Performance Metric: Strategic Transformation Appraisal
Metric FY
2001 FY
2002 FY 2003 FY 2004 a
Assessment of “gaps” or adjustments needed to remain on track
No historical data: new
metric
Published first Transformational Planning Guidance
Completed first strategic transformation appraisal
a The FY 2004 data are as of the 4th Quarter (estimate)
Metric Description. The Department’s overall transformation roadmaps address activities, processes, resources, and incentives to foster and promote innovation and transformational activities, including concept-based experimentation processes, education and training programs, and the use of operational prototypes. Each Service also prepares an individual roadmap, which is updated annually. Defense agencies submit their annual roadmap updates to the U.S. Joint Forces Command, which develops a consolidated “joint” roadmap. Each year, the Office of Force Transformation evaluates the progress and plans reported in the individual and joint roadmaps, and produces an assessment of “gaps” or adjustments indicated for future action. These roadmaps point to a shared future vision and provide actionable language for implementation. They complement the program and budget process, ensuring coherence between resource allocation decisions and future concept development and experimentation, and provide a baseline for managing
transformational change within the force. Additionally, they articulate the Service and defense agency strategies for implementing and managing the “risk” embodied in transformation.
Performance Results for FY 2004. The Office of Force Transformation completed its first Strategic Transformation Appraisal in January 2004. The appraisal assesses defense-wide trends in transformation and recommends plan or resource adjustments to maintain progress toward the Secretary’s transformation priorities. The January 2004 appraisal showed where information-age trends are taking the Department:
FY 2003 versus FY 2004 Strategic Appraisal
FY 2003 FY 2004
• More expeditionary • More networked • Designed to leverage the
exterior positions • Leverage increasingly
persistent intelligence, surveillance, and reconnaissance
• Tighter sensor-shooter timelines
• Value information superiority
• Joint interoperability at the operational level
• Focus on unmanned capabilities
• Lighter, more agile, easily deployable units
• Knowledge-enabled warfare • Improve vertical / horizontal
intelligence distribution • Strengthen intelligence
capabilities for the 21st century
• Joint force synergy • Demand-centered intelligence • Jointness to the lowest
appropriate level • Substitution of capital for labor
Beginning in FY 2005, the appraisal will be submitted each November to the Secretary of Defense.

DoD Performance and Accountability Report Part 2: Performance Information
Page intentionally left blank.