Part 2 of 2 - NASDAQ OMX Corporate...
65
2014 Investor Day May 6, 2014 New York, New York 1 Part 2 of 2
Transcript of Part 2 of 2 - NASDAQ OMX Corporate...

2014 Investor Day May 6, 2014
New York, New York
1
Part 2 of 2

Bill Weber VP, General Manager,
Marketing and Product
Development - Extremities
New Markets
2

Nerve Repair and Protection
29%
25%
24%
22%
2013 US Nerve Market (~$50M)
Autograft • Patient-derived nerve
Current Technology
Integra Nextgen Nerve • Environment to encourage Schwann cell
Integra Stryker
Axogen Other Launch in 2016
Manufacturer Products Product
Composition
Clinical Evidence
Integra NeuraGen Nerve Guide
NeuraWrap Nerve
Protector
Bovine Collagen
Bovine Collagen
Human prospective randomized trial;
Equivalent to suture/Autograft
AxoGen Avance Nerve Graft
AxoGuard Nerve
Connector
AxoGuard Nerve Protector
Allograft Nerve
Porcine SIS
Porcine SIS
Registry; Equivalent to Autograft
Stryker NeuroMatrix & NeuroFlex
NeuroMend
Bovine Collagen
Bovine Collagen
Limited data referenced
3

Chronic Wounds
34%
33% 8%
4%
21%
2013 US Wound Technology Market ($0.8B)
0.0
0.6
1.2
1.8
2.4
2013 2014 2015 2016 2017 2018
Wo
un
ds
in
mil
lio
ns
Hard-to-Heal Volume Projections
Chronic Wounds Acute Wounds
Current Products Composition Feature/Benefit Clinical Evidence
Integra BMWD Bilayer matrix; silicone + type 1
collagen
Potentially fewer applications
& single step
Apligraf Dermal layer (fibroblasts in type 1
collagen) + epidermal layer
Multiple applications, single
step supported by MC-RCT
Dermagraft Cryopreserved fibroblasts in a
bioabsorbable ECM
Multiple applications, single
step supported by MC-RCT
Epifix Human amniotic membrane Multiple applications, 5-yr shelf
life, activates healing, SSPS
Oasis Porcine SIS ECM Low cost, multiple applications,
off the shelf, MC-RCT
Chronic wounds increasing at twice the rate of
acute wounds
Smith & Nephew Integra All Other
Organogenesis MiMedx Group
*
* Based on positive outcome of DFU trial 4

Our Path Toward Success – DFU and Beyond
Near-Term Milestones
2H 2014:
• Complete trial
• Submit regulatory filings to FDA
• Submit randomized clinical trial results for publication
2015
• Potential regulatory approval
• Apply for reimbursement (MACS & private payers)
2016
• Launch DFU product into the wound clinic
2017 & beyond
• Expand indications and reimbursement
Commercial Highlights
Revenue generation depends on:
• Approval and reimbursement
• High-cost vs. low-cost
• Health economics
• New indications and broader reimbursement
• Enterprise selling
Distribution options
• Begin by leveraging existing channel
• Ultimately build focus in the clinic
Other opportunities
• Expand product offering (PD and business
development)
Expanding indications and increasing clinical evidence
5

Tissue Technologies… New Opportunities
Franchises Skin: Acute & Chronic
Nerve: Repair & Protection
Tendon: Repair & Protection
Bone: Fusion (Spine and Extremities)
Opportunities: Restoration of Articular
Surfaces & Soft Tissue Reconstruction
Technology Platform Tissues Engineering: Xenograft,
Allograft & Synthetic
Biologic & Small Molecules: Allograft:
Harvested & Recombinant Synthetic
Cell-Based Therapies: Autograft or
Allograf
New Regenerative Opportunities Near Term Pipeline: Nerve Matrix
Mid-Term Opportunities: Expanded
indications
Exploratory: Next Gen Regen Matrix
BD Opportunities: Cell-based and
Allograft technologies
Strong franchise base and robust technology platform…
…creates unique near, mid and long term opportunities
6

2-Piece Total Ankle Replacement
Design Principles
• Simplified instrumentation to Limit Uncertainty
• Repeatable/Reproducible technique
• Anatomic/customizable to patient and bone sparing
Key Opinion Leaders
• Global design team
• Orthopedic and Podiatric representation
Regulatory Path: 510(k) and CE
26%
30%
24%
18%
2%
Total US Ankle Replacement Market (~$60M)
$0
$20
$40
$60
$80
$100
$120
2013 2014 2015 2016 2017 2018
Mil
lio
ns
Projected Market Growth
Wright SBI Other
Tornier Depuy
7

2-Piece Total Ankle: New Product Introduction
Design Plan
Design Qualification Phase
• Completed 4 of 5 design labs to date
• 5th design lab will freeze design
Design Verification and Validation
• Perform physical characterization and testing of
device and predicate
• Validate design with surgeons from US and key
International markets
Global Launch
• Scale up from prototype to full-scale production to
build inventory required for global launch
• Build global KOL team to assist with product roll-out
and surgeon education
• Global awareness and adoption key to success
Timeline
2H 2014 • Design Freeze
2015
• Complete Design Verification and Validation
2016
• Regulatory Approval and Global Launch
8

Shoulder
19%
16%
22%
21%
6%
16%
US Shoulder Market ($0.7B)
Anatomic Shoulder
• Reproduces existing anatomy
• Patients with bone-on-bone osteoarthritis and intact rotator cuff tendons
Reverse Shoulder
• Reverses the anatomy
• Patients with severe arthritis and/or torn rotator cuff
• Revision of a failed anatomic shoulder
Product Feature/Benefit Launch Status
Reverse Shoulder Provides choice Launched Q3 13
Proximal Humeral Plate Addresses fracture Launched Q4 13
Advanced Glenoid Solves glenoid loosening 2015
Conventional Pegged Glenoid Ease of use 2015/2016
Advanced shoulder options Bone sparing Pipeline
Pyrocarbon HRA Restoration of function Pipeline
Pyrocarbon Hemi Option for younger patient Pipeline
7%
10%
Market
Growth
Zimmer Depuy Exactech
Tornier Biomet Other
9

Integra’s Titan Shoulder System
Benefits of Modularity:
• Simplifies conversion from primary to a reverse shoulder –
saves OR time
• Multiple body heights allows for better anatomical fit and
optimal stability
• Utilization of instruments across primary, fracture, and
reverse shoulders reduces number of required instrument
trays
Benefits of PyroCarbon – Building off Modularity:
• Builds off the same stem/body platform
• Improved long-term functional outcome
• Reduction of pain
• Mitigation of glenoid loosening
• Preserves options for future revision procedures
Only modular system that potentially benefits from pyrocarbon
Solid foundation designed for the future
10

Shoulder Pipeline
Three-pronged approach to building shoulder:
• (1) Complete conventional portfolio of products
• (2) Address glenoid loosening with advanced glenoid solutions
• (3) Develop disruptive technologies that drive better clinical outcomes
(i.e. improved long-term functional outcome and reduction of pain)
2011 2012 2013 2014 2015 2016+
US
Int’l
Fracture
Plate
Advanced
Glenoid
Platform
PyroHemi™
PyroTITAN®
PyroHemi™
Reverse
Shoulder
Fracture
Plate
WW Launch
Total Shoulder
PyroTITAN®
Reverse
Shoulder
11

Paul Gonsalves SVP, Enterprise Selling and
Corporate Marketing
Enterprise Selling
12

Significant Changes in Clinical and Financial Models
Acute
Inpatient
Care
Specialty
Care
Primary
Care
Acute
Inpatient
Care
Specialty
Care
Primary
Care
Depending on the market, over the next 3 years payment models will change through new legislation,
regulations, market dynamics and activist payors/employers requesting:
Fee-for-Service model Episodic model
13

Hospital
Admin
Surgeon
Sales Team
Media
ACO’s
Payor
Growing
Declining
GPO/
IDN’s
Patient
Strong relationships between physician and sales team changing to include broader fabric of influencers
Evolving Healthcare Marketplace - Stakeholders
Changing Influence
14

“Episodic” Payment
• Support engagement of patients in
treatment decision-making process
• Pay for team-based care for the total
episodic care
• Pay based on evidence-based care
• Creates opportunities to engage with
providers at highest levels - Enterprise
• Rewards innovative approaches to care
delivery – both provider and vendor
• Rewards team based approach now
including technology provider/vendor
Fee-for-Service
• Reward volume over value of services
• Discourage coordination of care over
time and across the continuum of care
• Undermine strong physician/patient
relationships and team-based care
• Drives specialization by segment or
disease state, fails to look at broader
healthcare econ of provider
• Relies heavily on vendor/physician
relationship – large teams
• Narrow focus on technology versus
solutions & partnership
Changing Marketplace – Providers Shifting To Adapt
Provider Community
FROM TO
Pro
vid
er
Ma
nu
factu
rer
Accelerating alignment to shared goals
H
15
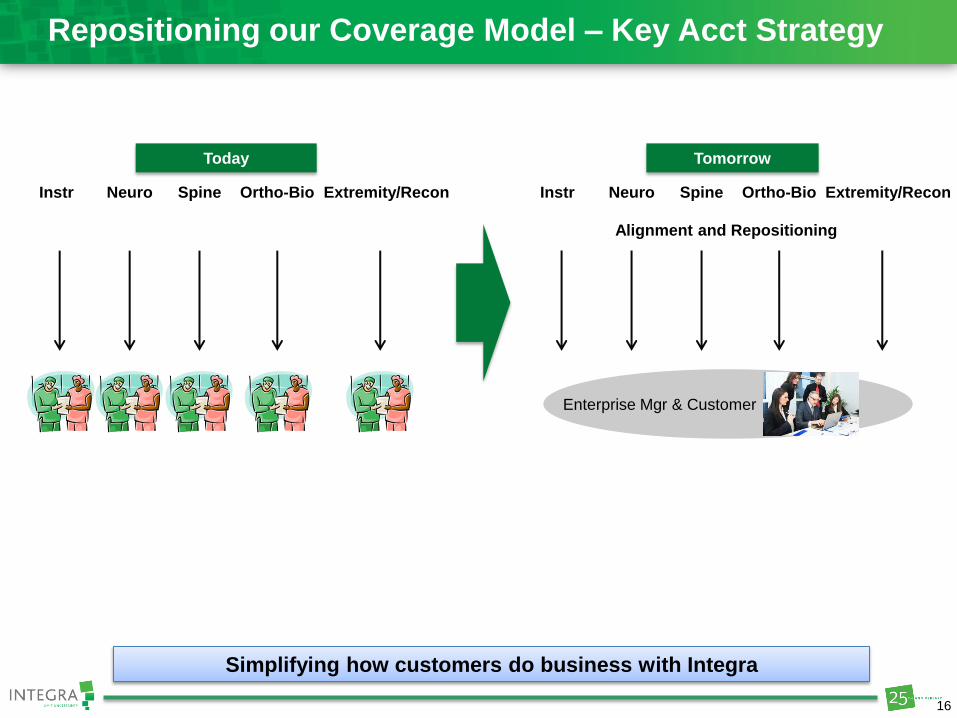
Repositioning our Coverage Model – Key Acct Strategy
Instr Neuro Spine Ortho-Bio Extremity/Recon
Today
Instr Neuro Spine Ortho-Bio Extremity/Recon
Tomorrow
Enterprise Mgr & Customer
Alignment and Repositioning
Simplifying how customers do business with Integra
16

Competitive Advantages
Company Clinical
Support
Multi Product
Solutions
Cost
Savings Agility
Typical Single-modality Co
INTEGRA
Typical Large Diversified Co
2
5
%
2
5
% 2
5
%
2
5
%
Integra Core Customer Value: • Regenerative Platform - Company anchored in cutting edge science, clinically disruptive and aligns with the
medical goals of self-healing
• Organizational Structure - Aligned and flat allows us to take calculated risks-pilot, sales strategies to grow our business
• Speed and Agility - Allows us to take advantage of new opportunities
Integra positioned to WIN with agile organization, differentiated product
offering and culture of collaboration
2
5
%
2
5
%2
5
%
17

Integra Integrated Contracting
Where? • Academic accounts
• Integrated delivery networks
• Government accounts
• Large regional networks/affiliates
• Group purchasing organizations
How? • Technical/clinical support
• Single point of contact
• Knowledge of customer business structure
• Multi-product/multi-vendor solutions
• Enterprise-wide pricing, purchasing and service
Customer Segments
Academic Regenerative & Organizational structure
Financially Driven - Cost Constrained Enterprise contracting & rapid decision making
Stand Alone - Stable, High Control Portfolio contracting
Outcomes Driven Building deeper clinical & scientific teams to work with
our clients
18

VA / DoD… Building Out Sales Volume in Largely Untapped Customer Base
Contracting partner in place
1 contract for Surgical
instruments
Delivering $4M per year
Introduce Enterprise leader in
January
Develop portfolio approach
Begin broad discussion to build
out portfolio approach
Successful partnership
accelerating
Move from single product to
multi-product contract
Consideration for Neuro, Recon
and Orthobiological product
underway = $9M
Integrated Delivery Systems… Building Deeper Relationships with Current Customers
Partner with general hospital in
place, one division
Contracting for neurosurgical
equipment only
Delivering $1M per year
Introduce Enterprise leader in
January
Develop portfolio approach
Begin broad discussion to
build out portfolio approach
including Skin, Recon, Spine
and Surgical instruments
Successful partnership
accelerating
Moving from single product to
ACO and clinical program
development
Customers – Delivering Impact
Innovative approach to evolving market
19
John Mooradian CVP, Global Operations and
Supply Chain
Operational
Improvements
20

Cumulative Savings Bridge
• Closed 6 sites
• 20 global sourcing programs
• Consolidated 50+ suppliers
• Phase 1 footprint
• Savings off-set by quality
spend rationalization
$10M Savings
2012 - 2013
• 5 products families transferred
• Closing 2 additional sites
• Executing another 5-10
sourcing programs
• Continuing footprint
rationalization
• Close on quality plans
$23M Cumulative
Savings
2014
• End state: 15-20 sites
• 5 centers of excellence
• Kitting and distribution centers
• Productivity programs active in
all areas of the business
• Centralized functions utilized to
reduce overhead cost
• Optimal structure and cost
• Inventory optimization
$100M Cumulative
Savings
2018
300 – 400 bps of margin improvement by 2018
Committed to $100M of cumulative savings by 2018
21

Supply Chain Program-to-Date Savings
$2.7
$0.1
$1.0
$1.5
Total Program Savings 2013
Production Materials
Non-Production Spend
Services
Inventory Scrap
Total
Savings
$5.3M
• Established centrally-led strategic sourcing group to
optimize all areas of spend (company-wide)
• Spend mapping and analysis directed group to
opportunity areas
• Leveraged spend with preferred suppliers identified
through strategic sourcing process
• Service providers targeted to go from 50+ to 2
preferred
Sourcing Projects
Production Materials:
• Orthopedic Metals, Plastic Tubing, Plastic Parts
Non-Production Materials:
• Insurance, Consumables (Supplies)
Services:
• Temporary Staffing, Travel Management, Janitorial
Cumulative Savings
$-
$3
$6
$9
$12
$15
$18
2012 2013 2014
Milli
on
s
Cumulative Savings Run Rate
Early savings on track
22

Supply Chain Strategy
Suppliers
Sourcing
Team
25+
Sites
25+ Sites
Sourcing Team
Suppliers
Opportunistic
Low hanging fruit
Supplier awareness
Operationalize sourcing
Common approach
Contract terms
Supplier dashboards
Consolidate resources
Accelerate savings
Sustainable savings
Global Strategic Sourcing & Procurement
Production
Materials
MRO* Systems &
Performance
*MRO – Maintenance,
Repair,
Operational Supplies
Packaging
Electronics
Metals
Plastics
Biologics
2012/2013
2014+
Strategic Sourcing Structure
Service &
Support
Non
Production
23

Footprint Rationalization Plan
Complete
Strategic optimization plan 2014
2015 – 2018 Q1 Q2 Q3 Q4
• 6 site
closures
• 5 year
strategic
optimization
plan
• Purchasing
management
team and
structure
• 2014
transfer
plans
• Detailed due
diligence
• Plans
finalized
• Hired core
transfer teams
• Begin
transition
inventory
builds
• Install
equipment at
receiving sites
• Hire labor and
begin training
• Begin
validations at
receiving
sites
• Finish
transition
inventory
builds
• Develop 2015
transfer plans
• Conclude
validations at
receiving sites
• Transfer
remaining
equipment
and inventory
• Close 2
facilities
• Closure of
additional sites
• Complete
transition to
centers of
excellence
• Optimize
capacity
utilization
• Logistics and
distribution
• Lean 6 sigma
program
$4M
(thru ’13)
$15M
(thru ’15)
$50-70M
(thru ‘18)
• 2 site closures
• 5 product family transfers
Going from planning mode to execution
24

Site construction work complete
Over 25 new facility systems tested and qualified
Over 13 manufacturing process systems installed;
first run of skin product successful
Q4 2014 – target for all validation completion
First manufacturing lots release will be 510K
products; PMA products to follow upon FDA
approval
New Plainsboro, NJ, regenerative
medicine manufacturing facility
109 strategy and opportunity
• Skin (510k/pma)
• Private Label expansion
• Growth capacity
• International growth
• Long-term viability of the facility
• Capacity utilization/cost
• Quality and compliance capability
World class regenerative products manufacturing
Quality product delivered on time … every time
• Plainsboro 105 - collagen production
• Anasco, Puerto Rico - collagen, biopatch (private
label), neurogen, medical products
Plainsboro 109 - capacity to grow 3-4x
Regenerative medicine center of
excellence
World Class Manufacturing Facility - 109
Begin production by the end of 2014
25
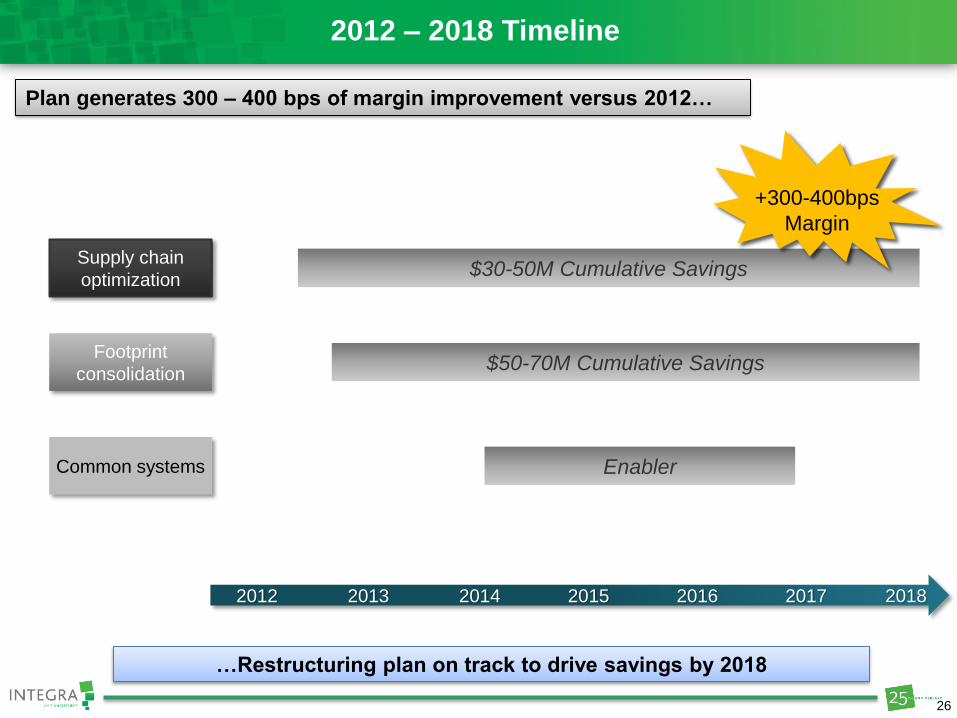
Supply chain
optimization
Footprint
consolidation
Common systems
$30-50M Cumulative Savings
$50-70M Cumulative Savings
Enabler
+300-400bps
Margin
2012 – 2018 Timeline
2012 2013 2014 2015 2016 2017 2018
Plan generates 300 – 400 bps of margin improvement versus 2012…
…Restructuring plan on track to drive savings by 2018
26

Padma
Thiruvengadam CVP, Chief Human Resources
Officer
Organization and
Priorities
27

2014 – 2016 Priorities
Select Key Priorities Tightly Aligned to Our Strategy
Building the capabilities and focusing capacity to achieve our objectives
I. Deliver on restructuring plan: Advance on our plans to achieve 23-24%
Adjusted EBITDA by 2018
II. Deliver consistent growth: 5-7% Organic, 7%+ with M&A
III. Focus and align the portfolio
IV. Make commercial changes to adapt to healthcare reform
V. Leverage scale for commercial advantage and cost competitiveness
28

Areas of Advancement Across the Company
• Enhanced global
commercial capabilities
• Field inventory
management
• Engrain culture of
replicating best practices
– e.g. Plainsboro
• New CSO organization to
increase velocity of
product development
processes
Margin Improvement,
FCF Conversion
Improving Execution
• Strategic sourcing and
footprint plans
• Centers of Excellence –
e.g. manufacturing,
regenerative platform
• Globalized priorities
reduce time to
registration and increase
speed to market
Simplification, Focus,
Consistent Performance
Optimizing the
Company
• Rationalize product
portfolio to focus in
profitable, scalable areas
• Increase capacity in key
areas of focus
• Enable stable supply
• Align portfolio to market
needs
• Introduce wound care
channel
• Achieve peak market
share sooner
5-7% Organic Growth,
M&A upside
Margin and Cash
Improvement
Quality Excellence and
Stable Operations
Accelerating Growth
New Product
Introductions
Building the foundation for profitable growth
29

Governance
Getting the Most Out of Marketing to Support Our Goals
• Implement a global marketing platform… supporting
international growth
• Global commercial owners for key product
franchises
• Leveraging existing channels; assess new channels
• Enhancing and evolving current go-to-market
strategies
• Achieving peak market share sooner
Global Commercial Effectiveness
• Program management fundamentals increase capacity
by enabling:
• Common language
• Common approach
• Simpler processes
• Lean Six Sigma program and operational excellence;
over 600 colleagues
• Yield – more efficient at:
• New product introductions
• International registrations
Framework Measurement
Building Competencies to Enable
Profitable Growth
30
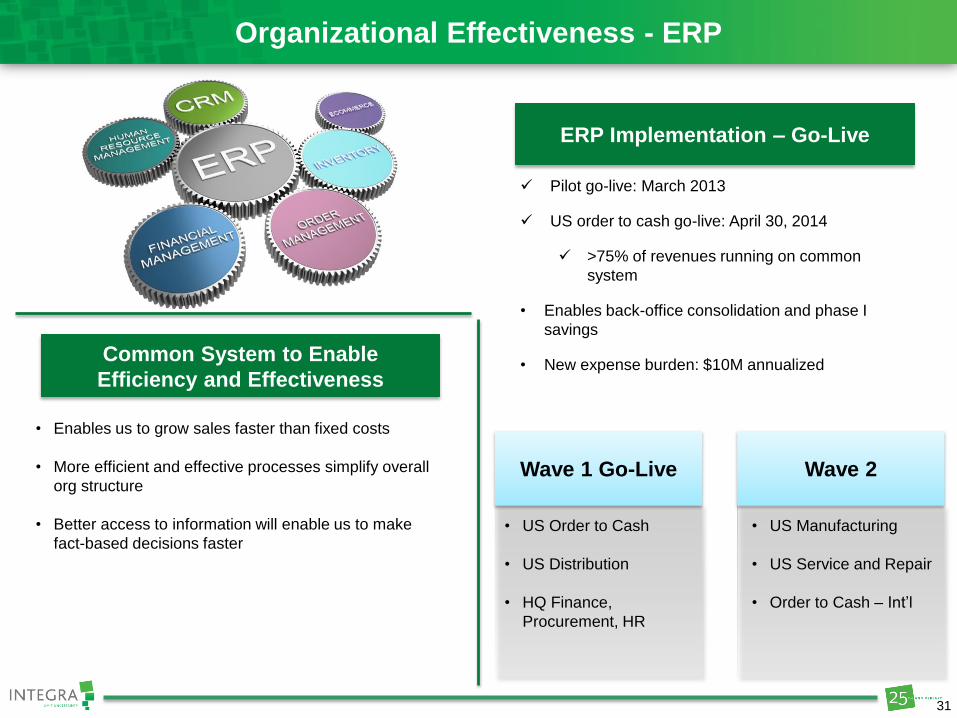
Organizational Effectiveness - ERP
Pilot go-live: March 2013
US order to cash go-live: April 30, 2014
>75% of revenues running on common
system
• Enables back-office consolidation and phase I
savings
• New expense burden: $10M annualized
ERP Implementation – Go-Live
• Enables us to grow sales faster than fixed costs
• More efficient and effective processes simplify overall
org structure
• Better access to information will enable us to make
fact-based decisions faster
Common System to Enable
Efficiency and Effectiveness
• US Order to Cash
• US Distribution
• HQ Finance,
Procurement, HR
• US Manufacturing
• US Service and Repair
• Order to Cash – Int’l
Wave 1 Go-Live Wave 2
31

Operational Model for Growth
Grow the
business Lead to
perform
Drive
execution
Sustain the
platform
Processes in place to execute on growth strategy
Outside-In
Insight, intelligence and
ideas
Inside-Out
Values and culture
Bottom-Up
Execution
Top Down
Strategy
32

Jack Henneman CVP, Chief Administrative
Officer
Financials
33

Financial Summary
Total Revenue Adj. Gross Margin
Operating Cash Flow Adj. EBITDA
$836M$780M$732M
$1,400
$1,200
$1,000
$800
$600
$400
$200
$0
2018E
$1.1 - $1.3B
2014E
$920 - $940M
2013 2012
$831M
2011 2010
$53M
$104M$106M
$59M
60.0%
40.0%
20.0%
0
$200
$150
$100
$50
$0
100.0%
80.0%
2018E
$185M+
2014E
$60 - $80M
2013 2012
$120M
$60M
2011 2010
OCF Adjustments* FCF Conversion
*In 2012, we generated $59.1 million in cash flows from operations, which was reduced by a $29.8 million tax withholding payment in connection with
the release of certain deferred stock units and $30.6 million of accreted interest paid at the maturity of our 2012 Senior Convertible Note.
** FCF Conversion = TTM (Operating Cash Flow – Capital Expenditures) / TTM Adjusted Net Income
*** GAAP Reconciliations can be found in the Appendix.
20.0%19.8%20.6%
15%
18%
21%
24%
27%
2018E
23-24%
2014E
20-22%
2013
15.8%
2012 2011 2010
63.9%
64.9%64.4%64.7%
62%
64%
66%
68%
70%
2014E
65-66%
2013 2012 2011 2010 2018E
68-70%
34

Bridge from 2012 Investor Day Guidance
2017 Targets:
Oct 2012
2013 Actuals 2018 Targets:
Current
Core Revenue Growth 5-7% 0.6% 5-7%
Adj. Gross Margin 68-70% 63.9% 68-70%
Adj. SG&A (% of Rev)* 41-43% 45.1% 41-43%
R&D (% of Rev) 6-7% 6.1% 6-7%
Adj. EBITDA Margin 23-24% 15.8% 23-24%
Adj. EPS Growth 9-13% -24.7% 10%+
Adj. Tax Rate High 20s /
Low 30s 26.8% Low 30s
Adj. FCF Conversion N/A 7.1% >90%
Diluted Shares Outstanding Flat 28.8M ~33-35M
*Adjusting 2012 Adj. SG&A target to move the location of the medical device excise tax (“MDET”) (rounds to 1% of revenue).
In 2012, the MDET was forecast in Adj. EBITDA but was not allocated yet to either gross margin or SG&A.
Changes
from 2012
investor
meeting
Plans enable us to maintain our 2012 long-term targets
35

Revenue Growth
Division 2010 – 2013
Growth Growth Driver
2013 – 2018
Growth
Visible drivers to lead recovery in top line performance
*US Spine & Other segment includes revenue from Spine Hardware, Orthobiologics and Private Label.
• Selling and marketing investments
• New product introductions
• Expansion to near adjacencies
1.3% 2-6%
US Neurosurgery
• Specialty products, clinical focus
• Advantages in enterprise selling
• Value-added services
0.4% 1-4%
US Instruments
• Strong shoulder product pipeline
• DFU, wound care launch
• Specialization of sales channels
14.6% 10-14%
US Extremities
• New products
• Stronger distribution
• Private Label, collagen capacity
5.7% 1-5%
US Spine & Other*
• Focus products, focus markets
• New product launches
• Infrastructure investment
4.4% 9-13%
International
36
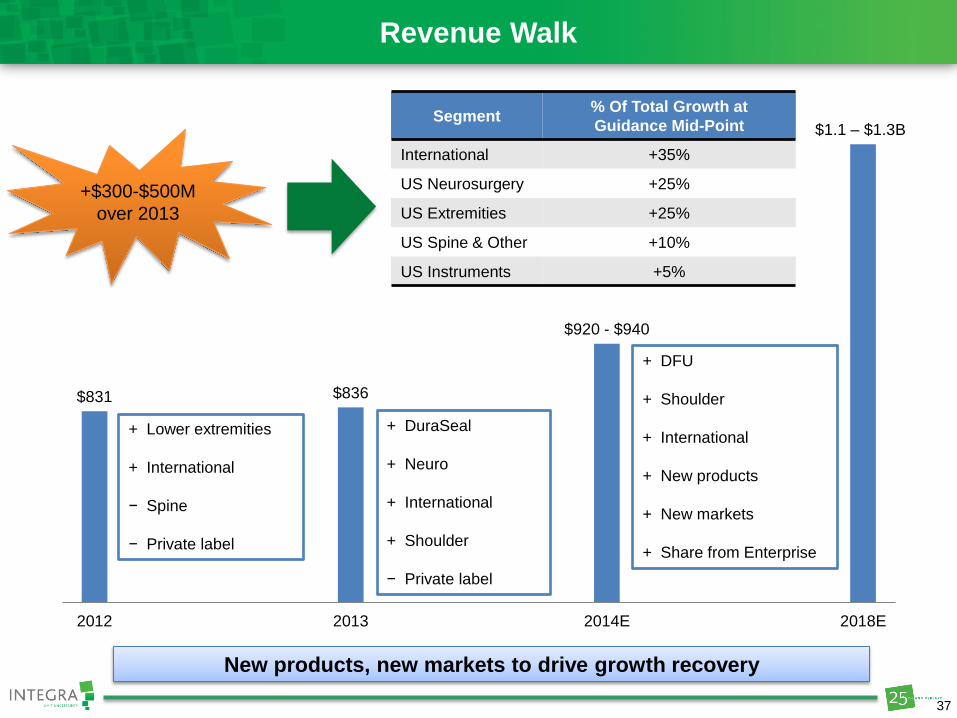
Revenue Walk
$831 $836
$920 - $940
$1.1 – $1.3B
2012 2013 2014E 2018E
+ Lower extremities
+ International
− Spine
− Private label
+ DuraSeal
+ Neuro
+ International
+ Shoulder
− Private label
+ DFU
+ Shoulder
+ International
+ New products
+ New markets
+ Share from Enterprise
+$300-$500M
over 2013
Segment % Of Total Growth at
Guidance Mid-Point
International +35%
US Neurosurgery +25%
US Extremities +25%
US Spine & Other +10%
US Instruments +5%
New products, new markets to drive growth recovery
37
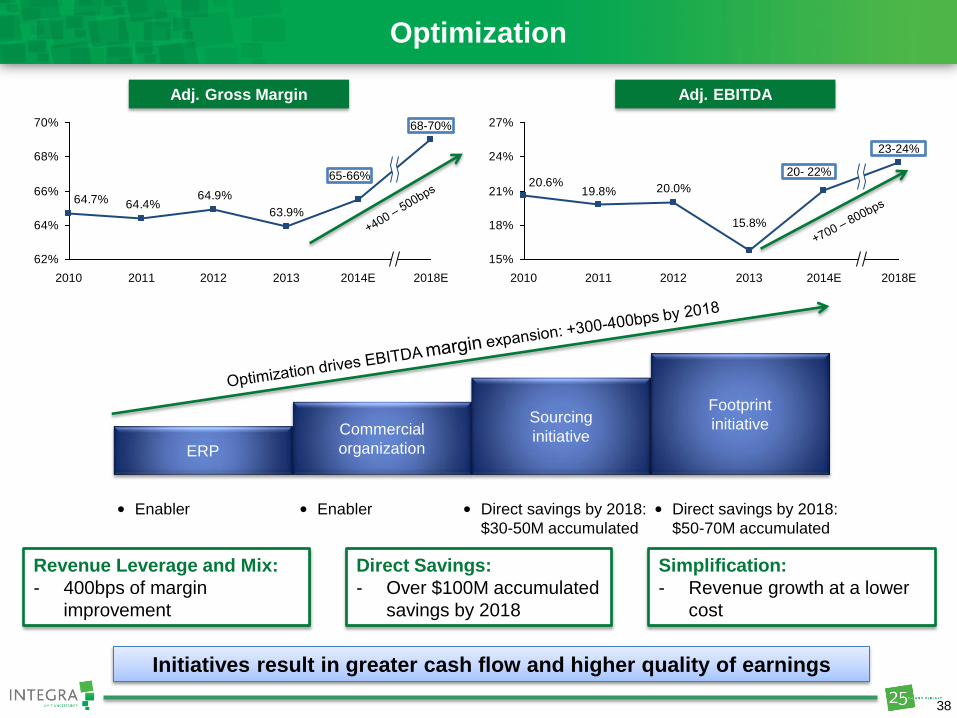
Optimization
ERP
Commercial
organization
Sourcing
initiative
Footprint
initiative
• Enabler • Enabler • Direct savings by 2018:
$30-50M accumulated
• Direct savings by 2018:
$50-70M accumulated
Direct Savings:
- Over $100M accumulated
savings by 2018
Simplification:
- Revenue growth at a lower
cost
Adj. Gross Margin Adj. EBITDA
Revenue Leverage and Mix:
- 400bps of margin
improvement
63.9%
64.9%64.4%64.7%
62%
64%
66%
68%
70%
2014E
65-66%
2013 2012 2011 2010 2018E
68-70%
20.0%19.8%20.6%
15%
18%
21%
24%
27%
2018E
23-24%
2014E
20- 22%
2013
15.8%
2012 2011 2010
Initiatives result in greater cash flow and higher quality of earnings
38
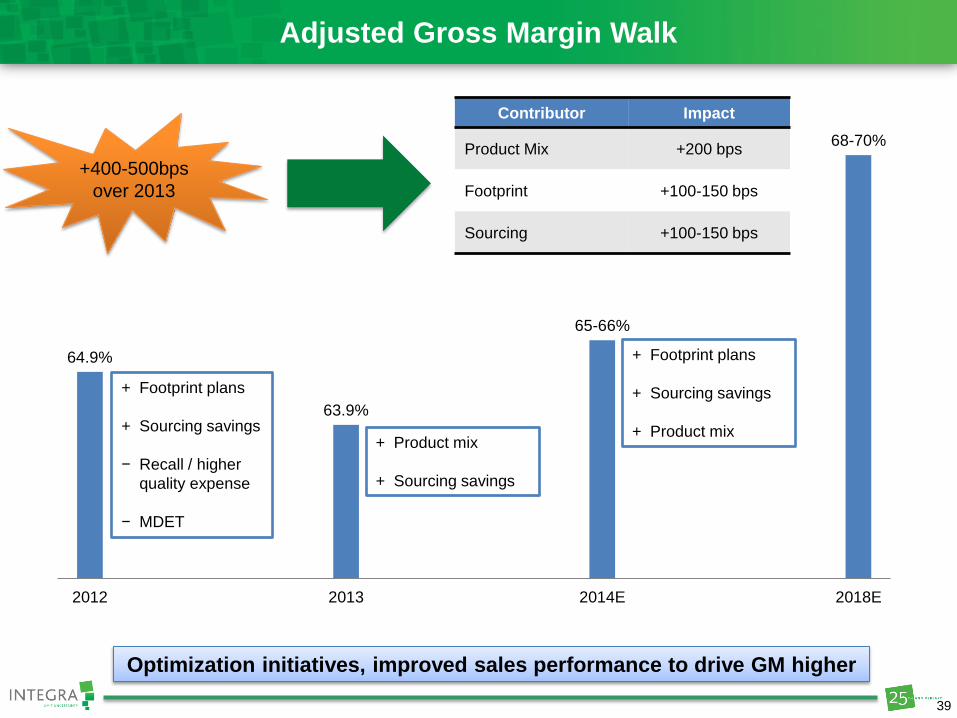
Adjusted Gross Margin Walk
64.9%
63.9%
65-66%
68-70%
2012 2013 2014E 2018E
+ Footprint plans
+ Sourcing savings
− Recall / higher
quality expense
− MDET
+ Product mix
+ Sourcing savings
+ Footprint plans
+ Sourcing savings
+ Product mix
+400-500bps
over 2013
Contributor Impact
Product Mix +200 bps
Footprint +100-150 bps
Sourcing +100-150 bps
Optimization initiatives, improved sales performance to drive GM higher
39

Adjusted EBITDA Margin Walk
20.0%
15.8%
20-22%
23-24%
2012 2013 2014E 2018E
+ Footprint plans
+ Sourcing savings
− Recall / higher
quality expense
− MDET
+ Gross margin
+ Sourcing
+ Leverage on
revenue
+ Gross margin
+ Footprint
+ Leverage on
revenue
− Selling
+700-800bps
over 2013
Contributor Impact
Gross Margin +400-500 bps
G&A:
Footprint
Leverage on revenue
+300bps
+100bps
+200bps
Direct savings, leverage drive improvement against headwinds
40

Cash Flow: Increasing Quality of Earnings
Operating Cash Flow
• FCF Conversion = TTM (Operating cash flow –
capital expenditures) / TTM Adjusted Net Income
• Greater than 10% by end of 2014
• Greater than 50% by end of 2015
• Greater than 80% by end of 2016
FCF Conversion
Improving quality of earnings to drive FCF
conversion higher
2013 2018E
-10%
10%
30%
50%
70%
90%
2012 2013 2014 2015 2016
>10%
>50%
>80%
$53M
$185M +
Direct savings, completion of key projects and leveraged growth drive
greater cash generation
41

Cash Generation and Capital Allocation
Priority capital allocation:
Strategic M&A
Paying down debt
Share repurchases (longer-term)
ROIC hurdle for investments: accretive to cost of capital in 3-5 years
Generating more cash Direct savings and leverage will drive a doubling of
cash flow in the next 2-3 years
42

Peter Arduini President and
Chief Executive Officer
Wrap-Up
43

Key Takeaways – INTEGRA Increasing Value
• Margin improvement: 23-24%
Adjusted EBITDA by 2018
• Deliver better cash flow and
higher quality of earnings: FCF
Conversion* above 80% by
end of 2016
• Consistency of results
• Integrated ERP and systems
implementations
• Restructuring plan focused on
operations with 300-400 bps
of improvement
• Portfolio optimization and
SKU simplification
Driving Above-Market
Growth
• Organic growth: 5-7%
• with M&A: 7% +
• Enhanced R&D pipeline
• New market expansion
opportunities
• International expansion
• Active BD pipeline
Improving Execution Optimizing the Company
You will hear today how we will deliver these key value-driving metrics
Building the foundation for profitable growth and accelerated earnings
*FCF Conversion = TTM (Operating cash flow – capital expenditures) / TTM Adjusted Net Income
44

Financial Summary
Total Revenue Adj. Gross Margin
Operating Cash Flow Adj. EBITDA
$836M$780M$732M
$1,400
$1,200
$1,000
$800
$600
$400
$200
$0
2014E
$920 - $940M
2013 2012
$831M
2011 2010 2018E
$1.1 - $1.3B
$53M
$104M$106M
$59M
100.0%
80.0%
60.0%
40.0%
20.0%
0
$200
$150
$100
$50
$0
2018E
$185M+
2014E
$60 - $80M
2013 2012
$120M
$60M
2011 2010
OCF Adjustments* FCF Conversion
*In 2012, we generated $59.1 million in cash flows from operations, which was reduced by a $29.8 million tax withholding payment in connection with the release of certain deferred stock
units and $30.6 million of accreted interest paid at the maturity of our 2012 Senior Convertible Note.
** FCF Conversion = TTM (Operating Cash Flow – Capital Expenditures) / TTM Adjusted Net Income
*** GAAP Reconciliations can be found in the Appendix.
19.9%19.8%20.6%
15%
18%
21%
24%
27%
2018E
23 – 24%
2014E
20 – 22%
2013
15.8%
2012 2011 2010
63.9%
64.9%64.4%64.7%
62%
64%
66%
68%
70%
2018E
68 – 70%
2014E
65 -66%
2013 2012 2011 2010
45

Leading Franchises and Markets
Lower Extremities
9-12% Growth
Shoulder
7-10% Growth
Orthobiologics
5-8% Growth
Skin – Burn/Wounds
6-9% Growth
International 6-12% Growth
Leading Markets Leading Franchises
46

2014 – 2016 Priorities
Select Key Priorities Tightly Aligned to Our Strategy
Building the capabilities and focusing capacity to achieve our objectives
I. Deliver on restructuring plan: Advance on our plans to achieve 23-24%
Adjusted EBITDA by 2018
II. Deliver consistent growth: 5-7% Organic, 7%+ with M&A
III. Focus and align the portfolio
IV. Make commercial changes to adapt to healthcare reform
V. Leverage scale for commercial advantage and cost competitiveness
47

Why Invest in Integra?
Profit Footprint
Sourcing
ERP
Organizational
Changes
Growth New Products
New Markets
Strategic M&A
Above-
Market
Performance
Integra is unique as a diversified mid-cap executing both margin expansion and
growth acceleration
Plans in place to execute and deliver above-market performance in 2015-
2016
48

49
2014 Investor Day May 6, 2014
New York, New York

2014 Investor Day May 6, 2014
New York, New York
Bios
50

Peter Arduini President and Chief Executive Officer
He joined Integra in November 2010 as President and Chief Operating Officer and was
appointed Chief Executive Officer and a director in January 2012. Before joining
Integra, Mr. Arduini was Corporate Vice President and President of Medication Delivery,
Baxter Healthcare, which he joined in 2005. Mr. Arduini was responsible for a $4.8
billion global division of Baxter. Prior to joining Baxter, Mr. Arduini worked for General
Electric Healthcare, where he spent much of his 15 years in a variety of management
roles for domestic and global businesses. Prior to joining General Electric Healthcare,
he spent four years with Procter and Gamble in sales and marketing. Mr. Arduini serves
on the Board of Directors of ADVAMED, the Advanced Medical Technology Association, and the Board of Directors of the National Italian American Foundation. Mr. Arduini received his bachelor's degree in
marketing from Susquehanna University and a master's in management from Northwestern University's Kellogg School
of Management.
51

John B. Henneman III CVP, Chief Administrative Officer
He is responsible for the Company’s finance department, including accounting and
financial reporting, budgeting, internal audit, tax, and treasury. In addition, he is
responsible for information systems, business development, the law department and
investor relations. Mr. Henneman was appointed Integra’s Corporate Vice President in
December 2012, and has been Integra’s Executive Vice President since February 2003,
was our Chief Administrative Officer from February 2003 until May 2008 and was Acting
Chief Financial Officer from September 2007 until May 2008, when he was appointed
Chief Financial Officer. Mr. Henneman was our General Counsel from September 1998
until September 2000 and our Senior Vice President, Chief Administrative Officer and
Secretary from September 2000 until February 2003. Mr. Henneman received an A.B. degree from Princeton University
and a J.D. from the University of Michigan Law School.
52
Wyeth integration globally for oncology and also served as Vice President, Oncology Asia-Pacific/Canada operations.
Prior to joining Pfizer, Ms. Thiruvengadam served as a Senior Vice President, Human Resources Executive at Bank of
America, from 2005 to 2007, and as Executive Vice President, Human Resource, at Loral Skynet – Loral Space and
Communications, from 2001 to 2004. Ms. Thiruvengadam completed her Master's program from Madras University and
her Bachelor’s from Osmania University.
Padma Thiruvengadam CVP, Chief Human Resources Officer
Padma Thiruvengadam is Integra’s Corporate Vice President, Chief Human Resources
Officer. She is responsible for providing leadership in developing and executing human
resources strategy in support of the overall business plan and strategic direction of the
organization. She is also responsible for Integra’s strategic initiatives and program
management. Ms. Thiruvengadam was appointed Integra’s Corporate Vice President in
December 2012. Previously, from September 2011 to December 2012, Ms.
Thiruvengadam served as Integra’s Chief Human Resources Officer. Prior to joining
Integra, Ms. Thiruvengadam held several leadership positions at Pfizer, Inc., from 2008
to 2011, including Vice President, Global Human Resources for Oncology. She led the
53

Robert T. Davis Jr. CVP, President Neurosurgery
His responsibilities include leadership of sales, marketing, product development, quality
assurance and manufacturing. Mr. Davis joined Integra in July 2012 as President of the
Global Neurosurgery business and was appointed Integra’s Corporate Vice President in
December 2012. He brings more than 25 years of executive management experience in
the global healthcare industry. Prior to joining Integra, Mr. Davis was the General
Manager for the Global Anesthesia & Critical Care business at Baxter Healthcare, from
2009 to 2012, and held various general management positions at GE Healthcare in the
areas of interventional therapeutics, cardiovascular imaging and diagnostic ultrasound,
from 1997 to 2009. Mr. Davis earned his B.S. in Sports Medicine from the University of Delaware, a Master’s degree in Exercise & Cardiovascular Physiology from Temple University, and an M.B.A. from
Drexel University.
54

Dan Reuvers CVP, President International
His responsibilities include executive oversight and leadership of all of Integra's
international businesses, including Europe, Middle East, Africa, Latin America, Asia
Pacific and Canada. He joined Integra in 2008 as Vice President of Marketing and
Product Development for Integra's surgical business and was promoted to President of
the acute surgical business in June 2010. He was appointed President, Instruments in
2011, Corporate Vice President in December 2012, and President - International in
November 2013. Mr. Reuvers was President of Omni-Tract Surgical from September
2005 until December 2008, when the company was acquired by Integra. Mr. Reuvers
has over 25 years of experience in the medical technology field, including holding various executive level positions in sales, marketing and general management. He serves on the board of directors of
Respirtech, Inc.
55

Debbie Leonetti CVP, President Instruments
Her responsibilities include sales, marketing and product development for Integra's
acute and alternate site instrument businesses. She joined Integra in 1997 as Director
of Marketing, was promoted to Vice President of Marketing in April 1999, Senior Vice
President of Global Marketing in May 2004, Chief Marketing Officer in September 2007,
President of Latin America, Asia Pacific and Canada (LAPAC) in 2008, and President of
Integra Surgical in 2009. In 2010, Ms. Leonetti was appointed President of Integra's
Instrument business and LAPAC. Ms. Leonetti was appointed President, International,
in 2011, Corporate Vice President in December 2012, and President - Instruments in
November 2013. From 1989 through 1997, Ms. Leonetti worked for Olympus Corporation and held positions in sales, sales training, and marketing. Prior to her experience at Olympus, Ms. Leonetti
completed fifteen years of clinical practice as a registered nurse at St. Christopher's Hospital for Children in
Philadelphia. Ms. Leonetti received her Nursing degree from St. Joseph's Hospital School of Nursing and La Salle
University.
56
Mark Augusti CVP, President Orthopedics and Tissue Technologies
Mr. Augusti is responsible for the management of the Spine and Extremities divisions
which includes spine and extremity implants, orthobiologics and our tissue products. His
responsibilities include US commercial leadership, global portfolio management,
evaluation of corporate development opportunities and overall strategic direction. He
joined Integra in April 2014 as Corporate Vice President and President of Orthopedics
and Tissue Technologies, and brings over 25 years of executive management
experience in medical technology. Prior to joining Integra, Mr. Augusti served as Chief
Executive Officer at Bioventus LLC May 2012 to August 2013 and was a member of the
company's Board of Directors during the same period. Prior to that Mr. Augusti spent
nine years with Smith & Nephew April 2003 to April 2012 in a series of leadership roles, including President of Smith &
Nephew's Biologic Division, where he was appointed to lead Smith & Nephew's new biologics initiative. He also served
as Smith & Nephew's President of the Orthopedic Trauma & Clinical Therapies Global Business and Senior Vice
President and General Manager of the Trauma business. Prior to that, from 1987 to 2000, he spent 13 years at GE
Medical Systems, where he held various sales, marketing and strategic management roles, both in the US and
internationally. Mr. Augusti received his M.B.A. from the UCLA Anderson School of Management, and his B.S. in
Computer Science and Economics from Duke University.
57

John Mooradian CVP Global Operations and Supply Chain
John Mooradian is Integra’s Corporate Vice President, Global Operations and Supply
Chain. His responsibilities include global manufacturing and supply chain. Mr.
Mooradian was appointed Integra’s Corporate Vice President in December 2012. He
joined Integra in September 2012 as Senior Vice President, Global Operations and
Supply Chain. Before coming to Integra, Mr. Mooradian spent 24 years at Abbott
Laboratories in a series of leadership roles, including managing the Hematology and
Point of Care businesses and, more recently, worldwide operations at Abbott
Diagnostics Division, a $4 billion business with over 11,000 employees. Prior to Abbott,
Mr. Mooradian held several positions at General Motors. Mr. Mooradian received a B.B.A. degree in Management from the University of Texas, Arlington.
58

Paul W. Gonsalves SVP Enterprise Selling and Corporate Marketing
As Integra’s Enterprise Sales leader, Mr. Gonsalves is responsible for developing,
managing and executing Integra’s Enterprise Selling strategy. This includes strategic
key account planning, account development, executive-level relationship management
at specified key accounts and partnering with the cross-divisional and cross-functional
leadership teams to ensure the best possible service and communications to Integra’s
customers. Mr. Gonsalves also leads Corporate Marketing. Before joining Integra, Mr.
Gonsalves was the SVP/Chief Transformation Officer at AccentCare, Inc. He played an
integral role as part of a private equity group’s acquisition of this home health & hospice
company. He improved the business processes, created deeper collaborative bonds between both field and headquarters sales, marketing, and operational teams, and solidified their mission to develop
strong operating principles and processes. Prior to AccentCare, Paul was the VP & General Manager for Novartis
Pharmaceuticals Corporation’s Primary Care business unit with sales, marketing, and operational responsibility for the
US Additionally, Paul has held leadership positions in sales, marketing, and operations at WellCare Health Plans, GE
Healthcare and Siemen’s Medical Systems. Paul is a graduate of Rutgers University and holds a B.S. degree in
Business Management.
59

William Weber VP, General Manager Marketing & Product Development - Extremities
Dr. Weber joined Integra in July 2004 as a marketing manager for its Neurosurgery
Business. Before Integra, Dr. Weber spent a short period of time at Mutual of New York
as a financial advisor. Prior to being a financial advisor, Mr. Weber worked for ZS
Associates as a consultant. During this time he worked on sales and marketing strategy
for both device and pharmaceutical companies. Preceding ZS, Dr. Weber was a senior
staff engineer at Mobil’s Strategic Research Center in Paulsboro, NJ. While at Mobil
(and subsequently Exxon Mobil), Dr. Weber focused on the discovery and
commercialization of new petrochemical process technologies. Dr. Weber has a
bachelor’s of science degree in chemical engineering from Cornell University and Ph.D in chemical engineering from the
University of California at Davis. Dr. Weber also has a master’s degree of business administration from Columbia
Business School.
60

2014 Investor Day May 6, 2014
New York, New York
Appendix
61

$ In Thousands 2010 2011 2012 2013
COGS 268,188$ 299,150$ 314,427$ 327,045$
Non-GAAP Adjustments 9,498 21,611 22,881 24,846
Adjusted COGS 258,690$ 277,539$ 291,546$ 302,199$
Revenue 732,068$ 780,078$ 830,871$ 836,214$
Adjusted Gross Margin 64.7% 64.4% 64.9% 63.9%
Adjusted Gross Margin
$ In Thousands 2010 2011 2012 2013
SG&A 305,055$ 358,132$ 373,114$ 407,802$
Adj 9,424 37,420 23,669 30,255
Adjusted SG&A 295,631$ 320,712$ 349,445$ 377,547$
Revenue 732,068$ 780,078$ 830,871$ 836,214$
As a % of Revenue 40.4% 41.1% 42.1% 45.1%
Adjusted SG&A
Adjusted Gross Margin and SG&A Reconciliation
62

$ In Thousands 2010 2011 2012 2013
GAAP Net Income 65,669$ 27,989$ 41,204$ (21,067)$
Non-GAAP Adjustments (Total) 85,366 126,714 125,142 153,503
Adjusted EBITDA 151,035$ 154,703$ 166,346$ 132,436$
Revenue 732,068$ 780,078$ 830,871$ 836,214$
Adj EBITDA Margin 20.6% 19.8% 20.0% 15.8%
Adjusted EBITDA
Adjusted EBITDA Reconciliation
63

$ In Thousands 2010 2011 2012 2013
GAAP Net Income (loss) 65,669$ 27,989$ 41,204$ (21,067)$
Non-GAAP Adjustments (Total) 24,211 54,201 46,015 87,539
Adjusted Net Income 89,880$ 82,190$ 87,219$ 66,472$
Weighted average common shares outstanding for diluted net
income (loss) per share- - 28,416
Non-GAAP adjustment for dilutive effects of equity awards - - 386
Weighted average common shares outstanding for adjusted
diluted net income per share30,149 29,495 28,516 28,802
GAAP net income (loss) per diluted share 2.18$ 0.95$ 1.44$ (0.74)$
Non-GAAP adjustments detailed above (per share) 0.80 1.84 1.62 3.05
Adjusted net income per diluted share 2.98$ 2.79$ 3.06$ 2.31$
Adjusted EPS
Adjusted EPS Reconciliation
64
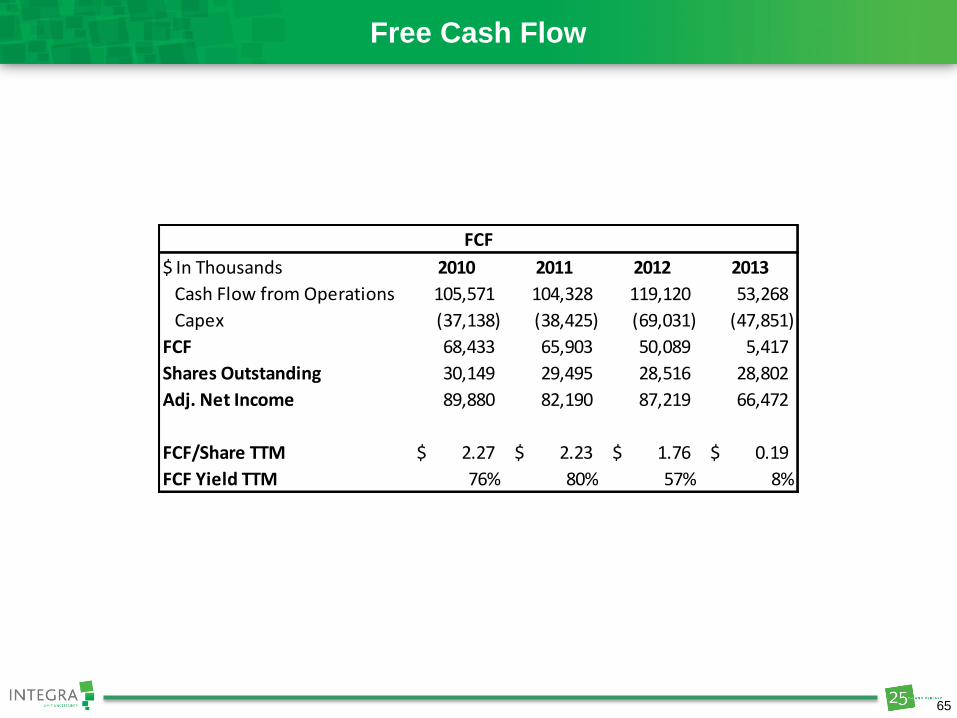
Free Cash Flow
$ In Thousands 2010 2011 2012 2013
Cash Flow from Operations 105,571 104,328 119,120 53,268
Capex (37,138) (38,425) (69,031) (47,851)
FCF 68,433 65,903 50,089 5,417
Shares Outstanding 30,149 29,495 28,516 28,802
Adj. Net Income 89,880 82,190 87,219 66,472
FCF/Share TTM 2.27$ 2.23$ 1.76$ 0.19$
FCF Yield TTM 76% 80% 57% 8%
FCF
65