![Distr. of aptian_sandstones_-_part_2[1] Journ Pet Geol 1997](https://static.fdocuments.in/doc/165x107/5886a6591a28ab0c1d8b7255/distr-of-aptiansandstones-part21-journ-pet-geol-1997.jpg)
Part 2 (Disk Pane, Network Pane, Process Details ..._Part_2.pdf · Activity Monitor (Part 2 of 2)...
11
July 16, 2017, Beginners SIG Activity Monitor (Part 2 of 2) Page 1 of 11 Note: This discussion is based on MacOS, 10.12.5 (Sierra). Some illustrations may differ when using other versions of macOS or OS X. Credits: See the list at the end of this presentation Part 2 (Disk Pane, Network Pane, Process Details & Troubleshooting) Disk Pane The Disk pane shows the amount of data that each process has read from your disk and written to your disk. (See the illustration below.) It also shows “reads in” and “writes out”, which is the number of times that your Mac accesses the disk to read and write data. Disk Pane (Credit: Mac Activity Help)
Transcript of Part 2 (Disk Pane, Network Pane, Process Details ..._Part_2.pdf · Activity Monitor (Part 2 of 2)...

July 16, 2017, Beginners SIG Activity Monitor (Part 2 of 2)
Page 1 of 11
Note: This discussion is based on MacOS, 10.12.5 (Sierra). Some illustrations may differ when using other versions of macOS or OS X.
Credits: See the list at the end of this presentation
Part 2 (Disk Pane, Network Pane, Process Details & Troubleshooting)
Disk Pane The Disk pane shows the amount of data that each process has read from your disk and written to your disk. (See the illustration below.) It also shows “reads in” and “writes out”, which is the number of times that your Mac accesses the disk to read and write data.
Disk Pane (Credit: Mac Activity Help)

July 16, 2017, Beginners SIG Activity Monitor (Part 2 of 2)
Page 2 of 11
Display. As shown in the previous illustration, the Disk pane displays four information columns (excluding PID and User): Bytes Written, Bytes Read, and Kind.
In light of Apple’s recent announcement that it intends to eliminate support for 32-bit apps in 2018 (after the next macOS release, 10.13, High Sierra), the most useful of these is probably Kind. • Bytes Written: Amount of data written to disk. • Bytes Read: Amount of date read from disk. • Kind: 64 bit or 32 bit
Summary Information. The information available at the bottom of the Energy pane shows total disk activity across all processes: • Reads in: Number of times data is written to disk. • Writes out: Number of times data is read from disk. • Reads in/sec: Rate at which data is written to disk. • Writes out/sec: Rate at which data is read from disk. • The graph moves from right to left and updates at the intervals set in
View > Update Frequency. • The graph also includes a pop-up menu to switch between showing disk data
activity in amount or as a unit of measurement. ! Blue: Shows either the number of reads per second or the amount of data
read per second. ! Red: Shows either the number of writes out per second or the amount of
data written per second • Similar to the table for Reads In/Out and Reads in/sec & out/sec, there is also a
table for Data read/written and Data read/sec & written/sec.
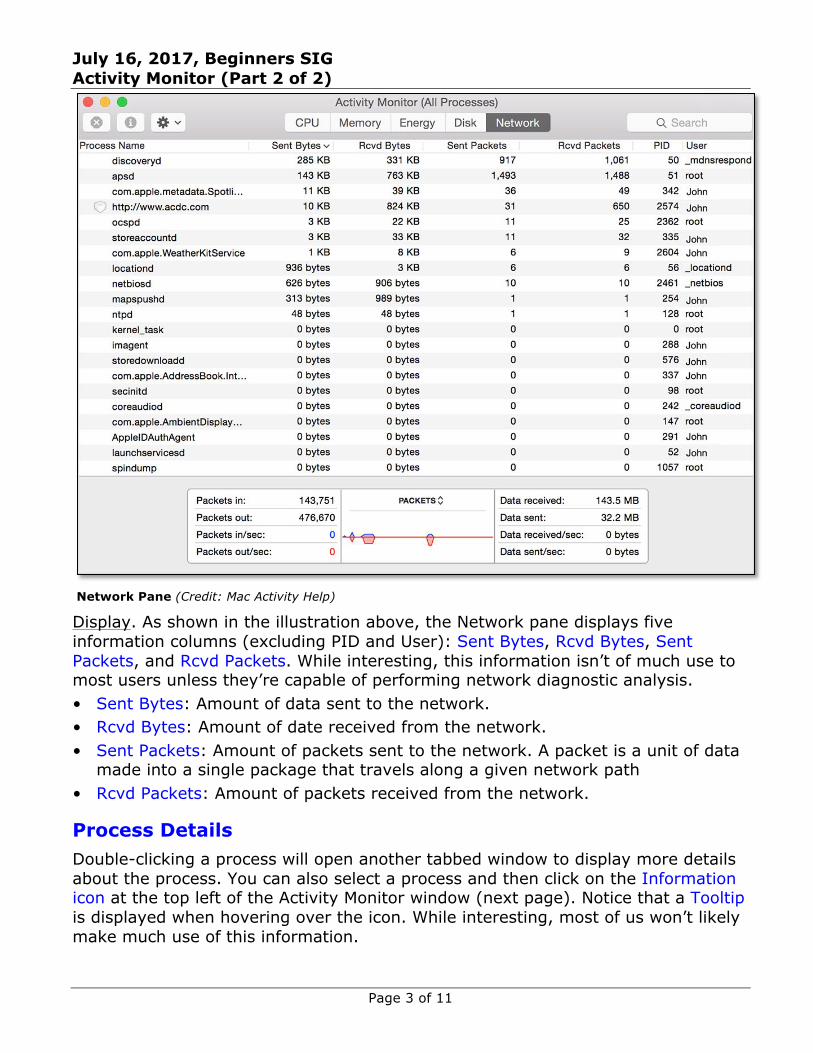
Network Pane The Network pane shows how much data your Mac is sending or receiving over your network. (See the illustration on the next page.) You can use this information to identify which processes are sending or receiving the most data.
July 16, 2017, Beginners SIG Activity Monitor (Part 2 of 2)
Page 3 of 11
Network Pane (Credit: Mac Activity Help) Display. As shown in the illustration above, the Network pane displays five information columns (excluding PID and User): Sent Bytes, Rcvd Bytes, Sent Packets, and Rcvd Packets. While interesting, this information isn’t of much use to most users unless they’re capable of performing network diagnostic analysis. • Sent Bytes: Amount of data sent to the network. • Rcvd Bytes: Amount of date received from the network. • Sent Packets: Amount of packets sent to the network. A packet is a unit of data
made into a single package that travels along a given network path • Rcvd Packets: Amount of packets received from the network.
Process Details Double-clicking a process will open another tabbed window to display more details about the process. You can also select a process and then click on the Information icon at the top left of the Activity Monitor window (next page). Notice that a Tooltip is displayed when hovering over the icon. While interesting, most of us won’t likely make much use of this information.

July 16, 2017, Beginners SIG Activity Monitor (Part 2 of 2)
Page 4 of 11
Information Icon As an example, here are the various the process information windows, one for each tab, for Acrobat Reader running on my iMac:
Memory Tab. This tab displays the amount of each type of memory the process is using:
Process Information Window (Memory Tab)
Statistics Tab. Other statistics like how long the process has been active, how many threads are active at the moment, etc. are displayed:
Process Information Window (Statistics Tab)
July 16, 2017, Beginners SIG Activity Monitor (Part 2 of 2)
Page 5 of 11
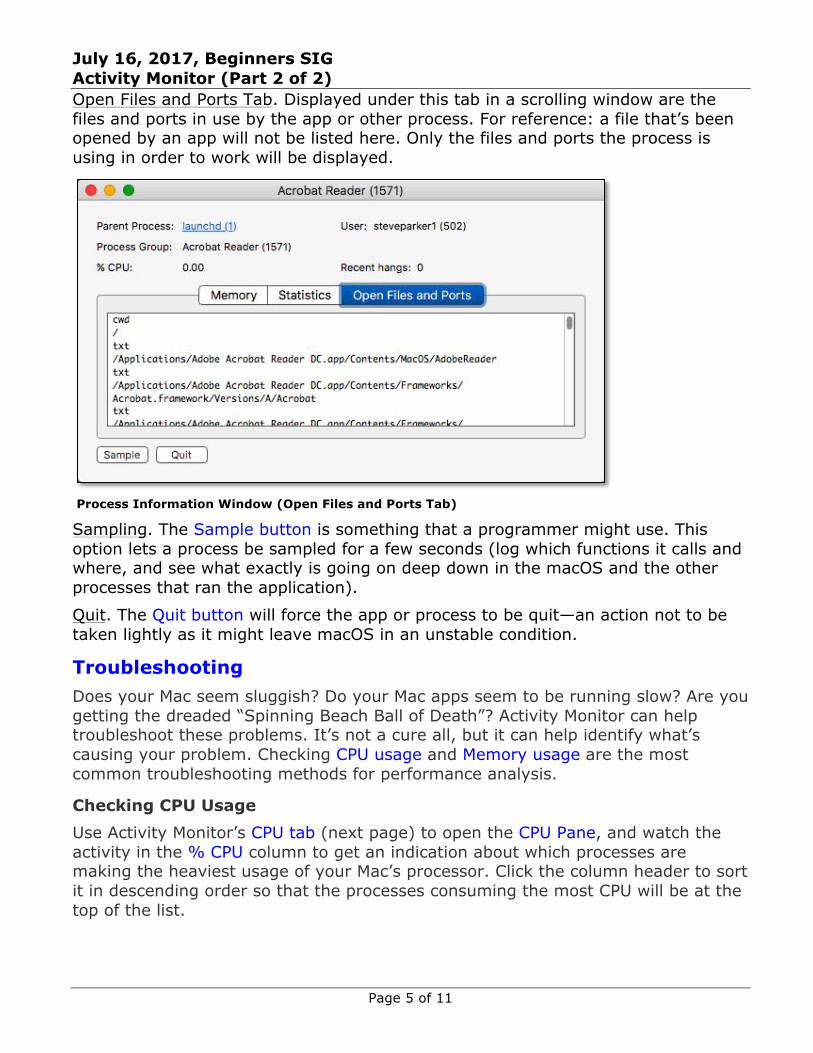
Open Files and Ports Tab. Displayed under this tab in a scrolling window are the files and ports in use by the app or other process. For reference: a file that’s been opened by an app will not be listed here. Only the files and ports the process is using in order to work will be displayed.
Process Information Window (Open Files and Ports Tab) Sampling. The Sample button is something that a programmer might use. This option lets a process be sampled for a few seconds (log which functions it calls and where, and see what exactly is going on deep down in the macOS and the other processes that ran the application).
Quit. The Quit button will force the app or process to be quit—an action not to be taken lightly as it might leave macOS in an unstable condition.
Troubleshooting Does your Mac seem sluggish? Do your Mac apps seem to be running slow? Are you getting the dreaded “Spinning Beach Ball of Death”? Activity Monitor can help troubleshoot these problems. It’s not a cure all, but it can help identify what’s causing your problem. Checking CPU usage and Memory usage are the most common troubleshooting methods for performance analysis.
Checking CPU Usage Use Activity Monitor’s CPU tab (next page) to open the CPU Pane, and watch the activity in the % CPU column to get an indication about which processes are making the heaviest usage of your Mac’s processor. Click the column header to sort it in descending order so that the processes consuming the most CPU will be at the top of the list.

July 16, 2017, Beginners SIG Activity Monitor (Part 2 of 2)
Page 6 of 11
CPU Pane (Credit: Mac Activity Help)
Note: You may see some high percentage values of % CPU, but they’re not necessarily an indication of a problem. Intel Core i5 and i7 processors, commonly used in Macs, have 4 processor cores, and each can be loaded to 100% (400% for the 4 cores). Depending on the processor-intensive program being used, more than one core may be heavily loaded, leading to high % CPU levels.
Also, as you use your Mac, also periodically observe the CPU usage information in the summary section at the bottom of the CPU pane. High CPU levels over an extended period of time may indicate a problem.
Percentage of CPU Used. The left side of the summary section shows the percentage of CPU used by three process categories: % System (percentage of total CPU capacity utilized in system-related processes), % User (percentage of total CPU capacity utilized in processes running for all logged-in users), and % Idle (percentage of total CPU capacity not currently being utilized). To, see a definition for a category hover the mouse pointer over one of the labels, and a help tag will appear.

July 16, 2017, Beginners SIG Activity Monitor (Part 2 of 2)
Page 7 of 11
CPU LOAD Graphs. The center portion of the summary section displays graphs of CPU load for System and the User. If the CPU LOAD graphs are persistently full or nearly full, as shown above in the previous illustration, then one of the following conditions exists:
• A “rogue” process is unnecessarily monopolizing the CPU. If a process name has been replaced with the label, Not Responding, be patient. Wait a few minutes to see if it either returns to normal operation or crashes. If still stuck on Not Responding, terminate the process in question by Quitting or Force Quitting. (More on how to do this later.)
• Your daily workload can’t be handled with the CPU in your Mac. Your options are few at this point:
! Reduce the load on your Mac’s CPU by using fewer apps at the same time.
! Replace your Mac with one that has a more powerful CPU.
Checking RAM Usage As you open more applications on your Mac, or the larger the files those applications work with, the more physical random-access memory (RAM) is used.
To make efficient use the available RAM, macOS employs Virtual Memory (VM). Available RAM is maximized by moving data from RAM to swap files (the Virtual Memory) on the startup disk and back (a process known as dynamic paging).
The less RAM you have, the more CPU cycles must be devoted to paging and free space on your startup disk devoted to swap files. Together, these can affect the performance of your Mac. In particular, moving data to and from your Mac’s hard drive for the swap files is a much slower process that moving data to and from RAM.
Determine if your Mac has sufficient RAM by using the Memory Pane. Click on Activity Monitor’s CPU tab to display the Memory Pane. (See the illustration on the next page.)

July 16, 2017, Beginners SIG Activity Monitor (Part 2 of 2)
Page 8 of 11
Memory Pane (Credit: Mac Activity Help)
Memory and Compressed Mem Columns. Click either column header to sort it in descending order so that the processes consuming the most Memory (or Compressed Memory) will be at the top of the list. This will give you an indication of which apps are using the most RAM on your Mac.
MEMORY PRESSURE Graph. Watch the MEMORY PRESSURE graph at the left side of the summary section at the bottom of the pane. As explained previously, green means that RAM is available, yellow indicates that RAM still available but is being tasked/stressed by memory-management processes, such as compression, and red indicates that RAM is depleted. If red is displayed, macOS is using your startup drive to swap data from RAM to the startup disk and back (a process that reduces performance).
Memory Tables. The remaining two portions of the summary section contain two tables that show how the RAM is being used (Physical Memory installed, Memory Used, Cached Files, and Swap Used). In addition, Memory Used is further broken down by App Memory (total amount of RAM currently used by apps and their processes), Wired Memory (memory that can’t be compressed or paged out and must stay in RAM), and Compressed (memory in RAM that is compressed to make more RAM memory available to other processes).

July 16, 2017, Beginners SIG Activity Monitor (Part 2 of 2)
Page 9 of 11
High memory usage isn’t necessarily a bad thing. It may simply mean that your Mac has a lot of cached files that are available for other apps if they need it. Check the Memory Pressure graph. It it’s green, you probably don’t need to be concerned if it looks like all your memory is being used.
However, if the Memory Pressure graph begins to show yellow (or worse red), one of these conditions may exist:
• Your Mac doesn’t have enough RAM for your workload. If possible, install more RAM.
• One or more of the apps you’re using has a memory leak, a condition where an app doesn’t release memory when it’s no longer needed. This is a bug that only the app’s developer can fix.
Quit and Force Quit You may find that you have a process—probably an app—that needs to be quit. Perhaps you find in Activity Monitor that its name has been replaced with the label, Not Responding, which means that its “frozen” and is no longer working. Activity Monitor offers a couple of ways to get the app working again.
Quit. If you can quit the app in the normal way, such as choosing Quit from its app menu, fine. Go ahead and use this familiar method.
If you are already in the Activity Monitor app, select the app in one of the panes (probably CPU or Memory) and then choose Quit Process from the View menu (keyboard shortcut: Command-Option-Q).
Another way to quit a process or app is to Double-Click the app in one of the Activity Monitor panes to open a Process Information window and then click the Quit button (see below):
Process Information Window (Memory Tab)

July 16, 2017, Beginners SIG Activity Monitor (Part 2 of 2)
Page 10 of 11
Force Quit. If an app is unresponsive, using a normal Quit method probably won’t work, and you’ll need to resort to something more “forceful” (the Force Quit option). There are many ways to do this, such as using the Command-Option-Esc keyboard shortcut to bring up the Force Quit Applications window to choose an app to Force Quit:
Force Quit Applications Window (Bring up with Command-Option-Esc Keyboard Shortcut)
If you’re already in Activity Monitor, select the unresponsive app in one of the panes—remember, it will have a Not Responding label—and then click the Force Quit button at the top of the window:
Force Quit Applications Window
Warning: Force quitting an app is generally a safe option (and sometimes your only option). However, you probably don’t want to Force Quit any other process that is not associated with you as a user. (Check for your User Name in the User column of one of the Activity Monitor panes.) Many processes are owned by the Root user, and force quitting one of these could leave your Mac in an unstable condition.

July 16, 2017, Beginners SIG Activity Monitor (Part 2 of 2)
Page 11 of 11
Next Presentation For the next presentation, we’ll take a look at another macOS utility app.
If you have any suggestions for presentation topics, including macOS utilities, please contact me at [email protected].
—Steve Parker Credits Credit 1: Activity Monitor Help Credit 2: How to Use macOS’ Activity Monitor Like a Power User (http://www.applegazette.com/mac/macos-activity-monitor-like-power-user/) Credit 3: Activity Monitor Demystified (https://computers.tutsplus.com/tutorials/activity-monitor-demystified--mac-30611) Credit 4: How to Use Activity Monitor to Troubleshoot Problems on a Mac (https://www.intego.com/mac-security-blog/how-to-use-activity-monitor-to-troubleshoot-problems-on-a-mac/) Credit 5: Troubleshooting with Activity Monitor (http://www.thexlab.com/faqs/activitymonitor.html#AM-Errant-Process) Credit 6: Using Activity Monitor (https://macmost.com/using-activity-monitor.html)