PARS: County of Contra Costa Second Quarter 2021
44
PARS: County of Contra Costa Second Quarter 2021 Presented by Andrew Brown, CFA
Transcript of PARS: County of Contra Costa Second Quarter 2021

PARS: County of Contra Costa
Second Quarter 2021
Presented by
Andrew Brown, CFA

This presentation has been prepared for the sole use of the intended
recipient. While the information contained herein has been obtained from
sources believed to be accurate and reliable, any other reproduction or use of
this information may necessitate further disclosures in order to ensure that
the presentation is accurate, balanced, and conforms to all applicable
regulatory requirements.

DISCUSSION HIGHLIGHTS
U.S. Economic and Market Overview
Brushing aside mounting concerns about higher inflation and a more contagious Covid variant spreading around the world, investors bought
assets of almost any stripe in the second quarter. For the fifth consecutive quarter, global equities marched higher as corporate earnings
continued a strong recovery that outperformed already lofty expectations. In a bid to hedge potential inflation risk, asset classes like commodities
and real estate 1 have seen increasing demand this year, leading to strong performance. Meanwhile, the bond market rallied throughout most of
the second quarter and snapped its trend of rising interest rates that began last August.
Global equities closed the second quarter at record highs, capping off a strong first half of 2021 that saw shares advance 12.8 percent.2 Bullish
sentiment was buoyed by the accelerating pace of vaccine distribution globally, leading to further lifting of pandemic-related economic
restrictions. Worry about elevated valuation levels stayed on the back burner as domestic based retail investors continued to find paltry yields
offered in the bond market.
U.S. stocks carried the torch in the second quarter, outperforming international equity markets.3 However, in a pivot from the prior two quarters,
sectors with more sensitivity to the strength of the economic cycle took a backseat to more secular growth-oriented areas as questions emerged
about the sustainability of fiscal and monetary policy support.
Falling long-term interest rates also reflected the possibility of a premature moderation in fiscal and monetary stimulus. The rate on the bellwether
10-year Treasury note fell 30 basis points from 1.74 percent at the end of March to 1.44 percent by the end of June. A flattening of the yield
curve, as measured by the spread between longer- and shorter-maturity bonds, and further compression in credit spreads helped the bond
market post healthy returns in the second quarter after fighting a steepening curve over the prior ten months.
Source:
1. The Bloomberg Commodity Index returned 21.15 percent and the S&P U.S. REIT Index returned 21.70 percent for the year-to-date period ending June 30, 2021.
2. S&P Global Broad Market index including dividends
3. The S&P 500 Index returned 8.55 percent in the second quarter versus international stocks as represented by MSCI EAFE which returned 5.17 percent over the same period.
PARS: County of Contra Costa3

Economic Enigma
At first glance, falling interest rates seem counterintuitive amid the highest inflation readings seen in decades. After all, it makes sense that
investors should demand higher -- not lower -- yields if inflation is heating up. But it’s the second derivative of inflation that has the market’s
attention. Namely, the implications for future economic policy and ultimately growth potential.
From toilet paper shortages to soaring home prices, the global pandemic has brought with it many atypical economic phenomena. Wild swings in
both supply and demand across virtually all assets, goods and services have kept economists perplexed as to what current economic data says
about the future. What began with fears of a deflationary death spiral at the onset of the pandemic had completed a one-eighty into worries over
out-of-control inflation entering the second quarter of 2021. An unprecedented fiscal and monetary policy response to a rare, but economically
devastating, event has muddied the economic waters by stirring up questions about a sustainable long-term equilibrium for both growth and
inflation.
A key question for the U.S. economy and financial markets alike centers on the inflation outlook and its implications for monetary policy. The
Federal Reserve (Fed) has been keenly focused on achieving a full labor market recovery while relaxing its mandate to keep prices in check
under its recently revised policy-making framework. However, the exact length of the longer inflation leash remains in question as a surge in
reopening demand is met by supply chain disruptions.
Prior to the pandemic, the Fed consistently undershot its stated goal of 2 percent inflation despite what at the time was the largest expansion of
its balance sheet in history following the Global Financial Crisis. Embedded in the Fed’s mindset was that monetary policy impacted longer-term
inflation, but with a lagged effect. In other words, they felt it was necessary to be more proactive than reactive to the price stability mandate.
Recognizing a disconnect between the academic assumptions about the impact of monetary policy on inflation and employment and the
empirical experience, policy makers decided they had some cover to see how far they could push the limits of monetary policy to address the
current crisis. Under the new framework, the U.S. central bank now aims to “achieve inflation that averages 2 percent over time”4 (emphasis
added), while also seeking broader-based positive employment outcomes. This simple yet significant change opened the door for inflation
targeting “moderately above 2 percent for some time” to compensate for the prior cycle’s underachievement.
4. Federal Reserve Board - 2020 Statement on Longer-Run Goals and Monetary Policy Strategy
PARS: County of Contra Costa4

May’s Core Personal Consumption Expenditures Index (the Fed’s preferred inflation marker), along with other inflation measures, came in well
above expectations and at levels not seen in decades. This data was taken in stride by policy makers and financial markets with the expectation
that current data is not necessarily indicative of a longer-term trend. As evidence of the transitory nature of the spike in prices, economists
point to items like used car prices, which are surging as a knock-on effect of the supply chain disruption in the new car market.
The Fed’s employment bogey is clearer. 6.8 million fewer Americans are employed relative to pre-pandemic levels.5 Achieving the objective of
bringing that number closer to zero, or what the Fed deems “maximum employment”, hit a snag as the pace of hiring fell short of expectations in
April and May despite job openings and quit rates hitting new highs. Explanations for the failure to meet the increasing demand for labor ranged
from enhanced unemployment benefits to caregiving challenges to ongoing pandemic fear. In reality, the shortfall appears to be a combination of
these factors.
June’s increase of 850,000 non-farm payrolls relieved some concerns that the pace of hiring was off track after two consecutive disappointing
months.6 Most encouragingly, employment in the sector most impacted by the pandemic, leisure and hospitality, saw the lion’s share of growth
with 343,000 new jobs added in June.7 However, the nearly 2 million Americans that have left the workforce in the wake of the pandemic present
a troublesome obstacle to achieving a full labor market recovery.8
The “transitory” inflation narrative firmly planted in the market’s psyche prompted close scrutiny of June’s Federal Open Market Committee
(FOMC) meeting for hints as to when monetary policy accommodation will be weaned from the system. Heightened attention was paid to the
survey of FOMC members’ projections, also known as the “Dot Plot”, that suggested the timeline for tapering quantitative easing and eventual
rate hikes could be shorter than previously expected.
In his press conference following the FOMC meeting, Chairman Powell was quick to downplay this shift in expectations by saying the projections
should be “taken with a grain of salt” and reinforcing the highly uncertain speed of the recovery given the unusual nature of the downturn in the
economy. However, reading between the lines, one might suspect that the FOMC voting members are a least thinking about tapering despite
comments to the contrary. 9
5. Source: U.S. Bureau of Labor Statistics
6. Source: U.S. Bureau of Labor Statistics
7. Source: U.S. Bureau of Labor Statistics
8. U.S. Bureau of Labor Statistics, Employment Situation Summary, July 2, 2021
9. Chairman Powell reiterated that the Fed is “not even thinking about thinking about raising rates” at the post FOMC meeting press conference
PARS: County of Contra Costa5

Forecasting future economic conditions is always challenging and this cycle’s unique forces in both directions makes that endeavor even more
difficult. At the foundation of the ”wall of worry” for investors today remains the central bank’s ability to support the recovery. Should the inflation
outlook shift from being transitory to something longer lasting, it will likely have major implications for Fed policy and subsequently all financial
assets. More specifically, it might force the Fed to confront the paradox of having to tap the breaks to curtail inflation before the economy gets
fully back on its feet.
Having learned important lessons from the 2013 “taper tantrum” and 2018’s “autopilot” remarks, the Fed is keenly aware of the market’s
sensitivity to not only its policy actions, but also to mere guidance on what it might do in the future. For this reason, we expect the Fed to be
extremely careful about when and how it introduces a pivot toward removing accommodation. There is no ambiguity about the delicate co-
dependency between financial markets and the real economy – a reality policy makers cannot afford to ignore.
Looking Ahead
Heading into the back half of 2021 we expect a continuation of the global economic momentum driving the speedy recovery in corporate
fundamentals, while we are keeping a close eye out for potential catalysts that would alter the global economy’s longer-term trajectory. Despite
our sanguine economic outlook, corporate earnings expectations have already reset to reflect a fairly optimistic scenario and comparisons to
prior periods will become more challenging.
For this reason, we believe the pace of appreciation in equity markets over the first half-year is unlikely to be maintained in the second half. We
remain most constructive on the more economically sensitive areas of the equity market, including energy, financials and industrials, that appear
heavily discounted compared to more defensive peers in the healthcare, consumer staples, and technology sectors.
Within fixed income markets we expect intermediate to longer maturity interest rates to retrace their recent move lower and restart their upward
trajectory as the global glut of liquidity slowly diminishes. Further, while corporate fundamentals continue to improve, increased merger and
acquisition activity, dividend payouts and share buybacks could become a limiting factor to that trend. Given the already low risk premiums
offered, we foresee limited opportunity for additional credit spread compression.
Among the most significant risks to our outlook and the current narrative in general is the fragile feedback loop between economic data and
monetary policy discussed above. More specifically, the Fed’s pragmatism could be tested if inflation starts to look less than transitory. While
some recent drivers of higher inflation readings are indeed likely to fade, other variables have the potential to take the baton and flip the script on
the transitory story. Perhaps the most notable of those variables is rent, which represents about a third of the Consumer Price Index calculation
and has yet to meaningfully accelerate despite a record surge in home prices.
PARS: County of Contra Costa6
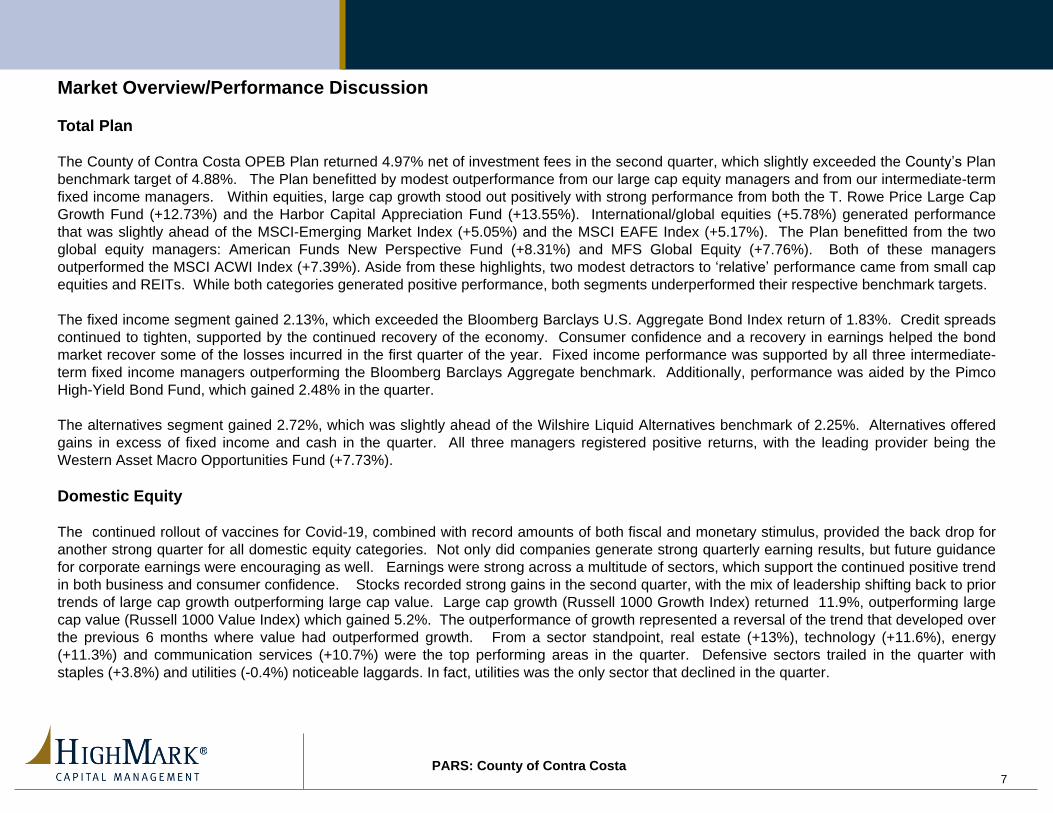
Market Overview/Performance Discussion
Total Plan
The County of Contra Costa OPEB Plan returned 4.97% net of investment fees in the second quarter, which slightly exceeded the County’s Plan
benchmark target of 4.88%. The Plan benefitted by modest outperformance from our large cap equity managers and from our intermediate-term
fixed income managers. Within equities, large cap growth stood out positively with strong performance from both the T. Rowe Price Large Cap
Growth Fund (+12.73%) and the Harbor Capital Appreciation Fund (+13.55%). International/global equities (+5.78%) generated performance
that was slightly ahead of the MSCI-Emerging Market Index (+5.05%) and the MSCI EAFE Index (+5.17%). The Plan benefitted from the two
global equity managers: American Funds New Perspective Fund (+8.31%) and MFS Global Equity (+7.76%). Both of these managers
outperformed the MSCI ACWI Index (+7.39%). Aside from these highlights, two modest detractors to ‘relative’ performance came from small cap
equities and REITs. While both categories generated positive performance, both segments underperformed their respective benchmark targets.
The fixed income segment gained 2.13%, which exceeded the Bloomberg Barclays U.S. Aggregate Bond Index return of 1.83%. Credit spreads
continued to tighten, supported by the continued recovery of the economy. Consumer confidence and a recovery in earnings helped the bond
market recover some of the losses incurred in the first quarter of the year. Fixed income performance was supported by all three intermediate-
term fixed income managers outperforming the Bloomberg Barclays Aggregate benchmark. Additionally, performance was aided by the Pimco
High-Yield Bond Fund, which gained 2.48% in the quarter.
The alternatives segment gained 2.72%, which was slightly ahead of the Wilshire Liquid Alternatives benchmark of 2.25%. Alternatives offered
gains in excess of fixed income and cash in the quarter. All three managers registered positive returns, with the leading provider being the
Western Asset Macro Opportunities Fund (+7.73%).
Domestic Equity
The continued rollout of vaccines for Covid-19, combined with record amounts of both fiscal and monetary stimulus, provided the back drop for
another strong quarter for all domestic equity categories. Not only did companies generate strong quarterly earning results, but future guidance
for corporate earnings were encouraging as well. Earnings were strong across a multitude of sectors, which support the continued positive trend
in both business and consumer confidence. Stocks recorded strong gains in the second quarter, with the mix of leadership shifting back to prior
trends of large cap growth outperforming large cap value. Large cap growth (Russell 1000 Growth Index) returned 11.9%, outperforming large
cap value (Russell 1000 Value Index) which gained 5.2%. The outperformance of growth represented a reversal of the trend that developed over
the previous 6 months where value had outperformed growth. From a sector standpoint, real estate (+13%), technology (+11.6%), energy
(+11.3%) and communication services (+10.7%) were the top performing areas in the quarter. Defensive sectors trailed in the quarter with
staples (+3.8%) and utilities (-0.4%) noticeable laggards. In fact, utilities was the only sector that declined in the quarter.
7PARS: County of Contra Costa

Equity volatility in the quarter was highlighted by outsized moves from certain chatroom stocks that were bid up by investors on social media.
These investors would ‘hype’ certain names on social media, such as AMC Entertainment (Ticker: AMC) or Gamestop (Ticker: GME) with the
result leading to strong moves in the stock price of companies whose underlying fundamentals did not support such strong increases in market
capitalization. Such market activity was reminiscent of the dot.com bubble era when speculation in the market was rampant. Such behavior is
not usually an indicator of a healthy stock market.
. The Plan’s large cap equity segment returned 8.82% in the quarter, which exceeded the Russell 1000 Index return of 8.54%.
• The Columbia Contrarian Core Fund returned 8.36% in the quarter, which lagged the benchmark. The Fund ranked in the 37th
percentile of the Morningstar U.S. Large Cap Blend Universe.
• The Harbor Capital Appreciation Fund returned 13.55% in the quarter, which exceeded the Russell 1000 Growth Index’s return of
11.99%. The Fund ranked in the 5th percentile of the Morningstar U.S. Large Growth Universe.
• The T. Rowe Price Growth Stock Fund returned 12.73% in the quarter, which beat the Russell 1000 Growth Index. The Fund ranked
in the 11th percentile of the Morningstar U.S. Large Growth Universe.
• The Dodge and Cox Stock Fund gained 8.83% in the quarter and outperformed the Russell 1000 Value Index’s return of 5.21%. The
Fund ranked in the 3rd percentile of the Morningstar U.S. Large Value Universe.
• The iShares S&P500 Value ETF returned 4.96%, which trailed the Russell 1000 Value Index.
• The Russell 1000 ETF returned 8.49% in the quarter.
•The mid cap equity segment returned 7.39% in the quarter, which slightly trailed the Russell Mid Cap Index return of 7.5%.
• The iShares Russell Mid Cap ETF returned 7.43% in the quarter.
•The small cap equity segment returned 3.87% in the quarter, which underperformed the Russell 2000 Index return of 4.29%.
• The Victory RS Small Cap Growth Fund returned 3.09% in the quarter, which underperformed the Russell 2000 Growth Index return
of 3.92%. The fund ranked in the 81st percentile of the Morningstar U.S. Small Growth Universe.
• The Undiscovered Managers Behavioral Value Fund returned 4.18% in the quarter, which lagged the Russell 2000 Value Index’s
return of 4.56%. The Fund ranked in the 49th percentile of Morningstar’s U.S. Small Value Universe.
• The iShares Russell 2000 Index ETF returned 4.26% in the quarter.
PARS: County of Contra Costa8

Real Estate Equity
Real estate equity posted another strong quarterly result with the Wilshire REIT Index gaining 12.84%. Catalysts for the strong quarter came
from falling interest rates and a continuation of the recovery in the U.S. economy. Gains in REITs were broad based with self-storage
(+23.63%), regional malls (+18.69%), apartment/residential (+14.17%), data centers (+13.87%), and industrial (+12.96%) the leading gainers.
The biggest disappointment came from lodging/leisure (+0.1%), which is likely nothing more than the sector taking a break from strong
performance over the last few quarters. In general, a variety of REIT sectors are seeing improvements in their underlying fundamentals. Trends
in rent collections, rental rates, and occupancy levels argue for a sustained recovery for real estate equities. Some view REITs as offering
investors a hedge to an uptick in inflation.
• The Plan’s REIT equity returned 11.58% in the quarter, which trailed the Wilshire REIT Index return of 12.84%
International/Global Equity
Global stocks rallied as countries and economies around the world reopened. International economic activity remained strong in the second
quarter reflecting similar trends to the U.S. Manufacturing data, retail sales, corporate earnings, export data, and unemployment figures all
improved. While the strength of the rebound lagged the U.S., both developed and emerging market economic activity continued to recover.
Emerging market equities responded favorably to an increase in demand for raw materials, as well emerging market currencies faired well versus
the dollar. With respect to foreign exchange, the dollar rose against the yen, as Japan struggled against yet another wave of the Covid virus.
That said, the dollar fell versus the Euro, Swiss franc, and most other currencies.
With many nations showing encouraging signs of economic recovery, a rise in inflation has prompted some nations to begin reversing easy
monetary policies. The transitory/permanent inflation debate extends overseas as well, with at least in the short-run pent-up demand outpacing
supply. The Bank of England and the Bank of Canada began the tapering process by announcing a cut to their bond purchases. Brazil, Mexico,
Iceland, and Russia have all begun to raise rates, although from very low levels. Assuming the Covid-19 Delta variant gets under control in a
reasonable time frame, continued and further monetary tightening will likely continue. Encouraging trends regarding vaccination rates was
supported in the quarter by countries such as Brazil, China, South Korea, and Mexico witnessing large increases in the percentage of their
populations that had received at least one vaccine dose.
The top developed market performers for the quarter included Switzerland (+9%), Finland (+9%), and Canada (+9%). The underperformers were
Japan (-1%), Italy (+3%), and Germany (+3%). Japan was negatively impacted by a reduction in GDP for 2021, as the country struggles with
both disappointing vaccination rates for Covid-19, and the decision to limit visitors to the Tokyo Olympic games.
9PARS: County of Contra Costa

International/Global Equity (Cont.)
The top performing emerging market region was Latin America (+15%), which reflected, in a positive way, commodity-sensitive markets doing
better – led by gains in oil. Brazil was a leading contributor, gaining +22.9%, as well Argentina (+30%) also added to the region’s gains.
Emerging Asia was the least positive contributor, gaining only +3.8%. Indonesia (-5.1%), Thailand (-4.9%), and Malaysia (-2.5%) were the main
detractors, while China (+2.3%), South Korea (+4.8%) and India (+6.9%) offered modest gains in the quarter.
•The Plan’s international/global equity segment returned 5.78% in the quarter. This return outperformed the MSCI EAFE Index return
of 5.17% and the MSCI Emerging Market Index return of 5.05%. However, this trailed the MSCI-ACWI Index return of 7.39%.
• The iShares Core MSCI EAFE Index ETF returned 5.22% in the quarter.
• The Dodge & Cox International Stock Fund returned 4.66% in the quarter and underperformed the MSCI EAFE Index. The Fund
ranked in the 33rd percentile of the Foreign Large Value Universe as measured by Morningstar.
• The MFS International Growth Fund returned 7.01% in the quarter which beat the MSCI EAFE Index. The Fund ranked in the 43rd
percentile for foreign large growth managers as measured by Morningstar.
• The iShares MSCI ACWI Index ETF returned 7.34% in the quarter.
• The American Funds New Perspective Fund recorded a 8.31% return in the quarter, which exceeded the MSCI ACWI Index and
ranked in the 50th percentile within the Morningstar World Large Stock Universe
• The MFS Global Equity R6 Fund gained 7.76%, which beat the benchmark and ranked in the 22nd percentile of the Morningstar
World Large Stock Universe.
• The Hartford Schroders Emerging Market Equity Fund returned 2.9% during the quarter and lagged the MSCI Emerging Market
benchmark return of 5.05%. The Fund ranked in the 84th percentile of the Morningstar Diversified Emerging Market Universe.
10PARS: County of Contra Costa

Fixed Income
The second quarter of 2021 was characterized by the continuation of global monetary stimulus, increased Covid-19 vaccinations, an easing of
social distancing restrictions, a strong U.S. economic recovery, a pick-up in inflation, and a potentially less dovish Fed. Despite the
aforementioned, long maturity interest rates declined during the quarter, the interest rate curve flattened, and investment grade and high yield
credit spreads tightened with lower quality generally outperforming.
Given the unprecedented amount of fiscal stimulus and positive movement toward re-opening, U.S. economic data posted sharp gains in
manufacturing, employment, personal consumption, and consumer goods prices. Core PCE, the primary inflation metric that the Fed focuses on
to gauge interest rate policy registered the highest year-over-year reading since 1992. Drivers of the increased inflation metric include base
effect comparisons, supply chain disruptions, surging pent-up demand for travel and leisure, as well as shelter costs and wage pressures. While
most of these factors are believed to be transitory, it remains a controversial and greatly debated market issue.
The June Federal Open Market Committee meeting resulted in no change to the target rate, however the Fed pivoted to a potentially less dovish
stance on monetary policy. Specifically, the median estimate of the Fed Funds rate among FOMC members increased to 2 rate hikes by the end
of 2023. Further, current forecasts for near term inflation increased while range of long-term inflation forecasts widened. However, the
Committee re-emphasized their pledge to its new policy-making framework, which entails a willingness to allow average inflation to exceed 2.0%
for an undisclosed period of time in order to achieve more broad-based employment improvement. There was also no change to the Fed’s
quantitative easing (QE) program although internal dialogue has commenced regarding how and when to begin tapering QE purchases.
Intermediate and long maturity interest rates declined during the quarter and the interest rate curve flattened. Notably, 10 year rates declined 27
basis points to 1.47% while the 30 year bond fell 32 bps to 2.09%. This translated to a 3.1% and 7.8% gain for 10 and 30 year U.S. Treasuries
respectively. Short maturity interest rates were mixed with 2 year treasury rates increasing 9 basis points to 0.25%, 3 year rates increasing 11
basis points to 0.46%, while 5 year rates declined 5 bps to 0.89% reflecting the market’s anticipation that the Fed may accelerate its timeline
surrounding the removal of policy accommodation. The inflation expectations component of interest rates (TIPS break-evens) remained
relatively unchanged during the quarter.
The Bloomberg Barclays Aggregate Bond Index returned 1.83%, due to a combination of the rally in U.S. Treasuries and outperformance in
corporate credit. Investment grade corporate bonds gained 3.55% during the quarter, outperforming similar duration Treasuries by +112 basis
points. For the year-to-date period, corporates are still in negative territory from a total return standpoint at -1.27%, however outperforming U.S.
Treasuries by +204 basis points
11PARS: County of Contra Costa

Fixed Income (Cont.)
The high yield corporate bond index gained 2.74% during the quarter, outpacing equivalent Treasuries by +201 basis points. For the year-to-
date period, non-investment grade is ahead 3.62%, posting an excess return of +465 basis points. After an impressive rebound in 2020, high
yield corporate credit spreads continued to march tighter with the Barclays High Yield Index compressing 42 basis points during the quarter to set
a post financial crisis tight of +268. High yield spreads are now 35 basis points away from its all-time tight level of +233 in 1997.
Outlook:
We remain market weight investment grade corporate credit due to improving credit fundamentals and modestly positive supply/demand
technical factors offset by relatively rich valuations. Corporate balance sheets are on an improving trajectory after bottoming in mid-2020 while
EBITDA growth should begin to accelerate as the global economy continues to reopen. The potential for heightened shareholder friendly activity
such as share buybacks, increased dividends, and M&A pose some risk to a continued improvement in credit fundamentals on an issuer specific
basis. Although corporate credit valuations are very full, significant opportunities still exist within industry and issuer selection. Despite rich
valuations within asset-backed securities, credit improvement and relative value opportunities remain down the capital structure as well as within
esoteric securitized assets. The outlook for agency mortgage-backed securities is mixed and positioning remains underweight relative to the
Index. Federal Reserve asset purchases are creating a near-term technical positive, however the likely tapering of these purchases within the
next year could put valuations at risk given their rich relative starting place. Despite the significant rally in intermediate and long maturity U.S.
Treasury yields during the second quarter, we continue to expect a move higher over the next several quarters. The catalyst for higher rates may
be a combination of a continued global economic recovery, an eventual slowdown in Covid cases, record net U.S. Treasury issuance, Treasury
General Account balances stabilizing, and initial steps globally toward slowing accommodative monetary policy.
The separately managed fixed income portfolio returned 1.95% in the second quarter, outperforming the benchmark by 12 basis points. The
positive relative return was due to the investment grade credit overweight, as corporate bonds outperformed in the quarter. Sector and individual
selection effects added to performance, and more than offset duration positioning which remained 10% short of the index. Lower quality
investment grade corporate bonds outperformed. In terms of curve positioning, the portfolio was slightly bulleted to intermediate-term maturities,
which had an overall neutral effect to performance. Covid-sensitive industries such as Energy, Materials, Airlines, Communications and Autos
were notable outperformers, while lower quality investment grade and longer duration holdings performed best. During the period, we added
exposure to areas of the market that offered attractive relative value, including BBB Energy names, select Airline Equipment Trusts (EETC’s),
Insurance and U.S. banks.
12PARS: County of Contra Costa
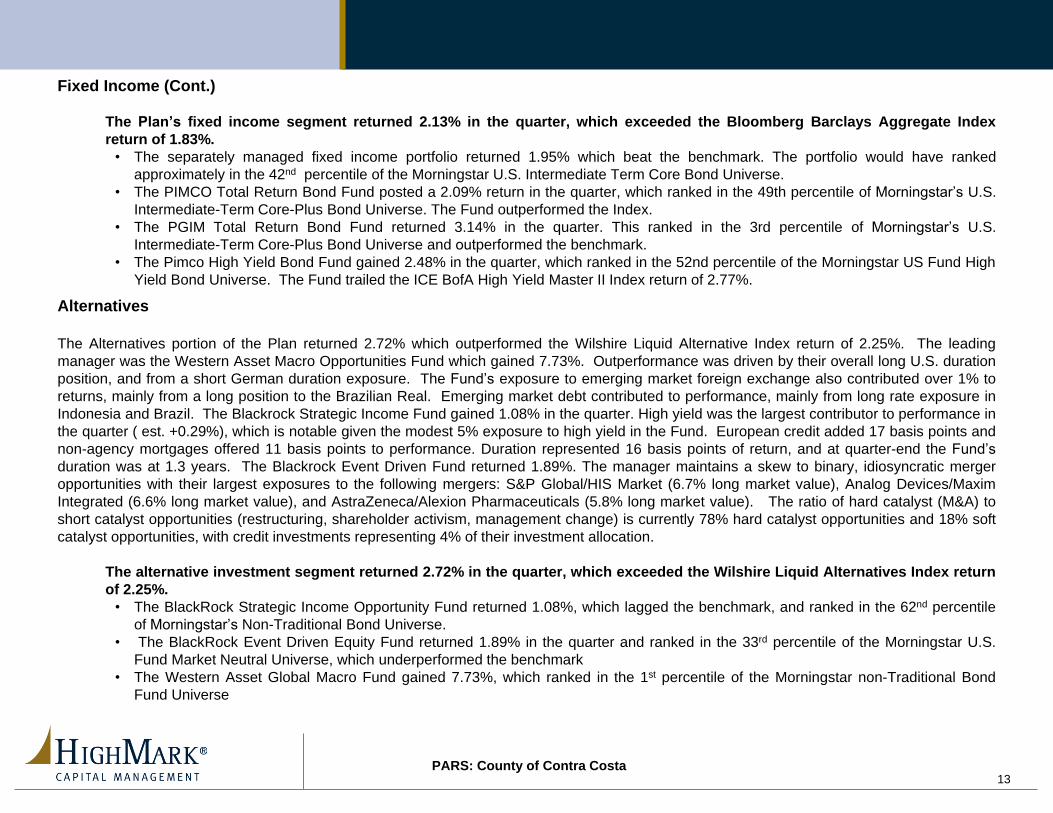
Fixed Income (Cont.)
The Plan’s fixed income segment returned 2.13% in the quarter, which exceeded the Bloomberg Barclays Aggregate Index
return of 1.83%.
• The separately managed fixed income portfolio returned 1.95% which beat the benchmark. The portfolio would have ranked approximately in the 42nd percentile of the Morningstar U.S. Intermediate Term Core Bond Universe.
• The PIMCO Total Return Bond Fund posted a 2.09% return in the quarter, which ranked in the 49th percentile of Morningstar’s U.S. Intermediate-Term Core-Plus Bond Universe. The Fund outperformed the Index.
• The PGIM Total Return Bond Fund returned 3.14% in the quarter. This ranked in the 3rd percentile of Morningstar’s U.S. Intermediate-Term Core-Plus Bond Universe and outperformed the benchmark.
• The Pimco High Yield Bond Fund gained 2.48% in the quarter, which ranked in the 52nd percentile of the Morningstar US Fund High Yield Bond Universe. The Fund trailed the ICE BofA High Yield Master II Index return of 2.77%.
Alternatives
The Alternatives portion of the Plan returned 2.72% which outperformed the Wilshire Liquid Alternative Index return of 2.25%. The leading
manager was the Western Asset Macro Opportunities Fund which gained 7.73%. Outperformance was driven by their overall long U.S. duration
position, and from a short German duration exposure. The Fund’s exposure to emerging market foreign exchange also contributed over 1% to
returns, mainly from a long position to the Brazilian Real. Emerging market debt contributed to performance, mainly from long rate exposure in
Indonesia and Brazil. The Blackrock Strategic Income Fund gained 1.08% in the quarter. High yield was the largest contributor to performance in
the quarter ( est. +0.29%), which is notable given the modest 5% exposure to high yield in the Fund. European credit added 17 basis points and
non-agency mortgages offered 11 basis points to performance. Duration represented 16 basis points of return, and at quarter-end the Fund’s
duration was at 1.3 years. The Blackrock Event Driven Fund returned 1.89%. The manager maintains a skew to binary, idiosyncratic merger
opportunities with their largest exposures to the following mergers: S&P Global/HIS Market (6.7% long market value), Analog Devices/Maxim
Integrated (6.6% long market value), and AstraZeneca/Alexion Pharmaceuticals (5.8% long market value). The ratio of hard catalyst (M&A) to
short catalyst opportunities (restructuring, shareholder activism, management change) is currently 78% hard catalyst opportunities and 18% soft
catalyst opportunities, with credit investments representing 4% of their investment allocation.
The alternative investment segment returned 2.72% in the quarter, which exceeded the Wilshire Liquid Alternatives Index return
of 2.25%.
• The BlackRock Strategic Income Opportunity Fund returned 1.08%, which lagged the benchmark, and ranked in the 62nd percentile
of Morningstar’s Non-Traditional Bond Universe.
• The BlackRock Event Driven Equity Fund returned 1.89% in the quarter and ranked in the 33rd percentile of the Morningstar U.S.
Fund Market Neutral Universe, which underperformed the benchmark
• The Western Asset Global Macro Fund gained 7.73%, which ranked in the 1st percentile of the Morningstar non-Traditional Bond
Fund Universe
13PARS: County of Contra Costa

Asset allocation/Manager Changes
We ended the quarter with a target asset allocation of 58.75% stocks, 38.25% bonds, 2.5% alternatives, and 0.5% cash.
There were no changes to managers in the quarter.
14PARS: County of Contra Costa

Economic and Market Forecasts - August
2020
2021 2022
Assumptions Assumptions
GDP 5.8% -7.5% 3.5% - 4.5%
S&P500 earnings $175 - $195 $205 - $215
Unemployment 4.9% - 5.4% 4.1% - 4.8%
Core PCE Inflation 2.1% - 2.5% 2.0% - 2.3%
Fed Funds Target 0.0% - 0.25% 0.0% - 0.25%
Economic and Market Forecasts - July 2021
Source - Highmark Asset Allocation Committee 2021 – 2022 Projections
15PARS: County of Contra Costa

Inception Date: 02/01/2011
* Benchmark from February 1, 2011 to June 30, 2013: 18% Russell 1000 Index, 6% Russell Midcap Index, 8% Russell 2000 Index, 8% MSCI ACWI Index, 10% MSCI EAFE Index, 45% Barclays Aggregate Index, 4% DJ Wilshire REIT Index, 1% Citigroup 3 Month T Bill Index. From
July 1, 2013 to June 30, 2015: 17% Russell 1000 Index, 6% Russell Midcap Index, 8% Russell 2000 Index, 7% MSCI AC World US Index, 9% MSCI EAFE Index, 38% Barclays Aggregate Index, 4% DJ Wilshire REIT Index, 10% HFRI FOF Market Defensive Index, 1% Citigroup 3
Month T-Bill Index. From July 1, 2015 to September 30, 2019: 17% Russell 1000 Index, 6% Russell Midcap Index, 8% Russell 2000 Index, 7% MSCI AC World Index, 9% MSCI EAFE Index, 38% Barclays Aggregate Index, 4% DJ Wilshire REIT Index, 10% Wilshire Liquid Alternative
Index, 1% Citigroup 3 Month T-Bill Index From October 1, 2019: 43% BBG Barclays US Aggregate Bd Index, 1% FTSE 3 Month T-Bill Index, 8% MSCI AC World Index, 10% MSCI EAFE Index, 19% Russell 1000 Index, 9% Russell 2000 Index, 6% Russell Midcap Index, 4% Wilshire
REIT Index. ** Dynamic Alternatives Index represents the HFRI FOF Market Defensive Index from 07/01/2013 until 06/30/2015, and then the Wilshire Liquid Alternatives Index from 07/01/2015 forwards. Returns are gross-of-fees unless otherwise noted. Returns for periods over one
year are annualized. The information presented has been obtained from sources believed to be accurate and reliable. Past performance is not indicative of future returns. Securities are not FDIC insured, have no bank guarantee, and may lose value.
16PARS: County of Contra Costa
3 Months
Year
to Date
(6 Months) 1 Year 3 Years 5 Years 10 Years
Inception
to Date
02/01/2011
Cash Equivalents .01 .01 .03 1.14 1.01 .53 .51
Lipper Money Market Funds Index .00 .00 .01 1.11 .95 .48 .46
Fixed Income ex Funds 1.95 -1.36 .41 5.59 3.30 3.67 3.84
Total Fixed Income 2.13 -1.24 1.02 5.76 3.54 3.82 3.96
BBG Barclays US Aggregate Bd Index 1.83 -1.60 -.33 5.34 3.03 3.39 3.51
Total Equities 7.04 14.27 44.48 15.17 15.26 11.51 11.21
Large Cap Funds 8.82 15.81 44.04 18.88 18.37 14.69 14.01
Russell 1000 Index 8.54 14.95 43.07 19.16 17.99 14.90 14.68
Mid Cap Funds 7.39 16.14 49.31 16.21 15.37 12.14 11.98
Russell Midcap Index 7.50 16.25 49.80 16.45 15.62 13.24 13.29
Small Cap Funds 3.87 15.75 60.79 13.85 16.81 13.59 13.42
Russell 2000 Index 4.29 17.54 62.03 13.52 16.47 12.34 12.49
International Equities 5.78 9.99 37.32 12.13 12.92 7.46 7.42
MSCI AC World Index 7.39 12.30 39.26 14.57 14.61 9.90 9.80
MSCI EAFE Index 5.17 8.83 32.35 8.27 10.28 5.89 5.90
MSCI EM Free Index 5.05 7.45 40.90 11.27 13.03 4.28 4.47
RR: REITS 11.58 21.37 34.12 11.79
Wilshire REIT Index 12.84 22.78 37.52 10.06 6.36 9.38 9.71
Alternatives 2.72 3.23 9.10 4.23 1.61
Dynamic Alternatives Index 2.25 4.47 11.59 3.80 3.25 1.43 .99
Total Managed Portfolio 4.98 7.63 24.11 11.07 9.67 7.76 7.56
Total Account Net of Fees 4.97 7.60 24.05 11.01 9.60 7.66 7.46
Contra Costa Policy Benchmark 4.88 7.32 22.95 10.94 9.61 7.82 7.87
Selected Period Performance
PARS/COUNTY OF CONTRA COSTA PRHCPAccount 6746038001
Period Ending: 6/30/2021

Manager Watch List
Name of Fund Date on watch list Date exiting watch list Recommendation Rationale
Undiscovered Managers Behavioral
Value Fund4Q2020 Retain on watch list
The second quarter return of 4.18% lagged the
Russell 2000 Value Index by 0.38%. The Fund
ranked in the 49th percentile of the Morningstar
U.S. Small Value Universe. While technically they
have ‘earned’ their way off the watch list, the bulk
of their recent strong performance came in the
fourth quarter of 2020 when they posted a 43.3%
return, which ranked in the 1st percentile of the
Morningstar U.S. Small Value Universe. We
would like to maintain watch list status for an
additional quarter.
17PARS: County of Contra Costa

Investment Strategy
As of June 30, 2021Tactical Asset Allocation
Asset Class % Portfolio Weighting Rationale
Target
Current
Portfolio
Over/Under
Weighting
Cash 1.0% 0.5% -0.5% ▪ Money market yields are at 0.01%. We maintain an underweight allocation to cash
Fixed Income 43.0% 38.25% -4.75% ▪ Bond yields are at historically low levels, and fixed income will likely offer modest total return. High yield spreads continue to offer modest
value as investors search for yield in a low interest rate environment. Corporate credit spreads are tight, offering only modest upside at
these levels.
Alternatives 0.0% 2.5% +2.5% ▪ Alternatives offer a reasonable diversification benefit with respect to the 95% of the portfolio which is invested in fixed income and equities.
Real Estate (REITS) 4.0% 3.5% -0.5% ▪ Interest rates will likely be low for several years, which will support valuation. The pandemic will secularly alter some REIT sectors such as
office, industrial, and regional malls. As the ‘re-opening’ progresses, we are seeing a rebound in corporate fundamentals. The risk and
reward seems reasonable with respect to REIT equity.
Global Equity 8.0% 7.0% -1.0% ▪ We expect global equities to trade on central bank stimulus, the path of the coronavirus, and the ability of various global economies to
recover in 2021/22. The recovery in global equities might be uneven due to Covid cases spiking in certain regions, but as long as vaccines
can be manufactured and distributed to the global population, the recovery will likely be merely pushed out 3-4 months. We continue to
monitor hostilities between China and Taiwan, but for now we believe that China will only serve as a strong nuisance in the region, and
tensions will not escalate.
International (Developed) 10.0% 10.0% - ▪ The comments above related to global equity hold true for international developed equity markets as well.
International (Emerging) 0.0% 2.5% +2.5% ▪ Vaccine optimism and easing restrictions on social distancing should benefit emerging market equities. Aside from the impact from the
virus, emerging market equities will be impacted by events in China, as China represents over 30% of the emerging market index. Recent
Chinese regulatory policies surrounding technology, transportation, and educational tutorial companies has erased billions in market
capitalization for numerous companies. These policies at the very least call into question the premium investors are wiling to pay for
Chinese related companies. We are reviewing our current allocation target to emerging market equities.
Total Domestic Equity 34.0% 35.75% +1.75%
Large Cap 19.0% 20.25% +1.25% ▪ The U.S. economy is poised to show tremendous growth in 2021. Much of the gains experienced over the previous 12 months in the
equity market, reflect the future benefits from five interest rate cuts in 2020, as well as several trillion in economic stimulus. While the
S&P500 Index trading at 22X next year’s earnings is expensive, it is our desire given the extremely low interest rate environment, and the
strong expected growth in earnings and cash flow generation, to be slightly overweight large cap equities.
Mid Cap 6.0% 6.5% +0.5% ▪ Mid-cap equities currently trade at 22.5X next year’s earnings. Not inexpensive, but mid-cap equities should perform well in a pro-cycle
environment.
Small Cap 9.0% 9.0% - • We remain neutral on a tactical basis relative to the benchmark due to our belief that small caps will continue to perform in a pro-cycle
environment. Valuations are at a 29X forward PE level, but if the recovery proves to be robust, earnings may grow into that valuation
level.
18PARS: County of Contra Costa

19PARS: County of Contra Costa
3/31/2021 3/31/2021 6/30/2021 6/30/2021 Target
Asset Allocation Market Value % of Total Market Value % of Total Allocation
Large Cap Equities
Columbia Contrarian Core Inst3 14,610,289 3.5% 13,283,222 3.0% --
iShares Russell 1000 ETF 37,675,066 9.1% 40,413,077 9.1% --
Vanguard Growth & Income Adm 8,388,638 2.0% 6,657,042 1.5% --
Dodge & Cox Stock 6,252,474 1.5% 8,698,113 2.0% --
iShares S&P 500 Value ETF 6,240,407 1.5% 6,703,151 1.5% --
Harbor Capital Appreciation Retirement 6,283,581 1.5% 6,709,410 1.5% --
T. Rowe Price Growth Stock I 6,228,629 1.5% 7,021,295 1.6% --
Total Large Cap Equities 85,679,083$ 20.7% 89,485,310$ 20.1% 19.0%
Range Range 13-32%
Mid Cap Equities
iShares Russell Mid-Cap ETF 27,186,575 6.6% 29,139,242 6.6% --
Total Mid Cap Equities 27,186,575$ 6.6% 29,139,242$ 6.6% 6.0%
Range Range 2-10%
Small Cap Equities
iShares Russell 2000 ETF 16,931,295 4.1% 17,758,972 4.0% --
Undiscovered Managers Behavioral Val R6 10,568,961 2.6% 10,949,848 2.5% --
Victory RS Small Cap Growth R6 10,590,317 2.6% 11,080,474 2.5% --
Total Small Cap Equities 38,090,573$ 9.2% 39,789,294$ 9.0% 9.0%
Range Range 4-12%
International Equities
DFA Large Cap International I 8,341,346 2.0% 10,969,251 2.5% --
iShares Core MSCI EAFE ETF 16,531,152 4.0% 17,684,477 4.0% --
Dodge & Cox International Stock 6,167,768 1.5% 7,654,069 1.7% --
MFS International Growth R6 6,203,096 1.5% 7,709,635 1.7% --
Hartford Schroders Emerging Mkts Eq F 10,520,647 2.5% 10,825,521 2.4% --
Total International Equities 47,764,009 11.6% 54,842,952$ 12.3% 10.0%
Range Range 4-20%
Global Equities
iShares MSCI ACWI ETF 16,704,534 4.0% 17,775,035 4.0% --
American Funds New Perspective R6 6,145,748 1.5% 6,656,155 1.5% --
MFS Global Equity R6 6,227,282 1.5% 6,503,234 1.5% --
Total Global Equities 29,077,564$ 7.0% 30,934,425$ 7.0% 8.0%
Range Range 4-12%
Asset AllocationPeriod Ending June 30, 2021

20PARS: County of Contra Costa
3/31/2021 3/31/2021 6/30/2021 6/30/2021 Target
Asset Allocation Market Value % of Total Market Value % of Total Allocation
Real Estate
Vanguard Real Estate ETF 14,529,312 3.5% 15,818,471 3.6% --
14,529,312$ 3.5% 15,818,471$ 3.6% 4.0%
Range Range 0-8%
Fixed Income
Core Fixed Income Holdings 115,092,235 27.8% 122,018,507 27.5% --
PIMCO Total Return Instl 20,019,215 4.8% 21,229,178 4.8% --
PGIM Total Return Bond R6 20,000,527 4.8% 21,294,555 4.8% --
PIMCO High Yield Instl 5,261,205 1.3% 5,391,537 1.2% --
Total Fixed Income 160,373,183$ 38.8% 169,933,776$ 38.3% 43.0%
Range Range 30-50%
Alternatives
BlackRock Event Driven Equity Instl 3,999,882 1.0% 4,346,106 1.0% --
BlackRock Strategic Income Opps K 4,181,049 1.0% 4,458,405 1.0% --
Western Asset Macro Opportunities IS 2,062,078 0.5% 2,221,429 0.5% --
Total Alternatives 10,243,008$ 2.5% 11,025,940$ 2.5% 0.0%
Range Range 0-10%
Cash
Money Market 570,216 0.1% 3,185,967 0.7% --
Total Cash 570,216$ 0.1% 3,185,967$ 0.7% 1.0%
Range Range 0-5%
TOTAL 413,513,523$ 100.0% 444,155,378$ 100.0% 100.0%
Asset AllocationPeriod Ending June 30, 2021

*Ending Market Value differs from total market value on the previous page due to differences in reporting methodology. The above ending market value is reported as of trade
date and includes accruals. The Asset Allocation total market value is reported as of settlement date.
21PARS: County of Contra Costa
Investment Summary Second Quarter 2021 Year to Date 2021
Beginning Value 414,054,940.69 399,003,595.89$
Net Contributions/Withdrawals 9,961,182.08 14,915,005.55
Fees Deducted -52,468.51 -104,367.43
Income Received 1,806,254.69 3,208,519.71
Market Appreciation 18,925,342.10 27,763,234.98
Net Change in Accrued Income 32,745.56 -57,992.09
Ending Market Value* 444,727,996.61$ 444,727,996.61$
Investment Summary Second Quarter 2020 Year to Date 2020
Beginning Value 291,909,001.42 331,392,093.14$
Net Contributions/Withdrawals 10,988,202.36 15,940,630.58
Fees Deducted -49,438.12 -99,521.50
Income Received 1,709,642.79 3,297,971.13
Market Appreciation 36,851,554.02 -9,027,370.85
Net Change in Accrued Income 19,978.97 -74,861.06
Ending Market Value 341,428,941.44$ 341,428,941.44$
Investment Summary
Period Ending June 30, 2021

22PARS: County of Contra Costa
3-Month YTD 1-Year 3-Year 5-Year 10-Year
Fund Name Inception Return Rank Return Rank Return Rank Return Rank Return Rank Return Rank
Columbia Contrarian Core Inst3 (7/13) 8.36 37 16.09 29 44.13 23 20.19 8 17.45 30 15.01 --
Vanguard Growth & Income Adm (12/16) 8.38 36 15.89 32 41.52 45 18.08 40 17.18 38 14.86 11
Dodge & Cox Stock (10/14) 8.83 3 26.09 3 58.92 6 15.79 10 17.44 3 13.89 2
iShares S&P 500 Value ETF (12/19) 4.96 67 16.18 64 39.27 64 12.96 36 12.36 46 11.67 33
T. Rowe Price Growth Stock I 12.73 11 15.63 13 45.33 19 23.22 41 24.36 20 18.06 --
Harbor Capital Appreciation Retirement 13.55 5 9.73 85 43.18 31 26.38 14 26.57 11 18.51 --
Russell 1000 TR USD 8.54 -- 14.95 -- 43.07 -- 19.16 -- 17.99 -- 14.90 --
iShares Russell 1000 ETF (3/15) 8.49 31 14.88 56 42.87 33 19.00 19 17.84 21 14.75 16
iShares Russell Mid-Cap ETF (3/15) 7.43 14 16.15 61 49.53 56 16.29 17 15.44 22 13.06 12
Russell Mid Cap TR USD 7.50 -- 16.25 -- 49.80 -- 16.45 -- 15.62 -- 13.24 --
Undiscovered Managers Behavioral Val R6 (9/16) 4.18 49 27.85 34 84.83 16 10.16 36 12.80 37 12.70 --
Russell 2000 Value TR USD 4.56 -- 26.69 -- 73.28 -- 10.27 -- 13.62 -- 10.85 --
Victory RS Small Cap Growth R6 (2/19) 3.09 81 0.44 97 34.82 98 15.92 68 22.23 35 14.64 --
Russell 2000 Growth TR USD 3.92 -- 8.98 -- 51.36 -- 15.94 -- 18.76 -- 13.52 --
iShares Russell 2000 ETF (3/15) 4.26 53 17.45 70 61.84 44 13.44 26 16.41 13 12.34 22
Dodge & Cox International Stock 4.66 33 12.15 42 40.39 27 7.48 16 10.22 10 5.52 19
MFS International Growth R6 7.01 43 7.77 40 31.10 70 12.74 55 14.08 42 8.16 42
MFS Global Equity R6 (3/15) 7.76 22 11.91 61 39.28 42 15.52 15 14.40 31 11.16 --
iShares Core MSCI EAFE ETF (3/15) 5.22 48 9.14 48 33.89 46 8.50 52 10.75 38 -- --
iShares MSCI ACWI ETF (3/15) 7.34 31 12.25 51 39.25 43 14.67 30 14.79 25 10.07 41
American Funds New Perspective R6 (3/15) 8.31 50 10.76 47 46.25 13 20.40 30 19.64 26 13.70 23
DFA Large Cap International I (12/18) 5.55 32 10.41 23 34.71 41 8.60 49 10.56 44 5.85 44
MSCI EAFE NR USD 5.17 -- 8.83 -- 32.35 -- 8.27 -- 10.28 -- 5.89 --
MSCI ACWI NR USD 7.39 -- 12.30 -- 39.26 -- 14.57 -- 14.61 -- 9.90 --
Hartford Schroders Emerging Mkts Eq F (11/12) 2.90 84 6.54 72 43.85 35 13.28 26 15.03 18 5.57 --
MSCI EM NR USD 5.05 -- 7.45 -- 40.90 -- 11.27 -- 13.03 -- 4.28 --
Data Source: Morningstar, SEI Investments
COUNTY OF CONTRA COSTA
For Period Ending June 30, 2021
Returns less than one year are not annualized. Past performance is not indicative of future returns. The information presented has been obtained from sources believed
accurate and reliable. Securities are not FDIC insured, have no bank guarantee and may lose value.
LARGE CAP EQUITY FUNDS
MID CAP EQUITY FUNDS
SMALL CAP EQUITY FUNDS
INTERNATIONAL EQUITY FUNDS

23PARS: County of Contra Costa
3-Month YTD 1-Year 3-Year 5-Year 10-Year
Fund Name Inception Return Rank Return Rank Return Rank Return Rank Return Rank Return Rank
Vanguard Real Estate ETF (6/17) 11.66 63 21.37 47 34.33 65 11.92 35 7.06 48 9.72 30
Wilshire REIT Index 12.84 -- 22.78 -- 37.52 -- 10.06 -- 6.36 -- 9.38 --
Core Fixed Income Portfolio 1.95 42 -1.36 49 0.41 78 5.59 33 3.30 33 3.67 25
PIMCO Total Return Instl 2.09 49 -1.06 68 1.47 78 5.77 51 3.84 44 3.77 55
PGIM Total Return Bond R6 (5/16) 3.14 3 -1.44 88 2.70 47 6.24 29 4.31 22 4.76 8
BBgBarc US Agg Bond TR USD 1.83 -- -1.60 -- -0.33 -- 5.34 -- 3.03 -- 3.39 --
PIMCO High Yield Instl (5/16) 2.48 52 2.54 77 12.44 76 6.89 34 6.59 40 5.99 29
ICE BofA US High Yield Mstr II Index 2.77 -- 3.70 -- 15.62 -- 7.15 -- 7.30 -- 6.53 --
BlackRock Event Driven Equity Instl (3/19) 1.89 33 2.60 58 8.62 49 6.38 41 6.23 30 7.52 10
BlackRock Strategic Income Opps K (7/13) 1.08 62 1.30 58 8.45 39 5.42 17 4.73 27 3.86 --
Western Asset Macro Opportunities IS (3/21) 7.73 1 -1.51 93 8.70 37 7.46 2 6.29 5 -- --
Dynamic Alternatives Index 2.25 -- 4.47 -- 11.59 -- 3.80 -- 3.25 -- 1.43 --
Data Source: Morningstar, SEI Investments
ALTERNATIVE FUNDS
COUNTY OF CONTRA COSTA
For Period Ending June 30, 2021
Returns less than one year are not annualized. Past performance is not indicative of future returns. The information presented has been obtained from sources believed
accurate and reliable. Securities are not FDIC insured, have no bank guarantee and may lose value.
REIT EQUITY FUNDS
BOND FUNDS

.
2020 2019 2018 2017 2016 2015 2014 2013
Fund Name Inception Return Rank Return Rank Return Rank Return Rank Return Rank Return Rank Return Rank Return Rank
Columbia Contrarian Core Inst3 (7/13) 22.44 11 33.08 10 -8.81 82 21.89 28 8.77 73 3.25 7 13.14 27 36.04 15
Vanguard Growth & Income Adm (12/16) 18.08 41 29.77 51 -4.61 31 20.80 54 12.12 24 2.03 16 14.16 13 32.74 37
Dodge & Cox Stock (10/14) 7.16 21 24.83 58 -7.07 31 18.33 24 21.28 6 -4.49 62 10.40 54 40.55 2
iShares S&P 500 Value ETF (12/19) 1.24 62 31.71 5 -9.09 57 15.19 61 17.17 25 -3.24 42 12.14 24 31.69 45
T. Rowe Price Growth Stock I 37.09 38 30.98 61 -0.89 37 33.84 15 1.58 63 10.93 -- 8.83 -- 39.20 --
Harbor Capital Appreciation Retirement 54.56 10 33.39 39 -0.96 37 36.68 5 -1.04 -- 10.99 -- 9.93 -- 37.66 --
Russell 1000 TR USD 20.96 -- 31.43 -- -4.78 -- 21.69 -- 12.05 -- 0.92 -- 13.24 -- 33.11 --
iShares Russell 1000 ETF (3/15) 20.80 19 31.26 30 -4.91 37 21.53 37 11.91 27 0.82 30 13.08 28 32.93 35
iShares Russell Mid-Cap ETF (3/15) 16.91 23 30.31 21 -9.13 30 18.32 27 13.58 61 -2.57 30 13.03 8 34.50 46
Russell Mid Cap TR USD 17.10 -- 30.54 -- -9.06 -- 18.52 -- 13.80 -- -2.44 -- 13.22 -- 34.76 --
Undiscovered Managers Behavioral Val R6 (9/16) 3.62 46 23.34 30 -15.20 49 13.53 11 20.97 80 3.52 1 5.83 25 37.72 --
Russell 2000 Value TR USD 4.63 -- 22.39 -- -12.86 -- 7.84 -- 31.74 -- -7.47 -- 4.22 -- 34.52 --
Victory RS Small Cap Growth R6 (2/19) 38.32 44 38.38 8 -8.66 70 37.05 -- 0.88 -- 0.09 -- 9.36 -- 49.22 --
Russell 2000 Growth TR USD 34.63 -- 28.48 -- -9.31 -- 22.17 -- 11.32 -- -1.38 -- 5.60 -- 43.30 --
iShares Russell 2000 ETF (3/15) 19.89 14 25.42 35 -11.02 36 14.66 24 21.36 43 -4.33 44 4.94 44 38.85 35
Dodge & Cox International Stock 2.10 42 22.78 7 -17.98 81 23.94 72 8.26 2 -11.35 98 0.08 9 26.31 8
DFA Large Cap International I (12/18) 8.12 57 22.04 43 -14.14 44 25.37 48 3.16 23 -2.86 72 -5.24 49 20.69 39
MFS International Growth R6 15.82 77 27.31 60 -8.79 9 32.58 31 2.79 6 0.40 52 -5.01 57 13.94 78
MFS Global Equity R6 (3/15) 14.25 52 30.66 17 -9.51 50 24.04 41 7.43 27 -1.34 48 4.08 33 27.93 34
iShares Core MSCI EAFE ETF (9/20) 8.55 51 22.67 34 -14.20 46 26.42 35 1.36 40 0.53 28 -4.82 43 23.73 15
iShares MSCI ACWI ETF (3/15) 16.38 41 26.70 45 -9.15 45 24.35 39 8.22 21 -2.39 62 4.64 28 22.91 63
American Funds New Perspective R6 (3/15) 33.81 14 30.48 19 -5.56 18 29.30 16 2.19 77 5.63 6 3.56 40 27.23 38
MSCI EAFE NR USD 7.82 -- 22.01 -- -13.79 -- 25.03 -- 1.00 -- -0.81 -- -4.90 -- 22.78 --
MSCI ACWI NR USD 16.25 -- 26.60 -- -9.41 -- 23.97 -- 7.86 -- -2.36 -- 4.16 -- 22.80 --
Hartford Schroders Emerging Mkts Eq F (11/12) 23.78 25 22.32 30 -15.42 45 40.96 -- 10.41 -- -12.68 -- -4.61 -- -2.28 --
MSCI EM PR USD 15.84 -- 15.42 -- -16.63 -- 34.35 -- 8.58 -- -16.96 -- -4.63 -- -4.98 --
Data Source: Morningstar, SEI Investments
COUNTY OF CONTRA COSTA
Returns less than one year are not annualized. Past performance is not indicative of future returns. The information presented has been obtained from sources believed accurate and reliable. Securities are not FDIC insured, have no bank
guarantee and may lose value.
For Period Ending December 31, 2020
LARGE CAP EQUITY FUNDS
MID CAP EQUITY FUNDS
SMALL CAP EQUITY FUNDS
INTERNATIONAL EQUITY FUNDS
PARS: County of Contra Costa24

.
2020 2019 2018 2017 2016 2015 2014 2013
Fund Name Inception Return Rank Return Rank Return Rank Return Rank Return Rank Return Rank Return Rank Return Rank
Fixed Income Core Portfolio 7.60 50.00 9.20 21 .14 24 3.49 59 3.63 37 0.78 14 4.74 70 -1.40 41
PIMCO Total Return Instl 8.88 34 8.26 73 -0.26 30 5.13 17 2.60 82 0.73 11 4.69 72 -1.92 78
PGIM Total Return Bond R6 (5/16) 8.10 52 11.13 7 -0.63 46 6.71 3 4.83 21 0.09 40 7.25 7 -0.91 42
BBgBarc US Agg Bond TR USD 7.51 -- 8.72 -- 0.01 -- 3.54 -- 2.65 -- 0.55 -- 5.97 -- -2.02 --
PIMCO High Yield Instl (12/20) 5.34 48 14.93 22 -2.49 44 7.01 39 12.70 61 -1.85 22 3.31 13 5.77 68
ICE BofA US High Yield Mstr II Index 6.17 -- 14.41 -- -2.27 -- 7.48 -- 17.49 -- -4.64 -- 2.85 -- 7.42 --
BlackRock Strategic Income Opps K (7/13) 7.29 25 7.82 36 -0.47 46 4.97 37 3.65 -- -0.30 -- 3.89 -- 3.28 --
BlackRock Event Driven Equity Instl (3/19) 6.30 30 7.29 13 5.49 11 7.14 9 4.29 37 -1.56 -- 10.40 -- 32.30 --
Eaton Vance Glb Macr Absolt Retrn R6 (7/19) 3.65 52 9.82 18 -3.13 78 4.21 -- 4.00 -- 2.63 -- 3.03 -- -0.24 --
Dynamic Alternatives Index 3.19 -- 6.66 -- -4.24 -- 5.07 -- 2.29 -- -5.19 -- 6.39 -- 0.54 --
Data Source: Morningstar, SEI Investments
COUNTY OF CONTRA COSTA
Returns less than one year are not annualized. Past performance is not indicative of future returns. The information presented has been obtained from sources believed accurate and reliable. Securities are not FDIC insured, have no bank
guarantee and may lose value.
ALTERNATIVE FUNDS
For Period Ending December 31, 2020
BOND FUNDS
PARS: County of Contra Costa25

Columbia Contrarian Core Inst3COFYX
Key Informa�on
Morningstar Category
Morningstar Ra�ng Overall
Incep�on Date
Expense Ra�o
Fund Size (Mil)
Por�olio Date
Manager Name
US Fund Large Blend
ÙÙÙÙ
11/8/2012
0.64
12,871.85
6/30/2021
Guy W. Pope
Asset Alloca�on
%
Cash 0.9
US Equity 97.0
NonUS Equity 2.1
Total 100.0
HoldingsBased Style Map
Mic
roS
ma
llM
idLa
rge
Gia
nt
DeepVal CoreVal Core CoreGrth HighGrth
Columbia Contrarian Core Inst3 6/30/2021
Russell 1000 TR USD 6/30/2021
US Fund Large Blend 6/30/2021
YTD
Peer
group
quar�le
1 year
Peer
group
quar�le
3 years
Peer
group
quar�le
5 years
Peer
group
quar�le
10 years
Peer
group
quar�le
Columbia Contrarian Core Inst3
Russell 1000 TR USD
US Fund Large Blend
14.95 43.07 19.16 17.99 14.90
16.09 44.13 20.19 17.45
14.78 39.87 16.16 15.65 12.51
2 1 1 2
3 2 1 1 1
3 3 3 3 3
Rolling Returns
Time Period: 7/1/2016 to 6/30/2021
Peer Group (595%): Funds U.S. Large Blend Rolling Window: 3 Years 3 Months shi� Calcula�on Benchmark: Russell 1000 TR USD
07 08 09 10 11 12
2020
01 02 03 04 05 06 07 08 09 10 11 12
2021
01 02 03 04 05 06
0.0
7.5
15.0
22.5
Columbia Contrarian Core Inst3 Russell 1000 TR USD US Fund Large Blend
Re
turn
Performance Rela�ve to Peer Group
Peer Group (595%): Funds U.S. Large Blend
7.5
15.0
22.5
30.0
37.5
YTD 1 year 3 years 5 years 10 years
45.0
52.5
Columbia Contrarian Core Inst3 Russell 1000 TR USD US Fund Large Blend
Re
turn
Returns
As of Date: 6/30/2021 Calcula�on Benchmark: Russell 1000 TR USD
Quarter YTD 1 Year 3 Years 5 Years 10 Years0.0
5.0
10.0
15.0
20.0
25.0
30.0
35.0
40.0
45.0
50.0
8.4
16.1
44.1
20.217.4
8.5
15.0
43.1
19.2 18.014.9
7.5
14.8
39.9
16.2 15.612.5
Columbia Contrarian Core Inst3 Russell 1000 TR USD US Fund Large Blend
Re
turn
RiskReward
Time Period: 7/1/2016 to 6/30/2021
Peer Group (595%): Funds U.S. Large Blend Calcula�on Benchmark: Russell 1000 TR USD
Std Dev
0.0 3.0 6.0 9.0 12.0 15.0 18.0 21.0
0.0
4.0
8.0
12.0
16.0
20.0
24.0
Re
turn
Columbia Contrarian Core Inst3 Risk
Time Period: 7/1/2016 to 6/30/2021
Calcula�on Benchmark: Russell 1000 TR USD
Inv Bmk1
Return
Std Dev
Downside Devia�on
Alpha
Beta
R2
Sharpe Ra�o (arith)
Tracking Error
17.45
15.50
1.59
0.40
1.00
98.01
1.05
2.20
17.99
15.40
0.00
0.00
1.00
100.00
1.09
0.00
Monthly Es�mated FundLevel Net Flow
Time Period: 7/1/2016 to 6/30/2021
2017 2019 2021
500M
250M
0M
250M
500M
Columbia Contrarian Core Inst3 US Fund Large Blend
Es�mat
ed Fund
Level N
et Flow
Mo
nthly R
eturn
Source: Morningstar Direct, as of June 30, 2021 Informa�on provided herein was obtained from thirdparty sources deemed reliable. HighMark and its affiliates make no representa�ons or warran�es with respect to the �meliness, accuracy, or completeness of the
informa�on and bear no liability for any loss arising from its use.

Vanguard Growth & Income AdmVGIAX
Key Informa�on
Morningstar Category
Morningstar Ra�ng Overall
Incep�on Date
Expense Ra�o
Fund Size (Mil)
Por�olio Date
Manager Name
US Fund Large Blend
ÙÙÙÙ
5/14/2001
0.22
13,092.31
3/31/2021
Mul�ple
Asset Alloca�on
%
Cash 0.2
US Equity 98.9
NonUS Equity 0.9
US Bond 0.0
Total 100.0
HoldingsBased Style Map
Mic
roS
ma
llM
idLa
rge
Gia
nt
DeepVal CoreVal Core CoreGrth HighGrth
Vanguard Growth & Income Adm 3/31/2021
Russell 1000 TR USD 6/30/2021
US Fund Large Blend 6/30/2021
YTD
Peer
group
quar�le
1 year
Peer
group
quar�le
3 years
Peer
group
quar�le
5 years
Peer
group
quar�le
10 years
Peer
group
quar�le
Vanguard Growth & Income Adm
Russell 1000 TR USD
US Fund Large Blend
15.89 41.52 18.08 17.18 14.86
14.95 43.07 19.16 17.99 14.90
14.78 39.87 16.16 15.65 12.51
2 2 2 2 1
3 2 1 1 1
3 3 3 3 3
Rolling Returns
Time Period: 7/1/2016 to 6/30/2021
Peer Group (595%): Funds U.S. Large Blend Rolling Window: 3 Years 3 Months shi� Calcula�on Benchmark: Russell 1000 TR USD
07 08 09 10 11 12
2020
01 02 03 04 05 06 07 08 09 10 11 12
2021
01 02 03 04 05 06
0.0
5.0
10.0
15.0
20.0
Vanguard Growth & Income Adm Russell 1000 TR USD US Fund Large Blend
Re
turn
Performance Rela�ve to Peer Group
Peer Group (595%): Funds U.S. Large Blend
7.5
15.0
22.5
30.0
37.5
YTD 1 year 3 years 5 years 10 years
45.0
52.5
Vanguard Growth & Income Adm S&P 500 TR USD US Fund Large Blend
Re
turn
Returns
As of Date: 6/30/2021 Calcula�on Benchmark: Russell 1000 TR USD
Quarter YTD 1 Year 3 Years 5 Years 10 Years0.0
5.0
10.0
15.0
20.0
25.0
30.0
35.0
40.0
45.0
50.0
8.4
15.9
41.5
18.1 17.214.9
8.5
15.0
43.1
19.2 18.014.9
7.5
14.8
39.9
16.2 15.612.5
Vanguard Growth & Income Adm Russell 1000 TR USD US Fund Large Blend
Re
turn
RiskReward
Time Period: 7/1/2016 to 6/30/2021
Peer Group (595%): Funds U.S. Large Blend Calcula�on Benchmark: Russell 1000 TR USD
Std Dev
0.0 3.0 6.0 9.0 12.0 15.0 18.0 21.0
0.0
4.0
8.0
12.0
16.0
20.0
24.0
Re
turn
Vanguard Growth & Income Adm Risk
Time Period: 7/1/2016 to 6/30/2021
Calcula�on Benchmark: Russell 1000 TR USD
Inv Bmk1
Return
Std Dev
Downside Devia�on
Alpha
Beta
R2
Sharpe Ra�o (arith)
Tracking Error
17.99
15.40
0.00
0.00
1.00
100.00
1.09
0.00
17.18
15.25
0.86
0.52
0.99
99.46
1.05
1.14
Monthly Es�mated FundLevel Net Flow
Time Period: 7/1/2016 to 6/30/2021
2017 2019 2021
1,000M
0M
1,000M
2,000M
3,000M
Vanguard Growth & Income Adm US Fund Large Blend
Es�mat
ed Fund
Level N
et Flow
Mo
nthly R
eturn
Source: Morningstar Direct, as of June 30, 2021 Informa�on provided herein was obtained from thirdparty sources deemed reliable. HighMark and its affiliates make no representa�ons or warran�es with respect to the �meliness, accuracy, or completeness of the
informa�on and bear no liability for any loss arising from its use.

Dodge & Cox StockDODGX
Key Informa�on
Morningstar Category
Morningstar Ra�ng Overall
Incep�on Date
Expense Ra�o
Fund Size (Mil)
Por�olio Date
Manager Name
US Fund Large Value
ÙÙÙÙÙ
1/4/1965
0.52
89,193.37
6/30/2021
Mul�ple
Asset Alloca�on
%
Cash 1.7
US Equity 88.4
NonUS Equity 9.9
Total 100.0
HoldingsBased Style Map
Mic
roS
ma
llM
idLa
rge
Gia
nt
DeepVal CoreVal Core CoreGrth HighGrth
Dodge & Cox Stock 6/30/2021
Russell 1000 Value TR USD 6/30/2021
US Fund Large Value 6/30/2021
YTD
Peer
group
quar�le
1 year
Peer
group
quar�le
3 years
Peer
group
quar�le
5 years
Peer
group
quar�le
10 years
Peer
group
quar�le
Dodge & Cox Stock
Russell 1000 Value TR USD
US Fund Large Value
26.09 58.92 15.79 17.44 13.89
17.05 43.68 12.42 11.87 11.61
17.51 42.51 11.64 12.02 10.57
1 1 1 1 1
2 2 2 3 2
2 2 3 2 3
Rolling Returns
Time Period: 7/1/2016 to 6/30/2021
Peer Group (595%): Funds U.S. Large Value Rolling Window: 3 Years 3 Months shi� Calcula�on Benchmark: Russell 1000 Value TR USD
07 08 09 10 11 12
2020
01 02 03 04 05 06 07 08 09 10 11 12
2021
01 02 03 04 05 06
7.5
0.0
7.5
15.0
22.5
Dodge & Cox Stock Russell 1000 Value TR USD US Fund Large Value
Re
turn
Performance Rela�ve to Peer Group
Peer Group (595%): Funds U.S. Large Value
0.0
7.5
15.0
22.5
30.0
YTD 1 year 3 years 5 years 10 years
37.5
45.0
52.5
60.0
67.5
Dodge & Cox Stock S&P 500 TR USD US Fund Large Value
Re
turn
Returns
As of Date: 6/30/2021 Calcula�on Benchmark: Russell 1000 Value TR USD
Quarter YTD 1 Year 3 Years 5 Years 10 Years0.0
7.5
15.0
22.5
30.0
37.5
45.0
52.5
60.0
67.5
8.8
26.1
58.9
15.8 17.413.9
5.2
17.0
43.7
12.4 11.9 11.65.5
17.5
42.5
11.6 12.0 10.6
Dodge & Cox Stock Russell 1000 Value TR USD US Fund Large Value
Re
turn
RiskReward
Time Period: 7/1/2016 to 6/30/2021
Peer Group (595%): Funds U.S. Large Value Calcula�on Benchmark: Russell 1000 Value TR USD
Std Dev
0.0 4.0 8.0 12.0 16.0 20.0 24.0
0.0
3.0
6.0
9.0
12.0
15.0
18.0
21.0
Re
turn
Dodge & Cox Stock Risk
Time Period: 7/1/2016 to 6/30/2021
Calcula�on Benchmark: Russell 1000 Value TR USD
Inv Bmk1
Return
Std Dev
Downside Devia�on
Alpha
Beta
R2
Sharpe Ra�o (arith)
Tracking Error
17.44
19.14
2.31
3.65
1.15
95.36
0.85
4.83
11.87
16.20
0.00
0.00
1.00
100.00
0.66
0.00
Monthly Es�mated FundLevel Net Flow
Time Period: 7/1/2016 to 6/30/2021
2017 2019 2021
1,500M
1,000M
500M
0M
500M
Dodge & Cox Stock US Fund Large Value
Es�mat
ed Fund
Level N
et Flow
Mo
nthly R
eturn
Source: Morningstar Direct, as of June 30, 2021 Informa�on provided herein was obtained from thirdparty sources deemed reliable. HighMark and its affiliates make no representa�ons or warran�es with respect to the �meliness, accuracy, or completeness of the
informa�on and bear no liability for any loss arising from its use.

Harbor Capital Apprecia�on Re�rementHNACX
Key Informa�on
Morningstar Category
Morningstar Ra�ng Overall
Incep�on Date
Expense Ra�o
Fund Size (Mil)
Por�olio Date
Manager Name
US Fund Large Growth
ÙÙÙÙ
3/1/2016
0.59
41,342.38
3/31/2021
Mul�ple
Asset Alloca�on
%
Cash 0.7
US Equity 86.1
NonUS Equity 13.2
Total 100.0
HoldingsBased Style Map
Mic
roS
ma
llM
idLa
rge
Gia
nt
DeepVal CoreVal Core CoreGrth HighGrth
Harbor Capital Apprecia�on Re�rement 3/31/2021
Russell 1000 Growth TR USD 6/30/2021
US Fund Large Growth 6/30/2021
YTD
Peer
group
quar�le
1 year
Peer
group
quar�le
3 years
Peer
group
quar�le
5 years
Peer
group
quar�le
10 years
Peer
group
quar�le
Harbor Capital Apprecia�on Re�rement
Russell 1000 Growth TR USD
US Fund Large Growth
9.73 43.18 26.38 26.57
12.99 42.50 25.14 23.66 17.87
12.81 41.56 22.15 21.40 15.41
4 2 1 1
2 2 1 2 1
2 2 3 3 3
Rolling Returns
Time Period: 7/1/2016 to 6/30/2021
Peer Group (595%): Funds U.S. Large Growth Rolling Window: 3 Years 3 Months shi� Calcula�on Benchmark: Russell 1000 Growth TR USD
07 08 09 10 11 12
2020
01 02 03 04 05 06 07 08 09 10 11 12
2021
01 02 03 04 05 06
7.5
15.0
22.5
30.0
Harbor Capital Apprecia�on Re�rement Russell 1000 Growth TR USD US Fund Large Growth
Re
turn
Performance Rela�ve to Peer Group
Peer Group (595%): Funds U.S. Large Growth
0.0
7.5
15.0
22.5
30.0
YTD 1 year 3 years 5 years 10 years
37.5
45.0
52.5
60.0
Harbor Capital Apprecia�on Re�rement Russell 1000 Growth TR USD US Fund Large Growth
Re
turn
Returns
As of Date: 6/30/2021 Calcula�on Benchmark: Russell 1000 Growth TR USD
Quarter YTD 1 Year 3 Years 5 Years 10 Years0.0
5.0
10.0
15.0
20.0
25.0
30.0
35.0
40.0
45.0
50.0
13.69.7
43.2
26.4 26.6
11.9 13.0
42.5
25.1 23.7
17.9
10.312.8
41.6
22.2 21.4
15.4
Harbor Capital Apprecia�on Re�rement Russell 1000 Growth TR USD US Fund Large Growth
Re
turn
RiskReward
Time Period: 7/1/2016 to 6/30/2021
Peer Group (595%): Funds U.S. Large Growth Calcula�on Benchmark: Russell 1000 Growth TR USD
Std Dev
0.0 4.0 8.0 12.0 16.0 20.0 24.0
0.0
10.0
20.0
30.0
40.0
Re
turn
Harbor Capital Apprecia�on Re�rement Risk
Time Period: 7/1/2016 to 6/30/2021
Calcula�on Benchmark: Russell 1000 Growth TR USD
Inv Bmk1
Return
Std Dev
Downside Devia�on
Alpha
Beta
R2
Sharpe Ra�o (arith)
Tracking Error
26.57
18.48
3.18
0.37
1.11
93.92
1.38
4.91
23.66
16.11
0.00
0.00
1.00
100.00
1.40
0.00
Monthly Es�mated FundLevel Net Flow
Time Period: 7/1/2016 to 6/30/2021
2017 2019 2021
1,500M
1,000M
500M
0M
500M
Harbor Capital Apprecia�on Re�rement US Fund Large Growth
Es�mat
ed Fund
Level N
et Flow
Mo
nthly R
eturn
Source: Morningstar Direct, as of June 30, 2021 Informa�on provided herein was obtained from thirdparty sources deemed reliable. HighMark and its affiliates make no representa�ons or warran�es with respect to the �meliness, accuracy, or completeness of the
informa�on and bear no liability for any loss arising from its use.

T. Rowe Price Growth Stock IPRUFX
Key Informa�on
Morningstar Category
Morningstar Ra�ng Overall
Incep�on Date
Expense Ra�o
Fund Size (Mil)
Por�olio Date
Manager Name
US Fund Large Growth
ÙÙÙÙ
8/28/2015
0.52
76,293.98
3/31/2021
Joseph B. Fath
Asset Alloca�on
%
Cash 0.2
US Equity 82.5
NonUS Equity 11.1
Other 6.2
Total 100.0
HoldingsBased Style Map
Mic
roS
ma
llM
idLa
rge
Gia
nt
DeepVal CoreVal Core CoreGrth HighGrth
T. Rowe Price Growth Stock I 3/31/2021
Russell 1000 Growth TR USD 6/30/2021
US Fund Large Growth 6/30/2021
YTD
Peer
group
quar�le
1 year
Peer
group
quar�le
3 years
Peer
group
quar�le
5 years
Peer
group
quar�le
10 years
Peer
group
quar�le
T. Rowe Price Growth Stock I
Russell 1000 Growth TR USD
US Fund Large Growth
15.63 45.33 23.22 24.36
12.99 42.50 25.14 23.66 17.87
12.81 41.56 22.15 21.40 15.41
1 1 2 1
2 2 1 2 1
2 2 3 3 3
Rolling Returns
Time Period: 7/1/2016 to 6/30/2021
Peer Group (595%): Funds U.S. Large Growth Rolling Window: 3 Years 3 Months shi� Calcula�on Benchmark: Russell 1000 Growth TR USD
07 08 09 10 11 12
2020
01 02 03 04 05 06 07 08 09 10 11 12
2021
01 02 03 04 05 06
7.5
15.0
22.5
30.0
T. Rowe Price Growth Stock I Russell 1000 Growth TR USD US Fund Large Growth
Re
turn
Performance Rela�ve to Peer Group
Peer Group (595%): Funds U.S. Large Growth
0.0
7.5
15.0
22.5
30.0
YTD 1 year 3 years 5 years 10 years
37.5
45.0
52.5
60.0
T. Rowe Price Growth Stock I S&P 500 TR USD US Fund Large Growth
Re
turn
Returns
As of Date: 6/30/2021 Calcula�on Benchmark: Russell 1000 Growth TR USD
Quarter YTD 1 Year 3 Years 5 Years 10 Years0.0
5.0
10.0
15.0
20.0
25.0
30.0
35.0
40.0
45.0
50.0
12.715.6
45.3
23.2 24.4
11.9 13.0
42.5
25.1 23.7
17.9
10.312.8
41.6
22.2 21.4
15.4
T. Rowe Price Growth Stock I Russell 1000 Growth TR USD US Fund Large Growth
Re
turn
RiskReward
Time Period: 7/1/2016 to 6/30/2021
Peer Group (595%): Funds U.S. Large Growth Calcula�on Benchmark: Russell 1000 Growth TR USD
Std Dev
0.0 4.0 8.0 12.0 16.0 20.0 24.0
0.0
10.0
20.0
30.0
40.0
Re
turn
T. Rowe Price Growth Stock I Risk
Time Period: 7/1/2016 to 6/30/2021
Calcula�on Benchmark: Russell 1000 Growth TR USD
Inv Bmk1
Return
Std Dev
Downside Devia�on
Alpha
Beta
R2
Sharpe Ra�o (arith)
Tracking Error
23.66
16.11
0.00
0.00
1.00
100.00
1.40
0.00
24.36
16.43
2.33
0.71
1.00
95.36
1.41
3.55
Monthly Es�mated FundLevel Net Flow
Time Period: 7/1/2016 to 6/30/2021
2017 2019 2021
2,250M
1,500M
750M
0M
750M
T. Rowe Price Growth Stock I US Fund Large Growth
Es�mat
ed Fund
Level N
et Flow
Mo
nthly R
eturn
Source: Morningstar Direct, as of June 30, 2021 Informa�on provided herein was obtained from thirdparty sources deemed reliable. HighMark and its affiliates make no representa�ons or warran�es with respect to the �meliness, accuracy, or completeness of the
informa�on and bear no liability for any loss arising from its use.

Undiscovered Managers Behavioral Val R6UBVFX
Key Informa�on
Morningstar Category
Morningstar Ra�ng Overall
Incep�on Date
Expense Ra�o
Fund Size (Mil)
Por�olio Date
Manager Name
US Fund Small Value
ÙÙÙ
4/30/2013
0.80
6,972.39
5/31/2021
Mul�ple
Asset Alloca�on
%
Cash 0.4
US Equity 99.4
NonUS Equity 0.2
Total 100.0
HoldingsBased Style Map
Mic
roS
ma
llM
idLa
rge
Gia
nt
DeepVal CoreVal Core CoreGrth HighGrth
Undiscovered Managers Behavioral Val R6 5/31/2021
Russell 2000 Value TR USD 6/30/2021
US Fund Small Value 6/30/2021
YTD
Peer
group
quar�le
1 year
Peer
group
quar�le
3 years
Peer
group
quar�le
5 years
Peer
group
quar�le
10 years
Peer
group
quar�le
Undiscovered Managers Behavioral Val R6
Russell 2000 Value TR USD
US Fund Small Value
27.85 84.83 10.16 12.80
26.95 70.96 9.28 12.18 9.93
26.69 73.28 10.27 13.62 10.85
2 1 2 2
2 2 2 1 1
2 2 2 2 3
Rolling Returns
Time Period: 7/1/2016 to 6/30/2021
Peer Group (595%): Funds U.S. Small Value Rolling Window: 3 Years 3 Months shi� Calcula�on Benchmark: Russell 2000 Value TR USD
07 08 09 10 11 12
2020
01 02 03 04 05 06 07 08 09 10 11 12
2021
01 02 03 04 05 06
15.0
7.5
0.0
7.5
15.0
Undiscovered Managers Behavioral Val R6 Russell 2000 Value TR USD US Fund Small Value
Re
turn
Performance Rela�ve to Peer Group
Peer Group (595%): Funds U.S. Small Value
0.0
20.0
40.0
60.0
80.0
YTD 1 year 3 years 5 years 10 years
100.0
Undiscovered Managers Behavioral Val R6 Russell 2000 Value TR USD US Fund Small Value
Re
turn
Returns
As of Date: 6/30/2021 Calcula�on Benchmark: Russell 2000 Value TR USD
Quarter YTD 1 Year 3 Years 5 Years 10 Years0.0
10.0
20.0
30.0
40.0
50.0
60.0
70.0
80.0
90.0
100.0
4.2
27.8
84.8
10.2 12.84.6
26.7
73.3
10.3 13.6 10.84.5
27.0
71.0
9.3 12.2 9.9
Undiscovered Managers Behavioral Val R6 Russell 2000 Value TR USD US Fund Small Value
Re
turn
RiskReward
Time Period: 7/1/2016 to 6/30/2021
Peer Group (595%): Funds U.S. Small Value Calcula�on Benchmark: Russell 2000 Value TR USD
Std Dev
0.0 10.0 20.0 30.0 40.0
0.0
3.0
6.0
9.0
12.0
15.0
18.0
21.0
Re
turn
Undiscovered Managers Behavioral Val R6 Risk
Time Period: 7/1/2016 to 6/30/2021
Calcula�on Benchmark: Russell 2000 Value TR USD
Inv Bmk1
Return
Std Dev
Downside Devia�on
Alpha
Beta
R2
Sharpe Ra�o (arith)
Tracking Error
12.80
25.23
4.48
1.41
1.10
94.79
0.46
6.19
13.62
22.32
0.00
0.00
1.00
100.00
0.56
0.00
Monthly Es�mated FundLevel Net Flow
Time Period: 7/1/2016 to 6/30/2021
2017 2019 2021
500M
250M
0M
250M
500M
Undiscovered Managers Behavioral Val R6 US Fund Small Value
Es�mat
ed Fund
Level N
et Flow
Mo
nthly R
eturn
Source: Morningstar Direct, as of June 30, 2021 Informa�on provided herein was obtained from thirdparty sources deemed reliable. HighMark and its affiliates make no representa�ons or warran�es with respect to the �meliness, accuracy, or completeness of the
informa�on and bear no liability for any loss arising from its use.

Victory RS Small Cap Growth R6RSEJX
Key Informa�on
Morningstar Category
Morningstar Ra�ng Overall
Incep�on Date
Expense Ra�o
Fund Size (Mil)
Por�olio Date
Manager Name
US Fund Small Growth
ÙÙ
7/12/2017
1.05
2,690.62
6/30/2021
Mul�ple
Asset Alloca�on
%
US Equity 96.5
NonUS Equity 3.5
Total 100.0
HoldingsBased Style Map
Mic
roS
ma
llM
idLa
rge
Gia
nt
DeepVal CoreVal Core CoreGrth HighGrth
Victory RS Small Cap Growth R6 6/30/2021
Russell 2000 Growth TR USD 6/30/2021
US Fund Small Growth 6/30/2021
YTD
Peer
group
quar�le
1 year
Peer
group
quar�le
3 years
Peer
group
quar�le
5 years
Peer
group
quar�le
10 years
Peer
group
quar�le
Victory RS Small Cap Growth R6
Russell 2000 Growth TR USD
US Fund Small Growth
0.44 34.82 15.92
8.98 51.36 15.94 18.76 13.52
12.20 54.34 18.45 20.21 13.36
4 4 3
3 2 3 3 3
2 2 2 2 3
Rolling Returns
Time Period: 7/1/2016 to 6/30/2021
Peer Group (595%): Funds U.S. Small Growth Rolling Window: 3 Years 3 Months shi� Calcula�on Benchmark: Russell 2000 Growth TR USD
07 08 09 10 11 12
2020
01 02 03 04 05 06 07 08 09 10 11 12
2021
01 02 03 04 05 06
0.0
7.5
15.0
22.5
Victory RS Small Cap Growth R6 Russell 2000 Growth TR USD US Fund Small Growth
Re
turn
Performance Rela�ve to Peer Group
Peer Group (595%): Funds U.S. Small Growth
0.0
10.0
20.0
30.0
40.0
YTD 1 year 3 years 5 years 10 years
50.0
60.0
70.0
80.0
Victory RS Small Cap Growth R6 Russell 2000 Growth TR USD US Fund Small Growth
Re
turn
Returns
As of Date: 6/30/2021 Calcula�on Benchmark: Russell 2000 Growth TR USD
Quarter YTD 1 Year 3 Years 5 Years 10 Years0.0
7.5
15.0
22.5
30.0
37.5
45.0
52.5
60.0
3.10.4
34.8
15.9
3.99.0
51.4
15.918.8
13.5
5.0
12.2
54.3
18.4 20.2
13.4
Victory RS Small Cap Growth R6 Russell 2000 Growth TR USD US Fund Small Growth
Re
turn
RiskReward
Time Period: 7/1/2016 to 6/30/2021
Peer Group (595%): Funds U.S. Small Growth Calcula�on Benchmark: Russell 2000 Growth TR USD
Std Dev
0.0 4.0 8.0 12.0 16.0 20.0 24.0 28.0
0.0
10.0
20.0
30.0
40.0
Re
turn
Victory RS Small Cap Growth R6 Risk
Time Period: 7/1/2016 to 6/30/2021
Calcula�on Benchmark: Russell 2000 Growth TR USD
Inv Bmk1
Return
Std Dev
Downside Devia�on
Alpha
Beta
R2
Sharpe Ra�o (arith)
Tracking Error
18.76
20.81
0.00
0.00
1.00
100.00
0.85
0.00
Monthly Es�mated FundLevel Net Flow
Time Period: 7/1/2017 to 6/30/2021
2017 2019 2021
750M
500M
250M
0M
250M
Victory RS Small Cap Growth R6 US Fund Small Growth
Es�mat
ed Fund
Level N
et Flow
Mo
nthly R
eturn
Source: Morningstar Direct, as of June 30, 2021 Informa�on provided herein was obtained from thirdparty sources deemed reliable. HighMark and its affiliates make no representa�ons or warran�es with respect to the �meliness, accuracy, or completeness of the
informa�on and bear no liability for any loss arising from its use.

DFA Large Cap Interna�onal IDFALX
Key Informa�on
Morningstar Category
Morningstar Ra�ng Overall
Incep�on Date
Expense Ra�o
Fund Size (Mil)
Por�olio Date
Manager Name
US Fund Foreign Large Blend
ÙÙÙ
7/17/1991
0.18
5,912.77
5/31/2021
Mul�ple
Asset Alloca�on
%
Cash 0.8
US Equity 1.1
NonUS Equity 98.1
Total 100.0
HoldingsBased Style Map
Mic
roS
ma
llM
idLa
rge
Gia
nt
DeepVal CoreVal Core CoreGrth HighGrth
DFA Large Cap Interna�onal I 5/31/2021
MSCI ACWI Ex USA NR USD 6/30/2021
US Fund Foreign Large Blend 6/30/2021
YTD
Peer
group
quar�le
1 year
Peer
group
quar�le
3 years
Peer
group
quar�le
5 years
Peer
group
quar�le
10 years
Peer
group
quar�le
DFA Large Cap Interna�onal I
MSCI ACWI Ex USA NR USD
US Fund Foreign Large Blend
10.41 34.71 8.60 10.56 5.85
9.16 35.72 9.38 11.08 5.45
9.08 33.50 8.29 9.91 5.40
1 2 3 2 2
2 2 2 2 3
2 3 3 3 3
Rolling Returns
Time Period: 7/1/2016 to 6/30/2021
Peer Group (595%): Funds U.S. Foreign Large Blend Rolling Window: 3 Years 3 Months shi� Calcula�on Benchmark: MSCI ACWI Ex USA NR USD
07 08 09 10 11 12
2020
01 02 03 04 05 06 07 08 09 10 11 12
2021
01 02 03 04 05 06
5.0
0.0
5.0
10.0
DFA Large Cap Interna�onal I MSCI ACWI Ex USA NR USD US Fund Foreign Large Blend
Re
turn
Performance Rela�ve to Peer Group
Peer Group (595%): Funds U.S. Foreign Large Blend
0.0
7.5
15.0
22.5
30.0
YTD 1 year 3 years 5 years 10 years
37.5
45.0
52.5
DFA Large Cap Interna�onal I MSCI World ex USA NR USD US Fund Foreign Large Blend
Re
turn
Returns
As of Date: 6/30/2021 Calcula�on Benchmark: MSCI ACWI Ex USA NR USD
Quarter YTD 1 Year 3 Years 5 Years 10 Years0.0
5.0
10.0
15.0
20.0
25.0
30.0
35.0
40.0
5.6
10.4
34.7
8.610.6
5.85.59.2
35.7
9.411.1
5.45.1
9.1
33.5
8.39.9
5.4
DFA Large Cap Interna�onal I MSCI ACWI Ex USA NR USD US Fund Foreign Large Blend
Re
turn
RiskReward
Time Period: 7/1/2016 to 6/30/2021
Peer Group (595%): Funds U.S. Foreign Large Blend Calcula�on Benchmark: MSCI ACWI Ex USA NR USD
Std Dev
0.0 3.0 6.0 9.0 12.0 15.0 18.0 21.0
0.0
3.0
6.0
9.0
12.0
15.0
18.0
Re
turn
DFA Large Cap Interna�onal I Risk
Time Period: 7/1/2016 to 6/30/2021
Calcula�on Benchmark: MSCI ACWI Ex USA NR USD
Inv Bmk1
Return
Std Dev
Downside Devia�on
Alpha
Beta
R2
Sharpe Ra�o (arith)
Tracking Error
10.56
15.19
2.05
0.62
1.02
96.60
0.62
2.83
11.08
14.59
0.00
0.00
1.00
100.00
0.68
0.00
Monthly Es�mated FundLevel Net Flow
Time Period: 7/1/2016 to 6/30/2021
2017 2019 2021
200M
0M
200M
400M
600M
DFA Large Cap Interna�onal I US Fund Foreign Large Blend
Es�mat
ed Fund
Level N
et Flow
Mo
nthly R
eturn
Source: Morningstar Direct, as of June 30, 2021 Informa�on provided herein was obtained from thirdparty sources deemed reliable. HighMark and its affiliates make no representa�ons or warran�es with respect to the �meliness, accuracy, or completeness of the
informa�on and bear no liability for any loss arising from its use.

Dodge & Cox Interna�onal StockDODFX
Key Informa�on
Morningstar Category
Morningstar Ra�ng Overall
Incep�on Date
Expense Ra�o
Fund Size (Mil)
Por�olio Date
Manager Name
US Fund Foreign Large Value
ÙÙÙ
5/1/2001
0.63
44,506.88
3/31/2021
Mul�ple
Asset Alloca�on
%
Cash 1.9
US Equity 6.8
NonUS Equity 90.9
Other 0.5
Total 100.0
HoldingsBased Style Map
Mic
roS
ma
llM
idLa
rge
Gia
nt
DeepVal CoreVal Core CoreGrth HighGrth
Dodge & Cox Interna�onal Stock 3/31/2021
MSCI ACWI Ex USA Value NR USD 6/30/2021
US Fund Foreign Large Value 6/30/2021
YTD
Peer
group
quar�le
1 year
Peer
group
quar�le
3 years
Peer
group
quar�le
5 years
Peer
group
quar�le
10 years
Peer
group
quar�le
Dodge & Cox Interna�onal Stock
MSCI ACWI Ex USA Value NR USD
US Fund Foreign Large Value
12.15
11.69
40.39
37.56
7.48
5.22
10.22
8.54
5.52
3.48
11.56 35.28 5.58 7.94 4.17
2 1 1 1 1
2 2 3 2 3
2 3 3 3 2
Rolling Returns
Time Period: 7/1/2016 to 6/30/2021
Peer Group (595%): Funds U.S. Foreign Large Value Rolling Window: 3 Years 3 Months shi� Calcula�on Benchmark: MSCI ACWI Ex USA Value NR USD
07 08 09 10 11 12
2020
01 02 03 04 05 06 07 08 09 10 11 12
2021
01 02 03 04 05 06
10.0
5.0
0.0
5.0
10.0
Dodge & Cox Interna�onal Stock MSCI ACWI Ex USA Value NR USD US Fund Foreign Large Value
Re
turn
Performance Rela�ve to Peer Group
Peer Group (595%): Funds U.S. Foreign Large Value
0.0
7.5
15.0
22.5
30.0
YTD 1 year 3 years 5 years 10 years
37.5
45.0
52.5
Dodge & Cox Interna�onal Stock MSCI EAFE NR USD US Fund Foreign Large Value
Re
turn
Returns
As of Date: 6/30/2021 Calcula�on Benchmark: MSCI ACWI Ex USA Value NR USD
Quarter YTD 1 Year 3 Years 5 Years 10 Years0.0
5.0
10.0
15.0
20.0
25.0
30.0
35.0
40.0
45.0
4.7
12.2
40.4
7.510.2
5.54.3
11.7
37.6
5.28.5
3.54.1
11.6
35.3
5.67.9
4.2
Dodge & Cox Interna�onal Stock MSCI ACWI Ex USA Value NR USD US Fund Foreign Large Value
Re
turn
RiskReward
Time Period: 7/1/2016 to 6/30/2021
Peer Group (595%): Funds U.S. Foreign Large Value Calcula�on Benchmark: MSCI ACWI Ex USA Value NR USD
Std Dev
0.0 4.0 8.0 12.0 16.0 20.0 24.0
0.0
2.0
4.0
6.0
8.0
10.0
12.0
Re
turn
Dodge & Cox Interna�onal Stock Risk
Time Period: 7/1/2016 to 6/30/2021
Calcula�on Benchmark: MSCI ACWI Ex USA Value NR USD
Inv Bmk1
Return
Std Dev
Downside Devia�on
Alpha
Beta
R2
Sharpe Ra�o (arith)
Tracking Error
10.22
19.09
2.45
0.83
1.14
96.84
0.48
4.10
8.54
16.51
0.00
0.00
1.00
100.00
0.45
0.00
Monthly Es�mated FundLevel Net Flow
Time Period: 7/1/2016 to 6/30/2021
2017 2019 2021
2,250M
1,500M
750M
0M
750M
Dodge & Cox Interna�onal Stock US Fund Foreign Large Value
Es�mat
ed Fund
Level N
et Flow
Mo
nthly R
eturn
Source: Morningstar Direct, as of June 30, 2021 Informa�on provided herein was obtained from thirdparty sources deemed reliable. HighMark and its affiliates make no representa�ons or warran�es with respect to the �meliness, accuracy, or completeness of the
informa�on and bear no liability for any loss arising from its use.

MFS Interna�onal Growth R6MGRDX
Key Informa�on
Morningstar Category
Morningstar Ra�ng Overall
Incep�on Date
Expense Ra�o
Fund Size (Mil)
Por�olio Date
Manager Name
US Fund Foreign Large Growth
ÙÙÙ
5/1/2006
0.74
14,454.30
5/31/2021
Mul�ple
Asset Alloca�on
%
Cash 2.4
US Equity 3.4
NonUS Equity 94.2
Total 100.0
HoldingsBased Style Map
Mic
roS
ma
llM
idLa
rge
Gia
nt
DeepVal CoreVal Core CoreGrth HighGrth
MFS Interna�onal Growth R6 5/31/2021
MSCI ACWI Ex USA Growth NR USD 6/30/2021
US Fund Foreign Large Growth 6/30/2021
YTD
Peer
group
quar�le
1 year
Peer
group
quar�le
3 years
Peer
group
quar�le
5 years
Peer
group
quar�le
10 years
Peer
group
quar�le
MFS Interna�onal Growth R6
MSCI ACWI Ex USA Growth NR USD
US Fund Foreign Large Growth
7.77 31.10 12.74 14.08 8.16
6.52 33.68 13.23 13.37 7.28
7.17 34.83 13.47 13.78 7.75
2 3 3 2 2
3 3 2 2 3
2 2 2 2 3
Rolling Returns
Time Period: 7/1/2016 to 6/30/2021
Peer Group (595%): Funds U.S. Foreign Large Growth Rolling Window: 3 Years 3 Months shi� Calcula�on Benchmark: MSCI ACWI Ex USA Growth NR USD
07 08 09 10 11 12
2020
01 02 03 04 05 06 07 08 09 10 11 12
2021
01 02 03 04 05 06
0.0
5.0
10.0
15.0
20.0
MFS Interna�onal Growth R6 MSCI ACWI Ex USA Growth NR USD US Fund Foreign Large Growth
Re
turn
Performance Rela�ve to Peer Group
Peer Group (595%): Funds U.S. Foreign Large Growth
0.0
7.5
15.0
22.5
30.0
YTD 1 year 3 years 5 years 10 years
37.5
45.0
52.5
MFS Interna�onal Growth R6 MSCI ACWI Ex USA Growth NR USD US Fund Foreign Large Growth
Re
turn
Returns
As of Date: 6/30/2021 Calcula�on Benchmark: MSCI ACWI Ex USA Growth NR USD
Quarter YTD 1 Year 3 Years 5 Years 10 Years0.0
5.0
10.0
15.0
20.0
25.0
30.0
35.0
40.0
7.0 7.8
31.1
12.7 14.1
8.26.6 6.5
33.7
13.2 13.4
7.36.8 7.2
34.8
13.5 13.8
7.8
MFS Interna�onal Growth R6 MSCI ACWI Ex USA Growth NR USD US Fund Foreign Large Growth
Re
turn
RiskReward
Time Period: 7/1/2016 to 6/30/2021
Peer Group (595%): Funds U.S. Foreign Large Growth Calcula�on Benchmark: MSCI ACWI Ex USA Growth NR USD
Std Dev
0.0 3.0 6.0 9.0 12.0 15.0 18.0 21.0
0.0
4.0
8.0
12.0
16.0
20.0
24.0
Re
turn
MFS Interna�onal Growth R6 Risk
Time Period: 7/1/2016 to 6/30/2021
Calcula�on Benchmark: MSCI ACWI Ex USA Growth NR USD
Inv Bmk1
Return
Std Dev
Downside Devia�on
Alpha
Beta
R2
Sharpe Ra�o (arith)
Tracking Error
14.08
13.35
2.27
1.27
0.95
94.56
0.97
3.21
13.37
13.73
0.00
0.00
1.00
100.00
0.89
0.00
Monthly Es�mated FundLevel Net Flow
Time Period: 7/1/2016 to 6/30/2021
2017 2019 2021
1,000M
500M
0M
500M
MFS Interna�onal Growth R6 US Fund Foreign Large Growth
Es�mat
ed Fund
Level N
et Flow
Mo
nthly R
eturn
Source: Morningstar Direct, as of June 30, 2021 Informa�on provided herein was obtained from thirdparty sources deemed reliable. HighMark and its affiliates make no representa�ons or warran�es with respect to the �meliness, accuracy, or completeness of the
informa�on and bear no liability for any loss arising from its use.

Har�ord Schroders Emerging Mkts Eq FHHHFX
Key Informa�on
Morningstar Category
Morningstar Ra�ng Overall
Incep�on Date
Expense Ra�o
Fund Size (Mil)
Por�olio Date
Manager Name
US Fund Diversified Emerging Mkts
ÙÙÙÙ
2/28/2017
1.08
7,133.63
5/31/2021
Mul�ple
Asset Alloca�on
%
Cash 1.8
NonUS Equity 98.2
Total 100.0
HoldingsBased Style Map
Mic
roS
ma
llM
idLa
rge
Gia
nt
DeepVal CoreVal Core CoreGrth HighGrth
Har�ord Schroders Emerging Mkts Eq F 5/31/2021
MSCI EM NR USD 6/30/2021
US Fund Diversified Emerging Mkts 6/30/2021
YTD
Peer
group
quar�le
1 year
Peer
group
quar�le
3 years
Peer
group
quar�le
5 years
Peer
group
quar�le
10 years
Peer
group
quar�le
Har�ord Schroders Emerging Mkts Eq F
MSCI EM NR USD
US Fund Diversified Emerging Mkts
6.54 43.85 13.28
7.45 40.90 11.27 13.03 4.28
8.81 41.51 11.05 11.77 3.91
3 2 2
3 3 2 2 3
2 3 3 3 3
Rolling Returns
Time Period: 7/1/2016 to 6/30/2021
Peer Group (595%): Funds U.S. Diversified Emerging Mkts Rolling Window: 3 Years 3 Months shi� Calcula�on Benchmark: MSCI EM NR USD
07 08 09 10 11 12
2020
01 02 03 04 05 06 07 08 09 10 11 12
2021
01 02 03 04 05 06
5.0
0.0
5.0
10.0
15.0
Har�ord Schroders Emerging Mkts Eq F MSCI EM NR USD US Fund Diversified Emerging Mkts
Re
turn
Performance Rela�ve to Peer Group
Peer Group (595%): Funds U.S. Diversified Emerging Mkts
0.0
7.5
15.0
22.5
30.0
YTD 1 year 3 years 5 years 10 years
37.5
45.0
52.5
60.0
Har�ord Schroders Emerging Mkts Eq F MSCI EM NR USD US Fund Diversified Emerging Mkts
Re
turn
Returns
As of Date: 6/30/2021 Calcula�on Benchmark: MSCI EM NR USD
Quarter YTD 1 Year 3 Years 5 Years 10 Years0.0
5.0
10.0
15.0
20.0
25.0
30.0
35.0
40.0
45.0
50.0
2.96.5
43.9
13.3
5.07.4
40.9
11.3 13.0
4.35.58.8
41.5
11.1 11.8
3.9
Har�ord Schroders Emerging Mkts Eq F MSCI EM NR USD US Fund Diversified Emerging Mkts
Re
turn
RiskReward
Time Period: 7/1/2016 to 6/30/2021
Peer Group (595%): Funds U.S. Diversified Emerging Mkts Calcula�on Benchmark: MSCI EM NR USD
Std Dev
0.0 4.0 8.0 12.0 16.0 20.0 24.0
0.0
3.0
6.0
9.0
12.0
15.0
18.0
21.0
Re
turn
Har�ord Schroders Emerging Mkts Eq F Risk
Time Period: 7/1/2016 to 6/30/2021
Calcula�on Benchmark: MSCI EM NR USD
Inv Bmk1
Return
Std Dev
Downside Devia�on
Alpha
Beta
R2
Sharpe Ra�o (arith)
Tracking Error
13.03
16.24
0.00
0.00
1.00
100.00
0.73
0.00
Monthly Es�mated FundLevel Net Flow
Time Period: 2/1/2017 to 6/30/2021
2017 2019 2021
500M
0M
500M
1,000M
Har�ord Schroders Emerging Mkts Eq F US Fund Diversified Emerging Mkts
Es�mat
ed Fund
Level N
et Flow
Mo
nthly R
eturn
Source: Morningstar Direct, as of June 30, 2021 Informa�on provided herein was obtained from thirdparty sources deemed reliable. HighMark and its affiliates make no representa�ons or warran�es with respect to the �meliness, accuracy, or completeness of the
informa�on and bear no liability for any loss arising from its use.

American Funds New Perspec�ve R6RNPGX
Key Informa�on
Morningstar Category
Morningstar Ra�ng Overall
Incep�on Date
Expense Ra�o
Fund Size (Mil)
Por�olio Date
Manager Name
US Fund World LargeStock Growth
ÙÙÙÙ
5/1/2009
0.42
141,423.82
3/31/2021
Mul�ple
Asset Alloca�on
%
Cash 5.2
US Equity 52.2
NonUS Equity 42.6
US Bond 0.0
Total 100.0
HoldingsBased Style Map
Mic
roS
ma
llM
idLa
rge
Gia
nt
DeepVal CoreVal Core CoreGrth HighGrth
American Funds New Perspec�ve R6 3/31/2021
MSCI ACWI Growth NR USD 6/30/2021
US Fund World LargeStock Growth 6/30/2021
YTD
Peer
group
quar�le
1 year
Peer
group
quar�le
3 years
Peer
group
quar�le
5 years
Peer
group
quar�le
10 years
Peer
group
quar�le
American Funds New Perspec�ve R6
MSCI ACWI Growth NR USD
US Fund World LargeStock Growth
10.76 46.25 20.40 19.64 13.70
10.00 40.36 19.18 18.67 12.34
10.29 39.69 20.40 19.15 12.67
2 1 2 1 1
3 3 2 2 2
3 3 2 2 2
Rolling Returns
Time Period: 7/1/2016 to 6/30/2021
Peer Group (595%): Funds U.S. World LargeStock Growth Rolling Window: 3 Years 3 Months shi� Calcula�on Benchmark: MSCI ACWI Growth NR USD
07 08 09 10 11 12
2020
01 02 03 04 05 06 07 08 09 10 11 12
2021
01 02 03 04 05 06
5.0
10.0
15.0
20.0
25.0
American Funds New Perspec�ve R6 MSCI ACWI Growth NR USD US Fund World LargeStock Growth
Re
turn
Performance Rela�ve to Peer Group
Peer Group (595%): Funds U.S. World LargeStock Growth
0.0
7.5
15.0
22.5
30.0
YTD 1 year 3 years 5 years 10 years
37.5
45.0
52.5
American Funds New Perspec�ve R6 MSCI ACWI Growth NR USD MSCI ACWI NR USD
US Fund World LargeStock Growth
Re
turn
Returns
As of Date: 6/30/2021 Calcula�on Benchmark: MSCI ACWI Growth NR USD
Quarter YTD 1 Year 3 Years 5 Years 10 Years0.0
5.0
10.0
15.0
20.0
25.0
30.0
35.0
40.0
45.0
50.0
8.310.8
46.3
20.4 19.6
13.710.0 10.3
39.7
20.4 19.2
12.7
8.2 10.0
40.4
19.2 18.7
12.3
American Funds New Perspec�ve R6 MSCI ACWI Growth NR USD US Fund World LargeStock Growth
Re
turn
RiskReward
Time Period: 7/1/2016 to 6/30/2021
Peer Group (595%): Funds U.S. World LargeStock Growth Calcula�on Benchmark: MSCI ACWI Growth NR USD
Std Dev
0.0 3.0 6.0 9.0 12.0 15.0 18.0 21.0
0.0
10.0
20.0
30.0
40.0
Re
turn
American Funds New Perspec�ve R6 Risk
Time Period: 7/1/2016 to 6/30/2021
Calcula�on Benchmark: MSCI ACWI Growth NR USD
Inv Bmk1
Return
Std Dev
Downside Devia�on
Alpha
Beta
R2
Sharpe Ra�o (arith)
Tracking Error
19.64
15.41
1.88
0.10
1.02
96.78
1.20
2.80
19.15
14.82
0.00
0.00
1.00
100.00
1.22
0.00
Monthly Es�mated FundLevel Net Flow
Time Period: 7/1/2016 to 6/30/2021
2017 2019 2021
2,250M
1,500M
750M
0M
750M
American Funds New Perspec�ve R6 US Fund World LargeStock Growth
Es�mat
ed Fund
Level N
et Flow
Mo
nthly R
eturn
Source: Morningstar Direct, as of June 30, 2021 Informa�on provided herein was obtained from thirdparty sources deemed reliable. HighMark and its affiliates make no representa�ons or warran�es with respect to the �meliness, accuracy, or completeness of the
informa�on and bear no liability for any loss arising from its use.

MFS Global Equity R6MWEMX
Key Informa�on
Morningstar Category
Morningstar Ra�ng Overall
Incep�on Date
Expense Ra�o
Fund Size (Mil)
Por�olio Date
Manager Name
US Fund World LargeStock Blend
ÙÙÙÙ
6/1/2012
0.82
3,767.85
5/31/2021
Mul�ple
Asset Alloca�on
%
Cash 1.4
US Equity 52.5
NonUS Equity 46.1
Total 100.0
HoldingsBased Style Map
Mic
roS
ma
llM
idLa
rge
Gia
nt
DeepVal CoreVal Core CoreGrth HighGrth
MFS Global Equity R6 5/31/2021
MSCI ACWI NR USD 6/30/2021
US Fund World LargeStock Blend 6/30/2021
YTD
Peer
group
quar�le
1 year
Peer
group
quar�le
3 years
Peer
group
quar�le
5 years
Peer
group
quar�le
10 years
Peer
group
quar�le
MFS Global Equity R6
MSCI ACWI NR USD
US Fund World LargeStock Blend
11.91 39.28 15.52 14.40
12.30 39.26 14.57 14.61 9.90
12.11 37.78 13.00 12.94 9.20
3 2 1 2
2 2 2 1 2
3 2 3 3 3
Rolling Returns
Time Period: 7/1/2016 to 6/30/2021
Peer Group (595%): Funds U.S. World LargeStock Blend Rolling Window: 3 Years 3 Months shi� Calcula�on Benchmark: MSCI ACWI NR USD
07 08 09 10 11 12
2020
01 02 03 04 05 06 07 08 09 10 11 12
2021
01 02 03 04 05 06
0.0
5.0
10.0
15.0
20.0
MFS Global Equity R6 MSCI ACWI NR USD US Fund World LargeStock Blend
Re
turn
Performance Rela�ve to Peer Group
Peer Group (595%): Funds U.S. World LargeStock Blend
5.0
10.0
15.0
20.0
25.0
YTD 1 year 3 years 5 years 10 years
30.0
35.0
40.0
45.0
50.0
MFS Global Equity R6 MSCI World NR USD US Fund World LargeStock Blend
Re
turn
Returns
As of Date: 6/30/2021 Calcula�on Benchmark: MSCI ACWI NR USD
Quarter YTD 1 Year 3 Years 5 Years 10 Years0.0
5.0
10.0
15.0
20.0
25.0
30.0
35.0
40.0
45.0
7.811.9
39.3
15.5 14.4
7.4
12.3
39.3
14.6 14.6
9.96.5
12.1
37.8
13.0 12.99.2
MFS Global Equity R6 MSCI ACWI NR USD US Fund World LargeStock Blend
Re
turn
RiskReward
Time Period: 7/1/2016 to 6/30/2021
Peer Group (595%): Funds U.S. World LargeStock Blend Calcula�on Benchmark: MSCI ACWI NR USD
Std Dev
0.0 3.0 6.0 9.0 12.0 15.0 18.0 21.0
0.0
3.0
6.0
9.0
12.0
15.0
18.0
21.0
Re
turn
MFS Global Equity R6 Risk
Time Period: 7/1/2016 to 6/30/2021
Calcula�on Benchmark: MSCI ACWI NR USD
Inv Bmk1
Return
Std Dev
Downside Devia�on
Alpha
Beta
R2
Sharpe Ra�o (arith)
Tracking Error
14.40
14.95
2.44
0.16
1.00
94.86
0.89
3.40
14.61
14.52
0.00
0.00
1.00
100.00
0.93
0.00
Monthly Es�mated FundLevel Net Flow
Time Period: 7/1/2016 to 6/30/2021
2017 2019 2021
200M
100M
0M
100M
200M
MFS Global Equity R6 US Fund World LargeStock Blend
Es�mat
ed Fund
Level N
et Flow
Mo
nthly R
eturn
Source: Morningstar Direct, as of June 30, 2021 Informa�on provided herein was obtained from thirdparty sources deemed reliable. HighMark and its affiliates make no representa�ons or warran�es with respect to the �meliness, accuracy, or completeness of the
informa�on and bear no liability for any loss arising from its use.

PIMCO Total Return InstlPTTRX
Key Informa�on
Morningstar Category
Morningstar Ra�ng Overall
Incep�on Date
Expense Ra�o
Fund Size (Mil)
Por�olio Date
Manager Name
US Fund Intermediate CorePlus Bond
ÙÙÙ
5/11/1987
0.70
69,180.66
3/31/2021
Mul�ple
PIMCO Total Return Instl FixedInc Sectors (Morningstar)
Por�olio Date: 3/31/2021
%
Government 10.4
Government Related 22.2
Corporate Bond 14.7
Agency MortgageBacked 12.2
NonAgency Residen�al MortgageBacked 1.9
AssetBacked 6.0
Cash & Equivalents 13.3
Swap 3.0
Forward/Future 11.1
Op�on/Warrant 1.8
Other 3.4
Total 100.0
Morningstar Style Box PIMCO Total Return Instl
Por�olio Date: 3/31/2021
Morningstar Fixed Income Style Box™
Not Available
FixedIncome Stats
Average Eff Dura�on 5.5
Average Eff Maturity 7.4
Average Coupon 2.8
Average Price 105.2
YTD
Peer
group
quar�le
1 year
Peer
group
quar�le
3 years
Peer
group
quar�le
5 years
Peer
group
quar�le
10 years
Peer
group
quar�le
PIMCO Total Return Instl
BBgBarc US Agg Bond TR USD
US Fund Intermediate CorePlus Bond
1.06 1.47 5.77 3.84 3.77
1.60 0.33 5.34 3.03 3.39
0.64 2.94 5.68 3.69 3.81
3 4 3 2 3
4 4 3 4 4
2 2 3 3 2
Rolling Returns
Time Period: 7/1/2016 to 6/30/2021
Rolling Window: 3 Years 3 Months shi� Calcula�on Benchmark: BBgBarc US Agg Bond TR USD
07 08 09 10 11 12
2020
01 02 03 04 05 06 07 08 09 10 11 12
2021
01 02 03 04 05 06
2.0
3.0
4.0
5.0
6.0
PIMCO Total Return Instl BBgBarc US Agg Bond TR USD US Fund Intermediate CorePlus Bond
Re
turn
Performance Rela�ve to Peer Group
Peer Group (595%): Funds U.S. Intermediate CorePlus Bond Calcula�on Benchmark: BBgBarc US Agg Bond TR USD
4.0
2.0
0.0
2.0
4.0
YTD 1 year 3 years 5 years 10 years
6.0
8.0
PIMCO Total Return Instl BBgBarc US Agg Bond TR USD US Fund Intermediate CorePlus Bond
Re
turn
Returns
As of Date: 6/30/2021 Calcula�on Benchmark: BBgBarc US Agg Bond TR USD
Quarter YTD 1 Year 3 Years 5 Years 10 Years3.0
2.0
1.0
0.0
1.0
2.0
3.0
4.0
5.0
6.0
7.0
2.1
1.1
1.5
5.8
3.8 3.8
1.8
1.6
0.3
5.3
3.0 3.4
2.0
0.6
2.9
5.7
3.7 3.8
PIMCO Total Return Instl BBgBarc US Agg Bond TR USD US Fund Intermediate CorePlus Bond
Re
turn
RiskReward
Time Period: 7/1/2016 to 6/30/2021
Std Dev
0.0 1.0 2.0 3.0 4.0 5.0 6.0
0.0
1.0
2.0
3.0
4.0
5.0
6.0
Re
turn
PIMCO Total Return Instl Risk
Time Period: 7/1/2016 to 6/30/2021
Calcula�on Benchmark: BBgBarc US Agg Bond TR USD
Inv Bmk1
Return
Std Dev
Downside Devia�on
Alpha
Beta
R2
Informa�on Ra�o (geo)
Tracking Error
3.84
3.34
0.73
0.83
0.98
89.55
0.74
1.07
3.03
3.25
0.00
0.00
1.00
100.00
0.00
Monthly Es�mated FundLevel Net Flow
Time Period: 7/1/2016 to 6/30/2021
2017 2019 2021
4,000M
2,000M
0M
2,000M
PIMCO Total Return Instl
Source: Morningstar Direct, as of June 30, 2021. Informa�on provided herein was obtained from thirdparty sources deemed reliable. HighMark and its affiliates make no representa�ons or warran�es with respect to the �meliness,
accuracy, or completeness of the informa�on and bear no liability for any loss arising from its use.

PGIM Total Return Bond R6PTRQX
Key Informa�on
Morningstar Category
Morningstar Ra�ng Overall
Incep�on Date
Expense Ra�o
Fund Size (Mil)
Por�olio Date
Manager Name
US Fund Intermediate CorePlus Bond
ÙÙÙÙ
12/27/2010
0.39
61,028.21
6/30/2021
Mul�ple
PGIM Total Return Bond R6 FixedInc Sectors (Morningsta
Por�olio Date: 6/30/2021
%
Government 11.7
Government Related 3.6
Bank Loan 0.8
Conver�ble 1.0
Corporate Bond 31.2
Agency MortgageBacked 1.7
Commercial MortgageBacked 9.6
AssetBacked 17.9
Cash & Equivalents 1.6
Forward/Future 19.3
Other 1.6
Total 100.0
Morningstar Style Box PGIM Total Return Bond R6
Por�olio Date: 6/30/2021
Morningstar Fixed Income Style Box™
Low
Me
dH
igh
Ltd Mod Ext
FixedIncome Stats
Average Eff Dura�on 7.6
Average Eff Maturity
Average Coupon 3.5
Average Price 109.3
YTD
Peer
group
quar�le
1 year
Peer
group
quar�le
3 years
Peer
group
quar�le
5 years
Peer
group
quar�le
10 years
Peer
group
quar�le
PGIM Total Return Bond R6
BBgBarc US Agg Bond TR USD
US Fund Intermediate CorePlus Bond
1.44 2.70 6.24 4.31 4.76
1.60 0.33 5.34 3.03 3.39
0.64 2.94 5.68 3.69 3.81
4 2 2 1 1
4 4 3 4 4
2 2 3 3 2
Rolling Returns
Time Period: 7/1/2016 to 6/30/2021
Rolling Window: 3 Years 3 Months shi� Calcula�on Benchmark: BBgBarc US Agg Bond TR USD
07 08 09 10 11 12
2020
01 02 03 04 05 06 07 08 09 10 11 12
2021
01 02 03 04 05 06
2.0
4.0
6.0
8.0
PGIM Total Return Bond R6 BBgBarc US Agg Bond TR USD US Fund Intermediate CorePlus Bond
Re
turn
Performance Rela�ve to Peer Group
Peer Group (595%): Funds U.S. Intermediate CorePlus Bond Calcula�on Benchmark: BBgBarc US Agg Bond TR USD
4.0
2.0
0.0
2.0
4.0
YTD 1 year 3 years 5 years 10 years
6.0
8.0
PGIM Total Return Bond R6 BBgBarc US Agg Bond TR USD US Fund Intermediate CorePlus Bond
Re
turn
Returns
As of Date: 6/30/2021 Calcula�on Benchmark: BBgBarc US Agg Bond TR USD
Quarter YTD 1 Year 3 Years 5 Years 10 Years3.0
2.0
1.0
0.0
1.0
2.0
3.0
4.0
5.0
6.0
7.0
3.1
1.4
2.7
6.2
4.34.8
1.8
1.6
0.3
5.3
3.0 3.4
2.0
0.6
2.9
5.7
3.7 3.8
PGIM Total Return Bond R6 BBgBarc US Agg Bond TR USD US Fund Intermediate CorePlus Bond
Re
turn
RiskReward
Time Period: 7/1/2016 to 6/30/2021
Std Dev
0.0 1.0 2.0 3.0 4.0 5.0 6.0
0.0
1.0
2.0
3.0
4.0
5.0
6.0
Re
turn
PGIM Total Return Bond R6 Risk
Time Period: 7/1/2016 to 6/30/2021
Calcula�on Benchmark: BBgBarc US Agg Bond TR USD
Inv Bmk1
Return
Std Dev
Downside Devia�on
Alpha
Beta
R2
Informa�on Ra�o (geo)
Tracking Error
4.31
5.10
2.70
0.78
1.28
65.67
0.40
3.11
3.03
3.25
0.00
0.00
1.00
100.00
0.00
Monthly Es�mated FundLevel Net Flow
Time Period: 7/1/2016 to 6/30/2021
2017 2019 2021
2,000M
1,000M
0M
1,000M
2,000M
PGIM Total Return Bond R6
Source: Morningstar Direct, as of June 30, 2021. Informa�on provided herein was obtained from thirdparty sources deemed reliable. HighMark and its affiliates make no representa�ons or warran�es with respect to the �meliness,
accuracy, or completeness of the informa�on and bear no liability for any loss arising from its use.
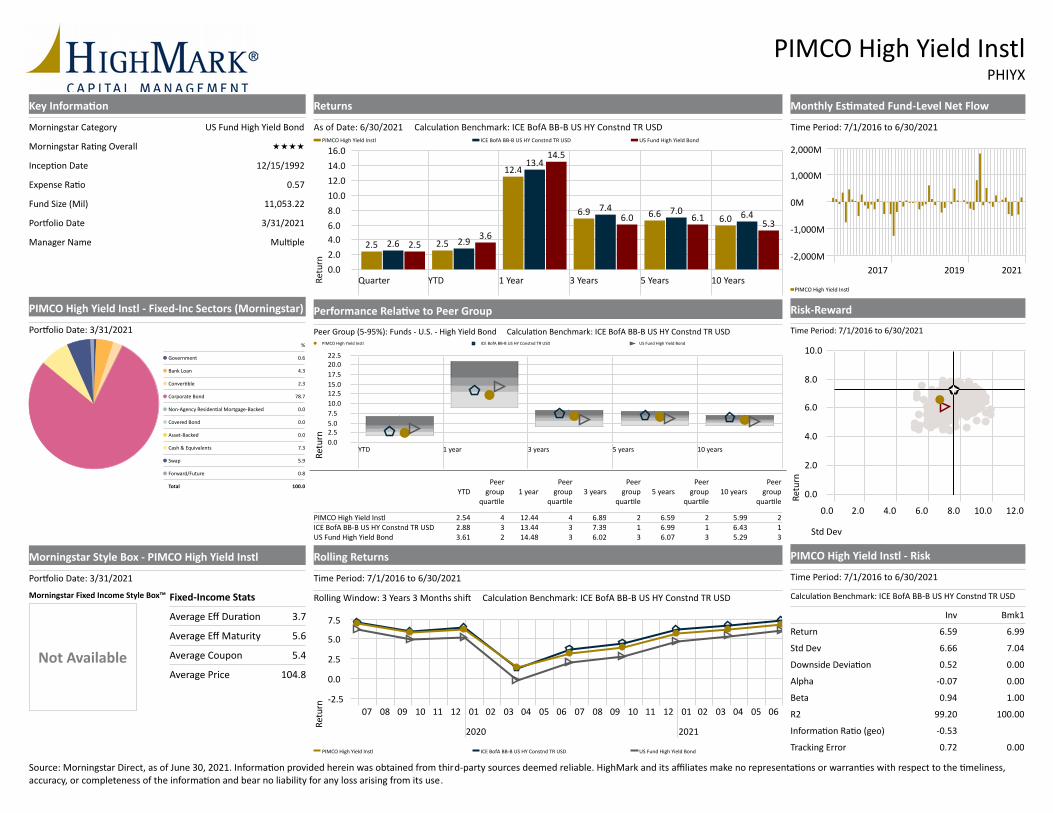
PIMCO High Yield InstlPHIYX
Key Informa�on
Morningstar Category
Morningstar Ra�ng Overall
Incep�on Date
Expense Ra�o
Fund Size (Mil)
Por�olio Date
Manager Name
US Fund High Yield Bond
ÙÙÙÙ
12/15/1992
0.57
11,053.22
3/31/2021
Mul�ple
PIMCO High Yield Instl FixedInc Sectors (Morningstar)
Por�olio Date: 3/31/2021
%
Government 0.6
Bank Loan 4.3
Conver�ble 2.3
Corporate Bond 78.7
NonAgency Residen�al MortgageBacked 0.0
Covered Bond 0.0
AssetBacked 0.0
Cash & Equivalents 7.3
Swap 5.9
Forward/Future 0.8
Total 100.0
Morningstar Style Box PIMCO High Yield Instl
Por�olio Date: 3/31/2021
Morningstar Fixed Income Style Box™
Not Available
FixedIncome Stats
Average Eff Dura�on 3.7
Average Eff Maturity 5.6
Average Coupon 5.4
Average Price 104.8
YTD
Peer
group
quar�le
1 year
Peer
group
quar�le
3 years
Peer
group
quar�le
5 years
Peer
group
quar�le
10 years
Peer
group
quar�le
PIMCO High Yield Instl
ICE BofA BBB US HY Constnd TR USD
US Fund High Yield Bond
2.54 12.44 6.89 6.59 5.99
2.88 13.44 7.39 6.99 6.43
3.61 14.48 6.02 6.07 5.29
4 4 2 2 2
3 3 1 1 1
2 3 3 3 3
Rolling Returns
Time Period: 7/1/2016 to 6/30/2021
Rolling Window: 3 Years 3 Months shi� Calcula�on Benchmark: ICE BofA BBB US HY Constnd TR USD
07 08 09 10 11 12
2020
01 02 03 04 05 06 07 08 09 10 11 12
2021
01 02 03 04 05 06
2.5
0.0
2.5
5.0
7.5
PIMCO High Yield Instl ICE BofA BBB US HY Constnd TR USD US Fund High Yield Bond
Re
turn
Performance Rela�ve to Peer Group
Peer Group (595%): Funds U.S. High Yield Bond Calcula�on Benchmark: ICE BofA BBB US HY Constnd TR USD
0.0
2.5
5.0
7.5
10.0
YTD 1 year 3 years 5 years 10 years
12.5
15.0
17.5
20.0
22.5
PIMCO High Yield Instl ICE BofA BBB US HY Constnd TR USD US Fund High Yield Bond
Re
turn
Returns
As of Date: 6/30/2021 Calcula�on Benchmark: ICE BofA BBB US HY Constnd TR USD
Quarter YTD 1 Year 3 Years 5 Years 10 Years0.0
2.0
4.0
6.0
8.0
10.0
12.0
14.0
16.0
2.5 2.5
12.4
6.9 6.66.0
2.6 2.9
13.4
7.4 7.0 6.4
2.53.6
14.5
6.0 6.15.3
PIMCO High Yield Instl ICE BofA BBB US HY Constnd TR USD US Fund High Yield Bond
Re
turn
RiskReward
Time Period: 7/1/2016 to 6/30/2021
Std Dev
0.0 2.0 4.0 6.0 8.0 10.0 12.0
0.0
2.0
4.0
6.0
8.0
10.0
Re
turn
PIMCO High Yield Instl Risk
Time Period: 7/1/2016 to 6/30/2021
Calcula�on Benchmark: ICE BofA BBB US HY Constnd TR USD
Inv Bmk1
Return
Std Dev
Downside Devia�on
Alpha
Beta
R2
Informa�on Ra�o (geo)
Tracking Error
6.59
6.66
0.52
0.07
0.94
99.20
0.53
0.72
6.99
7.04
0.00
0.00
1.00
100.00
0.00
Monthly Es�mated FundLevel Net Flow
Time Period: 7/1/2016 to 6/30/2021
2017 2019 2021
2,000M
1,000M
0M
1,000M
2,000M
PIMCO High Yield Instl
Source: Morningstar Direct, as of June 30, 2021. Informa�on provided herein was obtained from thirdparty sources deemed reliable. HighMark and its affiliates make no representa�ons or warran�es with respect to the �meliness,
accuracy, or completeness of the informa�on and bear no liability for any loss arising from its use.

BlackRock Event Driven Equity InstlBILPX
Key Informa�on
Morningstar Category
Morningstar Ra�ng Overall
Incep�on Date
Expense Ra�o
Fund Size (Mil)
Por�olio Date
Manager Name
US Fund Event Driven
ÙÙÙÙ
12/19/2007
1.36
8,023.76
5/31/2021
Mark McKenna
Correla�on Matrix
Time Period: 1/1/2008 to 6/30/2021
1 2 3
1.00
0.03 1.00
0.79 0.03 1.00
1 BlackRock Event Driven Equity Instl
2 BBgBarc US Agg Bond TR USD
3 S&P 500 TR (1989)
1.00 to 0.80 0.80 to 0.60 0.60 to 0.40 0.40 to 0.20 0.20 to 0.00
0.00 to 0.20 0.20 to 0.40 0.40 to 0.60 0.60 to 0.80 0.80 to 1.00
Return Distribu�on - BlackRock Event Driven Equity Instl
Time Period: Since Incep�on to 6/30/2021
15.0 11.0 7.0 3.0 1.0 5.0 9.0 13.0 15.00.0
10.0
20.0
30.0
40.0
50.0
60.0
BlackRock Event Driven Equity Instl US Fund Event Driven
Nu
mb
er
of
Pe
rio
ds
YTD
Peer
group
quar�le
1 year
Peer
group
quar�le
3 years
Peer
group
quar�le
5 years
Peer
group
quar�le
10 years
Peer
group
quar�le
BlackRock Event Driven Equity Instl
US Fund Event Driven
2.60 8.62 6.38 6.23 7.52
4.62 13.82 6.18 5.46 4.03
3 2 2 1 1
2 2 2 2 2
Drawdown
Time Period: 7/1/2016 to 6/30/2021
2016 2017 2018 2019 2020 202110.0
8.0
6.0
4.0
2.0
0.0
BlackRock Event Driven Equity Instl US Fund Event Driven
Performance Rela�ve to Peer Group
Peer Group (595%): Funds U.S. Event Driven
0.0
5.0
10.0
15.0
20.0
YTD 1 year 3 years 5 years 10 years
25.0
30.0
35.0
BlackRock Event Driven Equity Instl US Fund Event Driven
Re
turn
Returns
As of Date: 6/30/2021 Calcula�on Benchmark: US Fund Event Driven
Quarter YTD 1 Year 3 Years 5 Years 10 Years0.0
2.0
4.0
6.0
8.0
10.0
12.0
14.0
16.0
1.92.6
8.6
6.4 6.27.5
1.9
4.6
13.8
6.25.5
4.0
BlackRock Event Driven Equity Instl US Fund Event Driven
Re
turn
Risk-Reward
Time Period: 7/1/2018 to 6/30/2021
Std Dev
0.0 3.0 6.0 9.0 12.0 15.0 18.0
0.0
2.0
4.0
6.0
8.0
10.0
12.0
14.0
BlackRock Event Driven Equity Instl US Fund Event Driven
Re
turn
BlackRock Event Driven Equity Instl - Risk
Time Period: Since Incep�on to 6/30/2021
Calcula�on Benchmark: US Fund Event Driven
Inv Bmk1 +/ Bmk1
Return
Std Dev
Downside Devia�on
Alpha
Beta
R2
Sharpe Ra�o (arith)
Tracking Error
5.71 3.42
13.05
6.04
5.87
0.00
0.38
1.85
69.60
0.39
8.78
0.00
1.00
100.00
0.48
0.00
2.29
7.18
6.04
0.38
0.85
30.40
0.09
8.78
Monthly Es�mated Fund-Level Net Flow
Time Period: 7/1/2016 to 6/30/2021
2017 2019 2021
200M
0M
200M
400M
600M
BlackRock Event Driven Equity Instl
Es�mat
ed Fund
Level
Month
ly Retu
rn
Source: Morningstar Direct, as of June 30, 2021, Informa�on provided herein was obtained from thirdparty sources deemed reliable. HighMark and its affiliates make no representa�ons or warran�es with respect to the �meliness, accuracy, or completeness of the informa�on and
bear no liability for any loss arising from its use.

Western Asset Macro Opportuni�es ISLAOSX
Key Informa�on
Morningstar Category
Morningstar Ra�ng Overall
Incep�on Date
Expense Ra�o
Fund Size (Mil)
Por�olio Date
Manager Name
US Fund Nontradi�onal Bond
ÙÙÙÙÙ
8/30/2013
1.22
1,724.25
5/31/2021
Mul�ple
Correla�on Matrix
Time Period: 9/1/2013 to 6/30/2021
1 2 3
1.00
0.33 1.00
0.60 0.02 1.00
1 Western Asset Macro Opportuni�es IS
2 BBgBarc US Agg Bond TR USD
3 S&P 500 TR (1989)
1.00 to 0.80 0.80 to 0.60 0.60 to 0.40 0.40 to 0.20 0.20 to 0.00
0.00 to 0.20 0.20 to 0.40 0.40 to 0.60 0.60 to 0.80 0.80 to 1.00
Return Distribu�on - Western Asset Macro Opportuni�es IS
Time Period: Since Incep�on to 6/30/2021
12.0 10.0 8.0 6.0 4.0 2.0 0.0 2.0 4.0 6.0 8.0 10.0 12.00.0
10.0
20.0
30.0
40.0
50.0
60.0
Western Asset Macro Opportuni�es IS US Fund Nontradi�onal Bond
Nu
mb
er
of
Pe
rio
ds
YTD
Peer
group
quar�le
1 year
Peer
group
quar�le
3 years
Peer
group
quar�le
5 years
Peer
group
quar�le
10 years
Peer
group
quar�le
Western Asset Macro Opportuni�es IS
US Fund Nontradi�onal Bond
1.51 8.70 7.46 6.29
1.81 7.94 3.63 3.53 2.43
4 2 1 1
2 2 3 3 3
Drawdown
Time Period: 7/1/2016 to 6/30/2021
2016 2017 2018 2019 2020 202115.0
12.5
10.0
7.5
5.0
2.5
0.0
Western Asset Macro Opportuni�es IS US Fund Nontradi�onal Bond
Performance Rela�ve to Peer Group
Peer Group (595%): Funds U.S. Nontradi�onal Bond
2.5
0.0
2.5
5.0
7.5
YTD 1 year 3 years 5 years 10 years
10.0
12.5
15.0
17.5
Western Asset Macro Opportuni�es IS US Fund Nontradi�onal Bond
Re
turn
Returns
As of Date: 6/30/2021 Calcula�on Benchmark: US Fund Nontradi�onal Bond
Quarter YTD 1 Year 3 Years 5 Years 10 Years4.0
2.0
0.0
2.0
4.0
6.0
8.0
10.0
7.7
1.5
8.77.5
6.3
1.4 1.8
7.9
3.6 3.52.4
Western Asset Macro Opportuni�es IS US Fund Nontradi�onal Bond
Re
turn
Risk-Reward
Time Period: 7/1/2018 to 6/30/2021
Std Dev
0.0 3.0 6.0 9.0 12.0 15.0
3.0
1.0
1.0
3.0
5.0
7.0
9.0
11.0
Western Asset Macro Opportuni�es IS US Fund Nontradi�onal Bond
Re
turn
Western Asset Macro Opportuni�es IS - Risk
Time Period: Since Incep�on to 6/30/2021
Calcula�on Benchmark: US Fund Nontradi�onal Bond
Inv Bmk1 +/ Bmk1
Return
Std Dev
Downside Devia�on
Alpha
Beta
R2
Sharpe Ra�o (arith)
Tracking Error
2.57
3.55
0.00
0.00
1.00
100.00
0.51
0.00
6.66
8.40
3.56
2.50
1.93
66.96
0.70
5.87
4.10
4.85
3.56
2.50
0.93
33.04
0.19
5.87
Monthly Es�mated Fund-Level Net Flow
Time Period: 7/1/2016 to 6/30/2021
2017 2019 2021
200M
100M
0M
100M
Western Asset Macro Opportuni�es IS
Es�mat
ed Fund
Level
Month
ly Retu
rn
Source: Morningstar Direct, as of June 30, 2021, Informa�on provided herein was obtained from thirdparty sources deemed reliable. HighMark and its affiliates make no representa�ons or warran�es with respect to the �meliness, accuracy, or completeness of the informa�on and
bear no liability for any loss arising from its use.

BlackRock Strategic Income Opps KBSIKX
Key Informa�on
Morningstar Category
Morningstar Ra�ng Overall
Incep�on Date
Expense Ra�o
Fund Size (Mil)
Por�olio Date
Manager Name
US Fund Nontradi�onal Bond
ÙÙÙÙ
3/28/2016
0.67
41,450.50
3/31/2021
Mul�ple
Correla�on Matrix
Time Period: 4/1/2016 to 6/30/2021
1 2 3
1.00
0.30 1.00
0.70 0.01 1.00
1 BlackRock Strategic Income Opps K
2 BBgBarc US Agg Bond TR USD
3 S&P 500 TR (1989)
1.00 to 0.80 0.80 to 0.60 0.60 to 0.40 0.40 to 0.20 0.20 to 0.00
0.00 to 0.20 0.20 to 0.40 0.40 to 0.60 0.60 to 0.80 0.80 to 1.00
Return Distribu�on - BlackRock Strategic Income Opps K
Time Period: Since Incep�on to 6/30/2021
8.0 6.0 4.0 2.0 0.0 2.0 4.0 6.0 8.00.0
4.0
8.0
12.0
16.0
20.0
24.0
28.0
32.0
36.0
40.0
BlackRock Strategic Income Opps K US Fund Nontradi�onal Bond
Nu
mb
er
of
Pe
rio
ds
YTD
Peer
group
quar�le
1 year
Peer
group
quar�le
3 years
Peer
group
quar�le
5 years
Peer
group
quar�le
10 years
Peer
group
quar�le
BlackRock Strategic Income Opps K
US Fund Nontradi�onal Bond
1.30 8.45 5.42 4.73
1.81 7.94 3.63 3.53 2.43
3 2 1 2
2 2 3 3 3
Drawdown
Time Period: 7/1/2016 to 6/30/2021
2016 2017 2018 2019 2020 20218.0
6.0
4.0
2.0
0.0
BlackRock Strategic Income Opps K US Fund Nontradi�onal Bond
Performance Rela�ve to Peer Group
Peer Group (595%): Funds U.S. Nontradi�onal Bond
2.5
0.0
2.5
5.0
7.5
YTD 1 year 3 years 5 years 10 years
10.0
12.5
15.0
17.5
BlackRock Strategic Income Opps K US Fund Nontradi�onal Bond
Re
turn
Returns
As of Date: 6/30/2021 Calcula�on Benchmark: US Fund Nontradi�onal Bond
Quarter YTD 1 Year 3 Years 5 Years 10 Years0.0
1.0
2.0
3.0
4.0
5.0
6.0
7.0
8.0
9.0
1.1 1.3
8.4
5.44.7
1.41.8
7.9
3.6 3.5
2.4
BlackRock Strategic Income Opps K US Fund Nontradi�onal Bond
Re
turn
Risk-Reward
Time Period: 7/1/2018 to 6/30/2021
Std Dev
0.0 3.0 6.0 9.0 12.0 15.0
3.0
1.0
1.0
3.0
5.0
7.0
9.0
BlackRock Strategic Income Opps K US Fund Nontradi�onal Bond
Re
turn
BlackRock Strategic Income Opps K - Risk
Time Period: Since Incep�on to 6/30/2021
Calcula�on Benchmark: US Fund Nontradi�onal Bond
Inv Bmk1 +/ Bmk1
Return
Std Dev
Downside Devia�on
Alpha
Beta
R2
Sharpe Ra�o (arith)
Tracking Error
4.75
3.92
0.61
1.20
0.93
91.52
0.93
1.19
3.71
4.05
0.00
0.00
1.00
100.00
0.64
0.00
1.05
0.12
0.61
1.20
0.07
8.48
0.29
1.19
Monthly Es�mated Fund-Level Net Flow
Time Period: 7/1/2016 to 6/30/2021
2017 2019 2021
4,000M
2,000M
0M
2,000M
BlackRock Strategic Income Opps K
Es�mat
ed Fund
Level
Month
ly Retu
rn
Source: Morningstar Direct, as of June 30, 2021, Informa�on provided herein was obtained from thirdparty sources deemed reliable. HighMark and its affiliates make no representa�ons or warran�es with respect to the �meliness, accuracy, or completeness of the informa�on and
bear no liability for any loss arising from its use.