Parking Requirements Phase One Technical Study
46
[NAME OF DOCUMENT] | VOLUME [Client Name] Nelson\Nygaard Consulting Associates Inc. | i FINAL REPORT City of Edmonton Comprehensive Parking Study – Phase I February 2019
Transcript of Parking Requirements Phase One Technical Study
[NAME OF DOCUMENT] | VOLUME
[Client Name]
Nelson\Nygaard Consulting Associates Inc. | i
FINAL REPORT
City of Edmonton Comprehensive Parking Study – Phase I
February 2019
COMPREHENSIVE PARKING STUDY – PHASE I | FINAL REPORT
City of Edmonton
Nelson\Nygaard Consulting Associates, Inc. | i
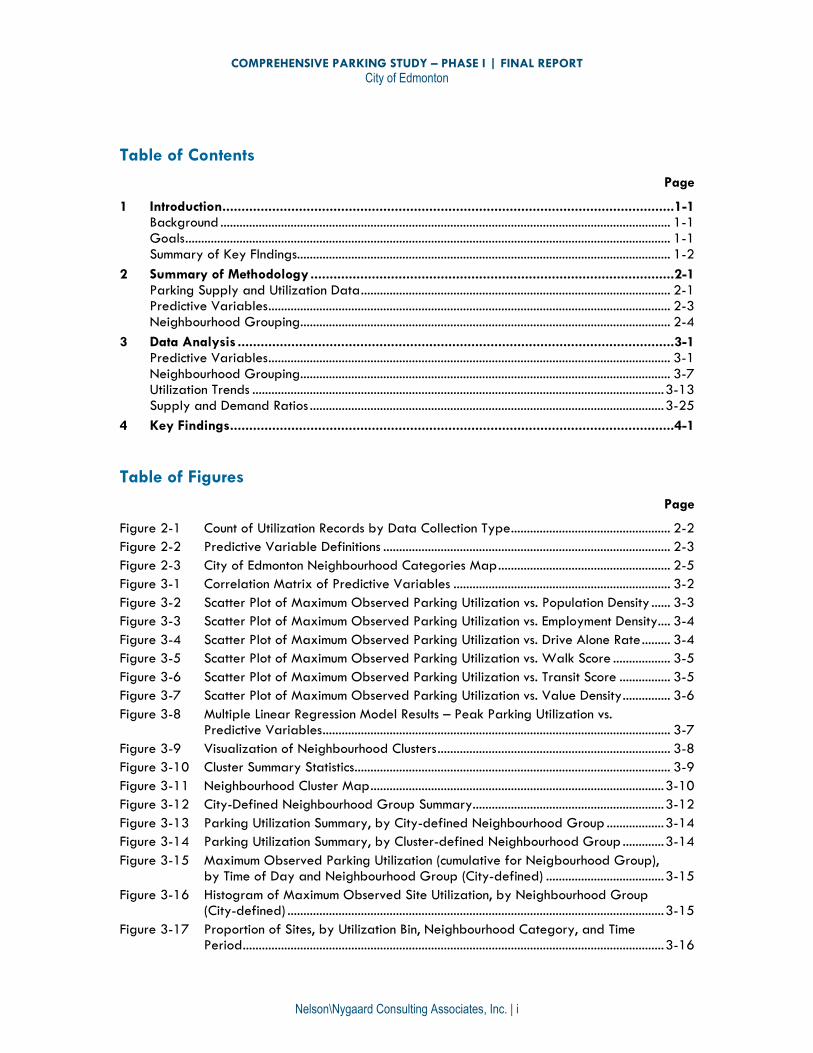
Table of Contents
Page
1 Introduction ......................................................................................................................1-1 Background ............................................................................................................................................. 1-1 Goals ........................................................................................................................................................ 1-1 Summary of Key FIndings..................................................................................................................... 1-2
2 Summary of Methodology ...............................................................................................2-1 Parking Supply and Utilization Data ................................................................................................. 2-1 Predictive Variables .............................................................................................................................. 2-3 Neighbourhood Grouping .................................................................................................................... 2-4
3 Data Analysis ..................................................................................................................3-1 Predictive Variables .............................................................................................................................. 3-1 Neighbourhood Grouping .................................................................................................................... 3-7 Utilization Trends ................................................................................................................................. 3-13 Supply and Demand Ratios ............................................................................................................... 3-25
4 Key Findings ....................................................................................................................4-1
Table of Figures
Page
Figure 2-1 Count of Utilization Records by Data Collection Type .................................................. 2-2
Figure 2-2 Predictive Variable Definitions .......................................................................................... 2-3
Figure 2-3 City of Edmonton Neighbourhood Categories Map ...................................................... 2-5
Figure 3-1 Correlation Matrix of Predictive Variables .................................................................... 3-2
Figure 3-2 Scatter Plot of Maximum Observed Parking Utilization vs. Population Density ...... 3-3
Figure 3-3 Scatter Plot of Maximum Observed Parking Utilization vs. Employment Density.... 3-4
Figure 3-4 Scatter Plot of Maximum Observed Parking Utilization vs. Drive Alone Rate ......... 3-4
Figure 3-5 Scatter Plot of Maximum Observed Parking Utilization vs. Walk Score .................. 3-5
Figure 3-6 Scatter Plot of Maximum Observed Parking Utilization vs. Transit Score ................ 3-5
Figure 3-7 Scatter Plot of Maximum Observed Parking Utilization vs. Value Density ............... 3-6
Figure 3-8 Multiple Linear Regression Model Results – Peak Parking Utilization vs. Predictive Variables ............................................................................................................. 3-7
Figure 3-9 Visualization of Neighbourhood Clusters ......................................................................... 3-8
Figure 3-10 Cluster Summary Statistics ................................................................................................... 3-9
Figure 3-11 Neighbourhood Cluster Map ............................................................................................ 3-10
Figure 3-12 City-Defined Neighbourhood Group Summary ............................................................ 3-12
Figure 3-13 Parking Utilization Summary, by City-defined Neighbourhood Group .................. 3-14
Figure 3-14 Parking Utilization Summary, by Cluster-defined Neighbourhood Group ............. 3-14
Figure 3-15 Maximum Observed Parking Utilization (cumulative for Neigbourhood Group), by Time of Day and Neighbourhood Group (City-defined) ..................................... 3-15
Figure 3-16 Histogram of Maximum Observed Site Utilization, by Neighbourhood Group (City-defined) ...................................................................................................................... 3-15
Figure 3-17 Proportion of Sites, by Utilization Bin, Neighbourhood Category, and Time Period .................................................................................................................................... 3-16
COMPREHENSIVE PARKING STUDY – PHASE I | FINAL REPORT
City of Edmonton
Nelson\Nygaard Consulting Associates, Inc. | ii
Figure 3-18 Maximum Observed Parking Utilization (cumulative for neighbourhood group), by Time of Day and Neighbourhood Cluster ................................................................ 3-17
Figure 3-19 Histogram of Maximum Observed Site Utilization, by Neighbourhood Cluster .... 3-17
Figure 3-20 Proportion of Sites, by Utilization Bin, Neighbourhood Category, and Time Period .................................................................................................................................... 3-18
Figure 3-21 Peak Observed Parking Utilization, by Site ................................................................. 3-19
Figure 3-22 Sites, Supply, and Utilization, by Land Use Group ..................................................... 3-21
Figure 3-23 Parking Utilization (cumulative), by Time of Day and Land Use (Overall Land Use Categories)................................................................................................................... 3-22
Figure 3-24 Parking Utilization (cumulative), by Time of Day and Land Use (among Commercial Uses) ................................................................................................................ 3-22
Figure 3-25 Parking Utilization (cumulative), by Time of Day and Land Use (among Residential Uses) ................................................................................................................. 3-23
Figure 3-26 Summary of Seasonal Change in Utilization ................................................................. 3-23
Figure 3-27 Cumulative Parking Utilization, by Season, Land Use, and Time of Day ................ 3-24
Figure 3-28 Ratio Boxplot, by Neighbourhood Group and Overall Land Use ............................ 3-26
Figure 3-29 Ratio Boxplot, by Neighbourhood Cluster and Overall Land Use ........................... 3-27
Figure 3-30 Ratio Boxplot, by Commercial Land Use ....................................................................... 3-29
Figure 3-31 Supply and Demand Ratio Scatterplot among Commercial Uses ............................. 3-30
Figure 3-32 Ratio Boxplot, by Residential Land Use ......................................................................... 3-31
Figure 3-33 Supply and Demand Ratio Scatterplot among Residential Uses .............................. 3-32
Figure 3-34 Ratio Boxplot, by Overall Land Use ............................................................................... 3-33
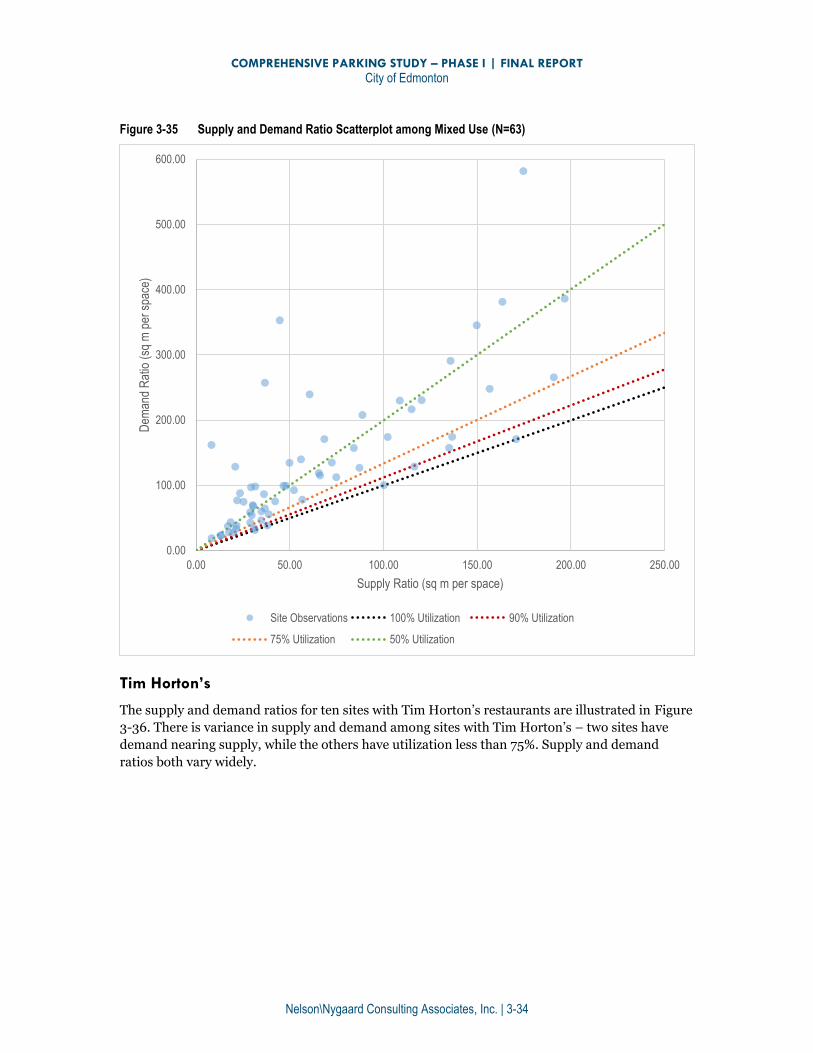
Figure 3-35 Supply and Demand Ratio Scatterplot among Mixed Use ........................................ 3-34
COMPREHENSIVE PARKING STUDY – PHASE I | FINAL REPORT
City of Edmonton
Nelson\Nygaard Consulting Associates, Inc. | 1-1
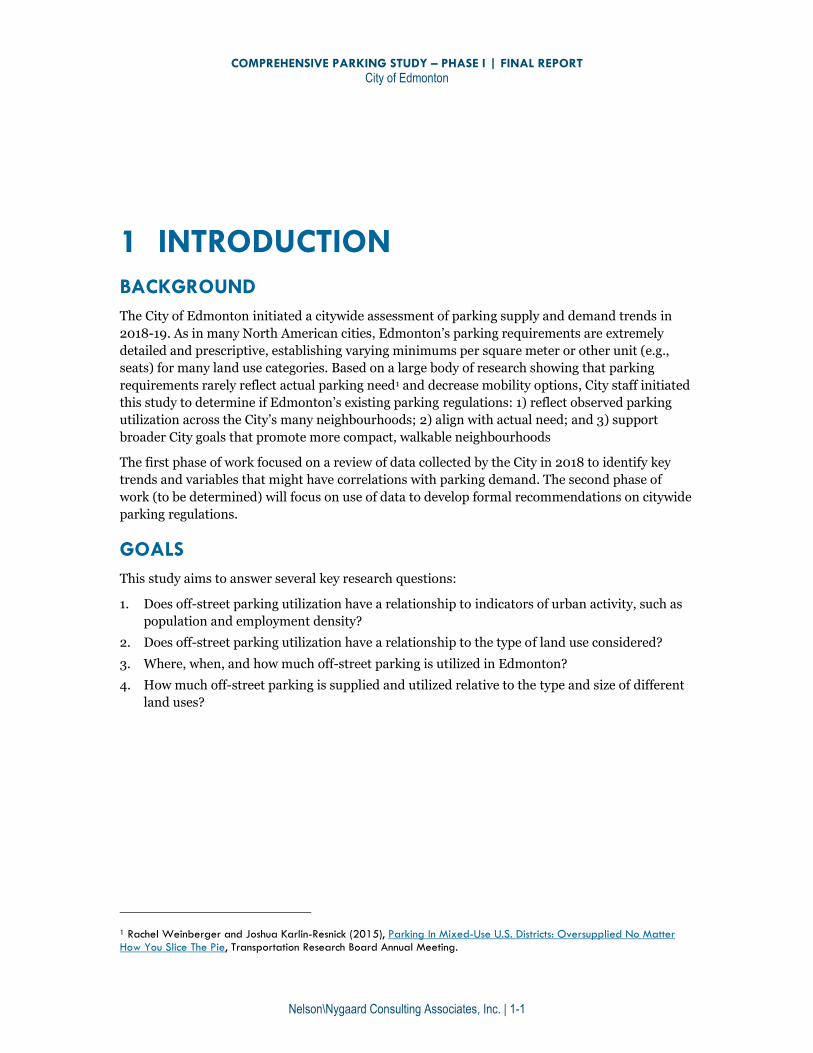
1 INTRODUCTION
BACKGROUND
The City of Edmonton initiated a citywide assessment of parking supply and demand trends in
2018-19. As in many North American cities, Edmonton’s parking requirements are extremely
detailed and prescriptive, establishing varying minimums per square meter or other unit (e.g.,
seats) for many land use categories. Based on a large body of research showing that parking
requirements rarely reflect actual parking need1 and decrease mobility options, City staff initiated
this study to determine if Edmonton’s existing parking regulations: 1) reflect observed parking
utilization across the City’s many neighbourhoods; 2) align with actual need; and 3) support
broader City goals that promote more compact, walkable neighbourhoods
The first phase of work focused on a review of data collected by the City in 2018 to identify key
trends and variables that might have correlations with parking demand. The second phase of
work (to be determined) will focus on use of data to develop formal recommendations on citywide
parking regulations.
GOALS
This study aims to answer several key research questions:
1. Does off-street parking utilization have a relationship to indicators of urban activity, such as
population and employment density?
2. Does off-street parking utilization have a relationship to the type of land use considered?
3. Where, when, and how much off-street parking is utilized in Edmonton?
4. How much off-street parking is supplied and utilized relative to the type and size of different
land uses?
1 Rachel Weinberger and Joshua Karlin-Resnick (2015), Parking In Mixed-Use U.S. Districts: Oversupplied No Matter How You Slice The Pie, Transportation Research Board Annual Meeting.
COMPREHENSIVE PARKING STUDY – PHASE I | FINAL REPORT
City of Edmonton
Nelson\Nygaard Consulting Associates, Inc. | 1-2
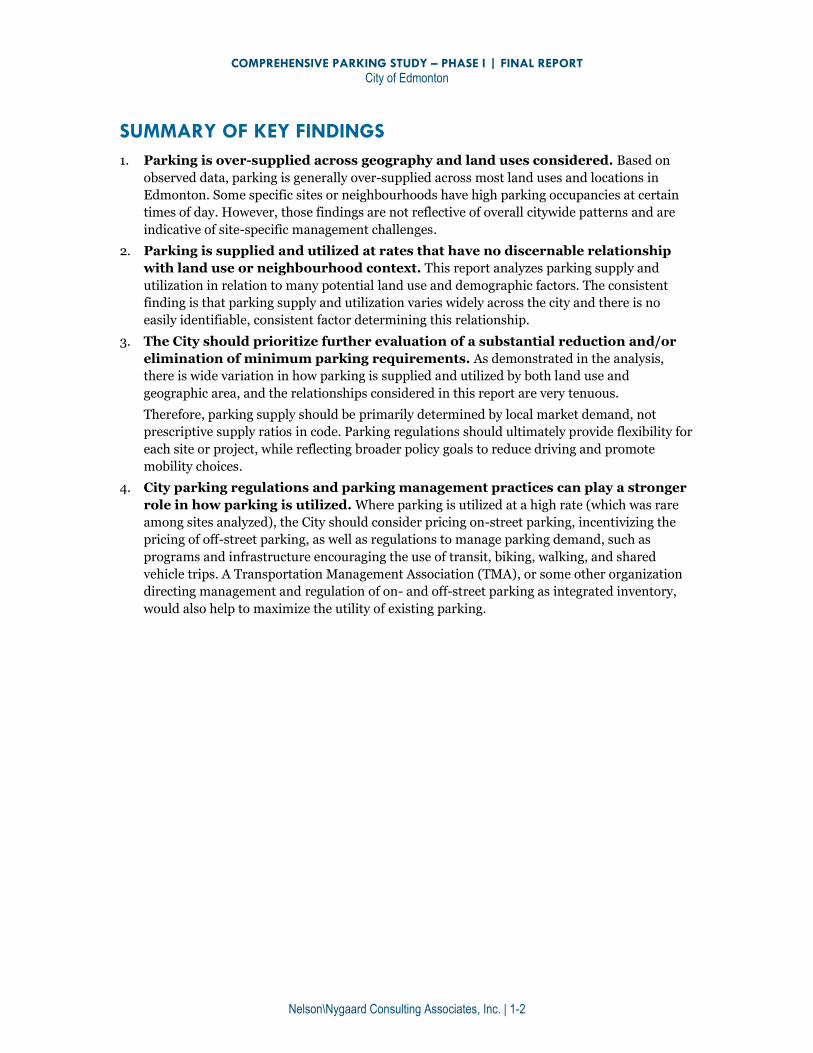
SUMMARY OF KEY FINDINGS
1. Parking is over-supplied across geography and land uses considered. Based on
observed data, parking is generally over-supplied across most land uses and locations in
Edmonton. Some specific sites or neighbourhoods have high parking occupancies at certain
times of day. However, those findings are not reflective of overall citywide patterns and are
indicative of site-specific management challenges.
2. Parking is supplied and utilized at rates that have no discernable relationship
with land use or neighbourhood context. This report analyzes parking supply and
utilization in relation to many potential land use and demographic factors. The consistent
finding is that parking supply and utilization varies widely across the city and there is no
easily identifiable, consistent factor determining this relationship.
3. The City should prioritize further evaluation of a substantial reduction and/or
elimination of minimum parking requirements. As demonstrated in the analysis,
there is wide variation in how parking is supplied and utilized by both land use and
geographic area, and the relationships considered in this report are very tenuous.
Therefore, parking supply should be primarily determined by local market demand, not
prescriptive supply ratios in code. Parking regulations should ultimately provide flexibility for
each site or project, while reflecting broader policy goals to reduce driving and promote
mobility choices.
4. City parking regulations and parking management practices can play a stronger
role in how parking is utilized. Where parking is utilized at a high rate (which was rare
among sites analyzed), the City should consider pricing on-street parking, incentivizing the
pricing of off-street parking, as well as regulations to manage parking demand, such as
programs and infrastructure encouraging the use of transit, biking, walking, and shared
vehicle trips. A Transportation Management Association (TMA), or some other organization
directing management and regulation of on- and off-street parking as integrated inventory,
would also help to maximize the utility of existing parking.
COMPREHENSIVE PARKING STUDY – PHASE I | FINAL REPORT
City of Edmonton
Nelson\Nygaard Consulting Associates, Inc. | 2-1
2 SUMMARY OF METHODOLOGY
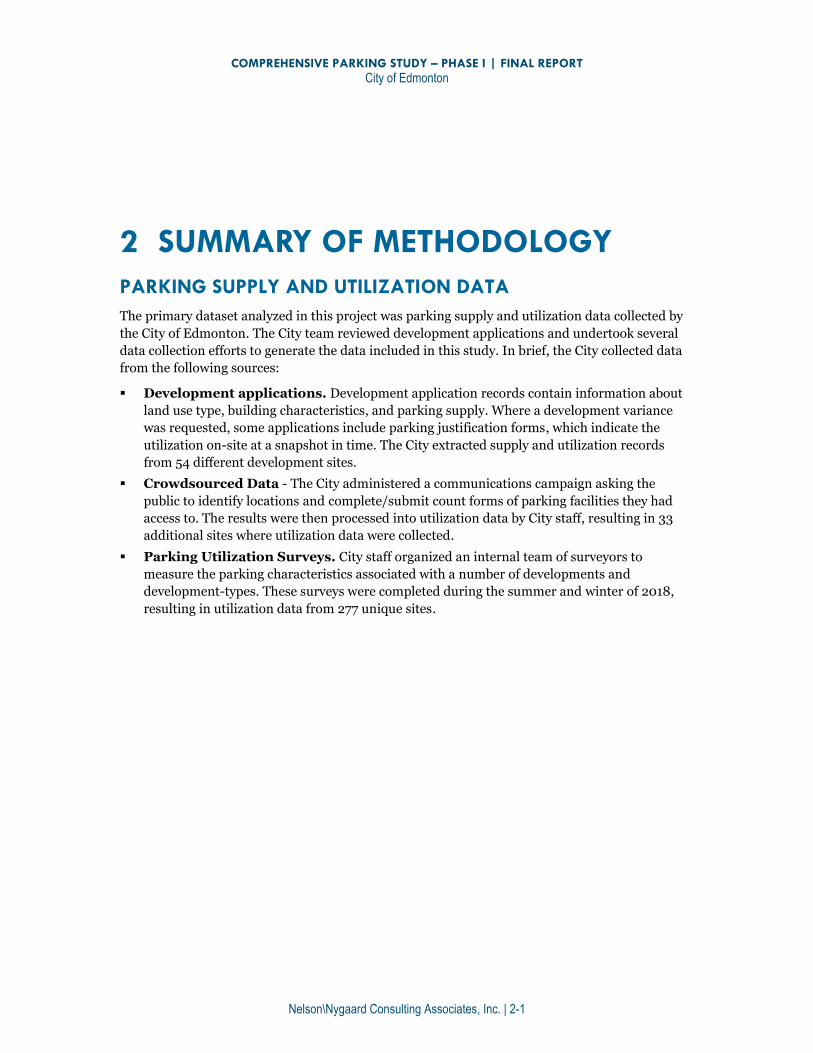
PARKING SUPPLY AND UTILIZATION DATA
The primary dataset analyzed in this project was parking supply and utilization data collected by
the City of Edmonton. The City team reviewed development applications and undertook several
data collection efforts to generate the data included in this study. In brief, the City collected data
from the following sources:
Development applications. Development application records contain information about
land use type, building characteristics, and parking supply. Where a development variance
was requested, some applications include parking justification forms, which indicate the
utilization on-site at a snapshot in time. The City extracted supply and utilization records
from 54 different development sites.
Crowdsourced Data - The City administered a communications campaign asking the
public to identify locations and complete/submit count forms of parking facilities they had
access to. The results were then processed into utilization data by City staff, resulting in 33
additional sites where utilization data were collected.
Parking Utilization Surveys. City staff organized an internal team of surveyors to
measure the parking characteristics associated with a number of developments and
development-types. These surveys were completed during the summer and winter of 2018,
resulting in utilization data from 277 unique sites.
COMPREHENSIVE PARKING STUDY – PHASE I | FINAL REPORT
City of Edmonton
Nelson\Nygaard Consulting Associates, Inc. | 2-2
These data were then processed and compiled into a Google Sheets database. The full details of
the data gathering and collection efforts are summarized in the City team’s data collection
methodology, included in Appendix A. All parking utilization records’ times of day were collapsed
into four categories for ease of analysis and comparison:
1. Early AM– 5 a.m. to 10 a.m.
2. Mid-day – 10 a.m. to 4 p.m.
3. Early PM – 4 p.m. to 10 p.m.
4. Late PM – 10 p.m. to 5 a.m.
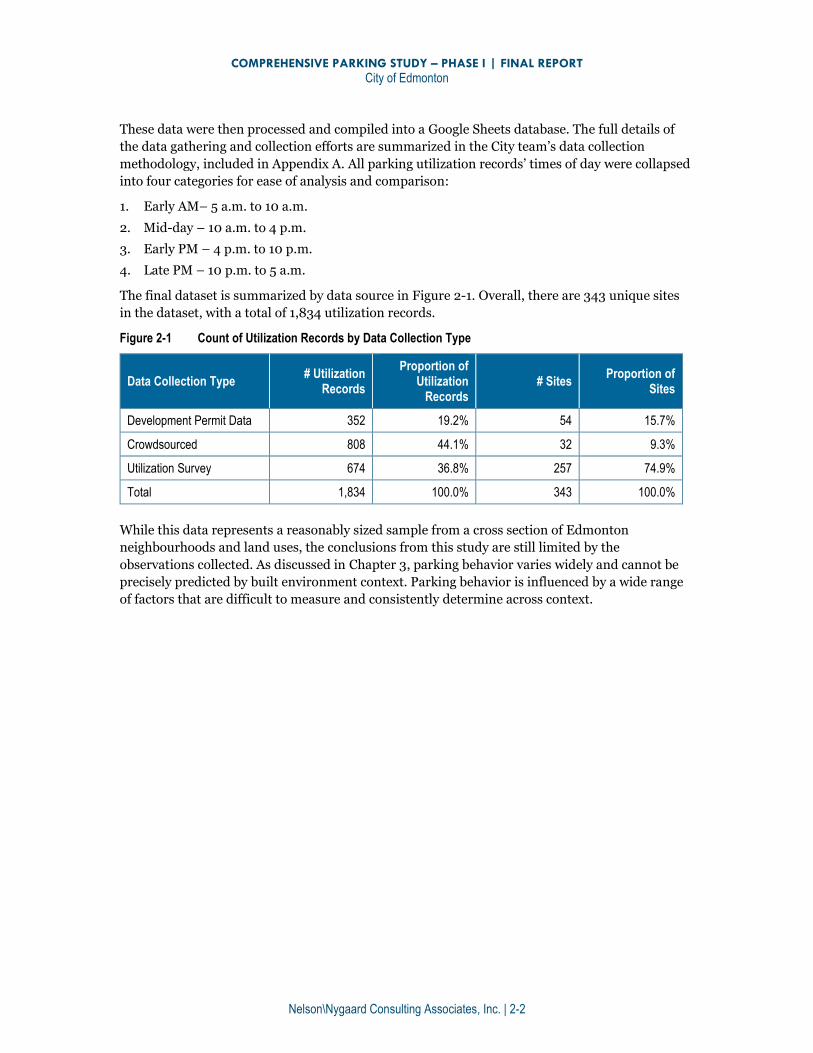
The final dataset is summarized by data source in Figure 2-1. Overall, there are 343 unique sites
in the dataset, with a total of 1,834 utilization records.
Figure 2-1 Count of Utilization Records by Data Collection Type
Data Collection Type # Utilization
Records
Proportion of Utilization
Records # Sites
Proportion of Sites
Development Permit Data 352 19.2% 54 15.7%
Crowdsourced 808 44.1% 32 9.3%
Utilization Survey 674 36.8% 257 74.9%
Total 1,834 100.0% 343 100.0%
While this data represents a reasonably sized sample from a cross section of Edmonton
neighbourhoods and land uses, the conclusions from this study are still limited by the
observations collected. As discussed in Chapter 3, parking behavior varies widely and cannot be
precisely predicted by built environment context. Parking behavior is influenced by a wide range
of factors that are difficult to measure and consistently determine across context.
COMPREHENSIVE PARKING STUDY – PHASE I | FINAL REPORT
City of Edmonton
Nelson\Nygaard Consulting Associates, Inc. | 2-3
PREDICTIVE VARIABLES
One of the primary purposes of the study was to test the relationship of parking supply and
utilization to geographic variables to identify potential trends in parking utilization across
Edmonton. The geographic level of analysis selected to test relationships was the neighbourhood
level. Edmonton has 396 neighbourhoods in all, 160 of which have one or more sites where
parking utilization was surveyed for this project. The following section presents a map of all the
neighbourhoods.
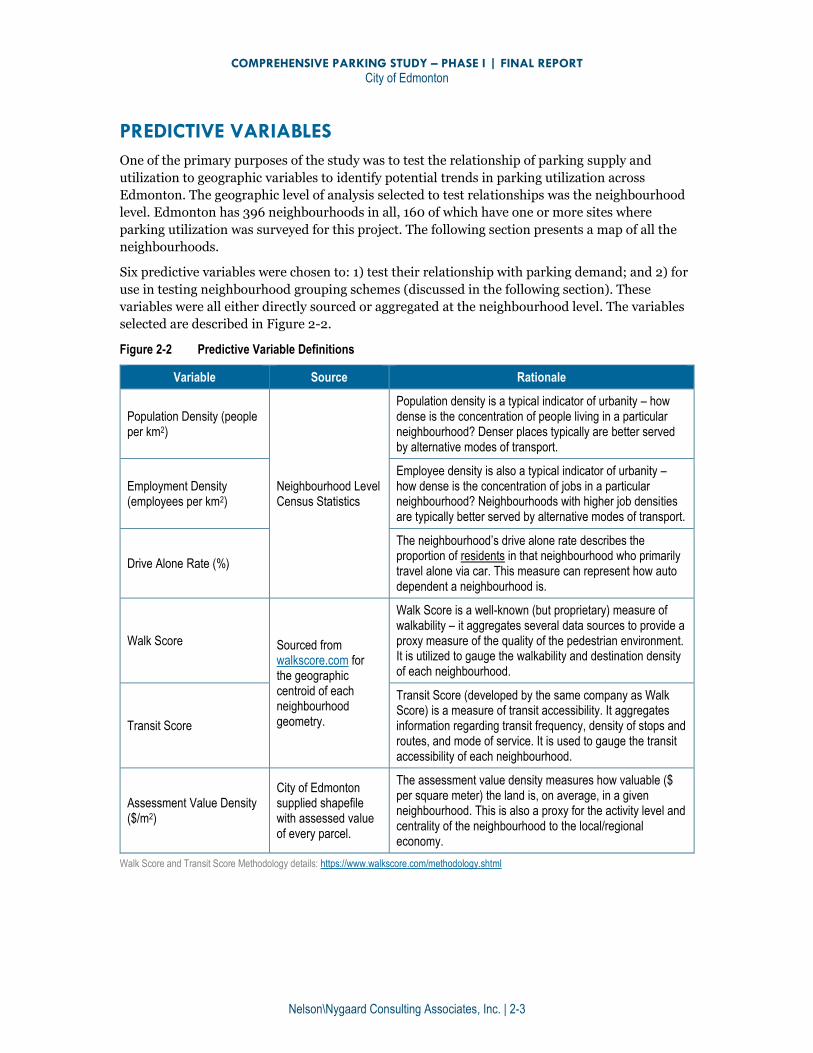
Six predictive variables were chosen to: 1) test their relationship with parking demand; and 2) for
use in testing neighbourhood grouping schemes (discussed in the following section). These
variables were all either directly sourced or aggregated at the neighbourhood level. The variables
selected are described in Figure 2-2.
Figure 2-2 Predictive Variable Definitions
Variable Source Rationale
Population Density (people per km2)
Neighbourhood Level Census Statistics
Population density is a typical indicator of urbanity – how dense is the concentration of people living in a particular neighbourhood? Denser places typically are better served by alternative modes of transport.
Employment Density (employees per km2)
Employee density is also a typical indicator of urbanity – how dense is the concentration of jobs in a particular neighbourhood? Neighbourhoods with higher job densities are typically better served by alternative modes of transport.
Drive Alone Rate (%)
The neighbourhood’s drive alone rate describes the proportion of residents in that neighbourhood who primarily travel alone via car. This measure can represent how auto dependent a neighbourhood is.
Walk Score Sourced from walkscore.com for the geographic centroid of each neighbourhood geometry.
Walk Score is a well-known (but proprietary) measure of walkability – it aggregates several data sources to provide a proxy measure of the quality of the pedestrian environment. It is utilized to gauge the walkability and destination density of each neighbourhood.
Transit Score
Transit Score (developed by the same company as Walk Score) is a measure of transit accessibility. It aggregates information regarding transit frequency, density of stops and routes, and mode of service. It is used to gauge the transit accessibility of each neighbourhood.
Assessment Value Density ($/m2)
City of Edmonton supplied shapefile with assessed value of every parcel.
The assessment value density measures how valuable ($ per square meter) the land is, on average, in a given neighbourhood. This is also a proxy for the activity level and centrality of the neighbourhood to the local/regional economy.
Walk Score and Transit Score Methodology details: https://www.walkscore.com/methodology.shtml
COMPREHENSIVE PARKING STUDY – PHASE I | FINAL REPORT
City of Edmonton
Nelson\Nygaard Consulting Associates, Inc. | 2-4
NEIGHBOURHOOD GROUPING
As stated in the previous section, the potential predictive variables were all tied to neighbourhood
geographies. Given the limited resolution of parking utilization data collected, as well as the fact
that the census statistics were only available at the neighbourhood level, data was aggregated to
the neighbourhood level to attempt to make comparisons between a few aggregated statistics
rather than solely among hundreds of different parking counts. As a result, instead of comparing
160 different neighbourhoods (the number of neighbourhoods with parking utilization data), a
comparison between five groupings of ‘similar’ neighbourhoods could be made.
There were two different groupings of neighourhoods tested – one of which was supplied by the
City, and the other which was developed based upon an analysis of the predictive variables
discussed above. Each grouping classified every one of Edmonton’s 396 neighbourhoods into five
groups.
1. City-developed classification: this classification splits neighbourhoods into eight groups,
five of which include parcels analyzed in this study. Those groups are defined in Edmonton’s
Municipal Development Plan, The Way We Grow. Descriptions of the groups from the 2015
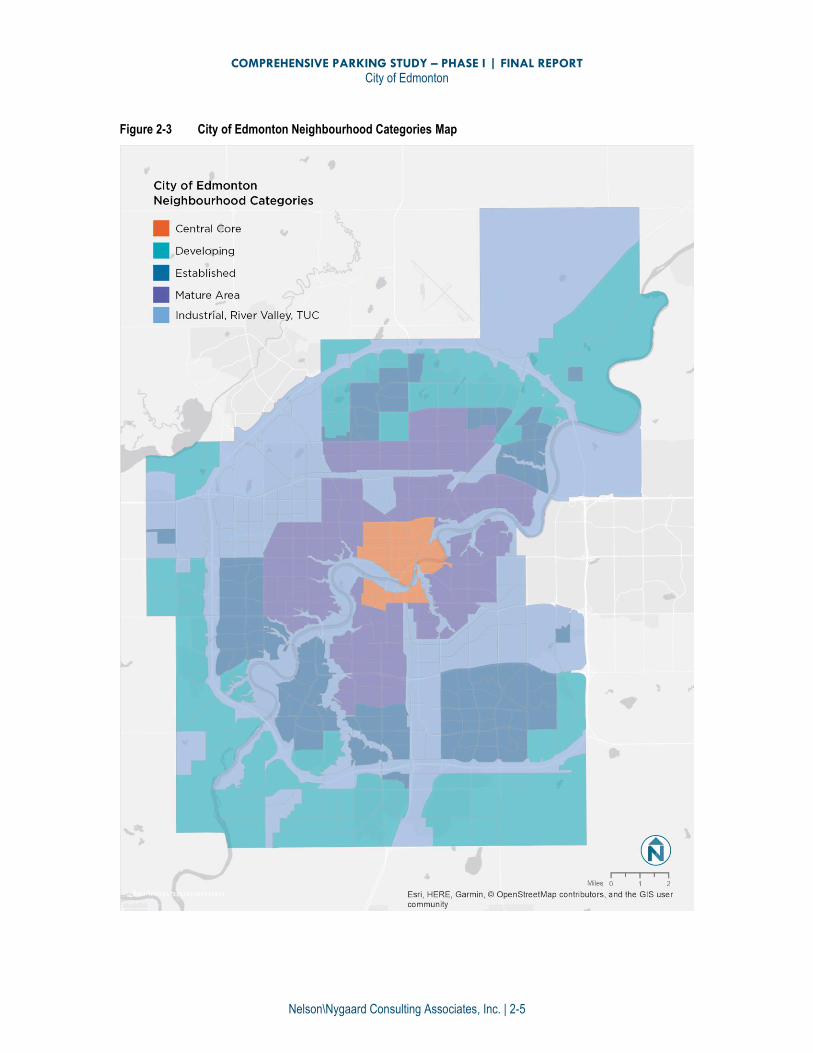
Growth Monitoring Report are provided below. A map of the Edmonton’s neighbourhoods
and their groups is illustrated in Figure 2-3. Those five groups are:
a. Core areas – Downtown and adjacent neighbourhoods.
b. Mature areas – Neighbourhoods outside the core, generally completed prior to 1970.
c. Established areas – Completed neighbourhoods, generally within the Anthony
Henday Transportation Corridor.
d. Developing areas – Currently developing and planned neighbourhoods where lot
registration is not yet complete.
e. Industrial areas – areas zoned for industrial uses.
2. K-means clustering: A statistical method (k-means2) was used to cluster neighbourhoods
into groups based upon their values for the selected predictive variables. This method was
used to attempt to detect groups of similar neighbourhoods (based on the variables
considered) in a systematic and empirical way (as opposed to the City-developed
classification). If there is a clear grouping of neighbourhoods, similar parking regulations
(and other related regulations to the selected variables) may be applicable within those
groups, which is useful for developing context-sensitive transportation policy and regulation.
The final number of clusters and the predictive variables used in those cluster definitions,
along with a map of the final clusters, are presented in the following chapter.
2 K-means clustering is a statistical method for grouping observations into a pre-determined number of groups based upon their values for a defined number of variables. For more information: https://en.wikipedia.org/wiki/K-means_clustering
COMPREHENSIVE PARKING STUDY – PHASE I | FINAL REPORT
City of Edmonton
Nelson\Nygaard Consulting Associates, Inc. | 2-5
Figure 2-3 City of Edmonton Neighbourhood Categories Map
COMPREHENSIVE PARKING STUDY – PHASE I | FINAL REPORT
City of Edmonton
Nelson\Nygaard Consulting Associates, Inc. | 3-1
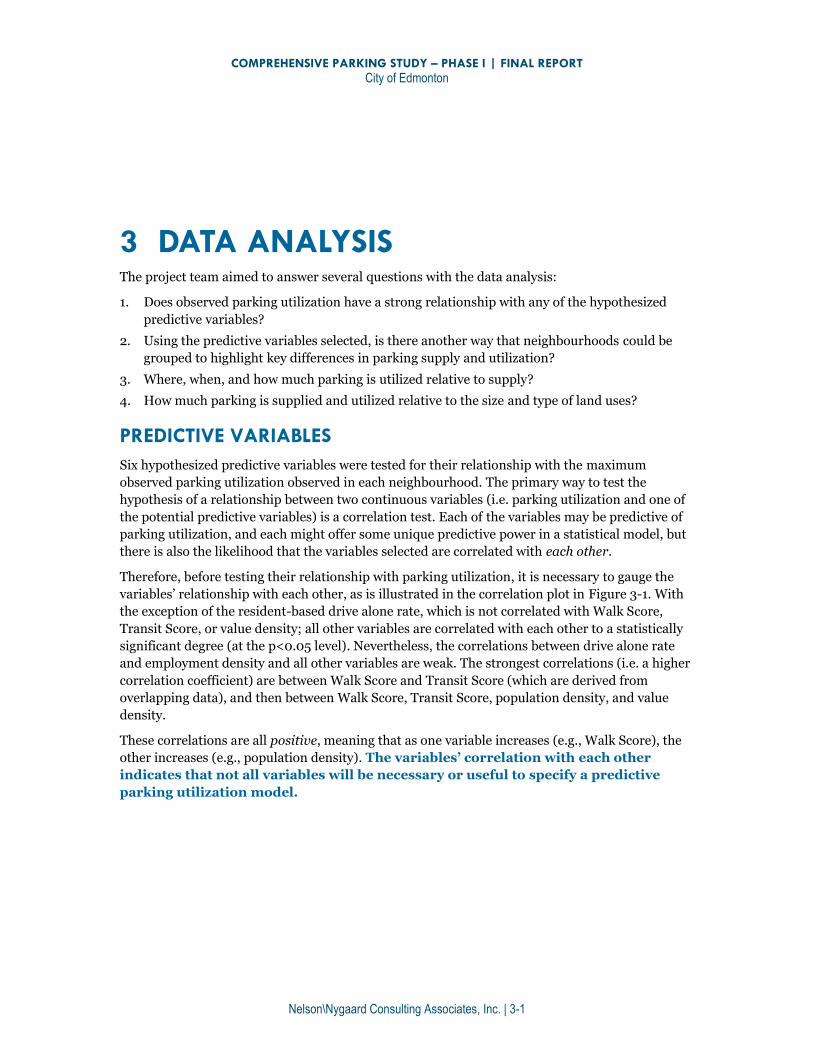
3 DATA ANALYSIS The project team aimed to answer several questions with the data analysis:
1. Does observed parking utilization have a strong relationship with any of the hypothesized
predictive variables?
2. Using the predictive variables selected, is there another way that neighbourhoods could be
grouped to highlight key differences in parking supply and utilization?
3. Where, when, and how much parking is utilized relative to supply?
4. How much parking is supplied and utilized relative to the size and type of land uses?
PREDICTIVE VARIABLES
Six hypothesized predictive variables were tested for their relationship with the maximum
observed parking utilization observed in each neighbourhood. The primary way to test the
hypothesis of a relationship between two continuous variables (i.e. parking utilization and one of
the potential predictive variables) is a correlation test. Each of the variables may be predictive of
parking utilization, and each might offer some unique predictive power in a statistical model, but
there is also the likelihood that the variables selected are correlated with each other.
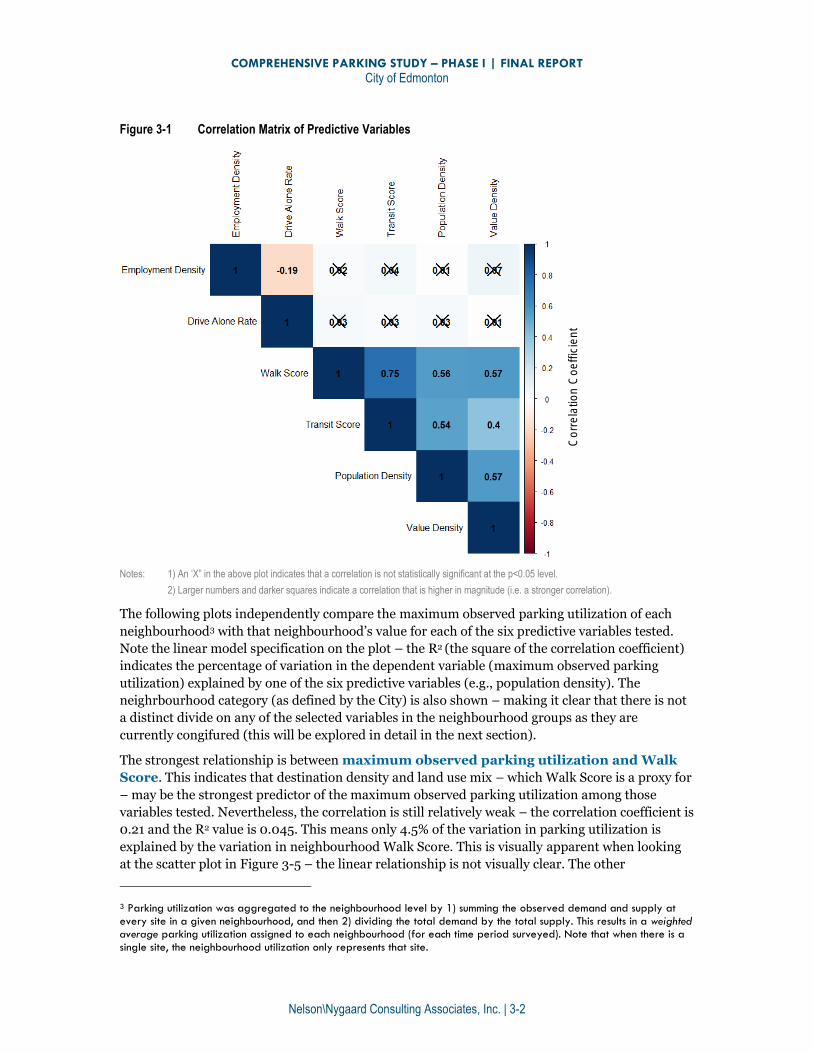
Therefore, before testing their relationship with parking utilization, it is necessary to gauge the
variables’ relationship with each other, as is illustrated in the correlation plot in Figure 3-1. With
the exception of the resident-based drive alone rate, which is not correlated with Walk Score,
Transit Score, or value density; all other variables are correlated with each other to a statistically
significant degree (at the p<0.05 level). Nevertheless, the correlations between drive alone rate
and employment density and all other variables are weak. The strongest correlations (i.e. a higher
correlation coefficient) are between Walk Score and Transit Score (which are derived from
overlapping data), and then between Walk Score, Transit Score, population density, and value
density.
These correlations are all positive, meaning that as one variable increases (e.g., Walk Score), the
other increases (e.g., population density). The variables’ correlation with each other
indicates that not all variables will be necessary or useful to specify a predictive
parking utilization model.
COMPREHENSIVE PARKING STUDY – PHASE I | FINAL REPORT
City of Edmonton
Nelson\Nygaard Consulting Associates, Inc. | 3-2
Figure 3-1 Correlation Matrix of Predictive Variables
Notes: 1) An ‘X” in the above plot indicates that a correlation is not statistically significant at the p<0.05 level.
2) Larger numbers and darker squares indicate a correlation that is higher in magnitude (i.e. a stronger correlation).
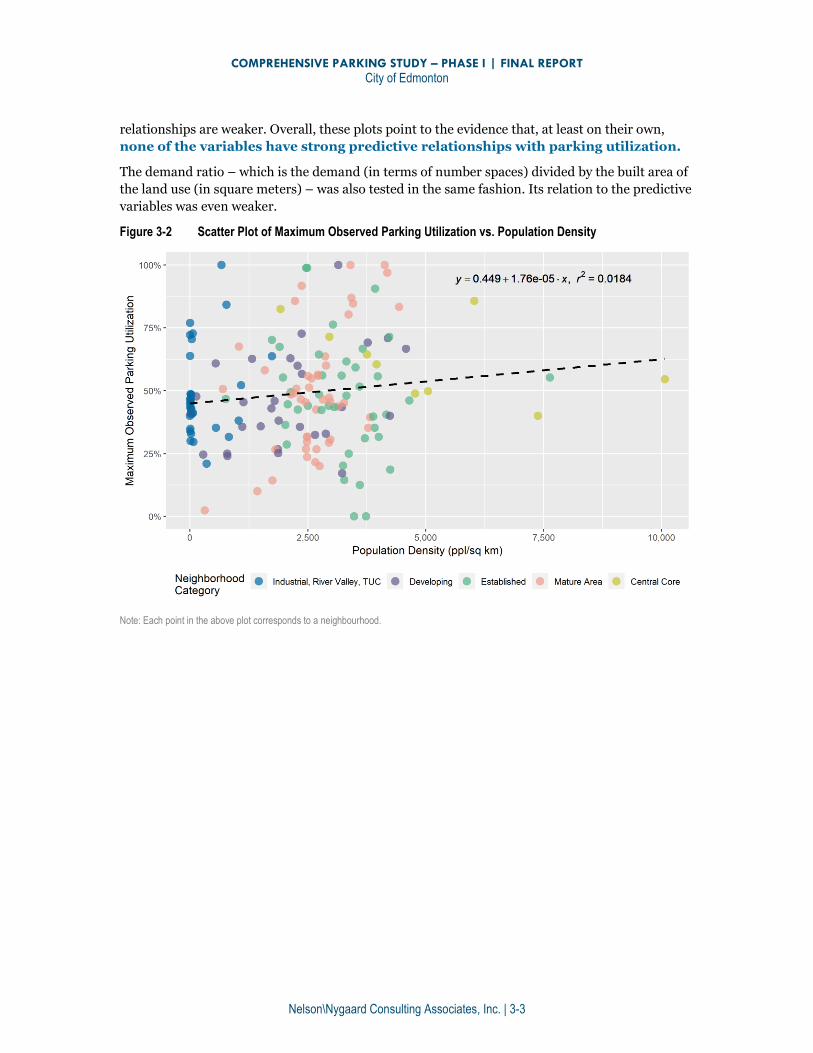
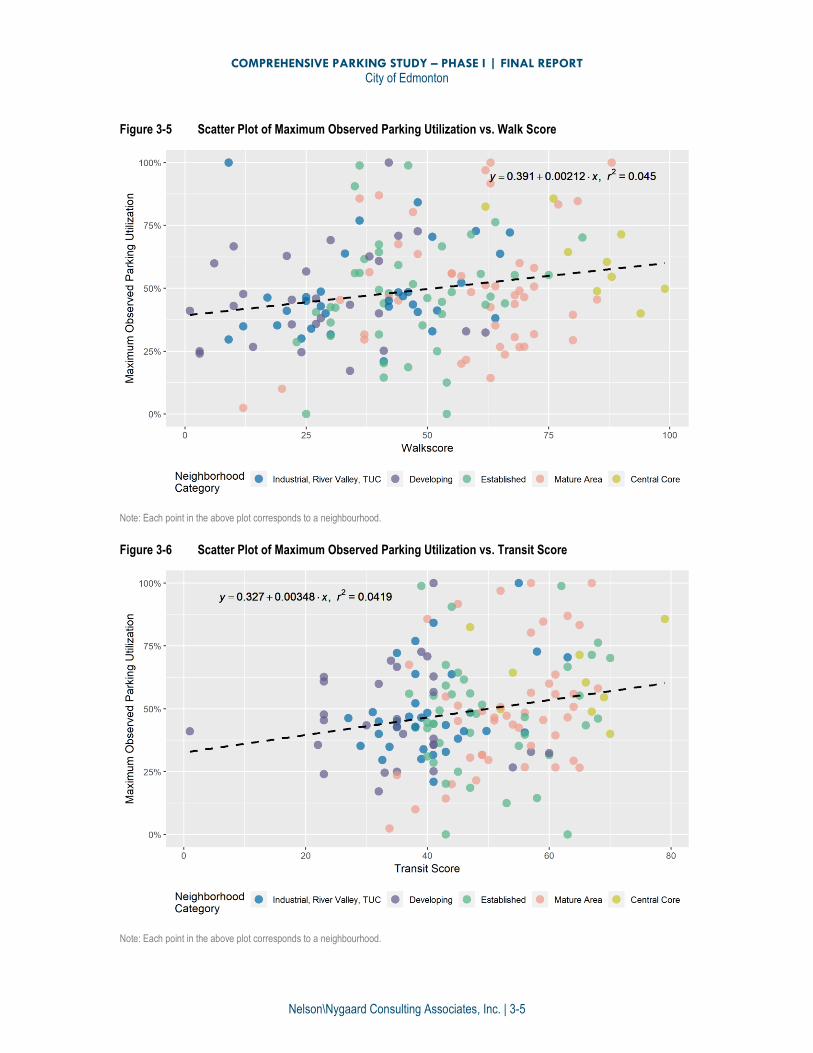
The following plots independently compare the maximum observed parking utilization of each
neighbourhood3 with that neighbourhood’s value for each of the six predictive variables tested.
Note the linear model specification on the plot – the R2 (the square of the correlation coefficient)
indicates the percentage of variation in the dependent variable (maximum observed parking
utilization) explained by one of the six predictive variables (e.g., population density). The
neighrbourhood category (as defined by the City) is also shown – making it clear that there is not
a distinct divide on any of the selected variables in the neighbourhood groups as they are
currently congifured (this will be explored in detail in the next section).
The strongest relationship is between maximum observed parking utilization and Walk
Score. This indicates that destination density and land use mix – which Walk Score is a proxy for
– may be the strongest predictor of the maximum observed parking utilization among those
variables tested. Nevertheless, the correlation is still relatively weak – the correlation coefficient is
0.21 and the R2 value is 0.045. This means only 4.5% of the variation in parking utilization is
explained by the variation in neighbourhood Walk Score. This is visually apparent when looking
at the scatter plot in Figure 3-5 – the linear relationship is not visually clear. The other
3 Parking utilization was aggregated to the neighbourhood level by 1) summing the observed demand and supply at every site in a given neighbourhood, and then 2) dividing the total demand by the total supply. This results in a weighted average parking utilization assigned to each neighbourhood (for each time period surveyed). Note that when there is a single site, the neighbourhood utilization only represents that site.
Corr
ela
tio
n C
oe
ffic
ien
t
COMPREHENSIVE PARKING STUDY – PHASE I | FINAL REPORT
City of Edmonton
Nelson\Nygaard Consulting Associates, Inc. | 3-3
relationships are weaker. Overall, these plots point to the evidence that, at least on their own,
none of the variables have strong predictive relationships with parking utilization.
The demand ratio – which is the demand (in terms of number spaces) divided by the built area of
the land use (in square meters) – was also tested in the same fashion. Its relation to the predictive
variables was even weaker.
Figure 3-2 Scatter Plot of Maximum Observed Parking Utilization vs. Population Density
Note: Each point in the above plot corresponds to a neighbourhood.
COMPREHENSIVE PARKING STUDY – PHASE I | FINAL REPORT
City of Edmonton
Nelson\Nygaard Consulting Associates, Inc. | 3-4
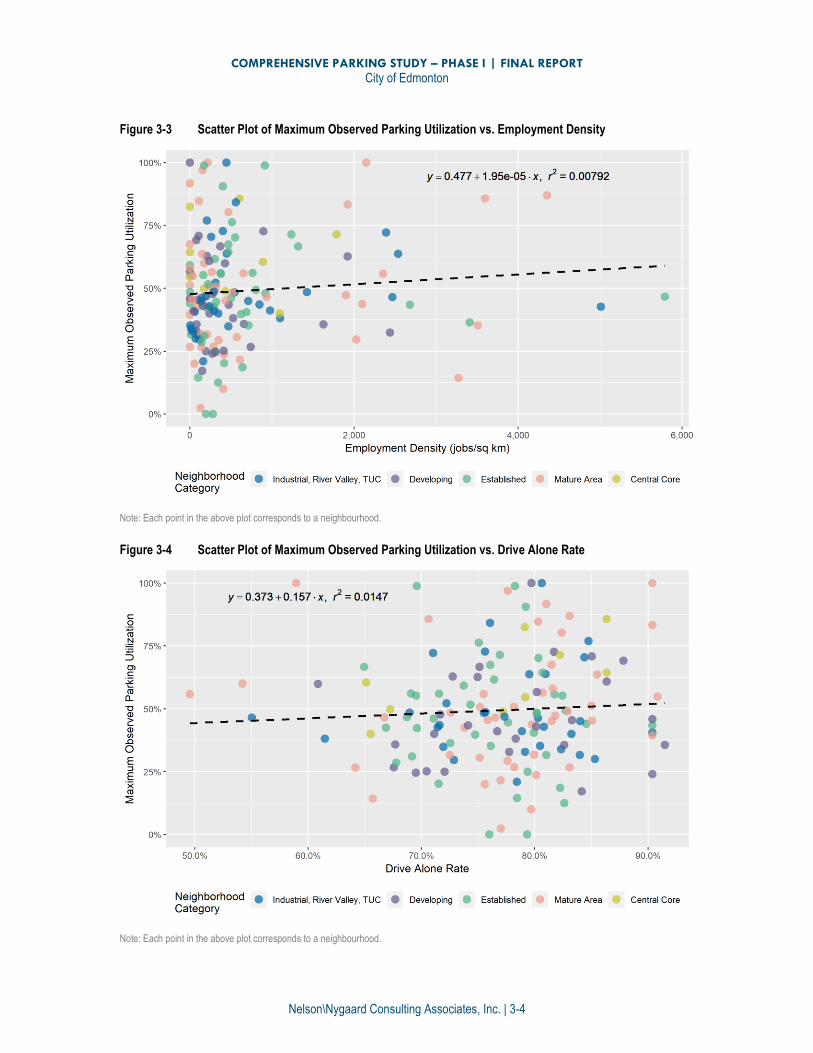
Figure 3-3 Scatter Plot of Maximum Observed Parking Utilization vs. Employment Density
Note: Each point in the above plot corresponds to a neighbourhood.
Figure 3-4 Scatter Plot of Maximum Observed Parking Utilization vs. Drive Alone Rate
Note: Each point in the above plot corresponds to a neighbourhood.
COMPREHENSIVE PARKING STUDY – PHASE I | FINAL REPORT
City of Edmonton
Nelson\Nygaard Consulting Associates, Inc. | 3-5
Figure 3-5 Scatter Plot of Maximum Observed Parking Utilization vs. Walk Score
Note: Each point in the above plot corresponds to a neighbourhood.
Figure 3-6 Scatter Plot of Maximum Observed Parking Utilization vs. Transit Score
Note: Each point in the above plot corresponds to a neighbourhood.
COMPREHENSIVE PARKING STUDY – PHASE I | FINAL REPORT
City of Edmonton
Nelson\Nygaard Consulting Associates, Inc. | 3-6
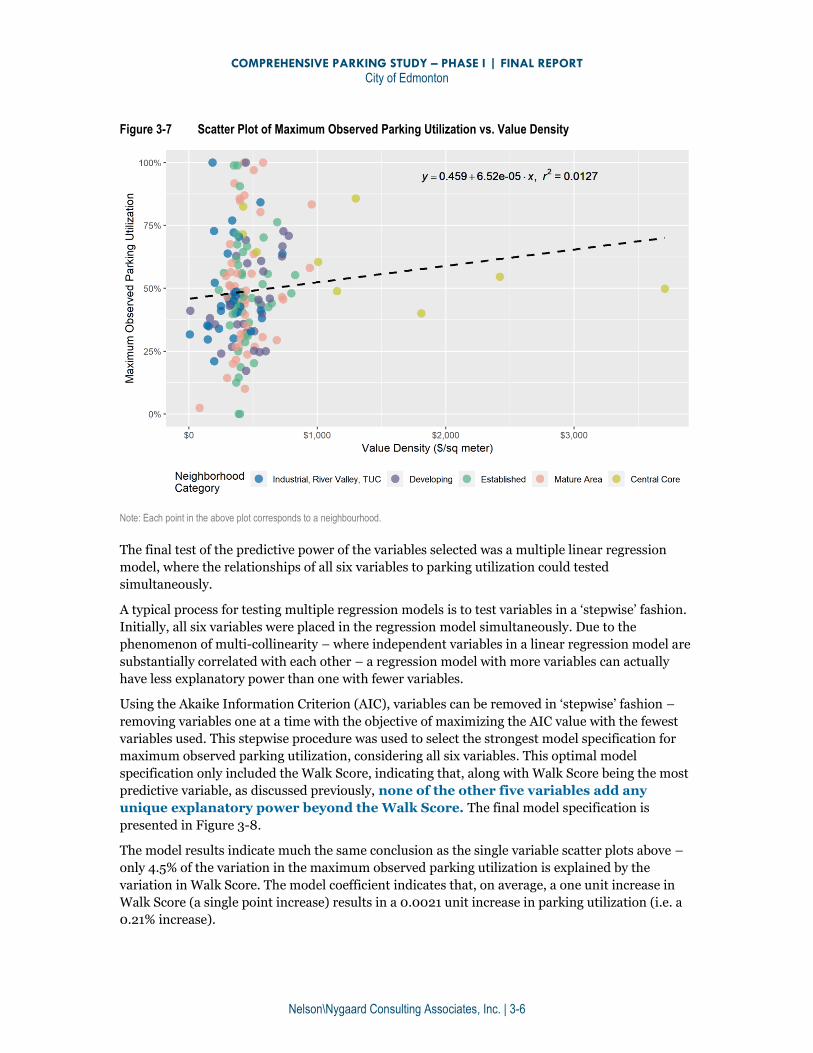
Figure 3-7 Scatter Plot of Maximum Observed Parking Utilization vs. Value Density
Note: Each point in the above plot corresponds to a neighbourhood.
The final test of the predictive power of the variables selected was a multiple linear regression
model, where the relationships of all six variables to parking utilization could tested
simultaneously.
A typical process for testing multiple regression models is to test variables in a ‘stepwise’ fashion.
Initially, all six variables were placed in the regression model simultaneously. Due to the
phenomenon of multi-collinearity – where independent variables in a linear regression model are
substantially correlated with each other – a regression model with more variables can actually
have less explanatory power than one with fewer variables.
Using the Akaike Information Criterion (AIC), variables can be removed in ‘stepwise’ fashion –
removing variables one at a time with the objective of maximizing the AIC value with the fewest
variables used. This stepwise procedure was used to select the strongest model specification for
maximum observed parking utilization, considering all six variables. This optimal model
specification only included the Walk Score, indicating that, along with Walk Score being the most
predictive variable, as discussed previously, none of the other five variables add any
unique explanatory power beyond the Walk Score. The final model specification is
presented in Figure 3-8.
The model results indicate much the same conclusion as the single variable scatter plots above –
only 4.5% of the variation in the maximum observed parking utilization is explained by the
variation in Walk Score. The model coefficient indicates that, on average, a one unit increase in
Walk Score (a single point increase) results in a 0.0021 unit increase in parking utilization (i.e. a
0.21% increase).
COMPREHENSIVE PARKING STUDY – PHASE I | FINAL REPORT
City of Edmonton
Nelson\Nygaard Consulting Associates, Inc. | 3-7
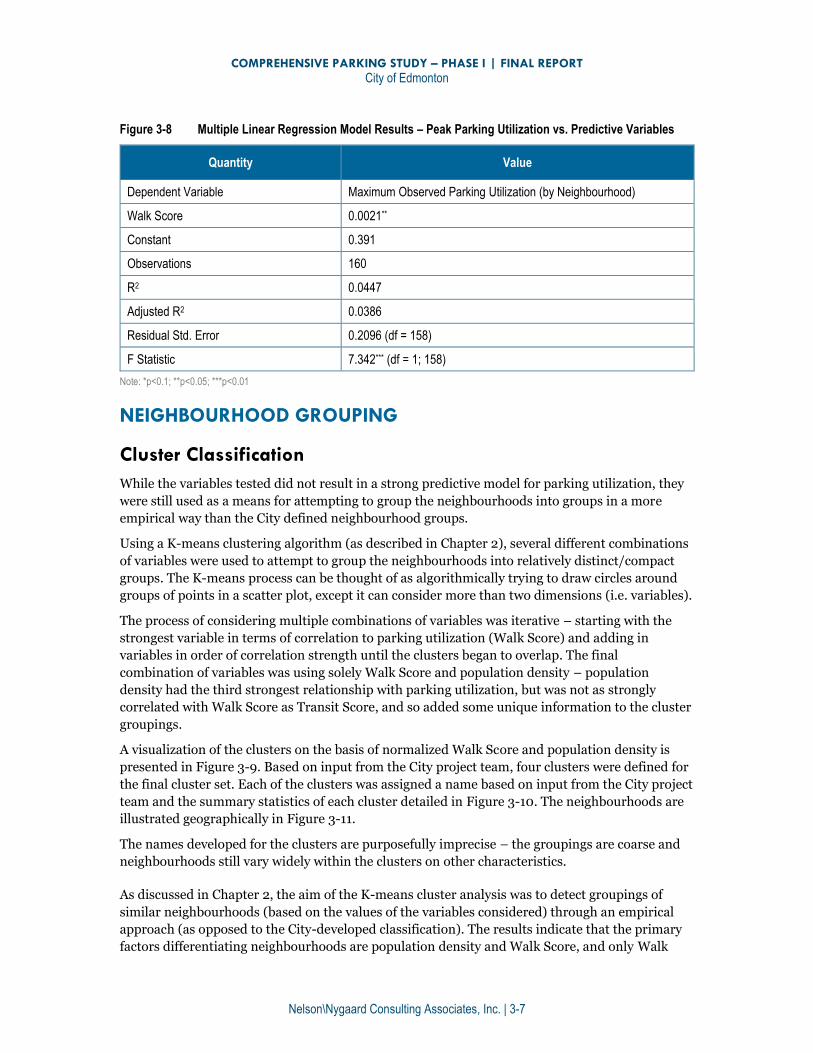
Figure 3-8 Multiple Linear Regression Model Results – Peak Parking Utilization vs. Predictive Variables
Quantity Value
Dependent Variable Maximum Observed Parking Utilization (by Neighbourhood)
Walk Score 0.0021**
Constant 0.391
Observations 160
R2 0.0447
Adjusted R2 0.0386
Residual Std. Error 0.2096 (df = 158)
F Statistic 7.342*** (df = 1; 158)
Note: *p<0.1; **p<0.05; ***p<0.01
NEIGHBOURHOOD GROUPING
Cluster Classification
While the variables tested did not result in a strong predictive model for parking utilization, they
were still used as a means for attempting to group the neighbourhoods into groups in a more
empirical way than the City defined neighbourhood groups.
Using a K-means clustering algorithm (as described in Chapter 2), several different combinations
of variables were used to attempt to group the neighbourhoods into relatively distinct/compact
groups. The K-means process can be thought of as algorithmically trying to draw circles around
groups of points in a scatter plot, except it can consider more than two dimensions (i.e. variables).
The process of considering multiple combinations of variables was iterative – starting with the
strongest variable in terms of correlation to parking utilization (Walk Score) and adding in
variables in order of correlation strength until the clusters began to overlap. The final
combination of variables was using solely Walk Score and population density – population
density had the third strongest relationship with parking utilization, but was not as strongly
correlated with Walk Score as Transit Score, and so added some unique information to the cluster
groupings.
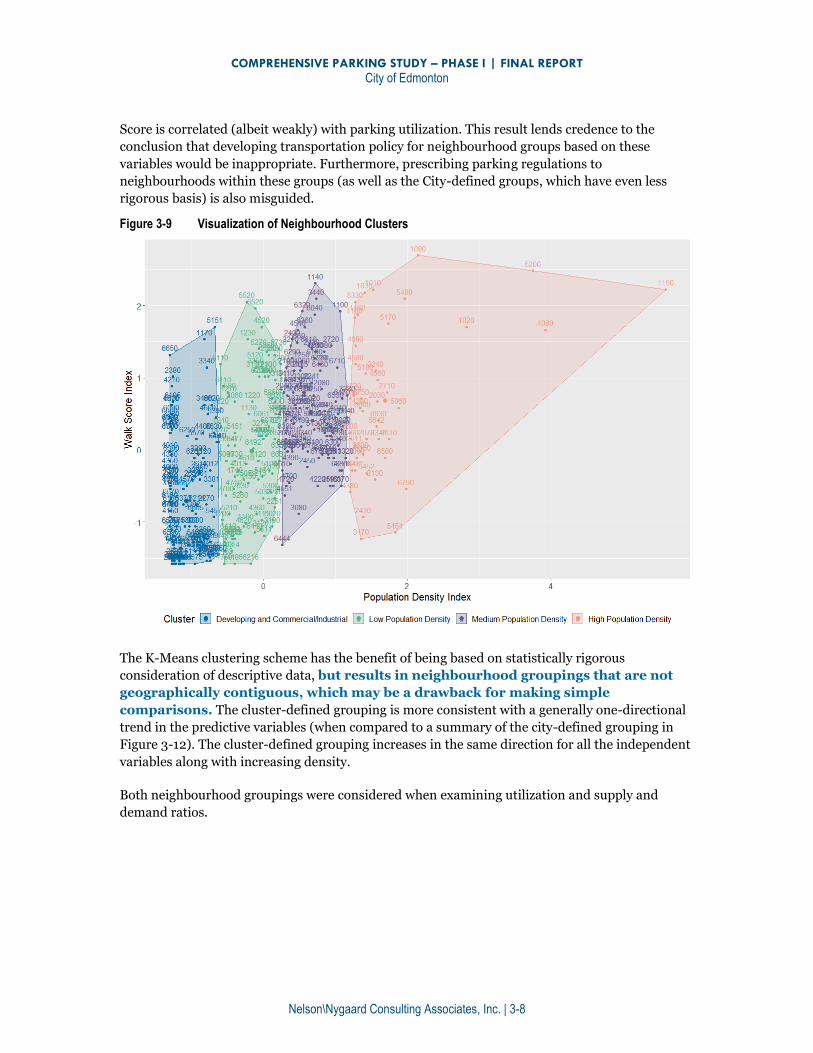
A visualization of the clusters on the basis of normalized Walk Score and population density is
presented in Figure 3-9. Based on input from the City project team, four clusters were defined for
the final cluster set. Each of the clusters was assigned a name based on input from the City project
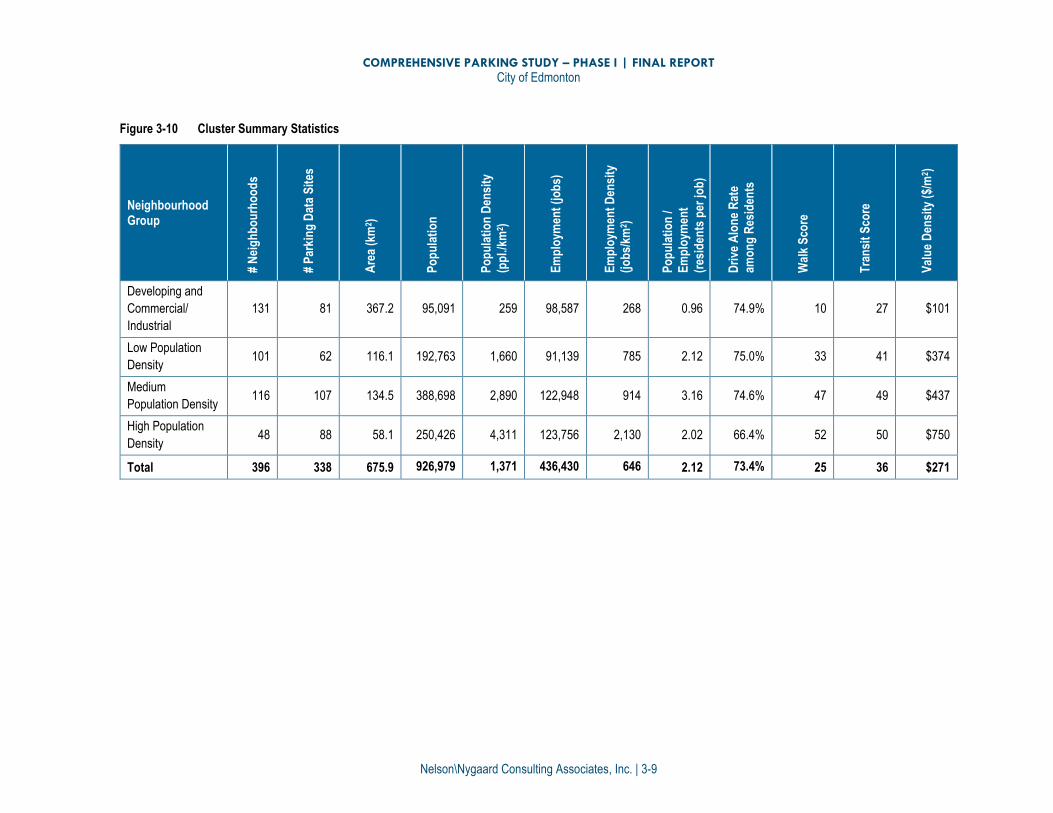
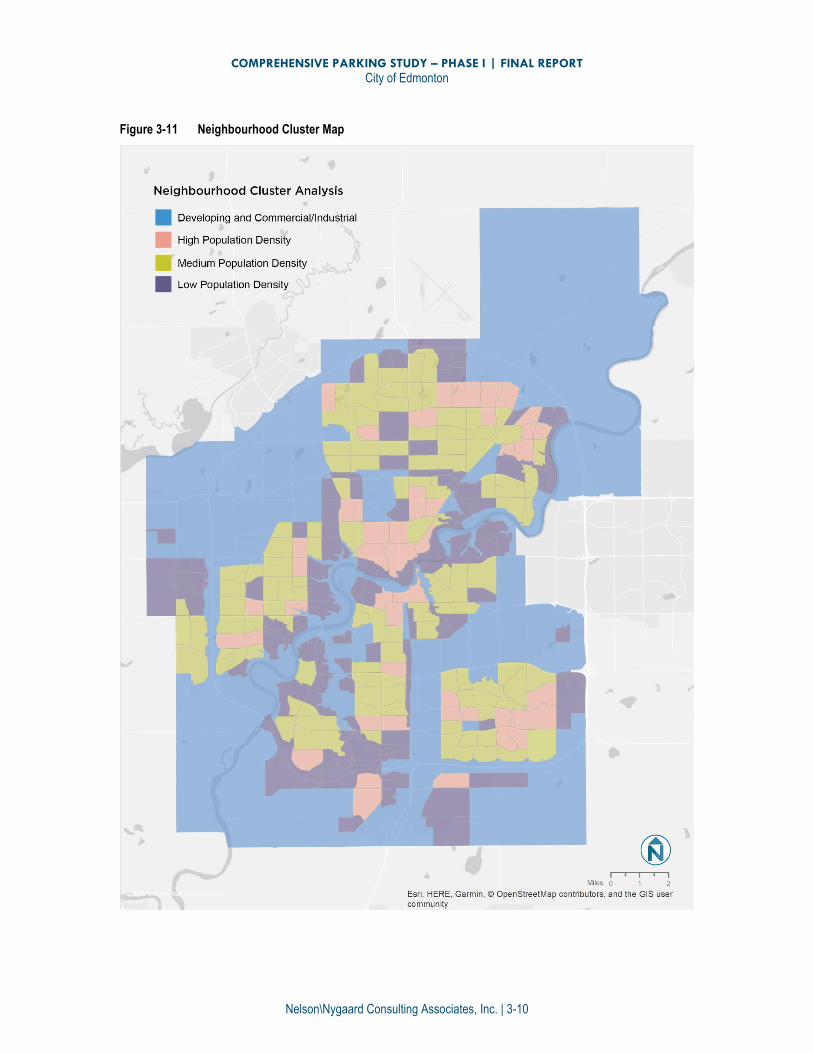
team and the summary statistics of each cluster detailed in Figure 3-10. The neighbourhoods are
illustrated geographically in Figure 3-11.
The names developed for the clusters are purposefully imprecise – the groupings are coarse and
neighbourhoods still vary widely within the clusters on other characteristics.
As discussed in Chapter 2, the aim of the K-means cluster analysis was to detect groupings of
similar neighbourhoods (based on the values of the variables considered) through an empirical
approach (as opposed to the City-developed classification). The results indicate that the primary
factors differentiating neighbourhoods are population density and Walk Score, and only Walk
COMPREHENSIVE PARKING STUDY – PHASE I | FINAL REPORT
City of Edmonton
Nelson\Nygaard Consulting Associates, Inc. | 3-8
Score is correlated (albeit weakly) with parking utilization. This result lends credence to the
conclusion that developing transportation policy for neighbourhood groups based on these
variables would be inappropriate. Furthermore, prescribing parking regulations to
neighbourhoods within these groups (as well as the City-defined groups, which have even less
rigorous basis) is also misguided.
Figure 3-9 Visualization of Neighbourhood Clusters
The K-Means clustering scheme has the benefit of being based on statistically rigorous
consideration of descriptive data, but results in neighbourhood groupings that are not
geographically contiguous, which may be a drawback for making simple
comparisons. The cluster-defined grouping is more consistent with a generally one-directional
trend in the predictive variables (when compared to a summary of the city-defined grouping in
Figure 3-12). The cluster-defined grouping increases in the same direction for all the independent
variables along with increasing density.
Both neighbourhood groupings were considered when examining utilization and supply and
demand ratios.
COMPREHENSIVE PARKING STUDY – PHASE I | FINAL REPORT
City of Edmonton
Nelson\Nygaard Consulting Associates, Inc. | 3-9
Figure 3-10 Cluster Summary Statistics
Neighbourhood Group
# N
eig
hb
ou
rho
od
s
# P
arki
ng
Dat
a S
ites
Are
a (k
m2 )
Po
pu
lati
on
Po
pu
lati
on
Den
sity
(pp
l./km
2 )
Em
plo
ymen
t (j
ob
s)
Em
plo
ymen
t D
ensi
ty
(jo
bs/
km2 )
Po
pu
lati
on
/
Em
plo
ymen
t
(res
iden
ts p
er jo
b)
Dri
ve A
lon
e R
ate
amo
ng
Res
iden
ts
Wal
k S
core
Tra
nsi
t S
core
Val
ue
Den
sity
($/
m2 )
Developing and
Commercial/
Industrial
131 81 367.2 95,091 259 98,587 268 0.96 74.9% 10 27 $101
Low Population
Density 101 62 116.1 192,763 1,660 91,139 785 2.12 75.0% 33 41 $374
Medium
Population Density 116 107 134.5 388,698 2,890 122,948 914 3.16 74.6% 47 49 $437
High Population
Density 48 88 58.1 250,426 4,311 123,756 2,130 2.02 66.4% 52 50 $750
Total 396 338 675.9 926,979 1,371 436,430 646 2.12 73.4% 25 36 $271
COMPREHENSIVE PARKING STUDY – PHASE I | FINAL REPORT
City of Edmonton
Nelson\Nygaard Consulting Associates, Inc. | 3-10
Figure 3-11 Neighbourhood Cluster Map
COMPREHENSIVE PARKING STUDY – PHASE I | FINAL REPORT
City of Edmonton
Nelson\Nygaard Consulting Associates, Inc. | 3-11
City Classification
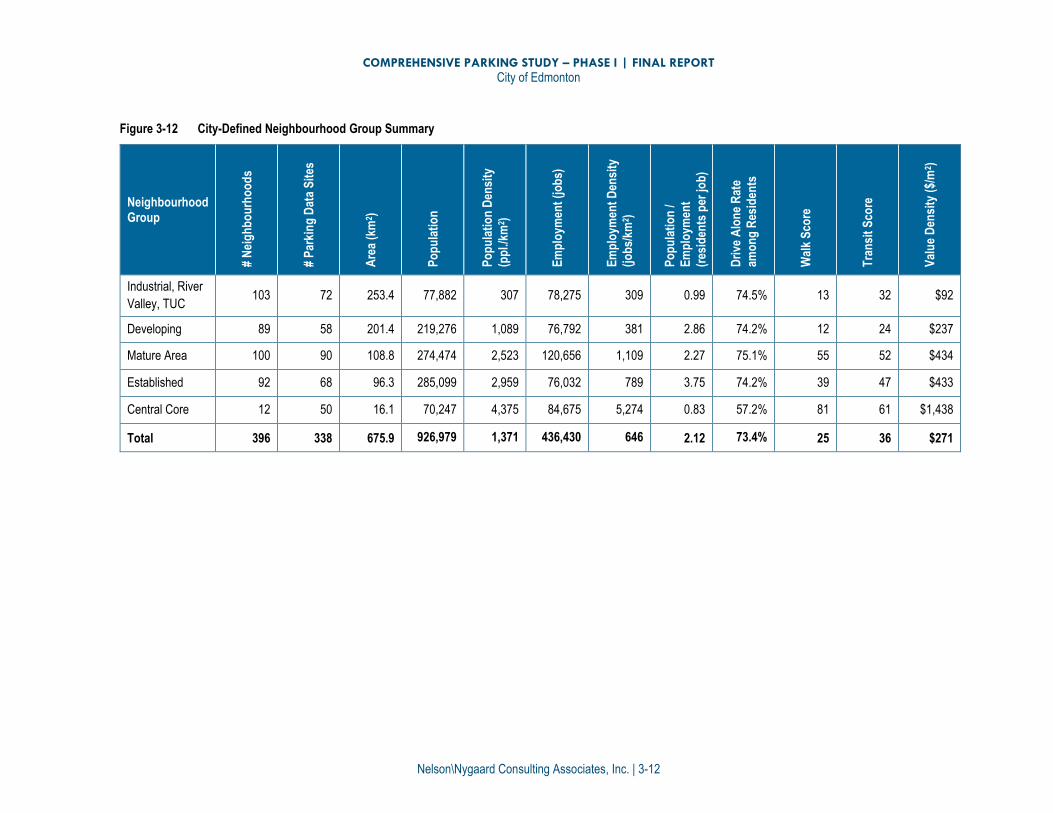
A map of the city-defined neighbourhood classification is presented in the previous chapter
(Figure 2-3). Summary statistics of the variables considered by city-defined neighbourhood
groups are presented in Figure 3-12.
Both neighbourhood groupings were considered when examining utilization and supply and
demand ratios.
COMPREHENSIVE PARKING STUDY – PHASE I | FINAL REPORT
City of Edmonton
Nelson\Nygaard Consulting Associates, Inc. | 3-12
Figure 3-12 City-Defined Neighbourhood Group Summary
Neighbourhood Group
# N
eig
hb
ou
rho
od
s
# P
arki
ng
Dat
a S
ites
Are
a (k
m2 )
Po
pu
lati
on
Po
pu
lati
on
Den
sity
(pp
l./km
2 )
Em
plo
ymen
t (j
ob
s)
Em
plo
ymen
t D
ensi
ty
(jo
bs/
km2 )
Po
pu
lati
on
/
Em
plo
ymen
t
(res
iden
ts p
er jo
b)
Dri
ve A
lon
e R
ate
amo
ng
Res
iden
ts
Wal
k S
core
Tra
nsi
t S
core
Val
ue
Den
sity
($/
m2 )
Industrial, River
Valley, TUC 103 72 253.4 77,882 307 78,275 309 0.99 74.5% 13 32 $92
Developing 89 58 201.4 219,276 1,089 76,792 381 2.86 74.2% 12 24 $237
Mature Area 100 90 108.8 274,474 2,523 120,656 1,109 2.27 75.1% 55 52 $434
Established 92 68 96.3 285,099 2,959 76,032 789 3.75 74.2% 39 47 $433
Central Core 12 50 16.1 70,247 4,375 84,675 5,274 0.83 57.2% 81 61 $1,438
Total 396 338 675.9 926,979 1,371 436,430 646 2.12 73.4% 25 36 $271
COMPREHENSIVE PARKING STUDY – PHASE I | FINAL REPORT
City of Edmonton
Nelson\Nygaard Consulting Associates, Inc. | 3-13
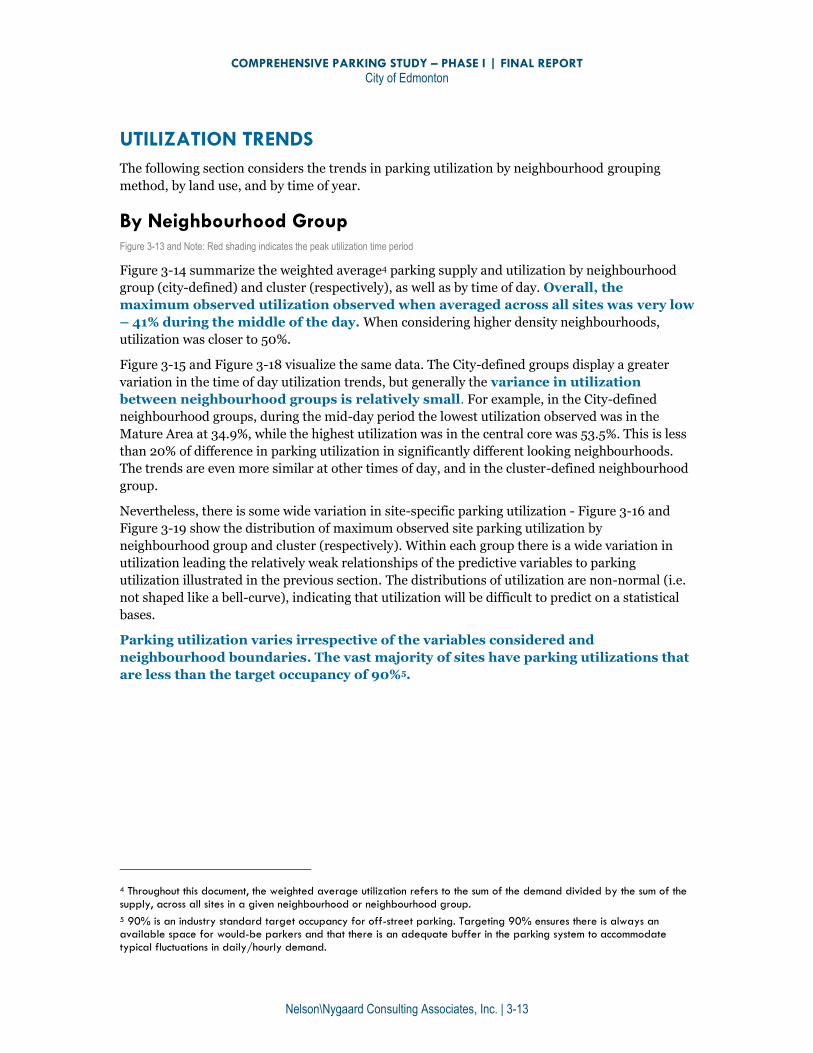
UTILIZATION TRENDS
The following section considers the trends in parking utilization by neighbourhood grouping
method, by land use, and by time of year.
By Neighbourhood Group Figure 3-13 and Note: Red shading indicates the peak utilization time period
Figure 3-14 summarize the weighted average4 parking supply and utilization by neighbourhood
group (city-defined) and cluster (respectively), as well as by time of day. Overall, the
maximum observed utilization observed when averaged across all sites was very low
– 41% during the middle of the day. When considering higher density neighbourhoods,
utilization was closer to 50%.
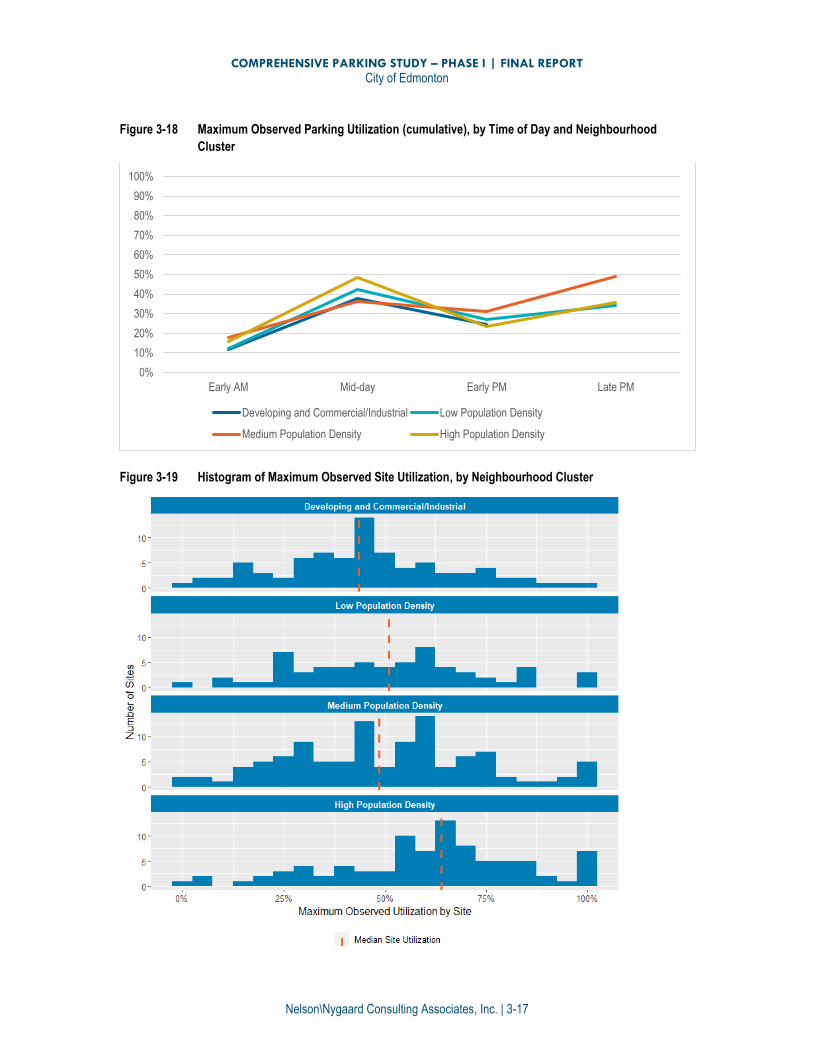
Figure 3-15 and Figure 3-18 visualize the same data. The City-defined groups display a greater
variation in the time of day utilization trends, but generally the variance in utilization
between neighbourhood groups is relatively small. For example, in the City-defined
neighbourhood groups, during the mid-day period the lowest utilization observed was in the
Mature Area at 34.9%, while the highest utilization was in the central core was 53.5%. This is less
than 20% of difference in parking utilization in significantly different looking neighbourhoods.
The trends are even more similar at other times of day, and in the cluster-defined neighbourhood
group.
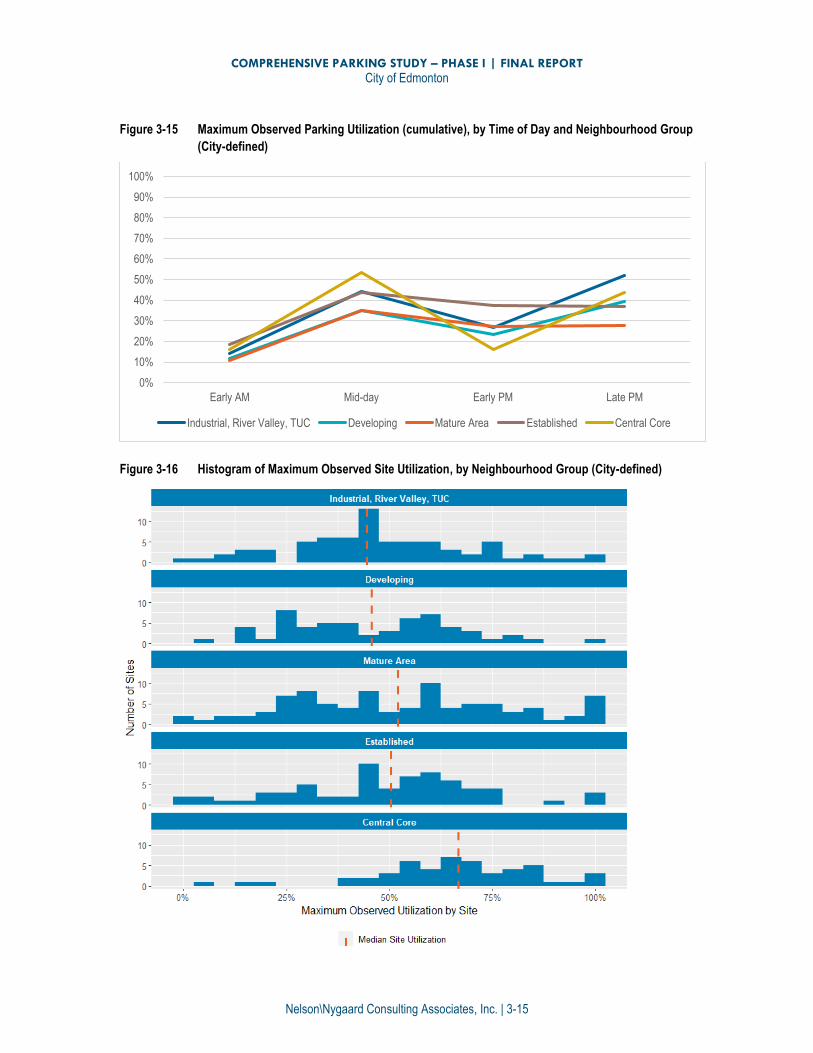
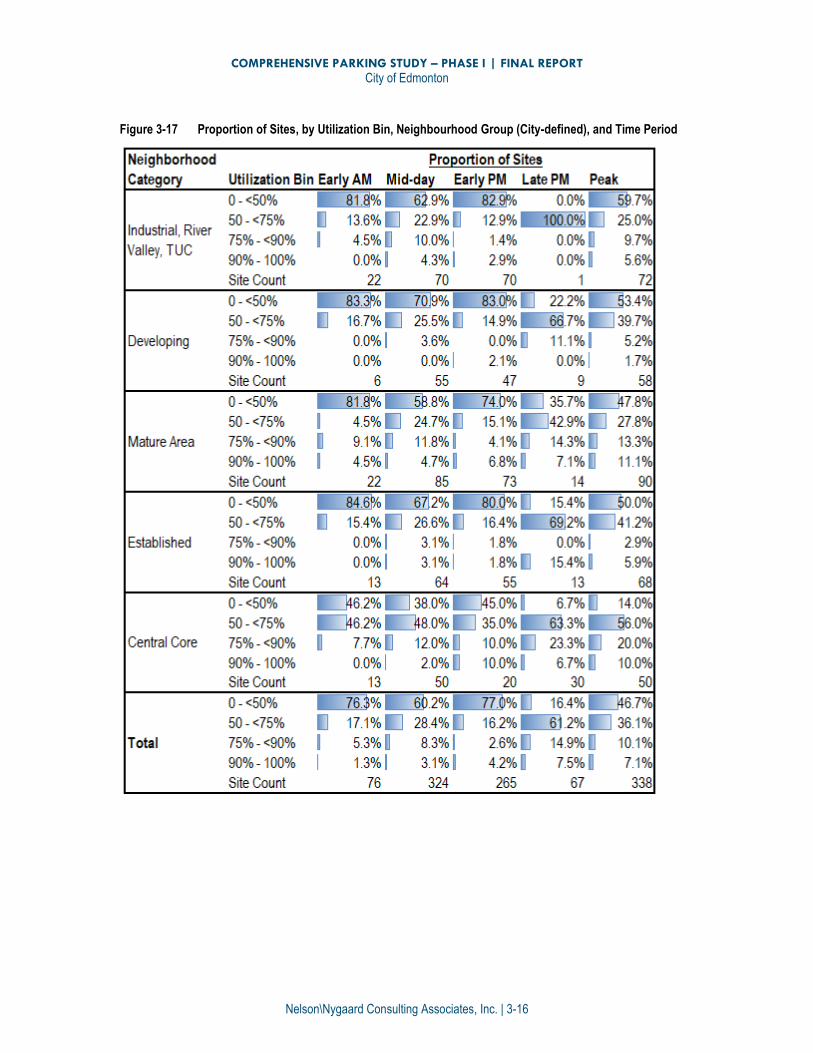
Nevertheless, there is some wide variation in site-specific parking utilization - Figure 3-16 and
Figure 3-19 show the distribution of maximum observed site parking utilization by
neighbourhood group and cluster (respectively). Within each group there is a wide variation in
utilization leading the relatively weak relationships of the predictive variables to parking
utilization illustrated in the previous section. The distributions of utilization are non-normal (i.e.
not shaped like a bell-curve), indicating that utilization will be difficult to predict on a statistical
bases.
Parking utilization varies irrespective of the variables considered and
neighbourhood boundaries. The vast majority of sites have parking utilizations that
are less than the target occupancy of 90%5.
4 Throughout this document, the weighted average utilization refers to the sum of the demand divided by the sum of the supply, across all sites in a given neighbourhood or neighbourhood group.
5 90% is an industry standard target occupancy for off-street parking. Targeting 90% ensures there is always an available space for would-be parkers and that there is an adequate buffer in the parking system to accommodate typical fluctuations in daily/hourly demand.
COMPREHENSIVE PARKING STUDY – PHASE I | FINAL REPORT
City of Edmonton
Nelson\Nygaard Consulting Associates, Inc. | 3-14
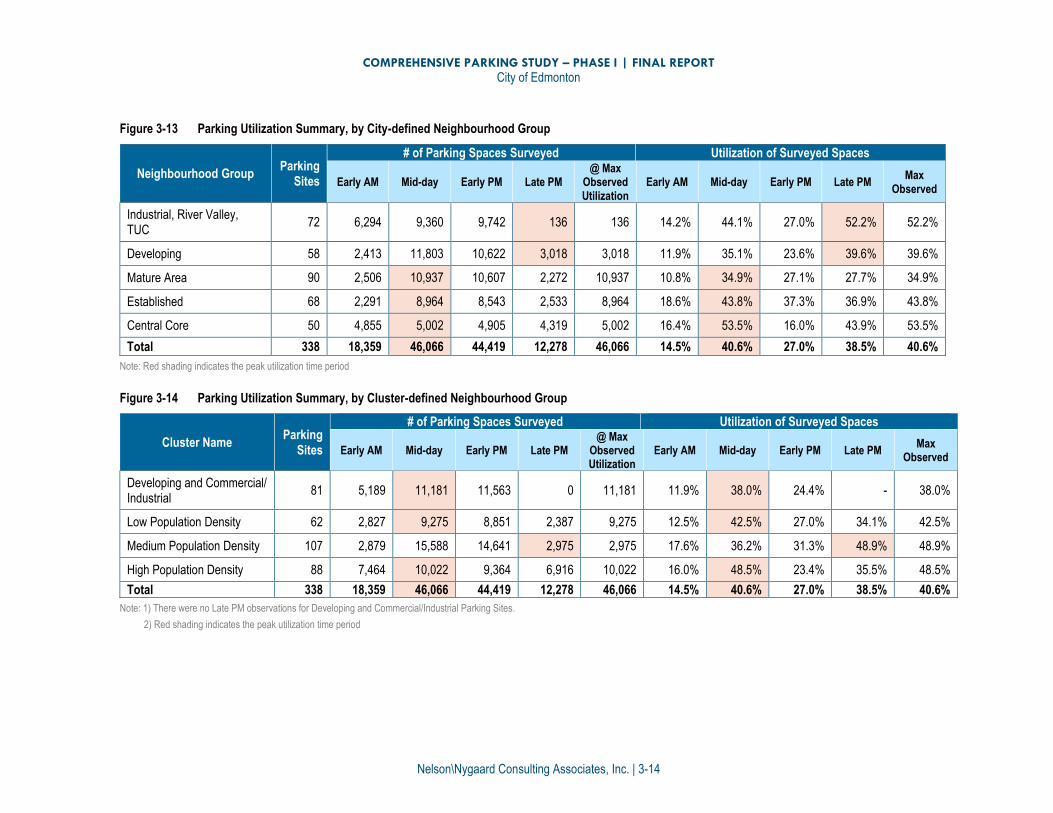
Figure 3-13 Parking Utilization Summary, by City-defined Neighbourhood Group
Neighbourhood Group Parking
Sites
# of Parking Spaces Surveyed Utilization of Surveyed Spaces
Early AM Mid-day Early PM Late PM @ Max
Observed Utilization
Early AM Mid-day Early PM Late PM Max
Observed
Industrial, River Valley, TUC
72 6,294 9,360 9,742 136 136 14.2% 44.1% 27.0% 52.2% 52.2%
Developing 58 2,413 11,803 10,622 3,018 3,018 11.9% 35.1% 23.6% 39.6% 39.6%
Mature Area 90 2,506 10,937 10,607 2,272 10,937 10.8% 34.9% 27.1% 27.7% 34.9%
Established 68 2,291 8,964 8,543 2,533 8,964 18.6% 43.8% 37.3% 36.9% 43.8%
Central Core 50 4,855 5,002 4,905 4,319 5,002 16.4% 53.5% 16.0% 43.9% 53.5%
Total 338 18,359 46,066 44,419 12,278 46,066 14.5% 40.6% 27.0% 38.5% 40.6%
Note: Red shading indicates the peak utilization time period
Figure 3-14 Parking Utilization Summary, by Cluster-defined Neighbourhood Group
Cluster Name Parking
Sites
# of Parking Spaces Surveyed Utilization of Surveyed Spaces
Early AM Mid-day Early PM Late PM @ Max
Observed Utilization
Early AM Mid-day Early PM Late PM Max
Observed
Developing and Commercial/ Industrial
81 5,189 11,181 11,563 0 11,181 11.9% 38.0% 24.4% - 38.0%
Low Population Density 62 2,827 9,275 8,851 2,387 9,275 12.5% 42.5% 27.0% 34.1% 42.5%
Medium Population Density 107 2,879 15,588 14,641 2,975 2,975 17.6% 36.2% 31.3% 48.9% 48.9%
High Population Density 88 7,464 10,022 9,364 6,916 10,022 16.0% 48.5% 23.4% 35.5% 48.5%
Total 338 18,359 46,066 44,419 12,278 46,066 14.5% 40.6% 27.0% 38.5% 40.6%
Note: 1) There were no Late PM observations for Developing and Commercial/Industrial Parking Sites.
2) Red shading indicates the peak utilization time period
COMPREHENSIVE PARKING STUDY – PHASE I | FINAL REPORT
City of Edmonton
Nelson\Nygaard Consulting Associates, Inc. | 3-15
Figure 3-15 Maximum Observed Parking Utilization (cumulative), by Time of Day and Neighbourhood Group
(City-defined)
Figure 3-16 Histogram of Maximum Observed Site Utilization, by Neighbourhood Group (City-defined)
0%
10%
20%
30%
40%
50%
60%
70%
80%
90%
100%
Early AM Mid-day Early PM Late PM
Industrial, River Valley, TUC Developing Mature Area Established Central Core
COMPREHENSIVE PARKING STUDY – PHASE I | FINAL REPORT
City of Edmonton
Nelson\Nygaard Consulting Associates, Inc. | 3-16
Figure 3-17 Proportion of Sites, by Utilization Bin, Neighbourhood Group (City-defined), and Time Period
COMPREHENSIVE PARKING STUDY – PHASE I | FINAL REPORT
City of Edmonton
Nelson\Nygaard Consulting Associates, Inc. | 3-17
Figure 3-18 Maximum Observed Parking Utilization (cumulative), by Time of Day and Neighbourhood
Cluster
Figure 3-19 Histogram of Maximum Observed Site Utilization, by Neighbourhood Cluster
0%
10%
20%
30%
40%
50%
60%
70%
80%
90%
100%
Early AM Mid-day Early PM Late PM
Developing and Commercial/Industrial Low Population Density
Medium Population Density High Population Density
COMPREHENSIVE PARKING STUDY – PHASE I | FINAL REPORT
City of Edmonton
Nelson\Nygaard Consulting Associates, Inc. | 3-18
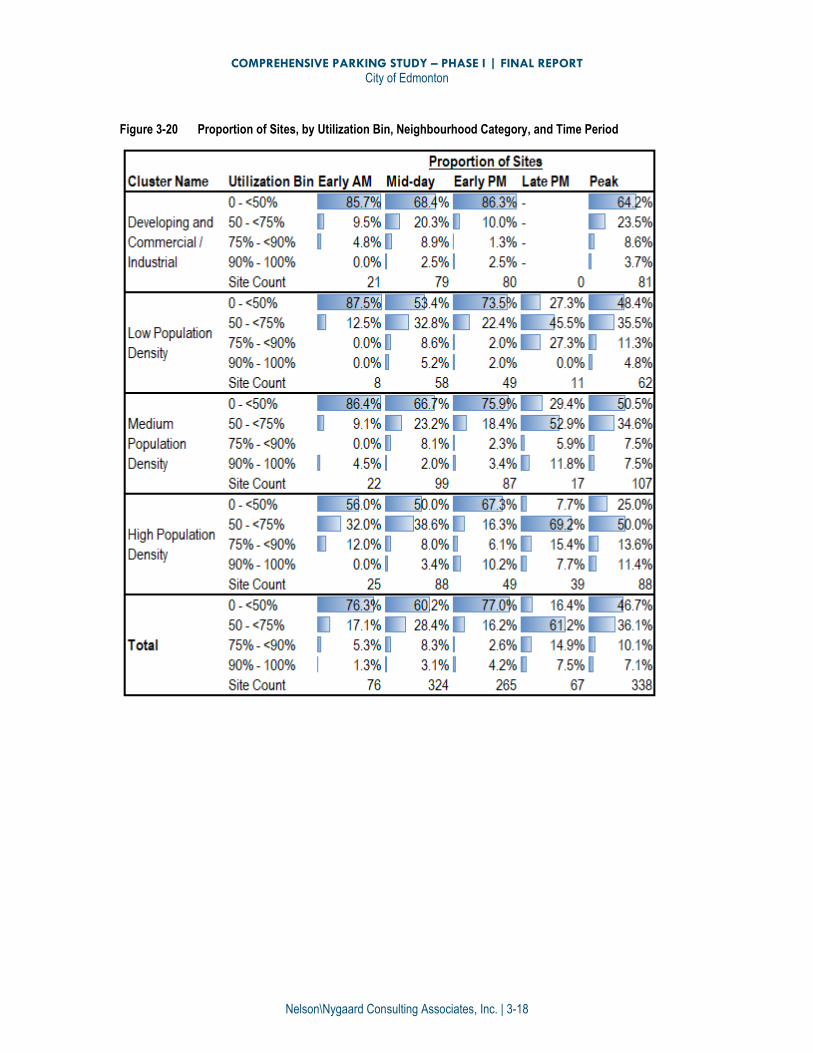
Figure 3-20 Proportion of Sites, by Utilization Bin, Neighbourhood Category, and Time Period
COMPREHENSIVE PARKING STUDY – PHASE I | FINAL REPORT
City of Edmonton
Nelson\Nygaard Consulting Associates, Inc. | 3-19
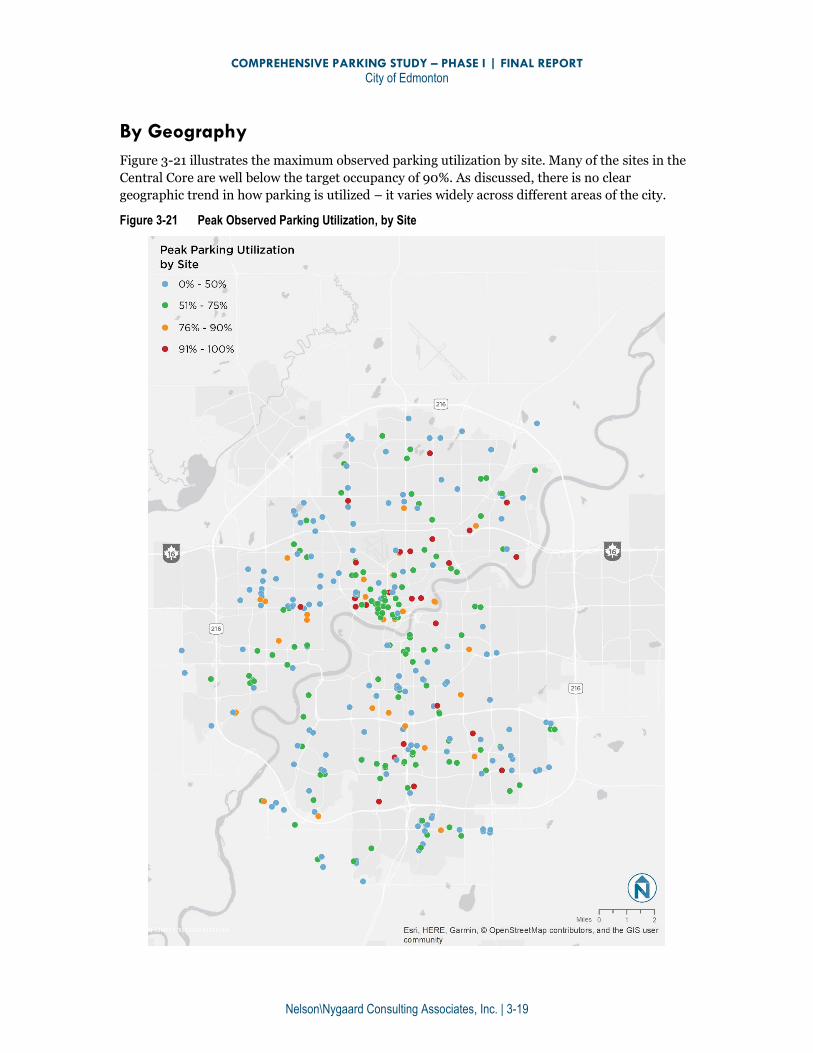
By Geography
Figure 3-21 illustrates the maximum observed parking utilization by site. Many of the sites in the
Central Core are well below the target occupancy of 90%. As discussed, there is no clear
geographic trend in how parking is utilized – it varies widely across different areas of the city.
Figure 3-21 Peak Observed Parking Utilization, by Site
COMPREHENSIVE PARKING STUDY – PHASE I | FINAL REPORT
City of Edmonton
Nelson\Nygaard Consulting Associates, Inc. | 3-20
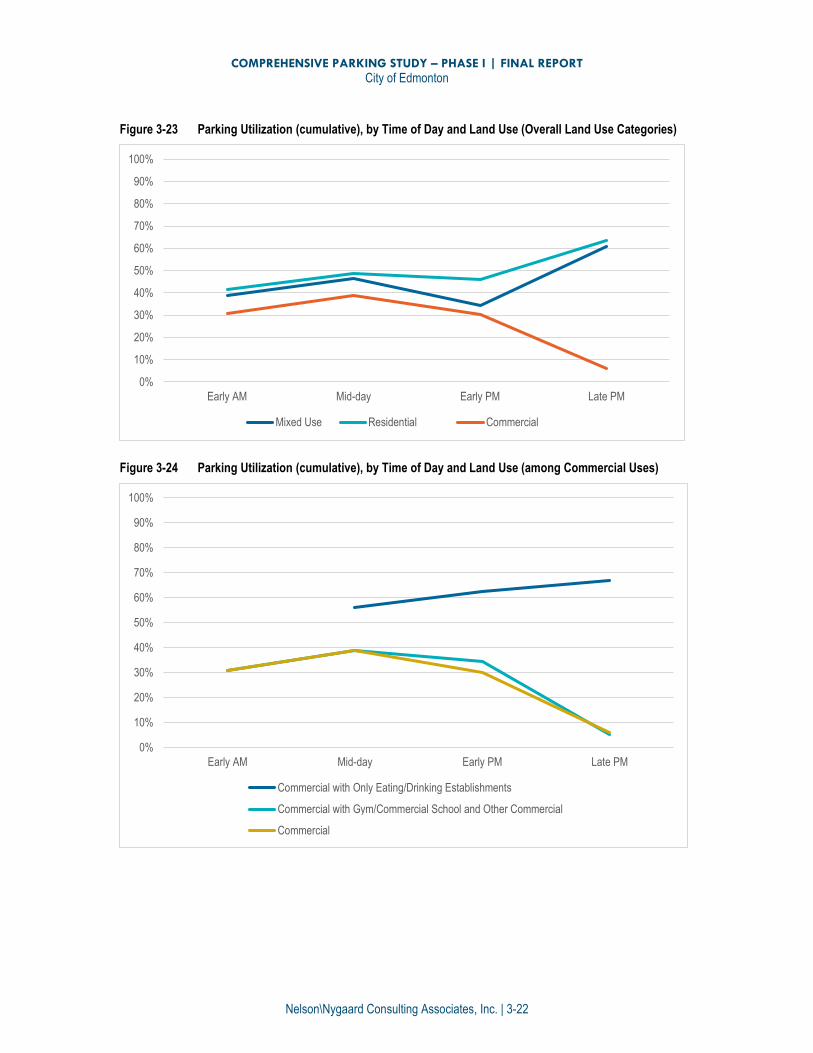
By Land Use
The assessment also included a series of land use based analyses, organized by the specific
categories identified in Figure 3-22. The land uses are broken down first into three broad groups
– commercial, residential, and mixed use. Utilization by time of day is illustrated in Figure 3-21
through 3-23.
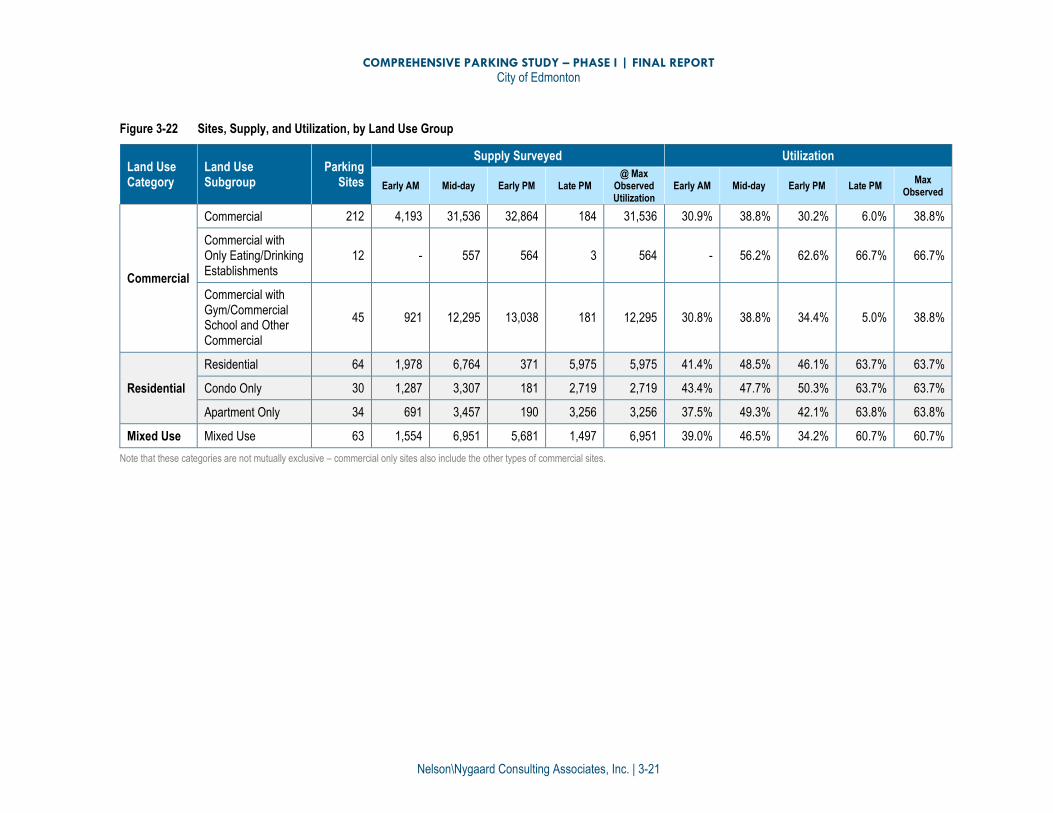
Commercial land uses comprise 212 sites and over 31,000 parking spaces within the dataset. At
maximum observed usage (observed), only 39% of those spaces are being used, meaning
that on average over 19,000 parking spaces in commercial sites observed are open
(or 96 spaces for the average site). Commercial uses as a whole tend to peak in the mid-day
period. Within the commercial category, there are four sub-types of land use considered:
Commercial with only eating/drinking establishments. On the 12 sites with only
eating/drinking establishments, maximum observed occupancy is higher than commercial
uses as a whole at 67%. These uses peak in the Late PM period.
Commercial with gym/commercial school and other commercial. On the 45 sites
with gyms or commercial schools, maximum observed occupancy is identical to other
commercials as a whole at 39%. These uses peak in the mid-day period.
Residential land uses comprise 64 sites and over 6,000 spaces within the dataset. At maximum
observed usage, 64% of parking is occupied, meaning that on average over 2,000
spaces are open (or 38 spaces for the average site). Residential uses tended to peak in the
late PM period (overnight). Within residential, there are three sub-types of land uses considered:
Condo only. On the 30 sites with only condos, maximum observed occupancy is at 64%
(identical to residential uses as a whole). These uses tended to peak in the late PM period
(overnight).
Apartment only. On the 34 sites with only apartments, maximum observed occupancy is at
64% (identical to residential uses as a whole). These uses tended to peak in the late PM period
(overnight).
Mixed land uses (with both residential and commercial) comprise 63 sites and nearly 7,000
spaces within the dataset. At maximum observed occupancy 61% of parking is occupied,
meaning that on average, over 2,500 spaces are open (or 45 spaces for the average
site).
COMPREHENSIVE PARKING STUDY – PHASE I | FINAL REPORT
City of Edmonton
Nelson\Nygaard Consulting Associates, Inc. | 3-21
Figure 3-22 Sites, Supply, and Utilization, by Land Use Group
Land Use Category
Land Use Subgroup
Parking Sites
Supply Surveyed Utilization
Early AM Mid-day Early PM Late PM @ Max
Observed Utilization
Early AM Mid-day Early PM Late PM Max
Observed
Commercial
Commercial 212 4,193 31,536 32,864 184 31,536 30.9% 38.8% 30.2% 6.0% 38.8%
Commercial with Only Eating/Drinking Establishments
12 - 557 564 3 564 - 56.2% 62.6% 66.7% 66.7%
Commercial with Gym/Commercial School and Other Commercial
45 921 12,295 13,038 181 12,295 30.8% 38.8% 34.4% 5.0% 38.8%
Residential
Residential 64 1,978 6,764 371 5,975 5,975 41.4% 48.5% 46.1% 63.7% 63.7%
Condo Only 30 1,287 3,307 181 2,719 2,719 43.4% 47.7% 50.3% 63.7% 63.7%
Apartment Only 34 691 3,457 190 3,256 3,256 37.5% 49.3% 42.1% 63.8% 63.8%
Mixed Use Mixed Use 63 1,554 6,951 5,681 1,497 6,951 39.0% 46.5% 34.2% 60.7% 60.7%
Note that these categories are not mutually exclusive – commercial only sites also include the other types of commercial sites.
COMPREHENSIVE PARKING STUDY – PHASE I | FINAL REPORT
City of Edmonton
Nelson\Nygaard Consulting Associates, Inc. | 3-22
Figure 3-23 Parking Utilization (cumulative), by Time of Day and Land Use (Overall Land Use Categories)
Figure 3-24 Parking Utilization (cumulative), by Time of Day and Land Use (among Commercial Uses)
0%
10%
20%
30%
40%
50%
60%
70%
80%
90%
100%
Early AM Mid-day Early PM Late PM
Mixed Use Residential Only Commercial Only
0%
10%
20%
30%
40%
50%
60%
70%
80%
90%
100%
Early AM Mid-day Early PM Late PM
Commercial with Only Eating/Drinking Establishments
Commercial with Gym/Commercial School and Other Commercial
Commercial Only
COMPREHENSIVE PARKING STUDY – PHASE I | FINAL REPORT
City of Edmonton
Nelson\Nygaard Consulting Associates, Inc. | 3-23
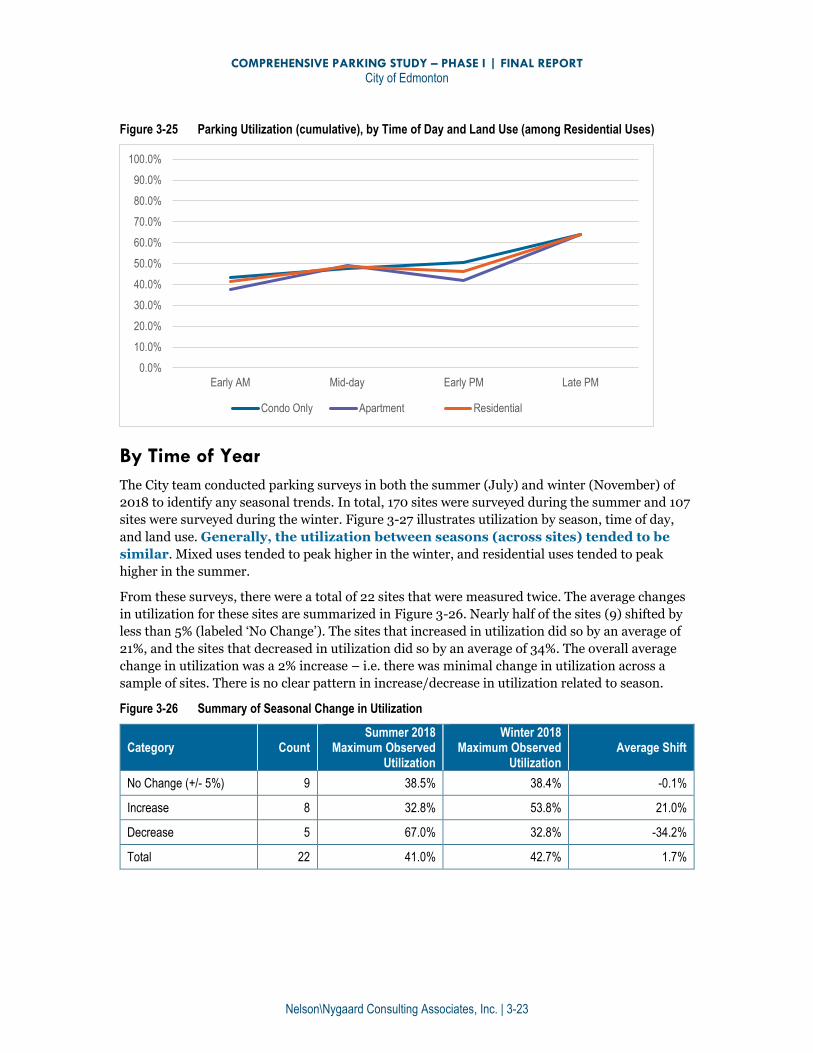
Figure 3-25 Parking Utilization (cumulative), by Time of Day and Land Use (among Residential Uses)
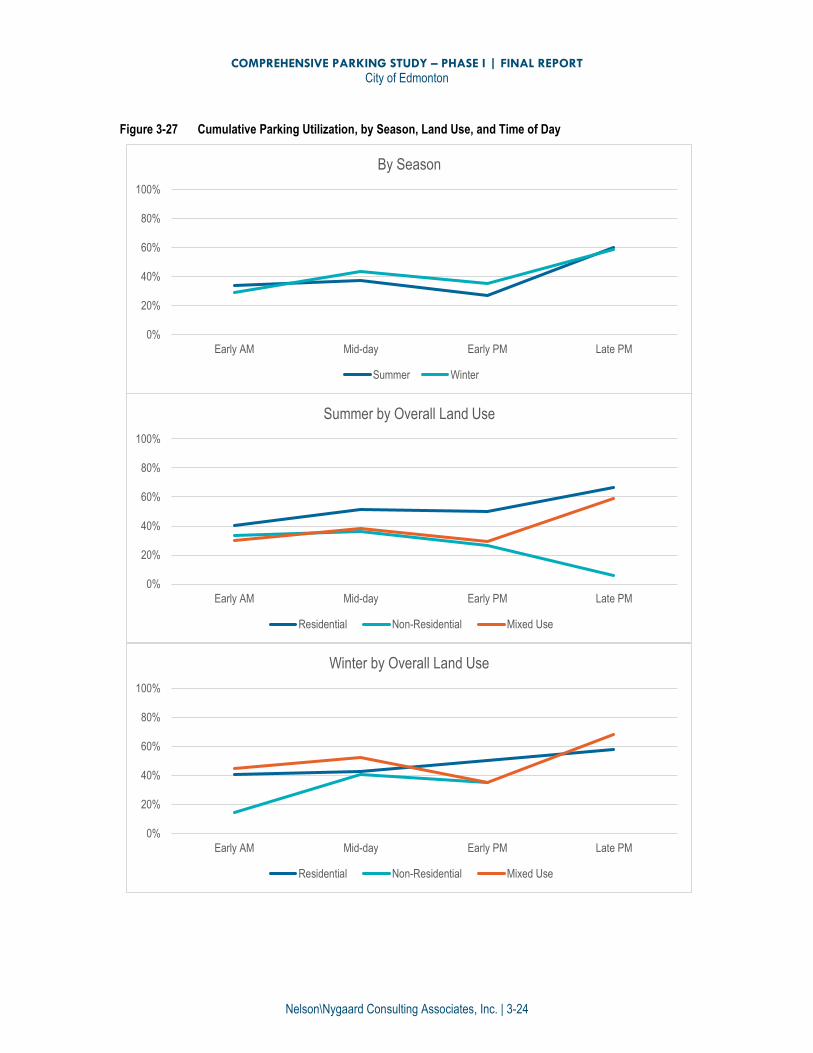
By Time of Year
The City team conducted parking surveys in both the summer (July) and winter (November) of
2018 to identify any seasonal trends. In total, 170 sites were surveyed during the summer and 107
sites were surveyed during the winter. Figure 3-27 illustrates utilization by season, time of day,
and land use. Generally, the utilization between seasons (across sites) tended to be
similar. Mixed uses tended to peak higher in the winter, and residential uses tended to peak
higher in the summer.
From these surveys, there were a total of 22 sites that were measured twice. The average changes
in utilization for these sites are summarized in Figure 3-26. Nearly half of the sites (9) shifted by
less than 5% (labeled ‘No Change’). The sites that increased in utilization did so by an average of
21%, and the sites that decreased in utilization did so by an average of 34%. The overall average
change in utilization was a 2% increase – i.e. there was minimal change in utilization across a
sample of sites. There is no clear pattern in increase/decrease in utilization related to season.
Figure 3-26 Summary of Seasonal Change in Utilization
Category Count Summer 2018
Maximum Observed Utilization
Winter 2018 Maximum Observed
Utilization Average Shift
No Change (+/- 5%) 9 38.5% 38.4% -0.1%
Increase 8 32.8% 53.8% 21.0%
Decrease 5 67.0% 32.8% -34.2%
Total 22 41.0% 42.7% 1.7%
0.0%
10.0%
20.0%
30.0%
40.0%
50.0%
60.0%
70.0%
80.0%
90.0%
100.0%
Early AM Mid-day Early PM Late PM
Condo Only Apartment Only Residential Only
COMPREHENSIVE PARKING STUDY – PHASE I | FINAL REPORT
City of Edmonton
Nelson\Nygaard Consulting Associates, Inc. | 3-24
Figure 3-27 Cumulative Parking Utilization, by Season, Land Use, and Time of Day
0%
20%
40%
60%
80%
100%
Early AM Mid-day Early PM Late PM
By Season
Summer Winter
0%
20%
40%
60%
80%
100%
Early AM Mid-day Early PM Late PM
Summer by Overall Land Use
Residential Non-Residential Mixed Use
0%
20%
40%
60%
80%
100%
Early AM Mid-day Early PM Late PM
Winter by Overall Land Use
Residential Non-Residential Mixed Use
COMPREHENSIVE PARKING STUDY – PHASE I | FINAL REPORT
City of Edmonton
Nelson\Nygaard Consulting Associates, Inc. | 3-25
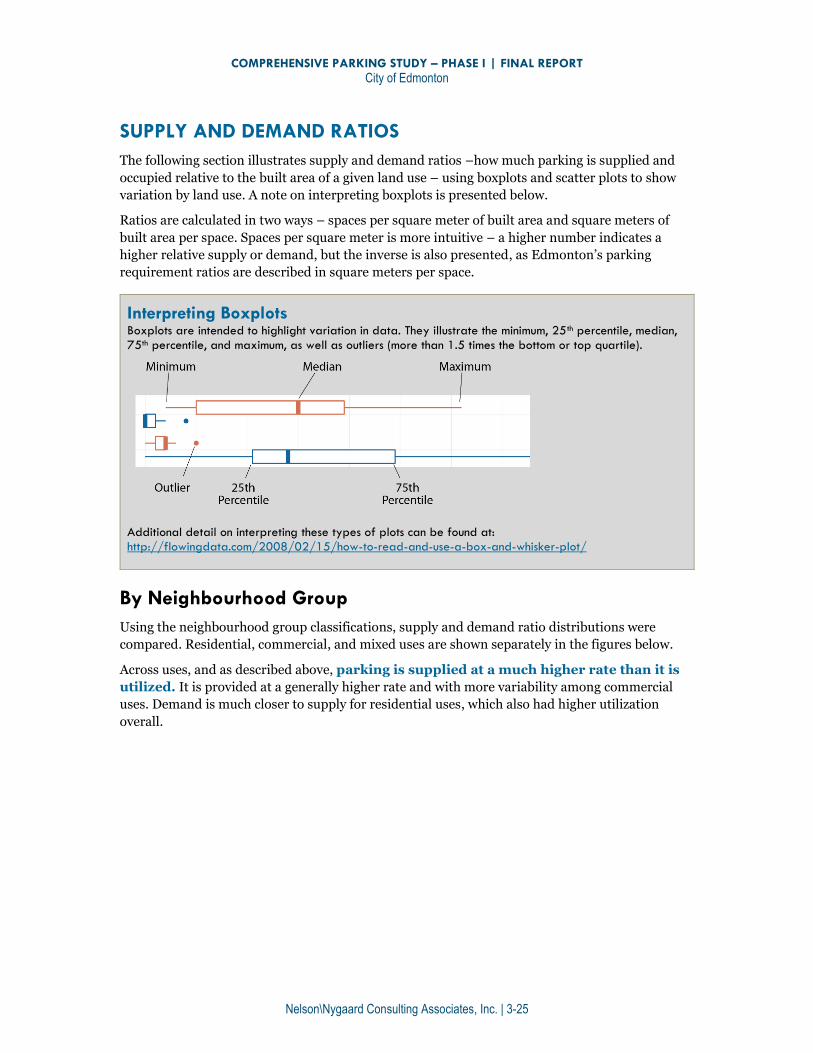
SUPPLY AND DEMAND RATIOS
The following section illustrates supply and demand ratios –how much parking is supplied and
occupied relative to the built area of a given land use – using boxplots and scatter plots to show
variation by land use. A note on interpreting boxplots is presented below.
Ratios are calculated in two ways – spaces per square meter of built area and square meters of
built area per space. Spaces per square meter is more intuitive – a higher number indicates a
higher relative supply or demand, but the inverse is also presented, as Edmonton’s parking
requirement ratios are described in square meters per space.
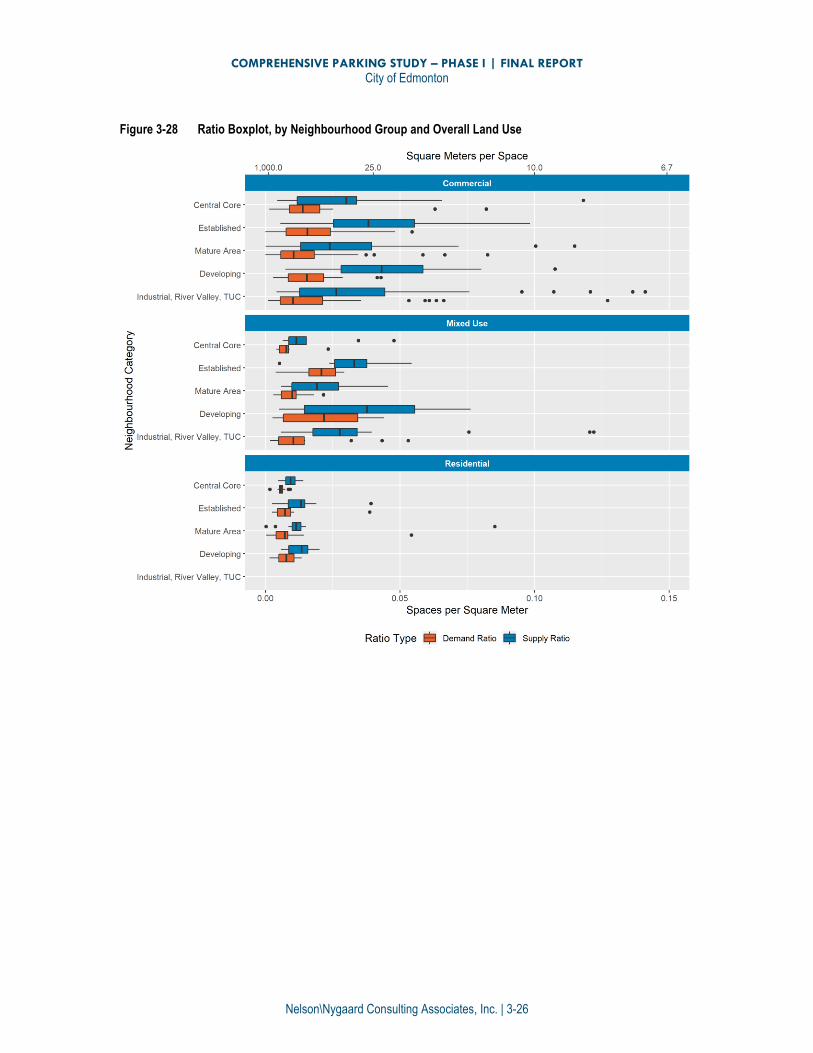
By Neighbourhood Group
Using the neighbourhood group classifications, supply and demand ratio distributions were
compared. Residential, commercial, and mixed uses are shown separately in the figures below.
Across uses, and as described above, parking is supplied at a much higher rate than it is
utilized. It is provided at a generally higher rate and with more variability among commercial
uses. Demand is much closer to supply for residential uses, which also had higher utilization
overall.
Interpreting Boxplots Boxplots are intended to highlight variation in data. They illustrate the minimum, 25th percentile, median,
75th percentile, and maximum, as well as outliers (more than 1.5 times the bottom or top quartile).
Additional detail on interpreting these types of plots can be found at: http://flowingdata.com/2008/02/15/how-to-read-and-use-a-box-and-whisker-plot/
COMPREHENSIVE PARKING STUDY – PHASE I | FINAL REPORT
City of Edmonton
Nelson\Nygaard Consulting Associates, Inc. | 3-26
Figure 3-28 Ratio Boxplot, by Neighbourhood Group and Overall Land Use
COMPREHENSIVE PARKING STUDY – PHASE I | FINAL REPORT
City of Edmonton
Nelson\Nygaard Consulting Associates, Inc. | 3-27
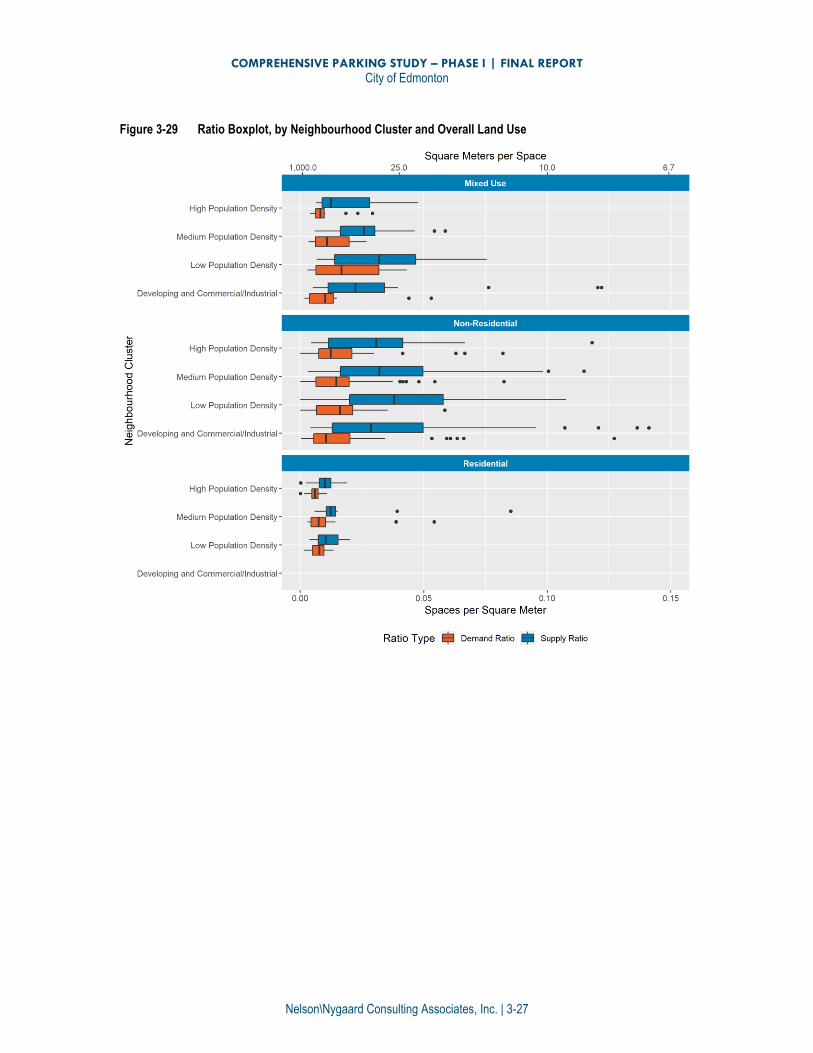
Figure 3-29 Ratio Boxplot, by Neighbourhood Cluster and Overall Land Use

COMPREHENSIVE PARKING STUDY – PHASE I | FINAL REPORT
City of Edmonton
Nelson\Nygaard Consulting Associates, Inc. | 3-28
By Land Use
The land use categories were also used to analyze supply and demand ratios by certain land use
categories. Scatterplots are presented to illustrate the relationship between supply and demand
ratios. Diagonal envelopes illustrating utilization are show for reference.
Nelson\Nygaard Consulting Associates, Inc. | 3-29
COMPREHENSIVE PARKING STUDY – PHASE I | FINAL REPORT
City of Edmonton
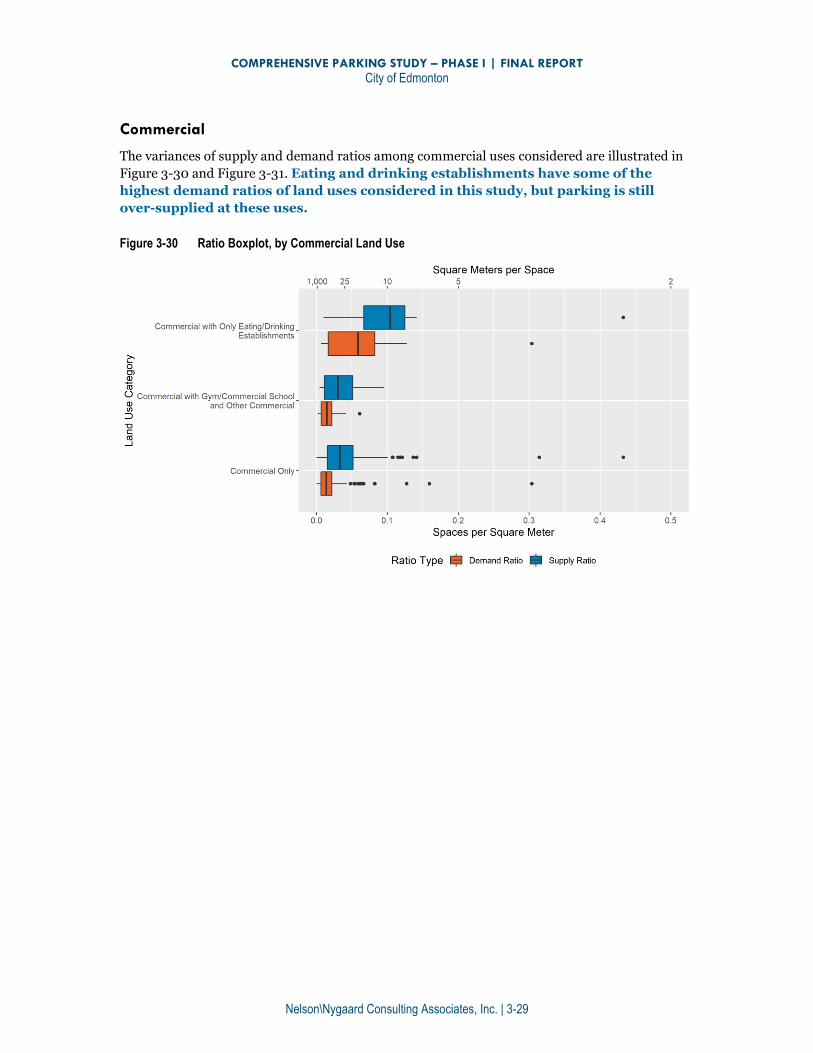
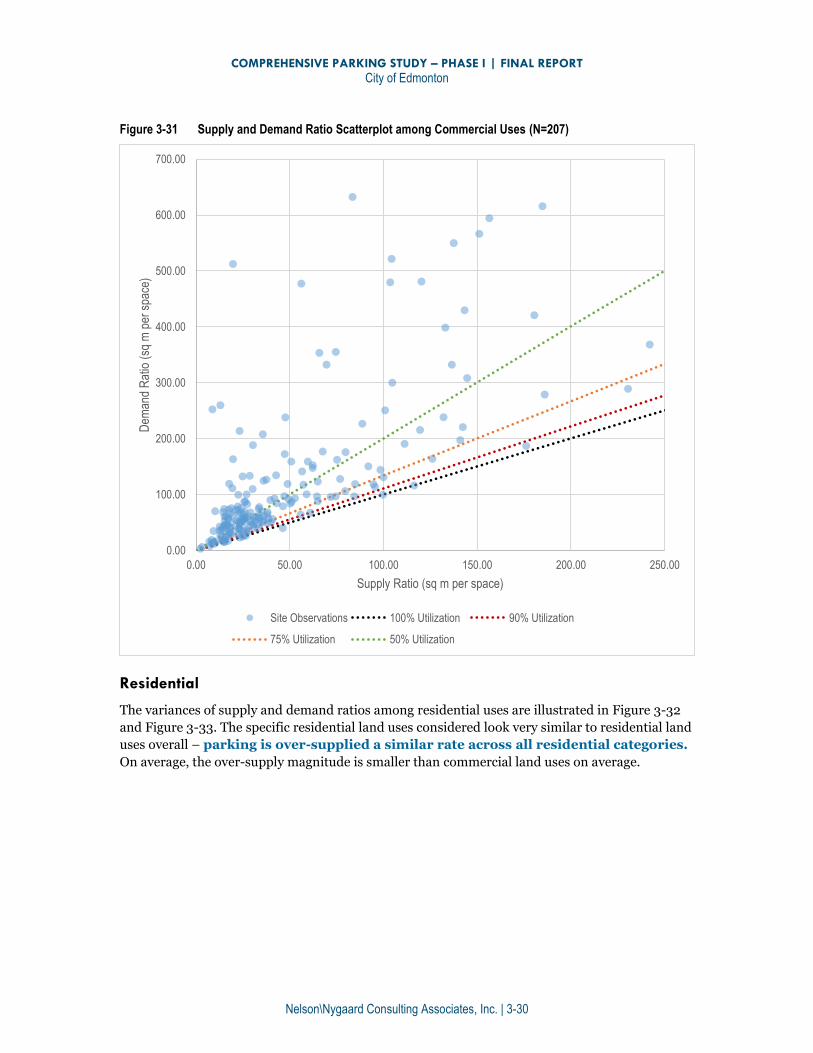
Commercial
The variances of supply and demand ratios among commercial uses considered are illustrated in
Figure 3-30 and Figure 3-31. Eating and drinking establishments have some of the
highest demand ratios of land uses considered in this study, but parking is still
over-supplied at these uses.
Figure 3-30 Ratio Boxplot, by Commercial Land Use
annste2
Cross-Out
COMPREHENSIVE PARKING STUDY – PHASE I | FINAL REPORT
City of Edmonton
Nelson\Nygaard Consulting Associates, Inc. | 3-30
Figure 3-31 Supply and Demand Ratio Scatterplot among Commercial Uses (N=207)
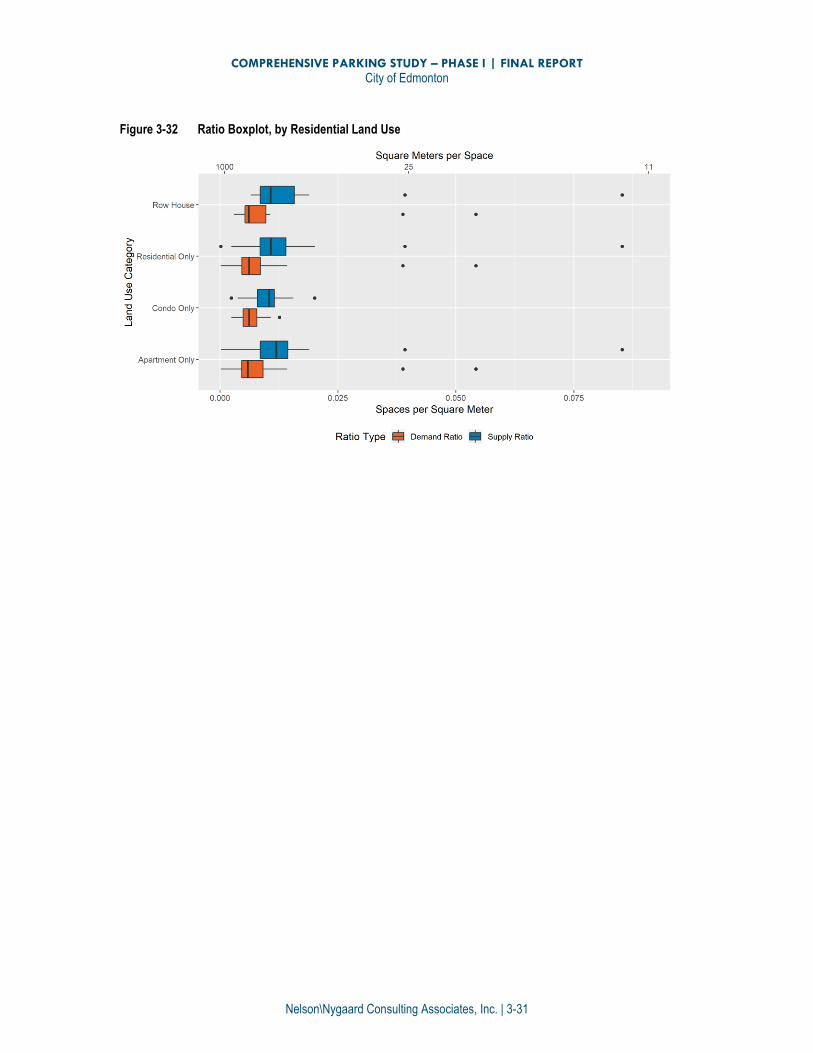
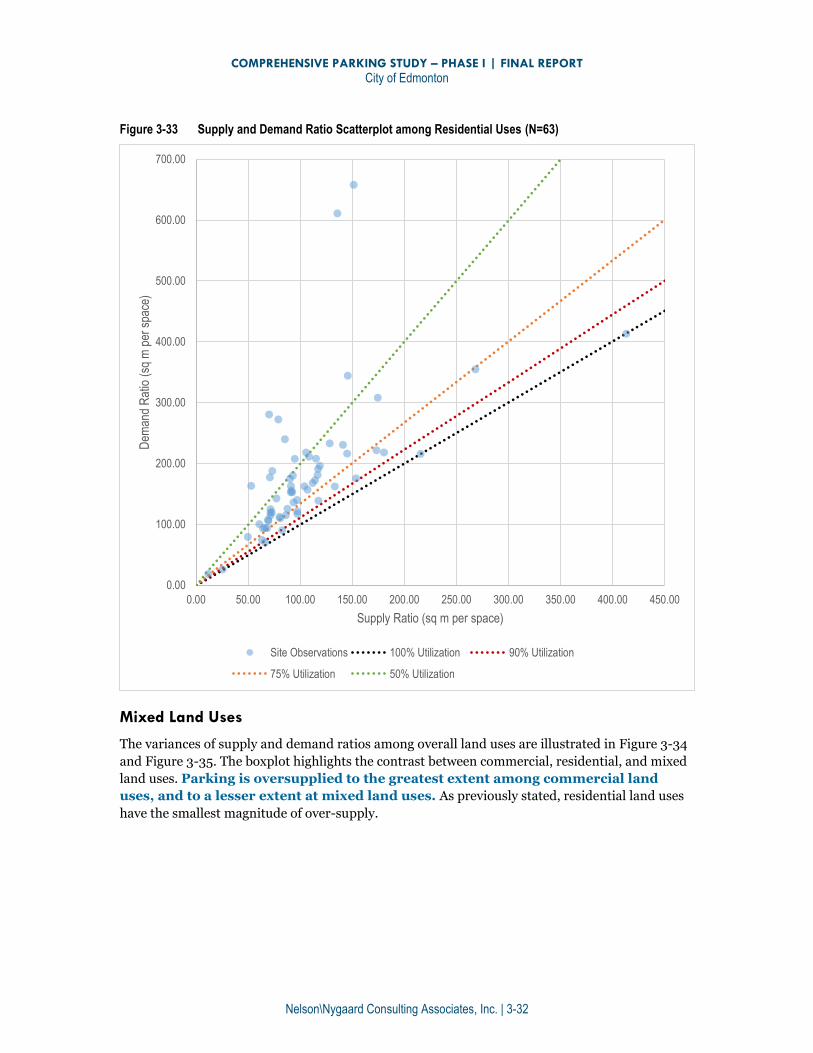
Residential
The variances of supply and demand ratios among residential uses are illustrated in Figure 3-32
and Figure 3-33. The specific residential land uses considered look very similar to residential land
uses overall – parking is over-supplied a similar rate across all residential categories.
On average, the over-supply magnitude is smaller than commercial land uses on average.
0.00
100.00
200.00
300.00
400.00
500.00
600.00
700.00
0.00 50.00 100.00 150.00 200.00 250.00
Dem
and
Rat
io (
sq m
per
spa
ce)
Supply Ratio (sq m per space)
Site Observations 100% Utilization 90% Utilization
75% Utilization 50% Utilization
COMPREHENSIVE PARKING STUDY – PHASE I | FINAL REPORT
City of Edmonton
Nelson\Nygaard Consulting Associates, Inc. | 3-31
Figure 3-32 Ratio Boxplot, by Residential Land Use
COMPREHENSIVE PARKING STUDY – PHASE I | FINAL REPORT
City of Edmonton
Nelson\Nygaard Consulting Associates, Inc. | 3-32
Figure 3-33 Supply and Demand Ratio Scatterplot among Residential Uses (N=63)
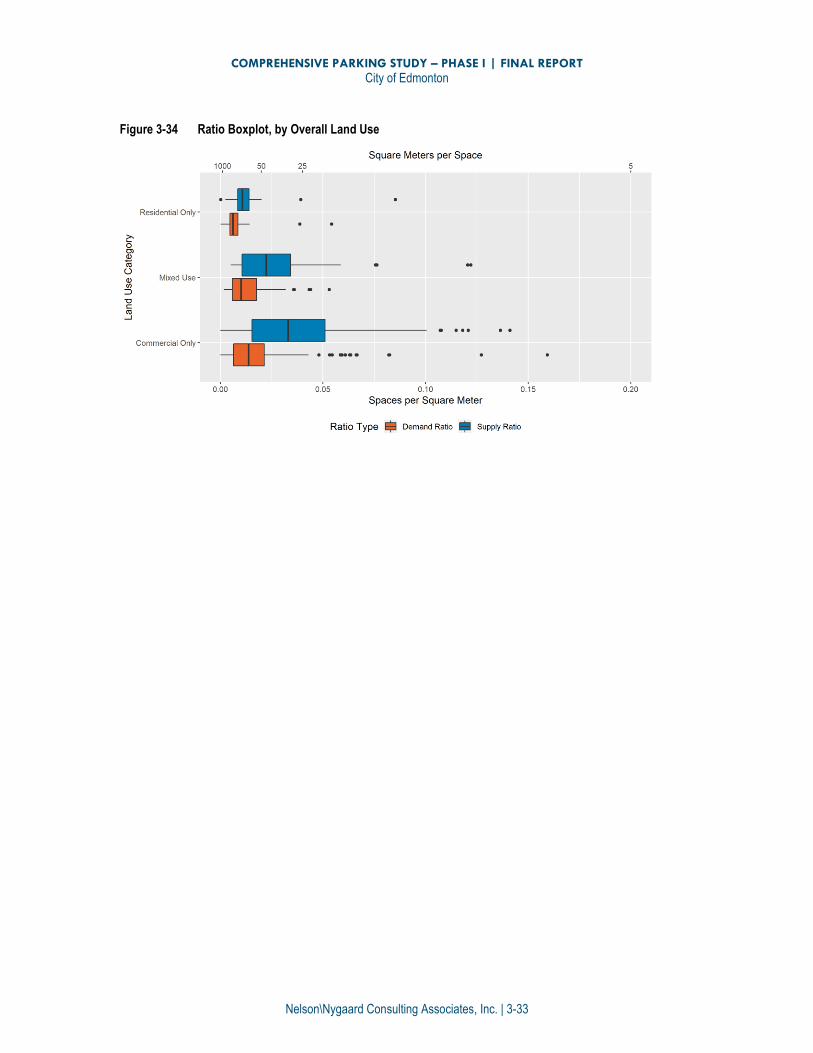
Mixed Land Uses
The variances of supply and demand ratios among overall land uses are illustrated in Figure 3-34
and Figure 3-35. The boxplot highlights the contrast between commercial, residential, and mixed
land uses. Parking is oversupplied to the greatest extent among commercial land
uses, and to a lesser extent at mixed land uses. As previously stated, residential land uses
have the smallest magnitude of over-supply.
0.00
100.00
200.00
300.00
400.00
500.00
600.00
700.00
0.00 50.00 100.00 150.00 200.00 250.00 300.00 350.00 400.00 450.00
Dem
and
Rat
io (
sq m
per
spa
ce)
Supply Ratio (sq m per space)
Site Observations 100% Utilization 90% Utilization
75% Utilization 50% Utilization
COMPREHENSIVE PARKING STUDY – PHASE I | FINAL REPORT
City of Edmonton
Nelson\Nygaard Consulting Associates, Inc. | 3-33
Figure 3-34 Ratio Boxplot, by Overall Land Use
COMPREHENSIVE PARKING STUDY – PHASE I | FINAL REPORT
City of Edmonton
Nelson\Nygaard Consulting Associates, Inc. | 3-34
Figure 3-35 Supply and Demand Ratio Scatterplot among Mixed Use (N=63)
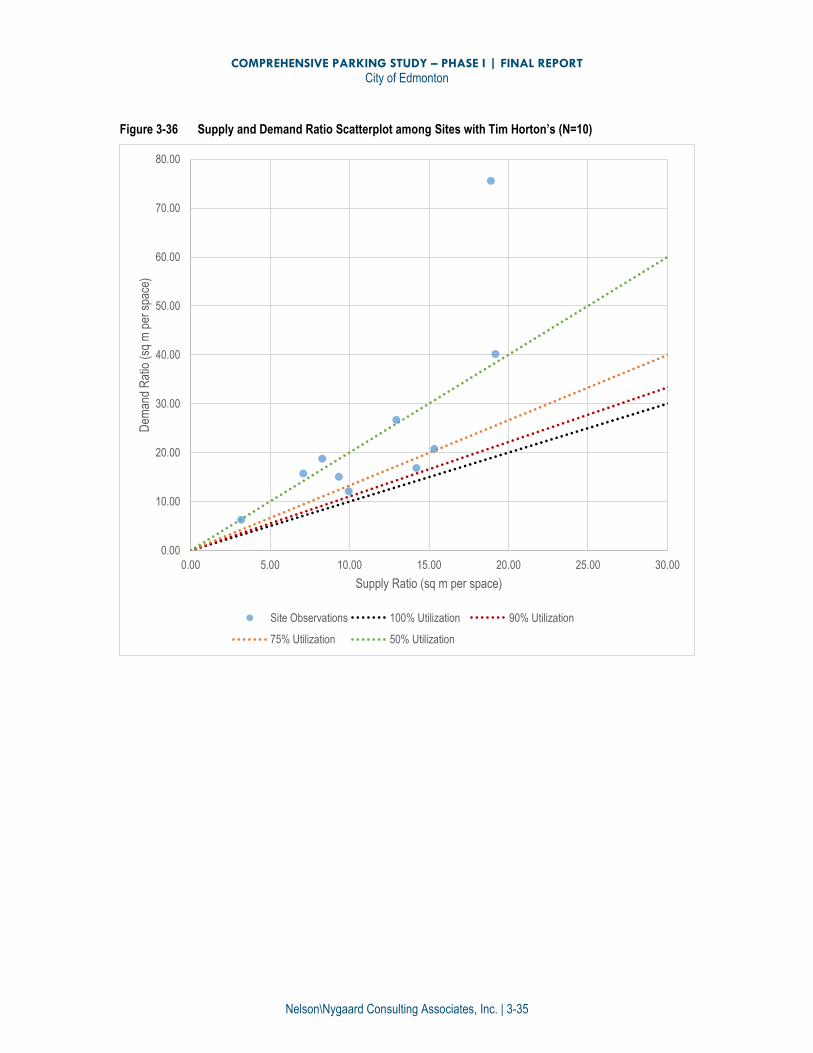
Tim Horton’s
The supply and demand ratios for ten sites with Tim Horton’s restaurants are illustrated in Figure
3-36. There is variance in supply and demand among sites with Tim Horton’s – two sites have
demand nearing supply, while the others have utilization less than 75%. Supply and demand
ratios both vary widely.
0.00
100.00
200.00
300.00
400.00
500.00
600.00
0.00 50.00 100.00 150.00 200.00 250.00
Dem
and
Rat
io (
sq m
per
spa
ce)
Supply Ratio (sq m per space)
Site Observations 100% Utilization 90% Utilization
75% Utilization 50% Utilization
COMPREHENSIVE PARKING STUDY – PHASE I | FINAL REPORT
City of Edmonton
Nelson\Nygaard Consulting Associates, Inc. | 3-35
Figure 3-36 Supply and Demand Ratio Scatterplot among Sites with Tim Horton’s (N=10)
0.00
10.00
20.00
30.00
40.00
50.00
60.00
70.00
80.00
0.00 5.00 10.00 15.00 20.00 25.00 30.00
Dem
and
Rat
io (
sq m
per
spa
ce)
Supply Ratio (sq m per space)
Site Observations 100% Utilization 90% Utilization
75% Utilization 50% Utilization
COMPREHENSIVE PARKING STUDY – PHASE I | FINAL REPORT
City of Edmonton
Nelson\Nygaard Consulting Associates, Inc. | 4-1
4 KEY FINDINGS 1. Parking is over-supplied across geography and land uses considered. Based on
observed data, parking is generally over-supplied across most land uses and locations in
Edmonton. Some specific sites or neighbourhoods have high parking occupancies at certain
times of day. However, those findings are not reflective of overall citywide patterns and are
indicative of site-specific management challenges.
2. Parking is supplied and utilized at rates that have no discernable relationship
with land use or neighbourhood context. This report analyzes parking supply and
utilization in relation to many potential land use and demographic factors. The consistent
finding is that parking supply and utilization varies widely across the city and there is no
easily identifiable, consistent factor determining this relationship.
3. The City should prioritize further evaluation of a substantial reduction and/or
elimination of minimum parking requirements. As demonstrated in the analysis,
there is wide variation in how parking is supplied and utilized by both land use and
geographic area, and the relationships considered in this report are very tenuous.
Therefore, parking supply should be primarily determined by local market demand, not
prescriptive supply ratios in code. Parking regulations should ultimately provide flexibility for
each site or project, while reflecting broader policy goals to reduce driving and promote
mobility choices.
4. City parking regulations and parking management practices can play a stronger
role in how parking is utilized. Where parking is utilized at a high rate (which was rare
among sites analyzed), the City should consider pricing on-street parking, incentivizing the
pricing of off-street parking, as well as regulations to manage parking demand, such as
programs and infrastructure encouraging the use of transit, biking, walking, and shared
vehicle trips. A Transportation Management Association (TMA), or some other organization
directing management and regulation of on- and off-street parking as integrated inventory,
would also help to maximize the utility of existing parking.