PARKER RIVER WATERSHED - Massachusetts
151
PARKER RIVER WATERSHED WATER QUALITY ASSESSMENT REPORT COMMONWEALTH OF MASSACHUSETTS EXECUTIVE OFFICE OF ENVIRONMENTAL AFFAIRS BOB DURAND, SECRETARY MASSACHUSETTS DEPARTMENT OF ENVIRONMENTAL PROTECTION LAUREN A. LISS, COMMISSIONER BUREAU OF RESOURCE PROTECTION CYNTHIA GILES, ASSISTANT COMMISSIONER DIVISION OF WATERSHED MANAGEMENT GLEN HAAS, DIRECTOR 91-AC-1 Parker River below Larkin Rd., Byfield, MA Sandy Point, Plum Island, Ipswich, MA Ox Pasture Brook, below Feno Dr., Rowley
Transcript of PARKER RIVER WATERSHED - Massachusetts

PARKER RIVER WATERSHED
WATER QUALITY ASSESSMENT REPORT
COMMONWEALTH OF MASSACHUSETTS EXECUTIVE OFFICE OF ENVIRONMENTAL AFFAIRS
BOB DURAND, SECRETARY MASSACHUSETTS DEPARTMENT OF
ENVIRONMENTAL PROTECTION LAUREN A. LISS, COMMISSIONER
BUREAU OF RESOURCE PROTECTION CYNTHIA GILES, ASSISTANT COMMISSIONER
DIVISION OF WATERSHED MANAGEMENT GLEN HAAS, DIRECTOR
91-AC-1
Parker River below Larkin Rd., Byfield, MA
Sandy Point, Plum Island, Ipswich, MA
Ox Pasture Brook, below Feno Dr., Rowley

NOTICE OF AVAILABILITY
LIMITED COPIES OF THIS REPORT ARE AVAILABLE AT NO COST BY WRITTEN REQUEST TO:
MASSACHUSETTS DEPARTMENT OF ENVIRONMENTAL PROTECTION DIVISION OF WATERSHED MANAGEMENT
627 MAIN STREET WORCESTER, MA 01608
This report is also available from MA DEP’s home page on the World Wide Web at: http://www.mass.gov/dep/water/resources/wqassess.htm
Furthermore, at the time of first printing, eight copies of each report published by this office are submitted to the State Library at the State House in Boston; these copies are subsequently distributed as follows: • On shelf; retained at the State Library (two copies); • Microfilmed retained at the State Library; • Delivered to the Boston Public Library at Copley Square; • Delivered to the Worcester Public Library; • Delivered to the Springfield Public Library; • Delivered to the University Library at UMass, Amherst; • Delivered to the Library of Congress in Washington, D.C. Moreover, this wide circulation is augmented by inter-library loans from the above-listed libraries. For example a resident in Rehoboth can apply at their local library for loan of any MA DEP DWM report from the Worcester Public Library. A complete list of reports published since 1963 is updated annually and printed in July. This report, entitled, “Publications of the Massachusetts Division of Watershed Management – Watershed Planning Program, 1963-(current year)”, is also available by writing to the DWM in Worcester.
DISCLAIMER
References to trade names, commercial products, manufacturers, or distributors in this report constituted neither endorsement nor recommendations by the Division of Watershed Management for use.

PARKER RIVER WATERSHED
WATER QUALITY ASSESSMENT REPORT
Prepared by:
Mollie J. Weinstein and Susan G. Connors Department of Environmental Protection
Division of Watershed Management
Report Number:
91-AC-1
DWM Control Number:
54.0
Massachusetts Department of Environmental Protection Division of Watershed Management
Worcester, Massachusetts
August 2001

ACKNOWLEDGEMENTS Coordination of local, state and federal agencies and private organizations is fundamental to the success of the Massachusetts Watershed Initiative. We would like to thank Rich Tomczyk, Executive Office of Environmental Affairs and the Parker River Watershed Team for their efforts to facilitate that process. Data and information used in this report were provided in part by the following agencies and organizations:
State • Massachusetts Department of Environmental Protection (MA DEP):
− Bureau of Strategic Policy and Technology, Wall Experiment Station − Bureau of Resource Protection − Bureau of Waste Prevention − Bureau of Waste Site Cleanup
• Massachusetts Department of Public Health (MDPH) • Department of Fisheries, Wildlife, and Environmental Law Enforcement (DFWELE)
− Division of Fisheries and Wildlife − Riverways Program − Division of Marine Fisheries
• Massachusetts Department of Environmental Management (MA DEM)
Federal • Environmental Protection Agency (EPA) • United States Geological Survey (USGS)
− Water Resources Division
Regional • Parker River Clean Water Association (PRCWA) • Little River Stream Team • Parker River Headwaters Stream Team • Massachusetts Audubon Society • Marine Biological Laboratories
Much appreciation is also extended to several MA DEP employees for their contributions: Richard Chase, Ken Dominick, Marcos Luna, Juliet Mathers, Rick McVoy, Ph.D., Katie O’Brien and Arthur Screpetis. It is impossible to thank everyone who contributed to the assessment report process: field, laboratory, data management, writing, editing, and graphics, as well as meetings, phone calls, and many e-mails. All of these contributions are very much appreciated. Cover photo credits: Parker River Clean Water Association

Parker River Watershed Water Quality Assessment Report -i- 91wqar.doc DWM CN 54.0
TABLE OF CONTENTS Table of Contents............................................................................................................................................................ i List of Tables and Figures.............................................................................................................................................. ii List of Acronyms............................................................................................................................................................ iii List of Units ................................................................................................................................................................... iv Executive Summary ....................................................................................................................................................... v
Rivers, Estuaries, Coastal Embayments.......................................................................................................... v Ponds...........................................................................................................................................................xviii
Introduction ....................................................................................................................................................................1 Assessment Methodology ..............................................................................................................................................1 Parker River Watershed Description and Classification ...............................................................................................11 Summary of Existing Conditions and Perceived Problems ..........................................................................................13 Sources of Information .................................................................................................................................................14 Total Maximum Daily Loads (TMDL)............................................................................................................................17 Objectives ....................................................................................................................................................................18 Report Format ..............................................................................................................................................................19 Parker River Watershed – River and Estuary Segment Assessments .........................................................................20
Parker River (Segment MA91-01)..................................................................................................................21 Jackman Brook (Segment MA91-07) .............................................................................................................26 Parker River (Segment MA91-02)..................................................................................................................28 Mill River (Segment MA91-08).......................................................................................................................31 Mill River (Segment MA91-09).......................................................................................................................34 Ox Pasture Brook (Segment MA91-10) .........................................................................................................37 Little River (Segment MA91-11).....................................................................................................................39 Bull Brook (Segment MA91-04) .....................................................................................................................42 Egypt River (Segment MA91-13) ...................................................................................................................43 Egypt River (Segment MA91-14) ...................................................................................................................45 Rowley River (Segment MA91-05) ................................................................................................................47 Paine Creek (Segment MA91-03)..................................................................................................................49 Eagle Hill River (Segment MA91-06) .............................................................................................................50 Plum Island River (Segment MA91-15)..........................................................................................................52 Plum Island Sound (Segment MA91-12)........................................................................................................54
Parker River Watershed – Pond Segment Assessments .............................................................................................57 Baldpate Pond (Segment MA91001) .............................................................................................................59 Bull Brook Reservoir (Segment MA91002) ....................................................................................................61 Central Street Pond (Segment MA91003) .....................................................................................................63 Crane Pond (Segment MA91004)..................................................................................................................65 Dow Brook Reservoir (Segment MA91005) ...................................................................................................66 Little Crane Pond (Segment MA91007) .........................................................................................................68 Lower Mill Pond (Segment MA91008) ...........................................................................................................69 Pentucket Pond (Segment MA91010) ...........................................................................................................71 Quills Pond (Segment MA91011) ..................................................................................................................74 Rock Pond (Segment MA91012) ...................................................................................................................75 Sperrys Pond (Segment MA91013) ...............................................................................................................77 State Street Pond (Segment MA91014).........................................................................................................79 Upper Mill Pond (Segment MA91015) ...........................................................................................................81 Wilson Pond (Segment MA91017).................................................................................................................83
Literature Cited.............................................................................................................................................................85 Appendix A - 1999 MA DEP DWM Parker River Watershed QA/QC Report............................................................... A1 Appendix B - 1999 MA DEP DWM Parker River Watershed Fish Toxics Monitoring Survey Results ......................... B1
Introduction ................................................................................................................................................... B1 Materials and Methods.................................................................................................................................. B1 Results.......................................................................................................................................................... B2
Appendix C - 1999 DEP DWM Biomonitoring Technical Memorandum ...................................................................... C1 Introduction ................................................................................................................................................... C1 Methods ........................................................................................................................................................ C4 Results and Discussion................................................................................................................................. C6 Summary/Recommendations...................................................................................................................... C14
Appendix D - MA DEP Grant and Loan Programs ...................................................................................................... D1 Appendix E - DMF Shellfish Data, Parker River/Plum Island Sound Coastal Drainage Area...................................... E1

Parker River Watershed Water Quality Assessment Report -ii- 91wqar.doc DWM CN 54.0
LIST OF TABLES AND FIGURES Table 1. Parker River Watershed Pond Trophic Status Summary ........................................................................ xviii Table 2. Summary of Massachusetts Surface Water Quality Standards................................................................... 3 Table 3. 1998 303(d) list of waters in the Parker River Watershed ......................................................................... 14 Table 4. 1994 Parker River Watershed fish toxics monitoring data, Pentucket Pond....................................................23 Table 5. Merrimack Valley Planning Commission fecal coliform bacteria summary – Little River .............................39 Table 6. Parker River Watershed Assessed Ponds ......................................................................................................57 Figure 1. Aquatic Life Use Assessment Summary - Rivers, Estuaries, Coastal Embayments and Ponds ............... vii Figure 2. Fish Consumption Use Assessment Summary - Rivers, Estuaries, Coastal Embayments and Ponds......xi Figure 3. Primary and Secondary Contact Recreation Uses Assessment Summary - Rivers, Estuaries, and Coastal Embayments .........................................................................................xv Figure 4. Five-Year Cycle of the Watershed Approach. ............................................................................................ 1 Figure 5. Location of Parker River Watershed ........................................................................................................ 11 Figure 6. Assessed River and Estuary Segments in the Parker River Watershed .................................................. 20 Figure 7. Assessed Ponds in the Parker River Watershed. .................................................................................... 56

Parker River Watershed Water Quality Assessment Report -iii- 91wqar.doc DWM CN 54.0
LIST OF ACRONYMS 7Q10 seven day, ten year low flow ACEC Area of Critical Environmental Concern ACO Administrative Consent Order BPJ best professional judgment BRP Bureau of Resource Protection CMR Code of Massachusetts Regulations CNOEC chronic no observed effect concentration CWA Clean Water Act DDT Dichlordiphenyltrichloroethane DFWELE Department of Fisheries, Wildlife, and Environmental Law Enforcement DMF Division of Marine Fisheries DMR Discharge Monitoring Report DO dissolved oxygen DWM Division of Watershed Management EOEA Executive Office of Environmental Affairs EPA United States Environmental Protection Agency GIS geographic information system IBT Interbasin Transfer Act LC50 lethal concentration to 50% of the test organisms LTER Long-Term Ecological Research Site MA DEM Massachusetts Department of Environmental Management MA DEP Massachusetts Department of Environmental Protection MassGIS Massachusetts Geographic Information System MBL Marine Biological Laboratory MDPH Massachusetts Department of Public Health MPN most probable number MRS mercury research study MVPC Merrimack Valley Planning Commission NAWQA National Water-Quality Assessment NECB New England Coastal Basin NH3-N ammonia-nitrogen NPDES National Pollutant Discharge Elimination System NPS nonpoint source NSF National Science Foundation ORW Outstanding Resource Waters PALIS Pond and Lake Information System PCB polychlorinated biphenols PIE Plum Island Ecosystems PRCWA Parker River Clean Water Association PWS public water supply QAPP quality assurance project plan QA/QC quality assurance/ quality control RBP rapid bioassessment protocol SARIS Stream and River Inventory System SDWA Safe Drinking Water Act SOP standard operating procedure SWAP Source Water Assessment Program SWQS Surface Water Quality Standards TIE/TRE toxicity identification and toxic reduction evaluation TMDL total maximum daily loads TOC total organic carbon TOXTD MA DEP DWM Toxicity Testing Database TRC total residual chlorine USGS United States Geological Survey WBID Waterbody Identification Code WBS Waterbody System Database WMA Water Management Act WWTP waste water treatment plant

Parker River Watershed Water Quality Assessment Report -iv- 91wqar.doc DWM CN 54.0
LIST OF UNITS cfs cubic feet per second cfu colony forming unit gpd gallons per day MGD million gallons per day μg/kg microgram per kilogram mg/L milligram per liter mL/L milliliter per liter ng nanogram NTU nephelometric turbidity units ppb parts per billion ppm parts per million SU standard units TEQ/kg toxic equivalents per kilogram

Parker River Watershed Water Quality Assessment Report -v- 91wqar.doc DWM CN 54.0
EXECUTIVE SUMMARY PARKER RIVER WATERSHED
WATER QUALITY ASSESSMENT REPORT The Massachusetts Surface Water Quality Standards (SWQS) designate the most sensitive uses for which surface waters in the Commonwealth shall be protected. The assessment of current water quality conditions is a key step in the successful implementation of the Watershed Approach. This critical phase provides an assessment of whether or not the designated uses are being met (support, partial support, non-support) or are not assessed, as well as basic information needed to focus resource protection and remediation activities later in the watershed management planning process. All or portions of the Eagle Hill River, Paine Creek, Rowley River and Parker River, as well as eight ponds in the watershed are on the 1998 303(d) list of impaired waters. Total maximum daily load (TMDL) reports have been or are being developed for the eight ponds. This assessment report presents a summary of current water quality data/information used to assess the status of the designated uses as defined in the Massachusetts surface water quality standards. Each use, within a given segment, is individually assessed as 1) support, 2) partial support, or 3) non-support. When too little current data/information exists or no reliable data are available the use is not assessed. However, if there is some indication of water quality impairment, which is not “naturally occurring”, the use is identified with an “Alert Status”. It is important to note that not all waters are assessed. Many small and/or unnamed rivers and ponds are currently unassessed; the status of their designated uses has never been reported to EPA in the Commonwealth’s 305(b) report nor is information on these waters maintained in the Waterbody System (WBS) database. The designated use status is presented for 11 named rivers, streams, brooks or creeks (the term “rivers” will hereafter be used to include all), Plum Island Sound, and 14 ponds/impoundments in the Parker River Watershed. Detailed information for six individual freshwater river segments totaling 26.6 river miles, nine individual estuary segments totaling 7.274 square miles, and 14 ponds totaling 302.6 acres is presented for the following designated uses: Aquatic Life, Fish Consumption, Drinking Water, Shellfishing (where applicable), Primary and Secondary Contact Recreation and Aesthetics.
RIVERS, ESTUARIES, COASTAL EMBAYMENTS The Parker River Watershed is a coastal river drainage area. It is contains freshwater streams that flow into estuarine tributaries to the Plum Island Sound. Major tributaries to the Plum Island Sound included in this report are: the Plum Island, Parker, Rowley and Eagle Hill rivers. The Parker River is the largest tributary to the Sound. Tributaries to the Parker River subwatershed included in this report are: Jackman Brook, Mill River, Ox Pasture Brook and Little River. Additionally, before flowing into Plum Island Sound, the Rowley and Eagle Hill rivers receive flow from their respective tributaries (Bull Brook, Egypt River and Paine Creek). A summary of the Aquatic Life, Fish Consumption, Drinking Water, Shellfishing, Primary and Secondary Contact Recreation, and Aesthetics uses in these waters follows. When sufficient data/current information were not available, the uses were not assessed.

Parker River Watershed Water Quality Assessment Report -vi- 91wqar.doc DWM CN 54.0
AQUATIC LIFE USE – Rivers, Estuaries, Coastal Embayments The Aquatic Life Use is supported when suitable habitat (including water quality) is available for sustaining a native, naturally diverse, community of aquatic flora and fauna. Impairment of the Aquatic Life Use (non-support or partial support) may result from anthropogenic stressors that include point and/or nonpoint source(s) of pollution and hydrologic modification. The status of the Aquatic Life Use in the Parker River Watershed is as follows:
Aquatic Life Use Summary – Rivers (miles) SUPPORT PARTIAL SUPPORT NON-SUPPORT NOT ASSESSED Total
15.3 8 0 3.3 26.6
Aquatic Life Use Summary – Estuaries/ Coastal Embayments (square miles) SUPPORT PARTIAL SUPPORT NON-SUPPORT NOT ASSESSED Total
6.6 0 0 0.674 7.274 As illustrated in Figure 1, 58% of the river miles assessed in this report support Aquatic Life Use while a 1.0-mile reach of the Parker River and the entire freshwater segment of the Mill River (7.0 river miles) are impaired for Aquatic Life Use. Impairment to this one-mile reach of the Parker River (between the Georgetown Water Department wells and Rock Pond) is caused by little or no flow during summer months. Although sources of impairment are unknown, water withdrawals are suspected. The cause of impairment to the Mill River is unknown, however, low flow and excessive nutrients (from the upstream eutrophic impoundments) are suspected to impair this segment.
Ninety-one percent of the estuarine waters in the Parker River Watershed support the Aquatic Life Use (Figure 1). The remaining 0.674 mi2 are not assessed.
Other issues of concern to the Aquatic Life Use within this watershed include whole effluent toxicity of Governor Dummer Academy’s discharge to a small, unnamed tributary to the Mill River and Ipswich Water Department’s increase in water withdrawals from the Egypt River subwatershed.

Parker River Watershed Water Quality Assessment Report -vii- 91wqar.doc DWM CN 54.0
Parke
r Rive
r
Plum Islan d S
oun d
Mill Rive
r
Jack
man
Br o
ok
O x Pa
stur
e B
rook
Egyp t
Riv
erRow
ley River
Bull B
rook Eagle Hill
River
Paine Creek
LittleRiver
Plum IslandRiver
Parker River
Pentucket Pond (MA91010)GeorgetownPARTIAL SUPPORTCauses: Exotic SpeciesSources: Unknown
State Street Pond (MA91014)NewburyportPARTIAL SUPPORTCauses: Non-native plantsSources: Unknown
N
2 0 2 4 Miles
Lower Mill Pond (MA91008)RowleyPARTIAL SUPPORTCauses: Exotic speciesSources: Unknown
Mill River (MA91-08)PARTIAL SUPPORT 7.0 milesCauses: Unknown (suspected: nutrients, low flow)Sources: Unknown (suspected: upstream impoundments)
Parker River (MA91-01)SUPPORT 12.0 milesPARTIAL SUPPORT 1.0 milesCauses: Flow alterationSources: Hydromodification (suspected: water withdrawals)
PARKER RIVER WATERSHED Aquatic Life Use Assessment Summary - Rivers, Estuaries, Coastal Embayments and Ponds
Figure 1. Aquatic Life Use Assessment Summary - Rivers, Estuaries, Coastal Embayments and Ponds

Parker River Watershed Water Quality Assessment Report -viii- 91wqar.doc DWM CN 54.0
intentionally left blank

Parker River Watershed Water Quality Assessment Report -ix- 91wqar.doc DWM CN 54.0
FISH CONSUMPTION USE – Rivers, Estuaries, Coastal Embayments The Fish Consumption Use is supported when there are no pollutants present that result in unacceptable concentrations in edible portions of marketable fish or for the recreational use of fish, other aquatic life or wildlife for human consumption. The assessment of this use is made using the most recent list of Fish Consumption Advisories issued by the Massachusetts Executive Office of Health and Human Services, Department of Public Health (MDPH), Bureau of Environmental Health Assessment (MDPH 2001a). The MDPH list identifies waterbodies where elevated levels of a specified contaminant in edible portions of freshwater species poses a health risk for human consumption; hence the Fish Consumption Use is assessed as non-support in these waters.
Because of the statewide advisory, however, no waters can be assessed as support or partial support for the Fish Consumption Use. The status of the Fish Consumption Use in the Parker River Watershed is as follows:
Fish Consumption Use Summary – Rivers (miles)
SUPPORT PARTIAL SUPPORT NON-SUPPORT NOT ASSESSED Total
0 0 1.1 25.5 26.6
Fish Consumption Use Summary – Estuaries/Coastal Embayments (square miles) SUPPORT PARTIAL SUPPORT NON-SUPPORT NOT ASSESSED Total
0 0 0 7.274 7.274 MDPH issued advisories for two impoundments of the Parker River (Rock and Pentucket ponds) because of elevated mercury concentrations in fishes (MDPH 2001a). The Fish Consumption Use is therefore assessed as non-support for a total of 1.1 miles of the Parker River through these impoundments (Figure 2). No other river miles were assessed for the Fish Consumption Use in the Parker River Watershed. Additionally, no estuarine segments were assessed for this use.
NOTE: In July 2001, MDPH issued new consumer advisories on fish consumption and mercury contamination. The MDPH “is advising pregnant women, women of childbearing age who may become pregnant, nursing mothers and children under 12 years of age to refrain from eating the following marine fish; shark, swordfish, king mackerel, tuna steak and tilefish. In addition, MDPH is expanding its previously issued statewide fish consumption advisory which cautioned pregnant women to avoid eating fish from all freshwater bodies due to concerns about mercury contamination, to now include women of childbearing age who may become pregnant, nursing mothers and children under 12 years of age (MDPH 2001b).” Additionally, MDPH “is recommending that pregnant women, women of childbearing age who may become pregnant, nursing mothers and children under 12 years of age limit their consumption of fish not covered by existing advisories to no more than 12 ounces (or about 2 meals) of cooked or uncooked fish per week. This recommendation includes canned tuna, the consumption of which should be limited to 2 cans per week. Very small children, including toddlers, should eat less. Consumers may wish to choose to eat light tuna rather than white or chunk white tuna, the latter of which may have higher levels of mercury (MDPH 2001b).” MDPH’s statewide advisory does not include fish stocked by the state Division of Fisheries and Wildlife or farm-raised fish sold commercially.

Parker River Watershed Water Quality Assessment Report -x- 91wqar.doc DWM CN 54.0
intentionally left blank

Parker River Watershed Water Quality Assessment Report xi 91wqar.doc DWM CN 54.0
Paine Creek
Eagle Hill
River
Bull B
rook
Rowley
River
Egyp
t R
iver
O x Pa
stu
re B
rook
Jack
man
Br o
ok
Mill Rive
r
Plum Island S
ound
Parke
r Rive
r
Parker River
Plum IslandRiver
LittleRiver
N
Im(pa
No
Un
Se
Baldpate Pond (MA91001)BoxfordNON-SUPPORT
Pentucket Pond (MA91010)GeorgetownNON-SUPPORT
Rock Pond (MA91012)GeorgetownNON-SUPPORT
Parker River (MA91-01)GeorgetownNOT ASSESSED 11.9 milesNON-SUPPORT 1.1 miles through Rock and Pentucket ponds
2 0 2
PARKER RIVER WATERSHED Fish Consumption Use Assessment Summary - Rivers, Estuaries, Coastal Embayments and Ponds
Figure 2. Fish Consumption Use Assessment Summary - Rivers, Estuaries, Coastal Embayments and Ponds
In July 2001, MDPH issued new consumer advisories for fish consumption because of mercury contamination. The MDPH “…is advising pregnant women, women of childbearing age who may become pregnant, nursing mothers and children under 12 years of age to refrain from eating the following marine fish; shark, swordfish, king mackerel, tuna steak and tilefish. In addition, MDPH is expanding its previously issued statewide fish consumption advisory which cautioned pregnant women to avoid eating fish from all freshwater bodies due to concerns about mercury contamination, to now include women of childbearing age who may become pregnant, nursing mothers and children under 12 years of age (MDPH 2001b).”
Additionally, MDPH “…is recommending that pregnant women, women of childbearing age who may become pregnant, nursing mothers and children under 12 years of age limit their consumption of fish not covered by existing advisories to no more than 12 ounces (or about 2 meals) of cooked or uncooked fish per week. This recommendation includes canned tuna, the consumption of which should be limited to 2 cans per week. Very small children, including toddlers, should eat less (MDPH 2001b).”
Because of the statewide advisory no waters can be assessed as support or partial support for the Fish Consumption Use.
MDPH issued site-specific advisories for three ponds in the Parker River Watershed due to elevated levels of mercury. These ponds, and the reach of the Parker River that flows through Rock and Pentucket ponds, are assessed as non-support with sources of contamination unknown.

Parker River Watershed Water Quality Assessment Report xii 91wqar.doc DWM CN 54.0
intentionally left blank

Parker River Watershed Water Quality Assessment Report xiii 91wqar.doc DWM CN 54.0
DRINKING WATER USE – Rivers, Estuaries, Coastal Embayments The term Drinking Water Use has been used to indicate sources of public drinking water. While this use is not assessed in this report, information on drinking water source protection and finish water quality is available at http://www.mass.gov/dep/water/drinking.htm and from the Parker River Watershed’s public water suppliers. These waters are subject to stringent regulation in accordance with the Massachusetts Drinking Water Regulations. MA DEP’s Drinking Water Program (DWP) has primacy for implementing the provisions of the federal Safe Drinking Water Act. DWP has also initiated work on its Source Water Assessment Program (SWAP), which requires that the Commonwealth delineate protection areas for all public ground and surface water sources; inventory land uses in these areas that may present potential threats to drinking water quality; determine the susceptibility of water supplies to contamination from these sources; and publicize the results. Except for suppliers with surface water sources for which a waiver from filtration has been granted (these systems also monitor surface water quality), public water suppliers monitor their finished water (tap water) for major categories of contaminants (e.g., bacteria, volatile and synthetic organic compounds, inorganic compounds, etc.) and report their data to DWP. SHELLFISHING USE – Rivers, Estuaries, Coastal Embayments The Shellfishing Use is supported when shellfish harvested from approved Open Shellfish Areas (Class SA) are suitable for consumption without depuration and shellfish harvested from approved Restricted Shellfish Areas (Class SB) are suitable for consumption with depuration. The Division of Marine Fisheries (DMF) classifies shellfishing areas in the Parker River/ Plum Island Sound Coastal Drainage Area. The Shellfishing Use for this report was assessed using the DMF shellfishing closure list dated October 2000. The status of the 11,138 acres of shellfishing beds in the entire Parker River/ Plum Island Sound Coastal Drainage Area (including areas that extend into open-water and areas not specifically included in this assessment report) is as follows:
DMF Classification Type
MA DEP Use Support Status
DMF Area (acres)
% of total DMF acreage
Approved Support 7106.453 64% Conditionally Approved Partial support 3494.853 31%
Prohibited Non-support 536.662 5% Individual DMF management area classifications are provided in Appendix E of this report. It should be noted that DMF’s areas are defined in acres of shellfishing habitat.
Parker River Watershed Water Quality Assessment Report xiv 91wqar.doc DWM CN 54.0
PRIMARY AND SECONDARY CONTACT RECREATION USE – Rivers, Estuaries, Coastal Embayments The Primary Contact Recreation Use is supported when conditions are suitable (fecal coliform bacteria densities, pH, temperature, turbidity and aesthetics meet the Surface Water Quality Standards) for any recreational or other water related activity during which there is prolonged and intimate contact with the water with a significant risk of ingestion. Activities include, but are not limited to, wading, swimming, diving, surfing and water skiing. The Secondary Contact Recreation Use is supported when conditions are suitable for any recreational or other water use during which contact with the water is either incidental or accidental. These include, but are not limited to, fishing, boating and limited contact incident to shoreline activities. The status of the Primary and Secondary Contact Recreation Uses in the Parker River Watershed is as follows:
Primary and Secondary Contact Recreation Uses Summary – Rivers (miles) SUPPORT PARTIAL SUPPORT NON-SUPPORT NOT ASSESSED Total
0 0 0 26.6 26.6
Primary and Secondary Contact Recreation Uses Summary – Estuaries/Coastal Embayments (square miles)
SUPPORT PARTIAL SUPPORT NON-SUPPORT NOT ASSESSED Total
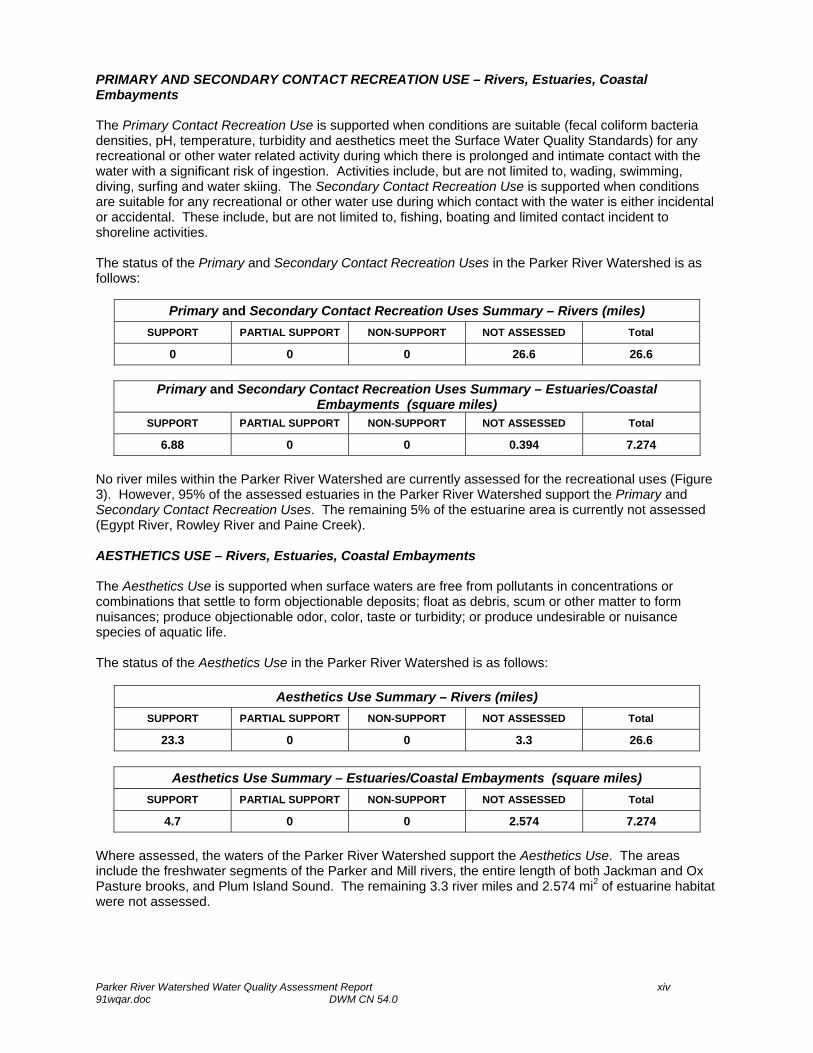
6.88 0 0 0.394 7.274 No river miles within the Parker River Watershed are currently assessed for the recreational uses (Figure 3). However, 95% of the assessed estuaries in the Parker River Watershed support the Primary and Secondary Contact Recreation Uses. The remaining 5% of the estuarine area is currently not assessed (Egypt River, Rowley River and Paine Creek). AESTHETICS USE – Rivers, Estuaries, Coastal Embayments The Aesthetics Use is supported when surface waters are free from pollutants in concentrations or combinations that settle to form objectionable deposits; float as debris, scum or other matter to form nuisances; produce objectionable odor, color, taste or turbidity; or produce undesirable or nuisance species of aquatic life. The status of the Aesthetics Use in the Parker River Watershed is as follows:
Aesthetics Use Summary – Rivers (miles) SUPPORT PARTIAL SUPPORT NON-SUPPORT NOT ASSESSED Total
23.3 0 0 3.3 26.6
Aesthetics Use Summary – Estuaries/Coastal Embayments (square miles) SUPPORT PARTIAL SUPPORT NON-SUPPORT NOT ASSESSED Total
4.7 0 0 2.574 7.274 Where assessed, the waters of the Parker River Watershed support the Aesthetics Use. The areas include the freshwater segments of the Parker and Mill rivers, the entire length of both Jackman and Ox Pasture brooks, and Plum Island Sound. The remaining 3.3 river miles and 2.574 mi2 of estuarine habitat were not assessed.

Parker River Watershed Water Quality Assessment Report xv 91wqar.doc DWM CN 54.0
Paine Creek
Eagle Hill
R iver
Bull B
rook
Ro
wley River
Egyp
t R
iver
O x Pa
stu
re B
rook
Jack
man
Bro
ok
Mill
River
Plum Island S
ou nd
LittleRiver
Plum IslandRiver
Parker River
Parke
r Rive
r
Support
Not Assessed
Unassessed Waters
Segment Break
LEGEND
N
2 0 2
PARKER RIVER WATERSHED Primary and Secondary Contact Recreation Uses Assessment Summary
Rivers, Estuaries, and Coastal Embayments
Figure 3. Primary and Secondary Contact Recreation Uses Assessment Summary - Rivers, Estuaries, and Coastal Embayments

Parker River Watershed Water Quality Assessment Report xvi 91wqar.doc DWM CN 54.0
intentionally left blank

Parker River Watershed Water Quality Assessment Report xvii 91wqar.doc DWM CN 54.0
RECOMMENDATIONS – RIVERS, ESTUARIES, COASTAL EMBAYMENTS In addition to specific issues for the individual segments, the evaluation of current water quality conditions in the Parker River Watershed has revealed the need for the following:
• Conduct a preliminary analysis to prioritize the need for collecting quality assured data to fully assess
all designated uses of segments in the Parker River Watershed. Review the USGS Statewide Water-Quality Network Report for examples of the monitoring necessary to completely assess all uses (USGS 2001).
• Complete the Water Management Act (WMA) five-year reviews for permits in the Parker River
Watershed and continue to evaluate compliance with WMA registration and/or permit limits. Work with water suppliers to optimize water withdrawal and reservoir management practices to maintain minimum streamflow.
• Ipswich Water Department has applied for a permit to withdraw greater volumes from their sources in
the Rowley River subwatershed. Prior to the permit issuance the Water Department is required to implement aggressive water conservation. Through the permitting process, determine the potential impacts of Ipswich Water Department’s withdrawals on streamflow/habitat.
• Collect additional data to determine the frequency, duration, and spatial extent of low flow conditions
and assess habitat quality as it is related to streamflow.
• When the MA DEP DWP Storm Water Assessment Program evaluations are completed, develop and implement recommendations to protect Bull Brook, a Class A river in the Parker River Watershed.
• Reissue Governor Dummer’s National Pollutant Discharge Elimination System (NPDES) permit with
appropriate limits and monitoring requirements.
• Conduct fecal coliform bacteria monitoring upstream and downstream from Governor Dummer’s discharge, during wet and dry weather conditions, to determine the effectiveness of the Governor Dummer Academy’s wastewater treatment plant (WWTP) upgrades. If Governor Dummer continues to have problems meeting their LC50 and chronic no observed effect concentration (CNOEC) limits, the need for a toxicity identification and toxic reduction evaluation (TIE/TRE) should be determined.
• Inspections should be conducted of facilities with general storm water permits to determine if storm
water protection plans have been developed and implemented. • Conduct bacteriological monitoring (using the indicator organism specified in the Massachusetts
Surface Water Quality Standards) to assess the status of the Primary and Secondary Contact Recreation Uses in currently not assessed waters.
• Work with the Division of Marine Fisheries, Coastal Zone Management and local communities to
identify and reduce sources of contamination (e.g., storm water, failing septic systems, etc.) to shellfish areas.
• Assist the Towns of Rowley and Newburyport in repair of suspected failing septic and sewer systems.
• Work with the Parker River Clean Water Association to identify causes and sources of contamination,
conduct stream cleanups, and encourage/strengthen local stewardship.
• Work with the Massachusetts Department of Environmental Management (MA DEM) to monitor dam safety and/or removal issues including the need for fish passage facilities in the Parker River Watershed.

Parker River Watershed Water Quality Assessment Report xviii 91wqar.doc DWM CN 54.0
PONDS Information on 14 ponds in the Parker River Watershed is presented in this report. These ponds represent approximately 95% (302.6 of 317.6 acres) of the watershed’s total pond acreage. Ponds in the Parker River Watershed represent multiple stages of succession, as described in terms of trophic status estimates (Table 1). Excessive plant growth in ponds (both rooted aquatics and algae) was the most frequently recorded cause of impairment for multiple uses (Primary and Secondary Contact Recreation and Aesthetics). Table 1. Parker River Watershed pond trophic status summary.
TROPHIC STATUS NUMBER OF PONDS ACRES Oligotrophic 0 0 Mesotrophic 3 189.6 Eutrophic 5 44.0 Hypereutrophic 1 14.0 Undetermined* 5 55.0 Not Attainable 0 0.0 Total 14 302.6
* It should be noted that some ponds or portions of ponds are listed as undetermined when indicators were not readily observable. With this approach, only the most obvious impairments are reported and, therefore, the assessment of ponds in the Parker River Watershed is limited to a "best case" picture. Potentially more of the pond acreage would be listed as impaired, or in a more enriched trophic status, if more variables were measured and more criteria assessed.
AQUATIC LIFE USE – Ponds The status of the Aquatic Life Use for the ponds in the Parker River Watershed is as follows:
Aquatic Life Use Summary – Ponds (acres) SUPPORT PARTIAL SUPPORT NON-SUPPORT NOT ASSESSED TOTAL
0 104 0 198.6 302.6 Two exotic aquatic plant species (Trapa natans and Cabomba caroliniana) were identified in ponds in the Parker River Watershed. These plants are particularly invasive species and reproduce vegetatively; therefore, they may spread readily downstream on currents or between ponds by mechanical transport. Based on the presence of these exotic aquatic species, three ponds (Lower Mill, Pentucket, and State Street ponds) were assessed as partial support for the Aquatic Life Use (Figure 1). Approximately one-third of the pond-acreage in the Parker River Watershed was not assessed for this use. FISH CONSUMPTION USE – Ponds The status of the Fish Consumption Use for the ponds in the Parker River Watershed is as follows:
Fish Consumption Use Summary – Ponds (acres) SUPPORT PARTIAL SUPPORT NON-SUPPORT NOT ASSESSED TOTAL
0 0 189.6 113.0 302.6 Because of health concerns associated with exposure to mercury, MDPH issued fish consumption advisories for Rock, Pentucket, and Baldpate ponds (MDPH 2001a). Because of these advisories, the Fish Consumption Use was assessed as non-support for 63% of pond acres in the Parker River Watershed (Figure 2). The remaining acreage was not assessed due to MDPH’s revised statewide advisory for mercury (see Fish Consumption Use – Rivers) that encompasses all Massachusetts waters.

Parker River Watershed Water Quality Assessment Report xix 91wqar.doc DWM CN 54.0
DRINKING WATER USE – Ponds The Drinking Water Use has been used to indicate sources of public drinking water. While this use is not assessed in this report, information on drinking water source protection and finish water quality is available at http://www.mass.gov/dep/water/drinking.htm and from the Parker River Watershed’s public water suppliers. These waters are subject to stringent regulation in accordance with the Massachusetts Drinking Water Regulations. The DWP has primacy for implementing the provisions of the federal Safe Drinking Water Act. DWP has also initiated work on SWAP, which requires that the Commonwealth delineate protection areas for all public ground and surface water sources; inventory land uses in these areas that may present potential threats to drinking water quality; determine the susceptibility of water supplies to contamination from these sources; and publicize the results. Except for suppliers with surface water sources for which a waiver from filtration has been granted (these systems also monitor surface water quality) public water suppliers monitor their finished water (tap water) for major categories of contaminants (e.g., bacteria, volatile and synthetic organic compounds, inorganic compounds, etc.) and report their data to DWP. PRIMARY CONTACT RECREATION USE – Ponds The status of the Primary Contact Recreation Use for the ponds in the Parker River Watershed is as follows:
Primary Contact Recreation Use Summary – Ponds (acres) SUPPORT PARTIAL SUPPORT NON-SUPPORT NOT ASSESSED TOTAL
0 95 55 152.6 302.6 No ponds in the Parker River Watershed were assessed as supporting the Primary Contact Recreation Use. Portions or all of eight ponds (154 acres) were impaired (partial or non-support) for this use. Because the data available to assess the Primary Contact Recreation Use focused on macrophyte cover, transparency and presence of exotic/non-native aquatic plants, the major cause of impairment was noxious/overabundant plant growth. When no visual impairment was identified during the synoptic surveys, it could not be assumed that water quality conditions met standards (i.e., no bacterial data) and, therefore, this use was not assessed for half of the pond acreage in the Parker River Watershed.

Parker River Watershed Water Quality Assessment Report xx 91wqar.doc DWM CN 54.0
SECONDARY CONTACT RECREATION AND AESTHETICS USES – Ponds The status of the Secondary Contact Recreation and Aesthetics Uses for the ponds in the Parker River Watershed is as follows:
Secondary Contact Recreation and Aesthetics Uses Summary – Ponds (acres) SUPPORT PARTIAL SUPPORT NON-SUPPORT NOT ASSESSED TOTAL
0 10 55 237.6 302.6 None of the ponds assessed in the Parker River Watershed supported the Secondary Contact Recreation and Aesthetics Uses while all or portions of seven ponds (65 acres) were impaired (partial or non-support) for these uses. Because the data available to assess the recreational uses focused on macrophyte cover, transparency and presence of exotic aquatic plants, the major cause of impairment was noxious/overabundant plant growth. When no visual impairment was identified during the synoptic surveys, it could not be assumed that water quality conditions met standards and, therefore, the majority (79%) of the pond-acreage in the Parker River Watershed was not assessed for the Secondary Contact Recreation and Aesthetics Uses. RECOMMENDATIONS - PONDS Potentially more of the pond acreage would be listed as impaired or in a more enriched trophic status if additional variables were measured and more criteria assessed. In the Parker River Watershed there is a need to:
• Conduct monitoring (e.g., fecal coliform bacteria, Secchi disk depth, etc.) to assess the Primary and
Secondary Contact Recreation Uses.
• Conduct monitoring for water chemistry data including dissolved oxygen and temperature profiles, total phosphorus and chlorophyll a to assess the Aquatic Life Use.
• Monitor/control the spread and growth of exotic aquatic and wetland vegetation.
• Implement recommendations to be identified in the Parker River Watershed Total Phosphorus TMDL
and pond Diagnostic/Feasibility studies, including performing pond watershed surveys to identify sources of impairment.
• Review the MA DEP DWP SWAP evaluations when they are completed to develop and implement
recommendations for the protection of Class A waters in the Parker River Watershed, including Bull Brook and Dow Brook reservoirs and tributaries thereto.
• Work with the Massachusetts Department of Environmental Management (MA DEM) to monitor dam
safety and/or removal issues including the need for fish passage facilities in the Parker River Watershed.

Parker River Watershed Water Quality Assessment Report 1 91wqar.doc DWM CN 54.0
1
2
3
5
MONITORING
ASSESSMENT
CONTROLSTRATEGIES
EVALUATION
INFORMATION GATHERING
WATERSHED APPROACH: THE FIVE-YEAR CYCLE
4
Figure 4. Five-Year Cycle of the Watershed
INTRODUCTION The Massachusetts Watershed Initiative is a collaborative effort between state and federal environmental agencies, municipal agencies, citizens, non-profit groups, businesses and industries in the watershed. The mission is to improve water quality conditions and to provide a framework under which the restoration and/or protection of the watershed’s natural resources can be achieved. Implementation of this project is underway in a process known as the “Watershed Approach”. The five-year cycle of the Watershed Approach, as illustrated in Figure 4, provides the management structure to carry out the mission. This report presents the current assessment of water quality conditions in the Parker River Watershed. The assessment is based on information that has been researched and developed by the Massachusetts Department of Environmental Protection (MA DEP) through the first three years (information gathering, monitoring, and assessment) of the five-year cycle in partial fulfillment of MA DEP’s federal mandate to report on the status of the Commonwealth’s waters under the Federal Water Pollution Control Act (commonly known as the Clean Water Act). The goal of the Clean Water Act (CWA) is to restore and maintain the chemical, physical, and biological integrity of the Nation’s waters (Environmental Law Reporter 1988). To meet this objective, the CWA requires states to develop information on the quality of the Nation's water resources and report this information to the U.S. Environmental Protection Agency (EPA), the U.S. Congress, and the public. Together, these agencies are responsible for implementation of the CWA mandates. Under Section 305(b) of the Federal Clean Water Act, MA DEP must submit a statewide report every two years to the EPA, which describes the status of water quality in the Commonwealth. The most recent 305(b) report is the Commonwealth of Massachusetts Summary of Water Quality 2000 (MA DEP 2000). The 305(b) statewide report is based on the compilation of information for the Commonwealth’s 27 watersheds. The 305(b) report compiles data from a variety of sources, and provides an evaluation of water quality, progress made towards maintaining and restoring water quality, and the extent to which problems remain at the statewide level. At the watershed level, instream biological, habitat, physical/chemical, toxicity data and other information are evaluated to assess the status of water quality conditions. This analysis follows a standardized process described below (Assessment Methodology).
ASSESSMENT METHODOLOGY WATER QUALITY CLASSIFICATION The Massachusetts Surface Water Quality Standards (SWQS) designate the most sensitive uses for which the surface waters of the Commonwealth shall be enhanced, maintained and protected; prescribe minimum water quality criteria required to sustain the designated uses; and include provisions for the prohibition of discharges (MA DEP 1996). These regulations should undergo public review every three years. The surface waters are segmented and each segment is assigned to one of the six classes described below. Each class is identified by the most sensitive and therefore, governing, water uses to be achieved and protected. Surface waters may be suitable for other beneficial uses, but shall be regulated by the Department of Environmental Protection to protect and enhance the designated uses.
Inland Water Classes 1. Class A – These waters are designated as a source of public water supply. To the extent compatible with
this use they shall be an excellent habitat for fish, other aquatic life and wildlife, and suitable for primary and

Parker River Watershed Water Quality Assessment Report 2 91wqar.doc DWM CN 54.0
secondary contact recreation. These waters shall have excellent aesthetic value. These waters are designated for protection as Outstanding Resource Waters (ORW’s) under 314 CMR 4.04(3).
2. Class B – These waters are designated as a habitat for fish, other aquatic life, and wildlife, and for primary
and secondary contact recreation. Where designated they shall be suitable as a source of water supply with appropriate treatment. They shall be suitable for irrigation and other agricultural uses and for compatible industrial cooling and process uses. These waters shall have consistently good aesthetic value.
3. Class C – These waters are designated as a habitat for fish, other aquatic life and wildlife, and for secondary
contact recreation. These waters shall be suitable for the irrigation of crops used for consumption after cooking and for compatible industrial cooling and process uses. These waters shall have good aesthetic value.
Coastal and Marine Classes 4. Class SA – These waters are designated as an excellent habitat for fish, other aquatic life and wildlife and for
primary and secondary recreation. In approved areas they shall be suitable for shellfish harvesting without depuration (Open Shellfishing Areas). These waters shall have excellent aesthetic value.
5. Class SB – These waters are designated as a habitat for fish, other aquatic life and wildlife and for primary
and secondary contact recreation. In approved areas they shall be suitable for shellfish harvesting with depuration (Restricted Shellfishing Areas). These waters shall have consistently good aesthetic value.
6. Class SC – These waters are designated as a habitat for fish, other aquatic life, and wildlife and for
secondary contact recreation. They shall also be suitable for certain industrial cooling and process uses. These waters shall have good aesthetic value.
The CWA Section 305(b) water quality reporting process is an essential aspect of the Nation's water pollution control effort. It is the principal means by which EPA, Congress, and the public evaluate existing water quality, assess progress made in maintaining and restoring water quality, and determine the extent of remaining problems. In so doing, the states report on waterbodies within the context of meeting their designated uses (described above in each class). Each class is identified by the most sensitive and, therefore, governing, water uses to be achieved and protected. These uses include: Aquatic Life, Fish Consumption, Drinking Water, Primary and Secondary Contact Recreation, Shellfishing and Aesthetics. Three subclasses of Aquatic Life are also designated in the standards: Cold Water Fishery (capable of sustaining a year-round population of cold water aquatic life, such as trout), Warm Water Fishery (waters that are not capable of sustaining a year-round population of cold water aquatic life), and Marine Fishery (suitable for sustaining marine flora and fauna). The SWQS, summarized in Table 2, prescribes minimum water quality criteria to sustain the designated uses. Furthermore, these standards describe the hydrological conditions at which water quality criteria must be met (MA DEP 1996). In rivers, the lowest flow conditions at and above which criteria must be met are the lowest mean flow for seven consecutive days to be expected once in ten years (7Q10). In artificially regulated waters, the lowest flow conditions at which criteria must be met are the flow equal or exceeded 99% of the time on a yearly basis or another equivalent flow that has been agreed upon. In coastal and marine waters and for lakes the most severe hydrological condition is determined by MA DEP on a case-by-case basis. The availability of appropriate and reliable scientific data and technical information is fundamental to the 305(b) reporting process. It is EPA policy (EPA Order 5360.1 CHG 1) that any organization, performing work for or on behalf of EPA, establishes a quality system to support the development, review, approval, implementation, and assessment of data collection operations. To this end, MA DEP describes its Quality System in an EPA-approved Quality Management Plan to ensure that environmental data collected or compiled by the Agency are of known and documented quality and are suitable for their intended use. For external sources of information, MA DEP requires the following: 1. an appropriate Quality Assurance Project Plan including a laboratory Quality Assurance /Quality Control (QA/QC) plan, 2. use of a state certified lab (certified in the applicable analysis), 3. data management QA/QC are described, and 4. the information be documented in a citable report.

Parker River Watershed Water Quality Assessment Report 3 91wqar.doc DWM CN 54.0
Table 2. Summary of Massachusetts Surface Water Quality Standards (MA DEP 1996). Note: Italics are direct quotations.
Dissolved Oxygen Class A, BCWF*, SA : ≥ 6.0 mg/L and > 75% saturation unless background conditions are lower Class BWWF**, SB: ≥ 5.0 mg/L and > 60% saturation unless background conditions are lower Class C: Not < 5.0 mg/L for more than 16 of any 24 –hour period and not < 3.0 mg/L anytime unless background conditions are lower; levels cannot be lowered below 50% saturation due to a discharge Class SC: Not < 5.0 mg/L for more than 16 of any 24 –hour period and not < 4.0 mg/L anytime unless background conditions are lower; and 50% saturation; levels cannot be lowered below 50% saturation due to a discharge
Temperature Class A: < 68°F (20°C) and Δ 1.5°F (0.8°C) for Cold Water and < 83°F (28.3°C) and Δ 1.5°F (0.8°C) for Warm Water. Note: temperatures are maximum mean monthly Class BCWF: < 68°F (20°C) and Δ3°F (1.7°C) due to a discharge Class BWWF: < 83°F (28.3°C) and Δ3°F (1.7°C) in lakes, Δ5°F (2.8°C) in rivers Class C, SC: <85°F (29.4°C) nor Δ5°F (2.8°C) due to a discharge Class SA: <85°F (29.4°C) nor a maximum daily mean of 80°F (26.7°C) and Δ1.5°F (0.8°C) Class SB: <85°F (29.4°C) nor a maximum daily mean of 80°F (26.7°C) and Δ1.5°F (0.8°C) between July through September and Δ 4.0°F (2.2°C) between October through June
pH Class A, BCWF, BWWF: 6.5 – 8.3 SU and Δ0.5 outside the background range. Class C: 6.5 – 9.0 SU and Δ1.0 outside the naturally occurring range. Class SA, SB: 6.5 – 8.5 SU and Δ0.2 outside the normally occurring range. Class SC: 6.5 – 9.0 SU and Δ0.5 outside the naturally occurring range.
Fecal Coliform Bacteria Class A criteria applied to the Drinking Water Use Class B criteria applied to Primary and Secondary Contact Recreation Uses
Class A: an arithmetic mean of < 20 organisms /100mL in any representative set of samples and < 10% of the samples > 100 organisms/100mL. Class B: a geometric mean of < 200 organisms /100mL in any representative set of samples and < 10% of the samples > 400 organisms /100mL. (This criterion can be applied on a seasonal basis at the discretion of the MA DEP.) Class C: a geometric mean of < 1000 organisms /100ml, and < 10% of the samples > 2000 organisms/100 mL. Class SA: approved Open Shellfish Areas: a geometric mean (MPN method) of < 14 organisms/100 mL and < 10% of the samples > 43 organisms/100mL (MPN method). Waters not designated for shellfishing: < a geometric mean of 200 organisms in any representative set of samples, and < 10% of the samples > 400 organisms /100mL. (This criterion can be applied on a seasonal basis at the discretion of the MA DEP.) Class SB: approved Restricted Shellfish Areas: < a fecal coliform median or geometric mean (MPN method) of 88 organisms/100mL and < 10% of the samples > 260 organisms /100mL (MPN method). Waters not designated for shellfishing: < a geometric mean of 200 organisms in any representative set of samples, and < 10% of the samples > 400 organisms /100mL. (This criterion can be applied on a seasonal basis at the discretion of the MA DEP.) Class SC: < a geometric mean of 1000 organisms/100mL and < 10% of the samples > 2000 organisms/100ml.
Solids All Classes: These waters shall be free from floating, suspended, and settleable solids in concentrations or combinations that would impair any use assigned to each class, that would cause aesthetically objectionable conditions, or that would impair the benthic biota or degrade the chemical composition of the bottom.
Color and Turbidity All Classes: These waters shall be free from color and turbidity in concentrations or combinations that are aesthetically objectionable or would impair any use.
Oil & Grease Class A, SA: Waters shall be free from oil and grease, petrochemicals and other volatile or synthetic organic pollutants. Class SA: Waters shall be free from oil and grease and petrochemicals. Class B, C, SB, SC: Waters shall be free from oil and grease, petrochemicals that produce a visible film on the surface of the water, impart an oily taste to the water or an oily or other undesirable taste to the edible portions of aquatic life, coat the banks or bottom of the water course or are deleterious or become toxic to aquatic life.
Taste and Odor Class A, SA: None other than of natural origin. Class B, C, SB, SC: None in such concentrations or combinations that are aesthetically objectionable, that would impair any use assigned to each class, or that would cause tainting or undesirable flavors in the edible portions of aquatic life.
Aesthetics All Classes: All surface waters shall be free from pollutants in concentrations or combinations that settle to form objectionable deposits; float as debris, scum or other matter to form nuisances; produce objectionable odor, color, taste or turbidity; or produce undesirable or nuisance species of aquatic life.
Toxic Pollutants (EPA 19 November 1999)
All Classes: All surface waters shall be free from pollutants in concentrations or combinations that are toxic to humans, aquatic life or wildlife… The division shall use the recommended limit published by EPA pursuant to 33 USC 1251, 304(a) as the allowable receiving water concentrations for the affected waters unless a site-specific limit is established.
Nutrients Shall not exceed the site-specific limits necessary to control accelerated or cultural eutrophication. *Class BCWF = Class B Cold Water Fishery, ** Class BWWF = Class B Warm Water Fishery, Δ criterion (referring to a change from ambient) is applied to the effects of a permitted discharge.

Parker River Watershed Water Quality Assessment Report 4 91wqar.doc DWM CN 54.0
EPA provides guidelines to the States for making their use support determinations (EPA 1997). The determination of whether or not a waterbody supports each of its designated uses is a function of the type(s), quality and quantity of available current information. Although data/information older than five years are usually considered “historical” and used for descriptive purposes, they can be utilized in the use support determination provided they are known to reflect the current conditions. While the water quality standards (Table 2) prescribe minimum water quality criteria to sustain the designated uses, numerical criteria are not available for every indicator of pollution. Best available guidance in the literature may be applied in lieu of actual numerical criteria (e.g., freshwater sediment data may be compared to Guidelines for the Protection and Management of Aquatic Sediment Quality in Ontario 1993 by D. Persaud, R. Jaagumagi and A. Hayton). Excursions from criteria due to solely “naturally occurring” conditions (e.g., low pH in some areas) do not constitute violations of the standards.
Each designated use within a given segment is individually assessed as 1) support, 2) partial support, or 3) non-support. The term threatened is used when a use is fully supported but may not support the use within two years because of adverse pollution trends or anticipated sources of pollution. When too little current data/information exists or no reliable data are available the use is not assessed. In this report, however, if there is some indication that water quality impairment may exist, which is not “naturally occurring”, the use is identified with an “Alert Status”. Detailed guidance for assessing the status of each use follows in the Designated Uses Section of this report. It is important to note, however, that not all waters are assessed. Many small and/or unnamed ponds, rivers, and estuaries are currently unassessed; the status of their designated uses has never been reported to EPA in the Commonwealth’s 305(b) report nor is information on these waters maintained in the Waterbody System (WBS) database. DESIGNATED USES The Massachusetts Surface Water Quality Standards designate the most sensitive uses for which the surface waters of the Commonwealth shall be enhanced, maintained and protected. Each of these uses is briefly described below (MA DEP 1996):
• AQUATIC LIFE - suitable habitat for sustaining a native, naturally diverse, community of aquatic flora and
fauna. Three subclasses of aquatic life are also designated in the standards for freshwater bodies: Cold Water Fishery - capable of sustaining a year-round population of cold water aquatic life, such as trout; Warm Water Fishery - waters that are not capable of sustaining a year-round population of cold water aquatic life; and Marine Fishery - suitable for sustaining marine flora and fauna.
• FISH CONSUMPTION - pollutants shall not result in unacceptable concentrations in edible portions of marketable fish or for the recreational use of fish, other aquatic life or wildlife for human consumption.
• DRINKING WATER - used to denote those waters used as a source of public drinking water. They may be subject to more stringent regulation in accordance with the Massachusetts Drinking Water Regulations (310 CMR 22.00). These waters are designated for protection as Outstanding Resource Waters under 314 CMR 4.04(3).
• SHELLFISH HARVESTING (in SA and SB segments) – Class SA waters in approved areas (Open Shellfish Areas) shellfish harvested without depuration shall be suitable for consumption; Class SB waters in approved areas (Restricted Shellfish Areas) shellfish harvested with depuration shall be suitable for consumption.
• PRIMARY CONTACT RECREATION - suitable for any recreation or other water use in which there is prolonged and intimate contact with the water with a significant risk of ingestion of water. These include, but are not limited to, wading, swimming, diving, surfing and water skiing.
• SECONDARY CONTACT RECREATION - suitable for any recreation or other water use in which contact with the water is either incidental or accidental. These include, but are not limited to, fishing, boating and limited contact incident to shoreline activities.
• AESTHETICS - all surface waters shall be free from pollutants in concentrations or combinations that settle to form objectionable deposits; float as debris, scum or other matter to form nuisances; produce objectionable odor, color, taste or turbidity; or produce undesirable or nuisance species of aquatic life.
• AGRICULTURAL AND INDUSTRIAL - suitable for irrigation or other agricultural process water and for compatible industrial cooling and process water.
The guidance used to assess the Aquatic Life, Fish Consumption, Drinking Water, Shellfishing, Primary and Secondary Contact Recreation and Aesthetics uses follows.

Parker River Watershed Water Quality Assessment Report 5 91wqar.doc DWM CN 54.0
AQUATIC LIFE USE This use is suitable for sustaining a native, naturally diverse, community of aquatic flora and fauna. The results of biological (and habitat), toxicological, and chemical data are integrated to assess this use. The nature, frequency, and precision of the MA DEP's data collection techniques dictate that a weight of evidence be used to make the assessment, with biosurvey results used as the final arbiter of borderline cases. The following chart provides an overview of the guidance used to assess the status (support, partial support, non-support) of the Aquatic Life Use: Variable (#) - Indicates reference provided at the end of the designated use section
Support – Data available clearly indicates support. Minor excursions from chemical criteria (Table 2) may be tolerated if the biosurvey results demonstrate support.
Partial Support – Uncertainty about support in the chemical or toxicity testing data, or there is some minor modification of the biological community. Excursions not frequent or prolonged.
Non-Support – There are frequent or severe violations of chemical criteria, presence of acute toxicity, or a moderate or severe modification of the biological community.
BIOLOGY Rapid Bioassessment Protocol (RBP) II or III (4)
Non-Impaired Slightly Impaired Moderately or Severely Impaired
Fish Community (4) Best Professional Judgment (BPJ)
BPJ BPJ
Habitat and Flow (4) BPJ BPJ Dewatered streambed due to artificial regulation or channel alteration
Macrophytes (4) BPJ Exotic plant species present, but not dominant, BPJ
Exotic plant species dominant, BPJ
Plankton/ Periphyton (4)
No algal blooms Occasional algal blooms Persistent algal blooms
TOXICITY TESTS Water Column/Ambient (4) >75% survival either 48 hr or 7-
day exposure >50 - <75% survival either 48 hr or 7-day exposure
<50% survival either 48 hr or 7-day exposure
Effluent (4) Meets permit limits (NOTE: if limit is not met, the stream is listed as threatened for 1.0 river mile downstream from the discharge.)
Sediment (4) >75% survival >50 - <75% survival <50% survival CHEMISTRY- WATER DO (3, 6) Criteria (Table 2) Criteria exceeded in 11-25% of
measurements. Criteria exceeded >25% of measurements.
pH (3, 6) Criteria (Table 2) Criteria exceeded in 11-25% of measurements.
Criteria exceeded >25% of measurements.
Temperature (3, 6) 1 Criteria (Table 2) 1 Criteria exceeded in 11-25% of measurements.
Criteria exceeded >25% of measurements.
Turbidity (4) Δ 5 NTU due to a discharge BPJ BPJ Suspended Solids (4) 25 mg/L max., Δ10 mg/L due to a
discharge BPJ BPJ
Nutrients (3) Phosphate-P (4)
Table 2, (Site-Specific Criteria; Maintain Balanced Biocommunity, no pH/DO violations)
BPJ BPJ
Toxic Pollutants (3, 6) Ammonia-N (3, 4) 2
Chlorine (3, 6) 3
Criteria (Table 2) 0.254 mg/L NH3-N 2 0.011 mg/L TRC3
BPJ Criterion is exceed in > 10% of samples.
CHEMISTRY – SEDIMENT Toxic Pollutants (5) 4 < L-EL4, Low Effect Level One pollutant between L-EL and S-EL One pollutant ≥ S-EL (severe) Nutrients (5) < L-EL Between L-EL and S-EL ≥ S-EL Metal Normalization to Al or Fe (4)
Enrichment Ratio < 1 Enrichment Ratio >1 but <10 Enrichment Ratio >10
CHEMISTRY- EFFLUENT Compliance with permit limits (4)
In-compliance with all limits NOTE: If the facility does not meet their permit limits, the information is used to threaten one river mile downstream from the discharge.
CHEMISTRY-TISSUE PCB – whole fish (1) <500 μg/kg wet weight BPJ BPJ DDT (2) <14.0 μg/kg wet weight BPJ BPJ PCB in aquatic tissue (2) <0.79 ng TEQ/kg wet weight BPJ BPJ
1maximum daily mean T in a month (minimum six measurements evenly distributed over 24-hours) less than criterion, 2Ammonia levels for pH of 9.0, actual “criterion” varies with pH and is evaluated case-by-case. 3 The minimum quantification level for TRC is 0.05 mg/L. 4For the purpose of this report, the S-EL for total PCB in sediment (which varies with TOC content) with 1% TOC is 5.3 ppm while a sediment sample with 10% TOC is 53 ppm. Note: National Academy of Sciences/National Academy of Engineering (NAS/NAE) guideline for maximum organochlorine concentrations (i.e., total PCB) in fish tissue for the protection of fish-eating wildlife is 500μg/kg wet weight (ppb, not lipid-normalized). PCB data (tissue) in this report are presented in μg/kg wet weight (ppb) and are not lipid-normalized to allow for direct comparison to the NAS/NAE guideline.

Parker River Watershed Water Quality Assessment Report 6 91wqar.doc DWM CN 54.0
FISH CONSUMPTION USE Pollutants shall not result in unacceptable concentrations in edible portions of marketable fish or for the recreational use of fish, other aquatic life or wildlife for human consumption. The assessment of this use is made using the most recent list of Fish Consumption Advisories issued by the Massachusetts Executive Office of Health and Human Services, Department of Public Health (MDPH), Bureau of Environmental Health Assessment (MDPH 2001a). The MDPH list identifies waterbodies where elevated levels of a specified contaminant in edible portions of freshwater species poses a health risk for human consumption. Hence, the Fish Consumption Use is assessed as non-support in these waters. In July 2001, MDPH issued new consumer advisories on fish consumption and mercury contamination. The MDPH “…is advising pregnant women, women of childbearing age who may become pregnant, nursing mothers and children under 12 years of age to refrain from eating the following marine fish; shark, swordfish, king mackerel, tuna steak and tilefish. In addition, MDPH is expanding its previously issued statewide fish consumption advisory which cautioned pregnant women to avoid eating fish from all freshwater bodies due to concerns about mercury contamination, to now include women of childbearing age who may become pregnant, nursing mothers and children under 12 years of age (MDPH 2001b).” Additionally, MDPH “…is recommending that pregnant women, women of childbearing age who may become pregnant, nursing mothers and children under 12 years of age limit their consumption of fish not covered by existing advisories to no more than 12 ounces (or about 2 meals) of cooked or uncooked fish per week. This recommendation includes canned tuna, the consumption of which should be limited to 2 cans per week. Very small children, including toddlers, should eat less. Consumers may wish to choose to eat light tuna rather than white or chunk white tuna, the latter of which may have higher levels of mercury (MDPH 2001b).” MDPH’s statewide advisory does not include fish stocked by the state Division of Fisheries and Wildlife or farm-raised fish sold commercially. Because of the statewide advisory, however, no waters can be assessed as support or partial support for the Fish Consumption Use. The following is an overview of the guidance used to assess the status (support, partial support, non-support) of the Fish Consumption Use.
Variable (#) - Indicates reference provided at the end of the designated use section
Support – No restrictions or bans in effect
Partial Support – A "restricted consumption" fish advisory is in effect for the general population or a sub-population that could be at potentially greater risk (e.g., pregnant women, and children
Non-Support – A "no consumption" advisory or ban in effect for the general population or a sub-population for one or more fish species; or there is a commercial fishing ban in effect
MDPH Fish Consumption Advisory List (8,12)
Not applicable, precluded by statewide advisory (Hg) Not applicable Waterbody on MDPH Fish
Consumption Advisory List
Other statewide advisories that MDPH has previously issued and are still in effect are as follows (MDPH 2001b):
1. Due to concerns about chemical contamination, primarily from polychlorinated biphenyl compounds (PCBs) and other contaminants, no individual should consume lobster tomalley from any source. Lobster tomalley is the soft green substance found in the tail and body section of the lobster.
2. Pregnant and breastfeeding women and those who are considering becoming pregnant should not eat bluefish due to concerns about PCB contamination in this species.

Parker River Watershed Water Quality Assessment Report 7 91wqar.doc DWM CN 54.0
DRINKING WATER USE The term Drinking Water Use denotes those waters used as a source of public drinking water. These waters may be subject to more stringent regulation in accordance with the Massachusetts Drinking Water Regulations (310 CMR 22.00). They are designated for protection as Outstanding Resource Waters (ORW) in 314 CMR 4.04(3). MA DEP’s Drinking Water Program (DWP) has primacy for implementing the provisions of the federal Safe Drinking Water Act (SDWA). Except for suppliers with surface water sources for which a waiver from filtration has been granted (these systems also monitor surface water quality) all public drinking water supplies are monitored as finished water (tap water). Monitoring includes the major categories of contaminants established in the SDWA: bacteria, volatile and synthetic organic compounds, inorganic compounds and radionuclides. The DWP maintains current drinking supply monitoring data. The status of the supplies is currently reported on a statewide basis to EPA in the 305(b) report. Below is EPA’s guidance to assess the status (support, partial support, non-support) of the drinking water use.
Variable (#) - Indicates reference provided at the end of the designated use section
Support – No closures or advisories (no contaminants with confirmed exceedances of maximum contaminant levels, conventional treatment is adequate to maintain the supply).
Partial Support – Is one or more advisories or more than conventional treatment is required
Non-Support – One or more contamination-based closures of the water supply
Drinking Water Program (DWP) Evaluation See note below See note below See note below
Note: While this use is not assessed in this report, information on drinking water source protection and finish water quality is available at http://www.mass.gov/dep/water/drinking.htm and from the Parker River Watershed’s public water suppliers.
SHELLFISHING USE
This use is assessed using information from the Department of Fisheries, Wildlife and Environmental Law Enforcement's Division of Marine Fisheries (DMF). A designated shellfish growing area is an area of potential shellfish habitat. Growing areas are managed with respect to shellfish harvest for direct human consumption, and comprise at least one or more classification areas. The classification areas are the management units, and range from being approved to prohibited (listed below) with respect to shellfish harvest. Shellfish areas under management closures are not assessed.
Variable (#) - Indicates reference provided at the end of the designated use section
Support – SA Waters—Approved1 SB Waters— Approved1, Conditionally Approved2 or Restricted3
Partial Support – SA Waters— Conditionally Approved2, Restricted3, or Conditionally Restricted4
SB Waters—Conditionally Restricted4
Non Support – SA Waters—Prohibited5 SB Waters— Prohibited5
Division of Marine Fisheries Shellfish Project Classification Area Information (11)
Reported by DMF Reported by DMF Reported by DMF
1 Approved - "...open for harvest of shellfish for direct human consumption subject to local rules and regulations..." An approved area is open all the time and closes only due to hurricanes or other major coastwide events.
2 Conditionally Approved - "...subject to intermittent microbiological pollution..." During the time the area is open, it is "...for harvest of shellfish for direct human consumption subject to local rules and regulations…" A conditionally approved area is closed some of the time due to runoff from rainfall or seasonally poor water quality. When open, shellfish harvested are treated as from an approved area.
3 Restricted - area contains a "limited degree of pollution." It is open for "harvest of shellfish with depuration subject to local rules and state regulations" or for the relay of shellfish. A restricted area is used by DMF for the relay of shellfish to a less contaminated area.
4 Conditionally Restricted - "...subject to intermittent microbiological pollution..." During the time area is restricted, it is only open for "the harvest of shellfish with depuration subject to local rules and state regulations." A conditionally restricted area is closed some of the time due to runoff from rainfall or seasonally poor water quality. When open, only soft-shell clams may be harvested by specially licensed diggers (Master/Subordinate Diggers) and transported to the DMF Shellfish Purification Plant for depuration (purification).
5 Prohibited - Closed for harvest of shellfish.

Parker River Watershed Water Quality Assessment Report 8 91wqar.doc DWM CN 54.0
PRIMARY CONTACT RECREATION USE This use is suitable for any recreational or other water use in which there is prolonged and intimate contact with the water with a significant risk of ingestion of water (1 April to 15 October). These include, but are not limited to, wading, swimming, diving, surfing and water skiing. The chart below provides an overview of the guidance used to assess the status (support, partial support, non-support) of the Primary Contact Recreation Use.
Variable (#) - Indicates reference provided at the end of the designated use section
Support – Criteria are met, no aesthetic conditions that preclude the use
Partial Support – Criteria exceeded intermittently (neither frequent nor prolonged), marginal aesthetic violations
Non-Support – Frequent or prolonged violations of criteria, formal bathing area closures, or severe aesthetic conditions that preclude the use
Fecal Coliform Bacteria (3, 9) *
Criteria met OR Dry Weather Guidance <5 samples--<400/100mL maximum Wet Weather Guidance Dry weather samples meet and wet samples <2000/100mL
Guidance exceeded in 11-25% of the samples OR Wet Weather Dry weather samples meet and wet samples >2000/100mL
Guidance exceeded in > 25% of the samples
pH (3, 6) Criteria exceeded in <10 % of the measurements
Criteria exceeded in 11-25% of the measurements
Criteria exceeded in >25% of the measurements
Temperature (3) Criteria met Criteria exceeded 11-25% of the time Criteria exceeded 25% of the time Color and Turbidity (3, 6)
BPJ, Δ 5 NTU (due to a discharge) exceeded in <10 % of the measurements
BPJ, Guidance exceeded in 11-25% of the measurements
BPJ, Guidance exceeded in >25% of the measurements
Secchi disk depth (10) **
Lakes - >1.2 meters (> 4’) Infrequent excursions from the guidance
Frequent and/or prolonged excursions from the guidance
Oil & Grease (3) Criteria met BPJ, criteria exceeded 11-25% of the time
BPJ, criteria exceeded >25% of the time
Aesthetics (3) Biocommunity (4)**
No nuisance organisms that render the water aesthetically objectionable or unusable, BPJ; Cover of macrophytes < 50% within any portion of the lake area at maximum extent of growth.
BPJ, Cover of macrophytes 50-75% within any portion of the lake area at maximum extent of growth.
BPJ, Cover of macrophytes >75 within any portion of the lake area at maximum extent of growth.
Note: Excursions from criteria due to natural conditions are not considered impairment of use. * Fecal coliform bacteria interpretations require additional information in order to apply this use assessment guidance. Small/limited datasets require an evaluation of survey conditions (i.e., interpretation of the amount of precipitation received in the subject region immediately prior to sampling and streamflow conditions) to determine whether the fecal coliform bacteria results are representative of dry or wet weather/storm water runoff conditions. When larger data sets are available, the frequency of standards/guidance exceedances is calculated. **Any portion of a lake exhibiting impairment of the Primary Contact Recreation Use (swimmable) because of macrophyte cover and/or transparency (Secchi disk depth) is assessed as either partial or non-support. If no fecal coliform bacteria data are available and the lake (entirely or in part) met the transparency (Secchi disk depth) and aesthetics guidance, this use is not assessed.

Parker River Watershed Water Quality Assessment Report 9 91wqar.doc DWM CN 54.0
SECONDARY CONTACT RECREATION USE This use is suitable for any recreation or other water use in which contact with the water is either incidental or accidental. These include, but are not limited to, fishing, boating and limited contact incident to shoreline activities. Following is an overview of the guidance used to assess the status (support, partial support, non-support) of the Secondary Contact Recreation Use. Variable (#) - Indicates reference provided at the end of the designated use section
Support – Criteria are met, no aesthetic conditions that preclude the use
Partial Support – Criteria exceeded intermittently (neither frequent nor prolonged), marginal aesthetic violations
Non-Support – Frequent or prolonged violations of criteria, or severe aesthetic conditions that preclude the use
Fecal Coliform Bacteria (4) *
Dry Weather Guidance <5 samples--<2000 cfu/100mL maximum >5 samples--<1000 cfu/100mL geometric mean < 10% samples >2000 cfu/100mL Wet Weather Guidance Dry weather samples meet and wet samples <4000 cfu/100mL
Wet Weather Guidance Dry weather samples meet and any wet samples >4000 cfu/100mL
Criteria exceeded in dry weather
Oil & Grease (3) Criteria met Criteria exceeded 11-25% of the time, BPJ
Criteria exceeded >25% of the time, BPJ
Aesthetics (3) Biocommunity (4) **
No nuisance organisms that render the water aesthetically objectionable or unusable, BPJ; Cover of macrophytes < 50% within any portion of the lake area at maximum extent of growth.
BPJ, Cover of macrophytes 50-75% within any portion of the lake area at maximum extent of growth.
BPJ, Cover of macrophytes >75 within any portion of the lake area at maximum extent of growth.
Note: Excursions from criteria due to natural conditions are not considered impairment of use. * Fecal coliform bacteria interpretations require additional information in order to apply this use assessment guidance. Small/limited datasets require an evaluation of survey conditions (i.e., interpretation of the amount of precipitation received in the subject region immediately prior to sampling and streamflow conditions) to determine whether the fecal coliform bacteria results are representative of dry or wet weather/storm water runoff conditions. When larger data sets are available, the frequency of standards/guidance exceedances is calculated. ** In lakes if no fecal coliform data are available, macrophyte cover is the only criterion used to assess the Secondary Contact Recreation Use. For the Primary and Secondary Contact Recreation Uses the following steps are taken to interpret the fecal coliform bacteria results: 1. Identify the range of fecal coliform bacteria counts, 2. Calculate the geometric mean (monthly, seasonally, or on dataset), (Note: the geometric mean is
only calculated on datasets with >5 samples collected within a 30-day period.) 3. Calculate the % of sample results exceeding 400 cfu/100mL, 4. Determine if the samples were collected during wet or dry weather conditions (review precipitation
and streamflow data) • Dry weather can be defined as: No/trace antecedent (to the sampling event) precipitation that
causes more than a slight increase in stream flow. • Wet weather can be defined as: Precipitation antecedent to the sampling event that results in
a marked increase in stream flow. 5. Apply the following to interpret dry weather data:
• <10% of the samples exceed criteria (step 2 and 3, above) - assess as Support, • 11-25% of the samples exceed criteria (step 2 and 3, above) - asses as Partial Support, • >25% of the samples exceed criteria (step 2 and 3, above) - assess as Non-Support.
6. Apply the following to interpret wet weather data: • Dry weather samples meet criteria and all wet samples <4000 cfu/100mL - assess as
Support, • Dry weather samples meet criteria and any wet samples >4000 cfu/100mL - assess as Partial
Support.

Parker River Watershed Water Quality Assessment Report 10 91wqar.doc DWM CN 54.0
AESTHETICS USE All surface waters shall be free from pollutants in concentrations or combinations that settle to form objectionable deposits; float as debris, scum or other matter to form nuisances; produce objectionable odor, color, taste or turbidity; or produce undesirable or nuisance species of aquatic life. The aesthetic use is closely tied to the public health aspects of the recreational uses (swimming and boating). Below is an overview of the guidance used to assess the status (support, partial support, non-support) of the Aesthetics Use.
Variable (#) - Indicates reference provided at the end of the designated use section
Support – 1. No objectionable bottom deposits, floating debris, scum, or nuisances; 2. No objectionable odor, color, taste or turbidity, or nuisance aquatic life
Partial Support – Objectionable conditions neither frequent nor prolonged
Non-Support – Objectionable conditions frequent and/or prolonged
Aesthetics (3)* Visual observation (4) Criteria met BPJ (spatial and temporal extent
of degradation) BPJ (extent of spatial and temporal degradation)
* For lakes, the aesthetic use category is generally assessed at the same level of impairment as the more severely impaired recreational use category (Primary or Secondary Contact).
Designated Use References 1. Coles, J.C. 1998.Organochlorine Compounds in Fish Tissue from the Connecticut, Housatonic and Thames River Basins
Study Unit, 1992-94. National Water-Quality Assessment Program. U.S. Department of the Interior, U.S. Geological Survey. Marlborough, MA.
2. Environment Canada. 04 November 1999. Canadian Environmental Quality Guidelines. [Online]. Environment Canada. http://www.ec.gc.ca/ceqg-rcqe/tistbl_e.doc [28 September 1998].
3. MA DEP. 1996. (Revision of 1995 report). Massachusetts surface water quality standards. Massachusetts Department of Environmental Protection, Division of Water Pollution Control, Technical Services Branch. Westborough, MA (Revision of 314 CMR 4.00, effective June 23, 1996).
4. MA DEP. 1999. Open File. Department of Watershed Management 305(b) Assessment Guidance. Massachusetts Department of Environmental Protection, Division of Watershed Management. Worcester, MA
5. Persaud, D., R. Jaagumagi, and A. Hayton. 1993. Guidelines for the protection and management of aquatic sediment quality in Ontario. Water Resources Branch, Ontario Ministry of the Environment. Queen’s Printer for Ontario. Canada.
6. EPA. 1997. Guidelines for Preparation of the Comprehensive State Water Quality Assessments (305(b) Reports) and Electronic Updates: Supplement. Assessment and Watershed Protection Division (4503F), Office of Wetlands, Oceans and Watersheds, Office of Water, U.S. Environmental Protection Agency. Washington, DC.
7. EPA. 19 November 1999. Federal Register Document. [Online]. United States Environmental Protection Agency. http://www.epa.gov/fedrgstr/EPA-WATER/1998/December/Day-10/w30272.htm.
8. MDPH. 1999. Freshwater Fish Consumption Advisory List. The Commonwealth of Massachusetts, Bureau of Environmental Health Assessment. Boston, MA.
9. Kimball, W.A., 1996. Memorandum to 305(b) Committee. Re: Small data sets/ wet weather data. Massachusetts Department of Environmental Protection, Office of Watershed Management. Grafton, MA.
10. MDPH. 1969. Article 7 Regulation 10.2B of the State Sanitary Code. Commonwealth of Massachusetts. Department of Public Health. Boston, MA.
11. Churchill, N. 1999. Personal Communication. Shellfish Project Classification Area Information as of 1 January 1999. Department of Fisheries, Wildlife, and Environmental Law Enforcement, Division of Marine Fisheries. Pocasset, MA.
12. MDPH. 2001b. Public Health Statewide Fish Consumption Advisory. Massachusetts Department of Public Health. Boston, MA.

Parker River Watershed Water Quality Assessment Report 11 91wqar.doc DWM CN 54.0
PARKER RIVER WATERSHED DESCRIPTION AND CLASSIFICATION DESCRIPTION The Parker River Watershed and Coastal Drainage Area (Figure 5) lies between the Merrimack and Ipswich River Watersheds in northeastern Massachusetts. All or parts of nine communities lie within the 82 square mile watershed; Boxford, Georgetown, Groveland, Ipswich, Newbury, Newburyport, North Andover, Rowley, and West Newbury. The Parker River Watershed and Coastal Drainage Area is generally rural-residential in nature, with minor industrial development mostly confined to the headwaters of the Little River tributary. The Parker River is the largest tributary to Plum Island Sound. It is formed at the confluence of two unnamed brooks in a wetland area in west Boxford. The river flows generally in a northeasterly direction through several small ponds and extensive wetland areas in the towns of Boxford, Georgetown, Groveland, and Newbury. In Newbury, the Parker River becomes tidal with the last nine miles of the river subject to the rise of the tide. The Parker River flows through extensive coastal wetlands to its mouth where it empties into Plum Island Sound. The Parker River National Wildlife Refuge is located at the mouth of the Parker River. This refuge consists of 4,650 acres of sand dunes, salt marsh, freshwater marsh, and glacial upland. Also included in the refuge are six miles of ocean beach along the eastern side of Plum Island. The Parker River is approximately 23 miles long, and has an average discharge into Plum Island Sound of 97.2 cfs. From the source to its mouth, the Parker River falls a total of 95 feet, of which 36 feet are taken up by the six dams located on the river. The United States Geological Survey (USGS) maintains one gaging station (No. 01101000) on the Parker River at Byfield (town of Newbury) which has provided continuous daily discharge records since 1945. The mean flow of the Parker River at this site (drainage area of 21.3 mi2) is 37.2 cfs (Socolow et. al 2000). The estimated seven-day mean low flow, with a recurrence interval of 10 years, is 0.163 at this gage (USGS 1998). Plum Island Sound also receives the flow from Plum Island River and several of its small tributaries (Pine Island Creek and Jericho Creek). The northern extent of the Plum Island River is hydrologically connected to the Merrimack River Watershed at extreme high tides. Under these conditions, water passes over the “high sandy” sandbar and into Pine Island Creek, Newbury. On the next tide cycle, these waters leave Pine Island Creek and flow southward thus connecting the Merrimack River Basin to the Parker River Watershed via the Plum Island River (Gaines and Carr 1992). From the southwest Plum Island Sound is fed by the Rowley and Eagle Hill river systems, as well as the Ipswich River. Plum Island Sound then flows into Ipswich Bay. There are 37 named streams in the Parker River Watershed that have been assigned SARIS (Stream and River Information System) code numbers (Halliwell et al. 1982). These streams and rivers flow an estimated 76 miles. Seventeen ponds/impoundments totaling 322.6 acres (the term "ponds" will hereafter be used to include both) have been identified and assigned Pond and Lake Information System (PALIS) code numbers in the Parker River Watershed (Ackerman 1989 and MA DEP 2001a). The total area of estuarine waters in the Parker River Watershed is approximately 14.3 square miles. [Note: A variety of sources have been used to determine the river length, and pond and estuarine area including the WBS database, diagnostic/feasibility studies, and 1:25,000 MassGIS datalayers. Future plans are to base all size determinations on the most accurate MassGIS datalayers available.] According to climate statistics collected by the National Oceanic and Atmospheric Administration (NOAA), 1999 was the driest growing season on record in several Northeast states including Massachusetts. Additionally, streamflow data collected by the U.S. Geological Survey showed that the average monthly stream flows in June were lower than have been recorded in decades. Data from 30 USGS streamflow
CHICOPEE
T A U N T O N
SuAs C o NASHUA
CONNECTICUTWESTFIELD
C A P E COD
MILLERS
C H A R L E S
DEERFIELD
BLACKSTONE
B U Z Z A R D S B A Y
M E R R I M A C K HUDSONI P S W I C H
S O U T H C O A S T A L QUINEBAUG
B O S T O N H A R B O R FARMINGTON
I S L ANDS
N O R T H C O A S T A L S H A W S H
E E N
TE N M I L E NARRA G A N S E T T B A Y
HOUSATONIC
FRENCH
Figure 5. Location of Parker River Watershed.

Parker River Watershed Water Quality Assessment Report 12 91wqar.doc DWM CN 54.0
stations, each having more than 40 years of measurements, showed the lowest average flow recorded for June at ten of the stations. Of these ten stations, seven are in eastern Massachusetts. At the Ipswich River South Middleton station, the previous recorded low for June was 7.36 cfs in 1966. The 1999 low flow measurement for June was 6.55 cfs - 11% lower (USGS 5 June 2001). CLASSIFICATION Consistent with the National Goal Uses of “fishable and swimmable waters”, the classification of waters in the Parker River Watershed and tributaries to and including Plum Island Sound (listed as part of the Merrimack River Basin), according to the SWQS, include the following (MA DEP 1996): Class A
• Bull Brook Reservoir, Reservoir to outlet in Ipswich and those tributaries thereto (PWS) • Dow Brook Reservoir, Reservoir to outlet in Ipswich and those tributaries thereto (PWS)
Class SA
• Parker River, tidal portion and tributaries thereto (outstanding resource water - ORW) • Mill River, tidal portion and tributaries thereto (ORW) • Eagle Hill River, entire length and tributaries thereto (ORW) • Third Creek, entire length (ORW) • Roger Island River, entire length and tributaries thereto (ORW) • Rowley River, entire length and tributaries thereto (ORW) • Egypt River, entire length and tributaries thereto (ORW) • Mud Creek, entire length and tributaries thereto (ORW)
And tributaries to and including Plum Island Sound (listed in the Merrimack River Basin): • Plum Island River, entire length (ORW) • Plum Island Sound (ORW) • Pine Island Creek and Jericho Creek (ORW)
Class B
• Parker River, source to tidal portion (High Quality Water) • Mill River, source to tidal portion and tributaries thereto (ORW) • Freshwater portions of Eagle Hill River, Third Creek, Roger Island River, Rowley River, Egypt
River, and Mud Creek. And tributaries to Plum Island Sound (listed in the Merrimack River Basin):
• Pine Island Creek and Jericho Creek.
The designation of ORW is applied to those waters with exceptional socio-economic, recreational, ecological and/or aesthetic values (Rojko et al. 1995). ORWs have more stringent requirements than other waters because the existing use is so exceptional or the perceived risk of harm is such that no lowering of water quality is permissible. ORWs include certified vernal pools, all designated Class A Public Water Supplies, and may include surface waters found in National Parks, State Forests and Parks, Areas of Critical Environmental Concern (ACECs) and those protected by special legislation (MA DEM 1993). Wetlands that border ORWs are designated as ORWs to the boundary of the defined area. The Parker River/Essex Bay ACEC includes 25,500 acres of barrier beach, dunes, salt marsh, and waterbodies. Plum Island and Castle Neck are two of the relatively few major, undeveloped barrier beaches in the Commonwealth. They are over 10 miles in length combined, with most of the area protected under public or private management. More than 10,000 acres of salt marsh make this the largest salt marsh system north of Long Island, New York. Included within the ACEC is the 4662-acre Parker River National Wildlife Refuge, known as an important site on the Atlantic Fly-way Migration route. More than 60 bird species breed here, including the rare seaside sparrow and the least tern. Over 300 species of birds have been sighted in this area, including 75 rare species. During the spring and fall migrations, concentrations of up to 25,000 ducks and 6000 Canadian Geese have been noted. Waters of the ACEC contain vast amounts of shellfish and host some

Parker River Watershed Water Quality Assessment Report 13 91wqar.doc DWM CN 54.0
of the largest anadromous fish runs of alewives and smelt on the North Shore. Other protected open space within the Parker River/Essex Bay ACEC includes the Crane Reservation, Crane Wildlife Refuge, and Plum Island State Park (MA DEM 2000). Unlisted waters in the Parker River Watershed/Plum Island Sound Coastal Drainage Area, not otherwise designated in the SWQS, are Class B, High Quality Waters, for inland waters and Class SA, High Quality Waters, for coastal and marine waters. According to the SWQS, where fisheries designations are necessary, they shall be made on a case-by-case basis.
SUMMARY OF EXISTING CONDITIONS AND PERCEIVED PROBLEMS The following is excerpted from the unpublished Draft Parker River Watershed 1994 Assessment, which was based on water quality survey data collected by MA DEP (formerly Department of Environmental Quality Engineering) in the Parker River Watershed in 1975, 1978, 1984 and 1994 (Beskenis 1996).
[From its headwaters in Boxford, the Parker River flows sluggishly through approximately four miles of wetland where enhanced primary production and subsequent decomposition of organic matter result in downstream oxygen depletion and slight nutrient enrichment. This natural phenomenon is clearly demonstrated by water quality data, which consistently exhibits low dissolved oxygen concentration and elevated instream nitrogen and phosphorus concentrations. It is important to note that despite the increase of dissolved nutrients that leach out of the wetland areas along the Parker River, instream ammonia nitrogen and phosphorus concentrations are slightly lower than those in rivers and streams in Massachusetts that are impacted by point sources of pollution. The total phosphorus concentrations in particular showed very low values along the river. Immediately downstream from these wetlands the Parker River flows through two ponds (i.e., Rock and Pentucket), which act as nutrient sinks. In these large ponds primary producers convert dissolved nitrogen and phosphorus to biomass, which, in turn, is assimilated by heterotrophic organisms. Decomposition products (e.g., nutrients) are not carried downstream as in the free-flowing segments of the Parker River, but settle to the bottom where they are incorporated into the sediments. Downstream from the outlet of Pentucket Pond, the Parker River flows freely for approximately seven miles before it is impounded by a dam at Central Street in Newbury. Although the river continues to drain extensive wetland areas, rearation characteristics are such that dissolved oxygen concentrations remain consistently higher than in the wetland segment upstream from Rock Pond. Nevertheless, dissolved oxygen depletion to concentrations below the Class B standard is not unusual. Several tributaries of the Parker River have been impacted by nonpoint sources of pollution as evidenced by one or more of the following: low dissolved oxygen concentrations, elevated nutrient levels and relatively high fecal coliform counts. These tributaries include Penn and Wheeler (and its tributary Jackman) brooks, Cart Creek, and the Mill and Little rivers. A Section 319 nonpoint source project (No. 94-07) was awarded to the Massachusetts Audubon Society to address the nonpoint sources of pollution in the Mill River Subwatershed.]
The Clean Water Act Section 303(d) requires states to identify those waterbodies that are not meeting Surface Water Quality Standards. Table 3 identifies the waterbodies in the Parker River Watershed/ Plum Island Sound Coastal Drainage Area that are on the 1998 Massachusetts Section 303(d) list of waters (MA DEP 1999a). Additionally, all freshwaters in Massachusetts are technically (by default) listed in 1998 as 303(d) waters with mercury as the associated stressor/pollutant due to the 1994 MDPH Interim Freshwater Fish Consumption Advisory. This Interim Freshwater Fish Consumption Advisory was aimed at pregnant women only; the general public was not considered to be at risk from fish consumption. MDPH’s interim advisory does not include fish stocked by the state Division of Fisheries and Wildlife or farm-raised fish sold commercially (MDPH 1994).

Parker River Watershed Water Quality Assessment Report 14 91wqar.doc DWM CN 54.0
Table 3. 1998 303(d) list of waters in the Parker River Watershed
1998 303(d) Listed Waterbody Cause of Impairment
Eagle Hill MA91-06 Headwaters near Town Farm Road, Ipswich to the mouth at Plum Island Sound Pathogens
Paine Creek MA91-03 Headwaters to confluence with Eagle Hill River Pathogens
Rowley River MA91-05 Confluence with Egypt River and Muddy Run to mouth at Plum Island Sound Pathogens
Parker River MA91-02 Central Street to mouth at Plum Island Sound, Newbury Pathogens
Parker River* MA91-01 Source in Boxford to Central Street, Newbury Flow alteration Baldpate Pond MA91001 Boxford Noxious aquatic plants Central Street Pond MA91003 Rowley Noxious aquatic plants Crane Pond MA91004 Groveland Noxious aquatic plants Lower Mill Pond MA91008 Rowley Noxious aquatic plants Sperrys Pond MA91013 Boxford Noxious aquatic plants State Street Pond MA91014 Newburyport Noxious aquatic plants Upper Mill Pond MA91015 Rowley Noxious aquatic plants Wilson Pond MA91017 Rowley Noxious aquatic plants
Plum Island River** MA91-15 (MA84A-23)
From Chances Island to mouth at Plum Island Sound Pathogens
Plum Island Sound**
MA91-12 (MA84A-24) Includes Ipswich Bay Pathogens
*needs confirmation (additional data collection is necessary to confirm the presence of impairment) ** Listed in the Merrimack River basin Between 1991 and 1994 the Massachusetts Audubon Society conducted water quality sampling, shoreline/source identification and land use research in the Plum Island Sound (including the Mill River subwatershed) as part of a Massachusetts Bays Program Minibays project (Buchsbaum et al. 1996). Water quality data identified that contaminated storm water runoff and septic system effluent are the major nonpoint sources of contamination to the Plum Island Sound watershed. This study indicated that storm water runoff contained contaminants from roadways, parking lots, lawn fertilizers, and animal waste. Additionally septic systems were identified as a major contributor of contaminants due to systems that are failing/leaking; inadequately sized, sited or designed; and in need of pumping repair or replacement.
SOURCES OF INFORMATION Multiple local, state and federal agencies provided information used in the water quality assessment of the Parker River Watershed. Within the MA DEP information was obtained from three programmatic bureaus: Bureau of Resource Protection (BRP, see below), Bureau of Waste Prevention (industrial wastewater discharge information) and the Bureau of Waste Site Cleanup (hazardous waste site cleanup information). Specifically, the BRP Division of Watershed Management (DWM) Watershed Planning Program provided water quality, habitat assessment, biological data, and pond synoptic survey data. The MA DEP Northeast Regional Office, Parker River Watershed Team, MA DEP DWP and the DWM Watershed Permitting Program (Water Management Act, and National Pollutant Discharge Elimination System permits) provided water withdrawal and wastewater discharge permit information. [Note: The BRP DWP evaluates the status of the Drinking Water Use and this information is, therefore, not provided in this assessment report.] Projects funded through various MA DEP grant and loan programs also provide valuable information that may be used in the water quality assessment report. A summary of these projects for the Parker River Watershed is provided in Appendix D. The USGS, as part of their National Water-Quality Assessment (NAWQA) Program in the New England Coastal Basins study unit (Maine, Massachusetts, New Hampshire, and Rhode Island) initiated a New England Coastal Basin (NECB) Mercury Study in 1999 when the results of their National Mercury Pilot Study showed some of the highest mercury concentrations in the country were in the NECB study area (USGS August 2000). The dominant source of mercury identified in the NECB study area was

Parker River Watershed Water Quality Assessment Report 15 91wqar.doc DWM CN 54.0
atmospheric deposition. In collaboration with USGS’s Toxics Substances Hydrology Program (an extension of the National Mercury Pilot Study) and Urban Land Use Gradient Study (part of the NAWQA program), USGS collected sediment, water, and/or fish for total and/or methyl mercury analysis from 22 streams north of Boston in 1999 and 30 sites in the NECB in 2000. The Parker River at Byfield was sampled by USGS in July 1999 (sediment and water column). These data, however, are not yet available. In 1994, MDPH issued a statewide Interim Freshwater Fish Consumption Advisory for mercury (MDPH 1994). This precautionary measure was aimed at pregnant women only; the general public was not considered to be at risk from fish consumption. The advisory encompasses all freshwaters in Massachusetts therefore the Fish Consumption Use cannot be assessed as support. In July 2001, MDPH issued a new, more inclusive, fish consumption advisory for both fresh and salt waters in the Commonwealth (MDPH 2001b). Currently, there are two site-specific fish consumption advisories for water bodies in the Parker River Watershed (Rock and Pentucket ponds) because of elevated mercury concentrations in fishes (MDPH 2001a). The Division of Marine Fisheries (DMF) Shellfish Management Program maintains information used to classify (e.g., approved, conditionally approved, prohibited) their shellfish management areas. These classifications are subsequently used to regulate the harvesting of various shellfish (DFWELE 2000). DMF shellfish management areas include acreage in the Parker River Watershed not specifically addressed (i.e., designated as a segment) in this report. Appendix E includes the complete listing of DMF shellfishing closures as of October 2000 in the Parker River/Plum Island Sound Coastal Drainage Area. DMF conducts fecal coliform bacteria sampling as part of their sanitary surveys by which shellfish growing area classifications are assigned. These surveys also include shellfish species identification, habitat location, relative abundance and documentation of related fisheries. A shoreline survey is conducted to identify pollution sources and evaluate potential impacts with the understanding that hydrographic characteristics may influence contaminant distribution and removal over the growing area. Supplementary analysis may be required for naturally occurring pathogens (i.e. Vibrio spp.), marine biotoxins (i.e. Paralytic Shellfish Poisoning) as well as hazardous wastes in growing areas with a known history of contamination by these harmful substances. Sanitary surveys must be repeated at least every twelve years for growing areas classified other than Prohibited (Kennedy 2001). However, survey information is kept current as well as updated through annual and triennial reports and classifications are maintained with extensive monitoring. A growing area classification may be downgraded and management plans amended, based on the findings of annual and triennial reviews. Classification upgrades can only be made based on the findings of a full sanitary survey. Specifically, sanitary surveys on waters in the Parker River Watershed were conducted during dry weather conditions, while the areas were open to digging. In addition to state and federal agencies, regional, local and citizen monitoring groups in the watershed management process provided valuable data/information which may be used to indicate areas of degraded water quality, as well as causes and sources of contamination. The Parker River Clean Water Association (PRCWA) is a community non-profit organization dedicated to promoting the restoration and protection of the waters and environment of the Parker River and Plum Island Sound watersheds (PRCWA 19 November 2000). PRCWA volunteers monitor approximately 20 sites within the watershed on a regular basis. These monitoring locations include five stations on the freshwater segment of the Parker River (Baily Lane, Mill Street, Thurlow Street, River Street and Central Street); one station on the estuarine segment of the Parker River (Newbury Docks); three stations on the Little River (Parker Street, Hanover Street, Newman Road); two stations on the Mill River (Glenn Mills and Governor Dummer Academy); one station on Ox Pasture Brook (Fenno Drive); one station on the Rowley River (Rowley Town Docks); and various tributaries in the Parker River Watershed. This monitoring is conducted under an EPA-approved Quality Assurance Project Plan (QAPP) that calls for all volunteer monitors to participate in training sessions for field collection and QA/QC procedure. Their sampling season typically runs from April through November and the results are published in the Parker River Watch Annual Report (PRCWA 1999). This report is

Parker River Watershed Water Quality Assessment Report 16 91wqar.doc DWM CN 54.0
given to conservation commissions in Parker River watershed communities and placed in local libraries. The association also engages in more detailed sampling of identified trouble spots. Variables monitored include: flow, fecal coliform bacteria, turbidity, dissolved oxygen and selected nutrients (PRCWA 19 November 2000). In conjunction with the Essex County Sportsmen Association, Massachusetts Audubon Society, Essex County Greenbelt Association, and the Great Marsh Fish Team, PRCWA helps to maintain fish ladders on the Parker River and conducts yearly anadromous fish counts from April to May in an effort to estimate population size, time of migration, and duration of migration (PRCWA 19 November 2000). As a result of issues identified by the Massachusetts Audubon Society during their 1991-1995 water quality sampling, shoreline/source identification and land use research on the Plum Island Sound an EPA/MA DEP funded 319(h) Non-point Source Competitive grant was awarded to Massachusetts Audubon Society. This project was designed to address storm water and septic system problems by implementing three programs (Leahy 1998):
• Storm water management program to treat roadway and agricultural runoff • Septic system management program • Public education program
The Massachusetts Audubon Society conducted a nonpoint source pollution study in the Mill River subwatershed from January 1995 through June 1998 (Leahy 1998). This project was funded through MA DEP under a Section 319(h) Nonpoint Source Competitive Grant to assist the Town of Rowley in its efforts to upgrade water quality in the subwatershed by incorporating storm water best management practices (BMPs), regulating nonpoint sources of pollution and through public education. As part of this project, a StormTreat™ System was installed in the Ox Pasture Brook subwatershed in Rowley. This installation, completed in July 1997, consisted of six sedimentation chambers and a constructed wetland. Additionally, fecal coliform bacteria samples were collected from 16 stations on the Mill River and its tributaries at approximately two week intervals from July through December 1995 and May through December 1996 with occasional samples taken in the winter months (both wet and dry). In 1997 more intensive sampling was conducted in the Ox Pasture Brook. The Plum Island Ecosystem (PIE) research site, located on the Northern Massachusetts coast, is part of the National Science Foundation's (NSF) Long-Term Ecological Research (LTER) Network. PIE-LTER research was conducted by scientists from the Ecosystems Center at the Marine Biological Laboratory, the University of South Carolina, the Massachusetts Audubon Society, the Wells National Estuarine Research Reserve, and the University of New Hampshire. From 1992-1996, researchers from the Ecosystems Center were funded by the NSF Land Margin Ecosystems Research program in Plum Island. Water column sampling is conducted at 27 stations between the Center Street Dam and the mouth at Plum Island Sound (MBL 2001). The Merrimack Valley Planning Commission (MVPC) in cooperation with PRCWA, DMF, the United States Department of Agriculture Natural Resources Conservation Service and the towns of Newburyport and Newbury conducted a nonpoint source pollution assessment in the Little River subwatershed from April 1999 through April 2000 (MVPC 2000a). This project was funded by MA DEP under a Section 604(b) Water Quality Management Planning Program grant to identify areas and sources of elevated levels fecal coliform bacteria and to develop land use management recommendations. Twenty-seven sites were sampled (9–Little River; 17–Little River tributaries; 1-Parker River) for fecal coliform bacteria in the Little River subwatershed with 90% of the 300 samples collected during dry weather conditions. The MVPC also prepared a Pentucket Pond storm water assessment summary jointly funded by a Coastal Zone Management/Coastal Pollutant Remediation grant, MVPC, and the Town of Georgetown to identify, map and characterize significant storm water discharges into the pond; to estimate drainage areas and peak flow rates associated with these discharges; and develop recommendations and preliminary design for storm water best management practices – BMPs (MVPC 2000b). Shoreline surveys of Pentucket Pond, during both wet and dry weather conditions, identified 14 known or potential surface discharge sites (i.e., drainage ditches, culverts, parking lots, and discharge pipes).

Parker River Watershed Water Quality Assessment Report 17 91wqar.doc DWM CN 54.0
Site-specific evaluations of other water quality issues in the Parker River Watershed related to either wastewater discharges and/or water withdrawals were conducted either through field investigations (where resources could be allocated) or through the review of discharge monitoring reports (DMRs) and annual water withdrawal reports submitted by the permittees. Water withdrawal and wastewater discharge permit information was provided by the MA DEP Northeast Regional Office, Parker River Watershed Team and the DWM Watershed Permitting Program (Water Management Act - WMA and National Pollutant Discharge Elimination System –NPDES). The Parker River Watershed has two NPDES permitted dischargers (Hogan 2001). Governor Dummer Academy (MA0030350) operates a wastewater treatment plant to treat wastes from residences and normal daily operations of the facility. The treatment facility consists of an equalization basin, an aeration basin, clarification, ultra-violet disinfection, sand filtration, and sludge disposal (sand drying bed). The average flow from the facility is 13,000 gallons per day (gpd). The design capacity is 30,000 gpd. The discharge flows to a small intermittent brook that flows under Route US 1 and into the tidal portion of the Mill River, a tributary to the Parker River. The permit was issued on 2 September 1996 and will expire on 2 September 2001. Governor Dummer Academy (MA0030350) submits whole effluent toxicity testing discharge monitoring reports to EPA and MA DEP as required by their NPDES permit. Data from these whole effluent toxicity reports are maintained by DWM in a database entitled TOXTD (Toxicity Testing Data). Information from the reports includes: survival of test organisms exposed to ambient river water (used as dilution water), physicochemical analysis (e.g., hardness, alkalinity, pH, total suspended solids) of the dilution water, and the whole effluent toxicity test results. Data from April 1997 to July 2000 were reviewed and summarized (ranges) for use in the assessment of current water quality conditions in the Parker River Watershed. The Town of Georgetown operates a water treatment plant (MAG640048) that periodically discharges filter backwash to the Parker River. This discharge is covered under a general permit issued by EPA (MAG640048) and MA DEP (BRP WM 13). The permit limits the discharge as follows: flow = 2,000 gpd; total suspended solids = 30 mg/L; settleable solids = 0.1 mL/L; and pH = 6-9 SU. The permit was issued on 1 February 2001. Additionally, the towns of Georgetown and Groveland are required to obtain a general NPDES storm water permit. EPA is currently writing this general permit (with input from MA DEP) and a draft is scheduled to be available for internal review by the end of 2001. The final version of the Phase II storm water permit will be issued by December 2002. Permit applications from the towns must be submitted to EPA by March 2003 and coverage under the permit begins with the application (Scarlet 2001).
TOTAL MAXIMUM DAILY LOADS (TMDL) As part of the Federal Clean Water Act states are required to develop TMDL for lakes, rivers, and coastal waters not meeting the states surface water quality standards as indicated by the states 303d list of impaired waters. A TMDL is the greatest amount of a pollutant that a waterbody can accept and still meet standards. Further information on the 303d list and the TMDL program are available on the MA DEP website at: http://www.mass.gov/dep/water/resources/tmdls.htm. There are eight ponds in the Parker River Watershed on the 1998 303(d) list. The cause of impairment for all eight ponds is noxious aquatic plants (Table 3). A single draft TMDL for Total Phosphorus is being developed for Central Street Pond (MA91003), Rowley; Crane Pond (MA91004), Groveland; Lower Mill Pond (MA91008), Rowley; Sperrys Pond (MA91013), Boxford; State Street Pond (MA91014), Newburyport; Upper Mill Pond (MA91015), Rowley; Wilson Pond (MA91017), Rowley (MA DEP 2001b). This draft TMDL will be available for public comment and the final revised version is scheduled to be submitted to EPA by the end of 2001 (Mattson 2001). An individual TMDL will be developed for Baldpate Pond (MA91001).

Parker River Watershed Water Quality Assessment Report 18 91wqar.doc DWM CN 54.0
OBJECTIVES This report summarizes information generated in the Parker River Watershed through Year 1 (information gathering in 1998) and Year 2 (environmental monitoring in 1999) activities established in the “Five-Year Cycle” of the Watershed Initiative. Surveys conducted by DWM in 1999 were limited to benthic macroinvertebrates, habitat assessments, and fish toxics monitoring. The benthic macroinvertebrate data are provided in Appendix C: a technical memorandum entitled 1999 DEP DWM Technical Memorandum (TM-91-1). Together with other sources of information (identified in each segment assessment), the status of water quality conditions of rivers, ponds and estuaries in the Parker River Watershed was assessed in accordance with EPA’s and MA DEP’s use assessment methods. Not all waters in the Parker River Watershed are included in the MA DEP/EPA Waterbody System database or this report. The objectives of this water quality assessment report are to:
1. evaluate whether or not surface waters in the Parker River Watershed, defined as segments in the WBS database, currently support their designated uses (i.e., meet surface water quality standards),
2. identify water withdrawals (habitat quality/water quantity) and/or major point (wastewater discharges) and nonpoint (land-use practices, storm water discharges, etc.) sources of pollution that may or are impairing water quality,
3. identify the presence or absence of any exotic macrophytes in ponds, 4. identify waters (or segments) of concern that require additional data to fully assess water quality
conditions, 5. recommend additional monitoring needs and/or remediation actions in order to better determine
the level of impairment or to improve/restore water quality, and 6. provide information to the Parker River Watershed Team for use in its annual and 5-year
watershed action plans.

Parker River Watershed Water Quality Assessment Report 19 91wqar.doc DWM CN 54.0
REPORT FORMAT RIVERS AND ESTUARIES The rivers assessed in the Parker River Watershed are presented in the River Segment Assessments section of this report (Figure 6). The order of river segments follows the Massachusetts Stream Classification Program (Halliwell et al. 1982) hierarchy. River segments are organized hydrologically (from most upstream to downstream) and tributary segments follow after the river segment into which they discharge. Each river segment assessment is formatted as follows:
PONDS The ponds assessed in the Parker River Watershed, identified with their Waterbody System Identification (WBID) code numbers, are listed alphabetically in the Ponds Segment Assessments section of this report (Figure 7). Pond assessments were based on information gathered during DWM 1994 synoptic pond surveys, as well as pertinent information from other sources (e.g., abutters, herbicide applicators, diagnostic/feasibility studies, MDPH, etc.). These pond surveys focused on observations of water quality and quantity (e.g., water level, sedimentation, etc.), the presence of native and non-native aquatic plants (both distribution and areal cover) and presence/severity of algal blooms (MA DEP 1994). In cases where it is best professional judgment that conditions have not changed since the 1994 surveys, these data were used for assessment purposes. Fish consumption advisory information was obtained from the MDPH to assess the Fish Consumption Use (MDPH 2001a). Although the Drinking Water Use was not assessed in this water quality assessment report, the Class A waters were identified. Information on drinking water source protection and finish water quality is available at the MDPH web site and from the Parker River Watershed’s public water suppliers.
SEGMENT IDENTIFICATION Name, Waterbody identification number (WBID), location, length, classification.
Sources of information: coding system (waterbody identification number e.g., MA91-01) used by MA DEP to reference the stream segment in databases such as 305(b) and 303(d), and the classification (MA DEP 1996).
SEGMENT DESCRIPTION
Major land-use estimates (top three uses for the subwatershed excluding “open water”) and other descriptive information.
Sources of information: USGS topographical maps, and land use statistics from a GIS analysis using the MassGIS land use coverage developed at a scale of 1:25,000 and based on aerial photographs taken in 1999 (UMass Amherst 1999).
SEGMENT LOCATOR MAP
Major waterbody locations, segment origin and termination points, and segment subwatershed (gray shaded). Sources of information: Data layers published through MassGIS including the Hydrography (1:25,000) datalayer (MassGIS 2000).
WATER WITHDRAWALS AND WASTEWATER DISCHARGE PERMIT INFORMATION
Water withdrawals and NPDES wastewater discharges (when provided) Sources of information: WMA Database Printout (LeVangie 2001, O’Keefe 2001); open permit files located in Worcester and Wilmington DEP Offices (MA DEP 2001b and c).
USE ASSESSMENT
Aquatic Life, Fish Consumption, Shellfishing, Drinking Water (where applicable – see note below), Primary Contact Recreation, Secondary Contact Recreation, and Aesthetics.
Sources of information include: DWM 1999 Survey data (Appendix B and Appendix C); DEP DWM Toxicity Testing Database “TOXTD”; The MDPH Freshwater Fish Consumption Advisory List (MDPH 2001a) was used to assess the Fish Consumption Use and the DMF Shellfish status report was used to assess the Shellfishing Use (DFWELE 2000). Where other sources of information were used to assess designated uses, citations are included.
[Note: Although the Drinking Water Use itself was not assessed in this water quality assessment report, the Class A waters were identified.]
SUMMARY
Use summary table (uses, status, causes and sources of impairment). RECOMMENDATIONS
Additional monitoring and implementation needs.

Parker River Watershed Water Quality Assessment Report 20 91wqar.doc DWM CN 54.0
PARKER RIVER WATERSHED – RIVER AND ESTUARY SEGMENT ASSESSMENTS
The following segments in the Parker River Watershed are included in this report (Figure 6):
Parker River (Segment MA91-01).................................................................................................. 21 Jackman Brook (Segment MA91-07)............................................................................................. 26 Parker River (Segment MA91-02).................................................................................................. 28 Mill River (Segment MA91-08)....................................................................................................... 31 Mill River (Segment MA91-09)....................................................................................................... 34 Ox Pasture Brook (Segment MA91-10) ......................................................................................... 37 Little River (Segment MA91-11)..................................................................................................... 39 Bull Brook (Segment MA91-04) ..................................................................................................... 42 Egypt River (Segment MA91-13) ................................................................................................... 43 Egypt River (Segment MA91-14) ................................................................................................... 45 Rowley River (Segment MA91-05) ................................................................................................ 47 Paine Creek (Segment MA91-03).................................................................................................. 49 Eagle Hill River (Segment MA91-06) ............................................................................................. 50 Plum Island River (Segment MA91-15) ......................................................................................... 52 Plum Island Sound (Segment MA91-12) ....................................................................................... 54
Figure 6. Assessed River and Estuary Segments in the Parker River Watershed
MA91-06
MA91-15
MA
91-1
2
MA91-05
MA91-01
MA
91- 0
7
MA91-08
MA91-09
MA91 -1 0
MA91-02
MA91-03
MA91-04
MA9
1-14
MA9
1-13
MA91-11
NEWBURY
ROWLEY
IPSWICHBOXFORD
NEWBURYPORT
WEST
GROVELAND
NEWBURYPORT
GEORGETOWN
ATLANTIC OCEAN
IPSWICH RIVERBASIN
MERRIMACK RIVERBASIN
N
2 0 2 4 Miles

Parker River Watershed Water Quality Assessment Report 21 91wqar.doc DWM CN 54.0
PARKER RIVER (SEGMENT MA91-01) Location: Source in Boxford to Central Street, Newbury Segment Length: 13 miles Classification: Class B Land-use estimates for the subwatershed (map inset, gray shaded area):
Forest 55% Residential 24% Wetlands 6%
This segment is on the 1998 303(d) list of impaired waters, needing confirmation, for flow alteration (Table 3). The use assessments of Sperrys, Rock, Pentucket, and Crane ponds, which are located in the subwatershed are provided in the Ponds Assessment section of this report. Downstream from Rock and Pentucket ponds, there are six dams on this segment of the Parker River all in the town of Newbury:
• two at River Street, due west of Main Street in the village of Byfield
• two near Main Street in the village of Byfield • one northwest of Larkin Road (east of Interstate 95) • one at Central Street (the end of this segment)
All six dams on this segment of the Parker River currently have provisions for fish passage. WMA WATER WITHDRAWAL SUMMARY:
Facility PWS ID# WMA Permit #
WMA Registration
# Source
G = ground Authorized Withdrawal
(MGD)
1999 Average Withdrawal
(MGD) The Village
Store building, Boxford
3038010 NA NA 01G 0.001 *Unknown
200 Washington St,
Boxford 3038023 NA NA 01G Not assigned *Unknown
Georgetown Water
Department 3105000 9P31610501 31610501
01G (inactive) 02G (inactive)
03G 04G 05G
0.43** reg. 0.27** permit Total – 0.70
03G - 0.23 04G - 0.16 05G - 0.30
Total – 0.69
Byfield Water District 3205001 9P231620501 31620501
02G 03G (Emergency)
04G
0.17** reg.
02G – 0.03 04G – 0.19
Total – 0.22*** Georgetown
Sand & Gravel Co., Inc.
NA 9P31610502 NA Parker River 0.57 0.40
G-Town Produce NA NA 31610502 Rock Pond 0.1 (184 days) Not reported
NA - not applicable; * Unknown - no metered withdrawal data available; ** indicates system-wide withdrawal, all sources are not necessarily within this segment; *** withdrawal did not exceed registration amount by more than 0.1 MGD (WMA threshold)
NEWBURY
GEORGETOWN
GROVELAND
NEWBURYPORT
IPSWICH
ROWLEY
NEWBURY
Parker River WatershedParker River
MA91-01
N
Source, Boxford Central Street, Newbury

Parker River Watershed Water Quality Assessment Report 22 91wqar.doc DWM CN 54.0
NPDES WASTEWATER DISCHARGE SUMMARY: Georgetown Water Treatment Plant is authorized to discharge wastewater 1 MGD (6,000 gpd maximum and 2,000 gpd average) from its backwashing operation to this segment of the Parker River under a NPDES general permit (MAG640048). The communities of Georgetown and Groveland are required to obtain Phase II general NPDES storm water permits. EPA is currently writing this general permit (with input from MA DEP) and a draft is scheduled to be available for internal review by the end of 2001. The final version of the Phase II storm water permit will be issued by December 2002. Permit applications from the towns must be submitted to EPA by March 2003 and coverage under the permit begins with the application (Scarlet 2001). USE ASSESSMENT: AQUATIC LIFE Biology
In August 1999 DWM conducted a Rapid Bioassessment Protocol III (RBP III) and qualitative benthic macroinvertebrate survey at three stations on this segment of the Parker River in August 1999 (Appendix C). The regional reference station for this survey was located on Fish Brook (FB00) in the Ipswich River Basin. • PR01B, downstream from Route 133, Boxford (upstream of Rock Pond) - RBP III • PR02, at Bailey Lane, Georgetown - Qualitative only (directly upstream of Rock Pond) • PR00, upstream from Main Street, Byfield, Newbury - RBP III
The RBP III analysis indicated slight impairment at both PR01B and PR00 when compared to the regional reference station (FB00). However, when PR00 (the most downstream station) was compared to PR01B (the most upstream station) no impairment was identified (90% comparable).
Habitat and Flow The reach of the river between the Georgetown wells and Rock Pond has been observed with little or no flow. It is not known if this is due to geologic conditions surrounding this section of the river, over-pumping of the wells, beaver activity or a combination of all factors (Tomczyk 2001a). It should be noted that 1999 was a drought year. Average monthly stream flows in June were lower than have been recorded in decades (USGS 2 August 2001). A large beaver dam was identified at the upstream end of the PR01B benthic macroinvertebrate sampling reach. This dam was responsible for extensive flooding of the river upstream of the sampling reach and the slow flow in the reach. Also, beaver activity immediately upstream from Bailey Lane (PR02) restricted flow resulting in a primarily muddy bottom and flooded wetland margins with slow/deep, lentic habitat. Excellent habitat quality was documented at the downstream station PR00 (Appendix C).
Chemistry - water
As part of DWM’s 1999 fish toxics monitoring of Rock Pond (an impoundment of the Parker River), a Hydrolab® profile was recorded (Station #FM-0007). Dissolved oxygen concentrations ranged from 9.7 mg/L at the surface to 3.2 mg/L in the bottom waters of Rock Pond (Appendix C).
Between the Georgetown wells and the inlet to Rock Pond (1.0 mile) the Aquatic Life Use is assessed as partial support based on best professional judgment and the low flow/no flow conditions. Although, the benthic macroinvertebrate community was slightly impaired at both stations in comparison to the regional reference station it is best professional judgment that the community was structured in response to the naturally productive wetland-system. Therefore, the 4.4-mile long reach from the source in Boxford to the Georgetown wells and the 7.6-mile reach from Rock Pond to the end of the segment at the Center Street Bridge, is assessed as support and is on “Alert Status” due to potential causes of impairment other than natural conditions (e.g., water withdrawals).

Parker River Watershed Water Quality Assessment Report 23 91wqar.doc DWM CN 54.0
FISH CONSUMPTION In 1994, fish toxics monitoring was conducted by MA DEP in Pentucket Pond, Georgetown. Data from this survey are presented in Table 4.

Parker River Watershed Water Quality Assessment Report 24 91wqar.doc DWM CN 54.0
Table 4. 1994 Parker River Watershed fish toxics monitoring data (mg/kg wet wt.), Pentucket Pond. Sample # and code
Species code
Collection date
Length (cm)
Weight (g)
% Lipids Hg As Pb Se Cd PCB
(µg/g) Pesticides
(µg/g)
94-3611 Ppf94-1 Ppf94-2 Ppf94-3 Ppf94-4
BC1 8/23/94 27.3 27.0 26.3 25.5
260 300 240 240
0.18 1.03 <0.002 <0.03 0.14 <0.01 ND ND
94-3613 Ppf94-5 Ppf94-6 Ppf94-7 Ppf94-8 Ppf94-9
B2 8/23/94 18.8 17.1 16.6 17.0 15.4
100 100 90 90 80
0.17 0.30 <0.002 <0.03 0.14 <0.01 ND ND
94-4228 Ppf94-10 Ppf94-11
LMB3 9/21/94 33.4 34.9
470 590
0.15 1.06 <0.040 <1.0 0.119 <0.20 ND ND
94-4230 Ppf94-12 Ppf94-13 Ppf94-14 Ppf94-15 Ppf94-16
BB4 9/21/94 32.8 33.7 32.8 33.9 32.5
450 530 550 580 400
0.48 0.220 <0.040 <1.0 <0.040 <0.20 ND ND
1black crappie (BC) - Pomoxis nigromaculatus, 2bluegill (B) - Lepomis macrochirus, 3largemouth bass (LMB) - Micropterus salmoides, 4brown bullhead (BB) - Ameiurus nebulosus
In 1999, MA DEP DWM collected fish from Rock Pond, Georgetown (Appendix B, Table B1) as part of both Year 2 of the watershed cycle and the mercury research study (MRS) being coordinated by MA DEP’s Office of Research and Standards (Maietta 2000). The mean mercury concentrations in largemouth bass and yellow perch from Rock Pond were 1.6 and 0.86 ppm wet weight, respectively. Based on the 1994 and 1999 data, MDPH issued fish consumption advisories due to mercury contamination for Rock and Pentucket ponds (MDPH 2001a).
Rock Pond, Georgetown:
1. “The general public should not consume any fish from Rock Pond.”
Pentucket Pond, Georgetown: “Children under 12, pregnant women and nursing mothers should not consume any fish from Pentucket Pond.”
1. “The general public should not consume large mouth bass and black crappie from Pentucket Pond.”
2. “The general public should limit consumption of non-affected fish from Pentucket Pond to two meals per month.”
Due to the MDPH fish consumption advisories, the Fish Consumption Use is assessed as non-support for the length of the Parker River that flows through both Rock and Pentucket ponds (1.1 miles). The remaining 11.9 miles are not assessed for the Fish Consumption Use. PRIMARY AND SECONDARY CONTACT RECREATION
Although the PRCWA 1999 annual report indicated low counts of fecal coliform bacteria (geometric mean <150 cfu/100mL), too little information/data was available to assess this use.
AESTHETICS No objectionable conditions were noted by DWM in 1999 during the benthic macroinvertebrate survey (MA DEP 1999c). Additionally regional information indicated high aesthetic quality in this segment of the Parker River (Tomczyk 2001b).
Based on field observations and best professional judgment, the Aesthetics Use is assessed as support.

Parker River Watershed Water Quality Assessment Report 25 91wqar.doc DWM CN 54.0
Parker River (MA91-01) Use Summary Table Causes Sources
Designated Uses Status Known Suspected Known Suspected
Aquatic Life*
SUPPORT upper 4.4 miles* PARTIAL SUPPORT middle 1.0 miles SUPPORT lower 7.6 miles*
Flow alteration Hydromodification Water
withdrawals
Fish Consumption
NON-SUPPORT 1.1 miles Rock and Pentucket ponds NOT ASSESSED 11.9 miles
Mercury Unknown
Primary Contact
NOT ASSESSED
Secondary Contact
NOT ASSESSED
Aesthetics
SUPPORT
* “Alert Status” issues identified RECOMMENDATIONS: PARKER RIVER (MA91-01) • Conduct benthic macroinvertebrate surveys to address the potential impacts of groundwater
withdrawals on the aquatic community in this portion of the Parker River. Develop macroinvertebrate sampling methodologies that accurately assess biological conditions in low gradient, wetland-dominated stream systems.
• Conduct diurnal dissolved oxygen monitoring, nutrient and periphyton sampling to determine if
impairment to the benthic community is naturally occurring. • Complete the WMA five-year reviews for permits in the Parker River Watershed and continue to
evaluate compliance with WMA registration and/or permit limits. Determine potential impacts of withdrawals on streamflow/habitat.
• G-Town Produce is required to report their annual water use to MA DEP. Take the necessary actions
to obtain and review these reports. • The Massachusetts Drinking Water Regulations, 310 CMR 22.04(6), require all public water systems
to install meters to record water use by 31 December 2001. When data are available from these meters review to determine the potential impacts on streamflow/habitat.
• Track the progress of the Fiscal Year 2002 MWI Round Table Grant to MA DEM that will assess the
cause of low flow conditions. • Work with PRCWA to conduct an investigation of land-use practices and a nonpoint source (NPS)
pollution survey along the mainstem Parker River upstream from PR00 (especially in the vicinity of the impoundments in Byfield).
• Multiple fishways on the Parker River have recently been repaired (e.g., Main St., Byfield and Central
St., Newbury). Determine the condition of the unimproved fishways and work with the Division of Marine Fisheries fish ladder maintenance program to repair/upgrade as necessary.
• Georgetown Sand & Gravel Co., Inc. is subject to a NPDES general storm water permit. Once the
facility has applied for a permit, inspections should be conducted to determine if the facility complies with their storm water protection plan.
• Review the results from the USGS 1999 NECB Mercury Study when are available.

Parker River Watershed Water Quality Assessment Report 26 91wqar.doc DWM CN 54.0
JACKMAN BROOK (SEGMENT MA91-07) Location: Northeast of the intersection of Jewett and Tenney streets in Georgetown to confluence with Wheeler Brook, Georgetown Segment Length: 0.8 miles Classification: Class B Land-use estimates for the subwatershed (map inset, gray shaded area):
Forest 55 % Residential 32 % Transportation 3 %
WMA WATER WITHDRAWAL AND NPDES SURFACE DISCHARGE SUMMARY: There are no regulated water withdrawals or surface discharges in Jackman Brook. However, Georgetown is required to obtain a Phase II general NPDES storm water permit. EPA is currently writing this general permit (with input from MA DEP) and a draft is scheduled to be available for internal review by the end of 2001. The final version of the Phase II storm water permit will be issued by December 2002. Permit applications from the towns must be submitted to EPA by March 2003 and coverage under the permit begins with the application (Scarlet 2001). USE ASSESSMENT: AQUATIC LIFE Biology
In August 1999 DWM conducted a RBP III benthic macroinvertebrate survey at one station, JK01 (downstream from Jackman Street, Georgetown) on Jackman Brook (Appendix C). The regional reference station for this survey was located on Fish Brook (FB00) in the Ipswich River Watershed. The RBP III analysis indicated 100% comparability (non-impacted) to the regional reference station (FB00).
Habitat and Flow
During the benthic macroinvertebrate survey in Jackman Brook (JK01) seasonal low base-flow conditions were identified and both epifaunal and fish habitat were considered marginal. In addition, instream deposits of organic and inorganic materials resulted in shifting, unstable bars and substrate embeddedness that further compromised fish and macroinvertebrate habitat. Road runoff from Jackman Street was identified as the most likely source of sediment inputs to Jackman Brook. Other potential sources of NPS pollution included housing developments and agriculture (pasture) (Appendix C).
Although instream habitat quality was marginal, the benthic macroinvertebrate community was not impaired when compared to the regional reference station; it was dominated by pollution intolerant species. The Aquatic Life Use is, therefore, assessed as support. AESTHETICS
No objectionable conditions were noted by DWM in 1999 during the benthic macroinvertebrate survey and there was no evidence of turbidity, odors or oil (MA DEP 1999c).
Based on this information, the Aesthetics Use is assessed as support.
NEWBURY
GEORGETOWN
GROVELAND
NEWBURYPORT
IPSWICH
ROWLEY
NEWBURY
Northeast of intersection of Jewettand Tenney Streets, Georgetown
Confluence with Wheeler Brook, Georgetown
Parker River WatershedJackman Brook
MA91-07
N

Parker River Watershed Water Quality Assessment Report 27 91wqar.doc DWM CN 54.0
Jackman Brook (MA91-07) Use Summary Table Causes Sources
Designated Uses Status Known Suspected Known Suspected
Aquatic Life
SUPPORT
Fish Consumption
NOT ASSESSED
Primary Contact
NOT ASSESSED
Secondary Contact
NOT ASSESSED
Aesthetics
SUPPORT
RECOMMENDATIONS: JACKMAN BROOK (MA91-07) • Identify/reduce sources of sediment inputs to Jackman Brook from road runoff. • Monitor Jackman Brook (macroinvertebrates and fish), in part to determine the long-term impacts
from NPS pollution.

Parker River Watershed Water Quality Assessment Report 28 91wqar.doc DWM CN 54.0
PARKER RIVER (SEGMENT MA91-02) Location: Central Street, Newbury to mouth at Plum Island Sound, Newbury Segment Area: 1.2 square miles. Classification: Class SA, ORW This segment of the Parker River begins at the Central Street dam in Newbury and is on the 1998 303(d) list of impaired waters for pathogens (Table 3). The Central Street dam currently has provisions for fish passage. The PRCWA collects water quality and fecal coliform bacteria data from one station on this segment of the Parker River (Newbury Docks). A summary of their 1999 sampling season results can be found in their Parker River Watch Annual Report (PRCWA 1999). WMA WATER WITHDRAWAL SUMMARY:
Facility PWS ID# WMA Permit #
WMA Registration #
Source G = ground
Authorized Withdrawal
(MGD)
1998 Average Withdrawal
(MGD) Ould Newbury
Golf Club 3205007 NA NA 01G Not assigned * Unknown
Old Town Country Club 3205006 NA NA 01G Not assigned * Unknown
NA-not applicable; * Unknown – no metered withdrawal data available NPDES SURFACE DISCHARGE SUMMARY: Based on the available information, there are no regulated surface discharges to this segment of the Parker River. However, there is a vessel sewage pump-out facility (operating between 8am and 6pm from May through September) at Riverfront Marina, High Street in Newbury. USE ASSESSMENT: Chemistry - water Marine Biological Laboratory as part of the PIE-LTER study has collected surface water quality data (DO, % saturation, T, pH) from 26 stations within this segment of the Parker River (EST-PR-0 through EST-PR-26). Data are summarized below for the samples collected at both dawn and dusk between 1996 and 2000 (MBL 2001).
DO
The composite dissolved oxygen concentrations from all 26 stations ranged between 4.1 and 12.5 mg/L (n=1644). The majority of the concentrations below 6.0 mg/L were at stations EST-PR-16 through EST-PR-23, in the Kent Island and Mill Creek Wildlife Management areas. Percent saturation ranged from 51 to 143% (n=1477) and again the majority of the low saturations were in the Kent Island and Mill Creek Wildlife Management areas. Additionally, the majority of the low DO concentrations and saturations occurred during the summer months of 1996 and 1999; both years were relatively dry (drought). Dissolved oxygen measurements were collected pre-dawn and, therefore, represent a worse-case scenario.
Temperature
The maximum temperature measurement at all stations combined was 24.7°C (n=1644).
pH The pH ranged between 6.7 and 8.3 SU (n=378).
NEWBURY
GEORGETOWN
GROVELAND
NEWBURYPORT
IPSWICH
ROWLEY
NEWBURY
Parker River WatershedParker River
MA91-02
N
Central Street, Newbury
Plum Island Sound, Newbury

Parker River Watershed Water Quality Assessment Report 29 91wqar.doc DWM CN 54.0
In general, instream physicochemical measurements from this segment of the Parker River indicated high water quality. Based on these data the Aquatic Life Use is assessed as support. However, some dissolved oxygen measurements were low with evidence indicating that these conditions may be naturally occurring (i.e., salt marsh, mud flats, etc.); this segment is, therefore, on “Alert Status” for this use.
SHELLFISHING
The DMF Shellfish Status Report of October 2000 indicates that areas N4.3 and N4.4 (which include this segment of the Parker River) are prohibited (DFWELE 2000). Additionally, DMF shellfish surveys indicated few shellfish upstream of Cottage Road (some oysters), with greater numbers of softshell clams located downstream of Cottage Road (Tomczyk 2000).
Because of the DMF shellfish growing area closure, the Shellfishing Use for this segment of the Parker River is assessed as non-support. PRIMARY AND SECONDARY CONTACT RECREATION
Between January 1997 and February 2001 DMF collected dry weather fecal coliform bacteria samples from five stations on this segment of the Parker River as part of their shellfish growing area classification (Kennedy 2001). Counts ranged between 2 and 347 cfu/100mL with a total of 115 samples collected. Sixty-nine samples were collected during the primary contact recreation season (1 April through 15 October). PRCWA’s 1999 annual report indicated low counts of fecal coliform bacteria (geometric mean <150 cfu/100mL) at their station at Newbury Docks (PRCWA 1999).
Based on the low bacteria counts, both the Primary and Secondary Contact Recreation Uses are assessed as support.
Parker River (MA91-02) Use Summary Table Causes Sources
Designated Uses Status Known Suspected Known Suspected
Aquatic Life*
SUPPORT*
Fish Consumption
NOT ASSESSED
Shellfishing
NON-SUPPORT. For watershed-wide shellfish growing area data see Appendix E.
Primary Contact
SUPPORT
Secondary Contact
SUPPORT
Aesthetics
NOT ASSESSED
* “Alert Status” issues identified

Parker River Watershed Water Quality Assessment Report 30 91wqar.doc DWM CN 54.0
RECOMMENDATIONS: PARKER RIVER (MA91-02) • The Massachusetts Drinking Water Regulations, 310 CMR 22.04(6), require all public water systems
to install meters to record water use by 31 December 2001. When data are available from these meters review to determine the potential impacts on streamflow/habitat.
• The DMF shellfish closures in this segment of the Parker River are due to elevated levels of fecal
coliform bacteria. The suspected sources of these contaminants include: failed septic systems, storm water, and improper waste disposal from marinas and boats (Tomczyk 2001a). Work with Division of Marine Fisheries, Coastal Zone Management and local communities to identify and reduce sources of contamination to the shellfish beds.
• When available, review the results and recommendations from the Marine Biological Laboratory’s
land use and nutrient input study of Plum Island Sound. • The fishway on the Parker River at the Central Street dam has recently been repaired. Work with
PRCWA to conduct anadromous fish counts to determine the effectiveness of these upgrades.

Parker River Watershed Water Quality Assessment Report 31 91wqar.doc DWM CN 54.0
MILL RIVER (SEGMENT MA91-08) Location: Headwaters, outlet of small unnamed pond between Route 95 and Rowley Road, Boxford to Route 1, Rowley Segment Length: 7.0 miles Classification: Class B, ORW Land-use estimates for the subwatershed (map inset, gray shaded area):
Forest 63 % Residential 19 % Agriculture 5%
There are three dams on this segment of the Mill River: Upper and Lower Millpond dams and the Jewel Mill Dam in Glen Mills. The Mill River once had an anadromous fishery (blueback herring and alewives), however, the lack of a fish passage facility at the Jewel Mill (Glen Mills dam) impedes the ability of these fish to move upstream. In 1997 PRCWA indicated that blueback herring were making a comeback in the Mill River and that the Mill River provides important spawning habitat for blueback herring and rainbow smelt (PRCWA 1997). In 2001, DFWELE stocked trout in the Mill River for the purpose of recreational fishing (DFWELE 26 April 2001). The Massachusetts Audubon Society collected fecal coliform bacteria samples (wet and dry weather) from 16 stations in the Mill River subwatershed in 1995 and 1996 (Leahy 1998). The results from this study were combined with data collected (1992-1994) as part of the Plum Island Sound Minibay Project of the Massachusetts Bays Program (Buchsbaum et al. 1996). WMA WATER WITHDRAWAL SUMMARY:
Facility PWS ID# WMA Permit #
WMA Registration #
Source G = ground
Authorized Withdrawal
(MGD)
1999 Average Withdrawal
(MGD)
Rowley Water Department 3254000 9P31625401 31625402 03G
02G
0.36* reg. 0.13* permit Total – 0.49
03G – 0.23 02G – 0.22 Total – 0.45
Spar and Spindle Girl
Scout Council (TNC**)
3254007 NA NA 01G Not assigned ***Unknown
Rowley Country Club NA NA V31625401 Pond #1 and
Pond #2**** 0.03 (180 days) 0.02
NA - not applicable; *indicates system-wide withdrawal, all sources are not necessarily within this segment; ** TNC= Transient Non Community source; *** Unknown - no metered withdrawal data reported; **** both east of Dodge Road on the country club property. NPDES SURFACE DISCHARGE SUMMARY: There are no known regulated discharges to this segment of the Mill River. USE ASSESSMENT: AQUATIC LIFE Biology
In August 1999 DWM conducted a RBP III benthic macroinvertebrate survey at one station (MR03 upstream from Route 1, near Jewel Mill, Rowley) on the Mill River (Appendix C). The regional reference station for this survey was located on Fish Brook (FB00) in the Ipswich River Watershed. The benthic community had numerous filter-feeding caddisflies suggesting an abundance of fine particulate organic material. Much of this organic material (nutrients) probably originates from Upper and Lower Mill ponds
NEWBURY
GEORGETOWN
GROVELAND
NEWBURYPORT
IPSWICH
ROWLEY
NEWBURY
Headwaters at small, unnamed pond between I 95 and Rowley Road, Boxford
Route 1, Rowley
Parker River WatershedMill River MA91-08
N

Parker River Watershed Water Quality Assessment Report 32 91wqar.doc DWM CN 54.0
and impoundments upstream of the benthic sampling reach. The RBP III analysis indicated 74% comparability (slightly impacted) to the regional reference station.
Habitat and Flow This portion of Mill River is extremely straight—the result of historical channelization probably related to the activities of the now-defunct Jewel Mill. The DWM habitat assessment also noted that the stream channel was approximately only 50% full. Additionally, fish habitat was limited (Appendix C) and inadequate provisions for fish passage have been identified. It should be noted that 1999 was a drought year. Average monthly stream flows in June were lower than have been recorded in decades (USGS 2 August 2001).
Based on the slightly impacted benthic macroinvertebrate community and best professional judgment (e.g., low flow, inadequate fish passage, etc.) the Aquatic Life Use is assessed as partial support. PRIMARY AND SECONDARY CONTACT RECREATION Although the Massachusetts Audubon Society studies (Buchsbaum et al. 1996 and Leahy 1998) indicated low fecal coliform bacteria concentrations during wet (200 and 1500 cfu/100mL) and dry (<100 cfu/100mL) weather conditions, too little current data were available to assess the recreational uses. AESTHETICS
No objectionable conditions were noted by DWM in 1999 during the benthic macroinvertebrate survey and there was no evidence of turbidity, odors or oil (MA DEP 1999c).
Based on this information, the Aesthetics Use is assessed as support.
Mill River (MA91-08) Use Summary Table Causes Sources
Designated Uses Status Known Suspected Known Suspected
Aquatic Life
PARTIAL SUPPORT Unknown Nutrients, low flow Unknown Upstream impoundments
Fish Consumption
NOT ASSESSED
Primary Contact
NOT ASSESSED
Secondary Contact
NOT ASSESSED
Aesthetics
SUPPORT

Parker River Watershed Water Quality Assessment Report 33 91wqar.doc DWM CN 54.0
RECOMMENDATIONS: MILL RIVER (MA91-08) • Complete the WMA five-year reviews for permits in the Parker River Watershed and continue to
evaluate compliance with WMA registration and/or permit limits. Determine potential impacts of withdrawals on streamflow/habitat.
• Work with the Division of Marine Fisheries fish ladder maintenance program and the Great Marsh
Summit Initiative to install and upgrade fishways at the dams (Upper and Lower Millpond dams and Jewel Mill Dam) on this segment of the Mill River.
• Work with local organizations (PRCWA) to conduct anadromous fish counts to determine the
effectiveness of the fish passage upgrades/repairs. • Work with Massachusetts Audubon Society to complete the five tasks identified in their nonpoint
source implementation program: septic system management; roadway runoff; agricultural runoff-storm water management; public education; and bacteria monitoring.

Parker River Watershed Water Quality Assessment Report 34 91wqar.doc DWM CN 54.0
MILL RIVER (SEGMENT MA91-09) Location: Route 1, Rowley to confluence with the Parker River, Newbury Segment Area: 0.08 square miles Classification: Class SA, ORW Land-use estimates for the subwatershed (map inset, gray shaded area):
Forest 58 % Residential 19 % Wetlands 8 %
In 2001, DFWELE stocked trout in the Mill River for the purpose of recreational fishing (DFWELE 26 April 2001). Marine Biological Laboratory as part of their PIE-LTER study sampled nutrients from the Mill River just east of Route 1 in South Byfield near Governor Dummer Academy in 1994. These samples were collected to determine nutrient loadings to the Plum Island estuarine system (MBL 2001). The Massachusetts Audubon Society collected fecal coliform bacteria samples (wet and dry weather) from 16 stations in the Mill River subwatershed in 1995 and 1996 (Leahy 1998). The results from this study were combined with data collected (1992-1994) as part of the Plum Island Sound Minibay Project of the Massachusetts Bays Program (Buchsbaum et al. 1996). WMA WATER WITHDRAWAL SUMMARY: There are no regulated water withdrawals in this segment of the Mill River. NPDES SURFACE DISCHARGE SUMMARY: Governor Dummer Academy (MA00303550) is permitted to discharge 0.05 MGD of treated sanitary wastewater via outfall 001 to a small unnamed freshwater tributary of the Mill River just upstream of Route 1 in the village of South Byfield. The permit limits for whole effluent toxicity are LC50 >100% and chronic no observable effect concentration (CNOEC) = 100% effluent. Additionally the facility has limits for benthic oxygen demand (10 mg/L monthly average), total suspended solids (10 mg/L monthly average), ammonia-nitrogen (1.0 mg/L monthly average) and fecal coliform (14 MPN/100 mL maximum with no more than 10% greater than 43 MPN/ 100mL). The treatment facility consists of the following: equalization basin, aeration basin, clarification, ultra-violet disinfection, sand filtration, and sludge disposal: sand drying bed. The secondary treatment facility has recently been upgraded and includes application of membrane bioreactor technology, which went online in September 2000. The average flow from the facility is 13,000 gallons per day (gpd) while the design capacity is 30,000 gpd. The region has identified that the facility is still experiencing infiltration and inflow (INI) problems (Tomczyk 2001b). The permit was issued on 2 September 1996, will expire on 2 September 2001and will be re-issued in 2002. MA DEP will continue to monitor compliance with the Administrative Consent Order and permit. Georgetown is also required to obtain a Phase II general NPDES storm water permit. EPA is currently writing this general permit (with input from MA DEP) and a draft is scheduled to be available for internal review by the end of 2001. The final version of the Phase II storm water permit will be issued by December 2002. Permit applications from the towns must be submitted to EPA by March 2003 and coverage under the permit begins with the application (Scarlet 2001).
NEWBURY
GEORGETOWN
GROVELAND
NEWBURYPORT
IPSWICH
ROWLEY
NEWBURY
Route1, Rowley
Confluence with Parker River, Newbury
Parker River WatershedMill RiverMA91-09
N

Parker River Watershed Water Quality Assessment Report 35 91wqar.doc DWM CN 54.0
USE ASSESSMENT: AQUATIC LIFE Toxicity
Effluent Governor Dummer Academy conducted 10 effluent toxicity tests on Ceriodaphnia dubia and Pimephales promelas between April 1997 and July 2000. Acute toxicity was detected in two test events; P. promelas in September of 1997 (LC50 = 33%) and to C. dubia in July 2000 (LC50 = 70.7%) All other LC50 results were in compliance with the permit limit (>100% effluent). Chronic toxicity was detected in half of the C. dubia tests with CNOEC ranging from < 6.25% to 50% effluent. The CNOEC test results for P. promelas ranged between 6.25 and 100% with three below the permit limit (CNOEC < 100% effluent).
Because of limited current instream data, the Aquatic Life Use for this segment of the Mill River is not assessed. However, it should be noted that Governor Dummer Academy’s discharge has occasionally been toxic to C. dubia and P. promelas. Although these toxicity results were seen prior to the upgrade of the facility, whole effluent toxicity is however a concern and therefore the Aquatic Life Use is on “Alert Status”. SHELLFISHING
The DMF Shellfish Status Report of October 2000 indicates that area N4.4 (which includes this entire segment of the Mill River) is prohibited (0.08 mi2) (DFWELE 2000).
Because of the DMF shellfish growing area closure, the Shellfishing Use for this segment is assessed as non-support. PRIMARY AND SECONDARY CONTACT RECREATION
Between January 1997 and February 2001 DMF collected dry weather fecal coliform bacteria samples from one station on this segment of the Mill River as part of their shellfish growing area classification (Kennedy 2001). Counts ranged between 2.9 and 900 cfu/100mL with a total of 23 samples collected. Fifteen samples were collected during the primary contact recreation season (1 April through 15 October). During the primary contact recreation season, only two samples (13%) exceeded 400 cfu/100mL. The Massachusetts Audubon Society nonpoint source study of the Mill River analyzed fecal coliform bacteria samples from two stations on this segment of the Mill River collected between 1992 and 1996. The dry weather geometric means of the bacteria samples ranged between 72 and 155 cfu/100mL, while the wet weather means ranged between 204 and 1632 cfu/100mL (Buchsbaum et al. 1996 and Leahy 1998). Additionally, samples were analyzed from a tributary to the Mill River near Governor Dummer Academy. Counts at this station were often in excess of 10,000 cfu/100mL. The Massachusetts Audubon Society nonpoint source study identified no obvious correlation between elevated bacteria levels from the area around Governor Dummer Academy and bacteria levels in the Mill River (Leahy 1998).
Although slightly elevated fecal coliform bacteria counts have been identified in this segment of the Mill River, the Governor Dummer Academy WWTP has recently been upgraded. Based on best professional judgment, both the Primary and Secondary Contact Recreation Uses are assessed as support.

Parker River Watershed Water Quality Assessment Report 36 91wqar.doc DWM CN 54.0
Mill River (MA91-09) Use Summary Table Causes Sources
Designated Uses Status Known Suspected Known Suspected
Aquatic Life*
NOT ASSESSED*
Fish Consumption
NOT ASSESSED
Shellfishing
NON-SUPPORT For watershed-wide shellfish growing area data see Appendix E.
Primary Contact
SUPPORT
Secondary Contact
SUPPORT
Aesthetics
NOT ASSESSED
* ”Alert Status” issue identified RECOMMENDATIONS: MILL RIVER (MA91-09) • The Governor Dummer Academy NPDES permit needs to be reissued with appropriate
limits/monitoring requirements. Conduct fecal coliform bacteria monitoring upstream and downstream from their discharge, during dry weather and low flow conditions to determine the effectiveness of the Governor Dummer Academy WWTP upgrades. If the facility continues to have problems meeting their LC50 and CNOEC limits, the need for a TIE /TRE should be determined. [Note: all toxicity test results were prior to facility upgrade] Additionally, although the plant has recently been upgraded, the facility is still experiencing INI problems. MA DEP will continue to monitor compliance with the Administrative Consent Order and permit. It is unknown if the school’s treatment facility discharges during the summer months.
• Continue to review DMF’s fecal coliform bacteria data collected from this segment of the Mill River to
confirm the assessment of the Primary Contact Recreation Use.
• When available, review the results and recommendations from Marine Biological Laboratory land use and nutrient input study of Plum Island Sound.
• Work with Massachusetts Audubon Society to complete the five tasks identified in their nonpoint
source implementation program: septic system management; roadway runoff; agricultural runoff-storm water management; public education; and bacteria monitoring.

Parker River Watershed Water Quality Assessment Report 37 91wqar.doc DWM CN 54.0
OX PASTURE BROOK (SEGMENT MA91-10) Location: Headwaters outlet of small unnamed impoundment east of Bradford Street in Rowley to the outlet of a small unnamed impoundment west of Ox Pasture Hill in Rowley Segment Length: 2.5 miles Classification: Class B, ORW Land-use estimates for the subwatershed (map inset, gray shaded area):
Forest 43 % Residential 32 % Agriculture 9 %
The use assessment of Central Street Pond is provided in the Ponds Assessment section of this report. The freshwater reach of Ox Pasture Brook is separated from tidal influence by a small dam (at the downstream end of this segment). WMA WATER WITHDRAWAL AND NPDES SURFACE DISCHARGE SUMMARY: There are no known regulated water withdrawals or surface discharges in this segment. USE ASSESSMENT: AQUATIC LIFE Biology
In 1994 the DWM benthic macroinvertebrate survey of Ox Pasture Brook (OX02, at Fenno Road) identified impacts thought to be associated with storm water runoff from downtown Rowley (Appendix C). Subsequent to this survey a StormTreat™ system was installed near Rowley center (Leahy 1998). Due to habitat constraints (shallow, stagnant water and unproductive mucky substrates) at this station (OX02), in 1999 DWM sampled 0.7 miles downstream from Fenno Road in Rowley – station OX03 (Appendix C). The RBP III analysis indicated 79% comparability (non/slight-impacted) to the Fish Brook (FB00) regional reference station in the Ipswich River Watershed. Pollution intolerant species were the dominant taxa.
Habitat and Flow Naturally occurring low base-flow (channel only 50% full) resulted in much-exposed substrate and unusable fish cover. As a result, epifaunal and fish habitat were considered marginal and poor, respectively. It should be noted that 1999 was a drought year. Average monthly stream flows in June were lower than have been recorded in decades (USGS 2 August 2001).
Although instream habitat quality was marginal it appeared to be the result of naturally occurring conditions. The benthic macroinvertebrate community was considered non/slightly impaired and therefore, based on best professional judgment, the Aquatic Life Use is assessed as support. However, it is identified with an “Alert Status” due to potential causes of impairment from storm water. AESTHETICS
No objectionable conditions were noted by DWM in 1999 during the benthic macroinvertebrate survey and there was no evidence of turbidity, odors or oil in Ox Pasture Brook (MA DEP 1999c).
Based on this information, the Aesthetics Use is assessed as support.
NEWBURY
GEORGETOWN
GROVELAND
NEWBURYPORT
IPSWICH
ROWLEY
NEWBURY
Headwaters at small unnamed pondeast of Bradford Street, Rowley
Outlet of small, unnamed impoundmentwest of Ox Pasture Hill, Rowley
Parker River WatershedOx Pasture Brook
MA91-10
N

Parker River Watershed Water Quality Assessment Report 38 91wqar.doc DWM CN 54.0
Ox Pasture Brook (MA91-10) Use Summary Table Causes Sources
Designated Uses Status Known Suspected Known Suspected
Aquatic Life*
SUPPORT*
Fish Consumption
NOT ASSESSED
Primary Contact
NOT ASSESSED
Secondary Contact
NOT ASSESSED
Aesthetics
SUPPORT
* “Alert Status” issues identified RECOMMENDATIONS: OX PASTURE BROOK (MA91-10) • Since Massachusetts Audubon Society’s nonpoint source pollution study did not indicate any obvious
reductions in fecal coliform bacteria concentrations downstream of the StormTreat™ system, future monitoring is necessary to determine the sources of bacteria contamination.
• The Town of Rowley is currently upgrading failing septic systems. Review the results of the Town of
Rowley’s Board of Health in tracking the progress of these activities. • Determine if there is suitable habitat for anadromous fish and, if so, work with the Division of Marine
Fisheries fish ladder maintenance program and the Great Marsh Summit Initiative to install and upgrade fishways.

Parker River Watershed Water Quality Assessment Report 39 91wqar.doc DWM CN 54.0
LITTLE RIVER (SEGMENT MA91-11) Location: Parker Street, Newbury/Newburyport to confluence with Parker River, Newbury Segment Area: 0.09 square miles Classification: Class SA, ORW Land-use estimates for the subwatershed (map inset, gray shaded area):
Forest 31 % Residential 17 % Agriculture 17%
In 2001, DFWELE stocked trout in Little River for the purpose of recreational fishing (DFWELE 26 April 2001). There is a large beaver dam constricting the flow of the Little River at the upstream end of this segment (Tomczyk 2001b). WMA WATER WITHDRAWAL SUMMARY: There are no regulated water withdrawals from this segment Little River. NPDES SURFACE DISCHARGE SUMMARY: The Hero Coatings, Inc. Newburyport facility applied for an individual NPDES wastewater permit to discharge to a tributary to the Little River. An individual permit was not deemed necessary and the facility applied for the multi-sector storm water permit (MAR05B077). This permit has since expired and the facility has not applied for coverage under the new general permit. There are seven additional multi-sector storm water permittees that discharge to the Little River:
• Newbury Auto, Newbury MAR05B735 • JRM Hauling and Recycling Services, Newbury MAR05B873 • Newburyport Layover, Newbury MAR05C013 • GI Plastek Limited Partnership, Newburyport MAR05B658 • Bixby International Corp, Newburyport MAR05C035 • Bixby International Corp, Newburyport MAR05C053 • MBTA, Newburyport MA05C013
USE ASSESSMENT: SHELLFISHING
The DMF Shellfish Status Report of October 2000 indicates that area N4.3 (which includes this entire segment of the Little River) is prohibited (0.02 mi2) (DFWELE 2000).
Based on the DMF shellfish closure, the Shellfishing Use is assessed as non-support for 0.02 mi2 and is not assessed for the remaining 0.07 mi2. PRIMARY AND SECONDARY CONTACT RECREATION
Between January 1997 and November 2000 DMF collected dry weather fecal coliform bacteria samples from one station on this segment of the Little River as part of their shellfish growing area classification (Kennedy 2001). Counts ranged between 2.9 and 900 cfu/100mL with a total of 43 samples collected. Twenty-seven samples were collected during the primary contact recreation season (1 April through 15 October). During the primary contact recreation season, only one sample (4%) exceeded 400 cfu/100mL.
NEWBURY
GEORGETOWN
GROVELAND
NEWBURYPORT
IPSWICH
ROWLEY
NEWBURY
Source, Newbury
Confluence with Parker River, Newbury
Parker River WatershedLittle RiverMA91-11
N

Parker River Watershed Water Quality Assessment Report 40 91wqar.doc DWM CN 54.0
Between April 1999 and April 2000 the Merrimack Valley Planning Commission sampled fecal coliform bacteria bi-weekly from 27 sites in the Little River subwatershed (9–Little River; 17–Little River tributaries; 1-Parker River). Table 5 summarizes the 127 fecal coliform bacteria samples from the nine stations on the Little River (upstream to downstream). Table 5. Merrimack Valley Planning Commission fecal coliform bacteria summary – Little River (MVPC 2000a).
Station Number Number of Samples Range (cfu/100mL) Geometric Mean (cfu per 100mL) Dry Wet High Low Dry Wet
LR-9 Hale St 11 1 30 3 5 30 LR-8 Colby Farm NW 10 2 2400* 5 152 379 LR-7 Colby Farm SE 12 2 625 10 179 68 LR-6 Scotland Rd 3 0 5 5 5 - LR-5 Route 1 16 2 435 5 89 87 LR-4 Hanover St 16 2 520 5 91 81 LR-3 Boston Rd 18 2 900 5 76 36 LR-2 Hay St 15 2 390 5 57 192 LR-1 Newman Rd 11 2 347 5 48 250
* The only sample above 2,000 cfu/100mL
Within the primary contact recreation season (n=58) only five counts were greater than 400 cfu/100mL. Through the entire year of sampling (n=127) only one (2,400 cfu/100mL) exceeded the Secondary Contact Recreation guidance value.
Based on these data the Primary and Secondary Contact Recreation Uses are assessed as support. The Primary Contact Recreation Use is on “Alert Status”, however, due to elevated coliform bacteria near MVPC’s Colby Farm sampling station (LR8).
Little River (MA91-11) Use Summary Table Causes Sources
Designated Uses Status Known Suspected Known Suspected
Aquatic Life
NOT ASSESSED
Fish Consumption
NOT ASSESSED
Shellfishing
NON-SUPPORT 0.02 mi2 NOT ASSESSED 0.07 mi2 For watershed-wide shellfish growing area data see Appendix E.
Primary Contact*
SUPPORT*
Secondary Contact
SUPPORT
Aesthetics
NOT ASSESSED
* “Alert Status” issues identified

Parker River Watershed Water Quality Assessment Report 41 91wqar.doc DWM CN 54.0
RECOMMENDATIONS: LITTLE RIVER (MA91-11) • In June 2001 a compliance inspection was conducted on the JRM Hauling and Recycling Services
(MAR05B873) Newbury facility. No Storm Water Prevention Plan was in place at this time (O’Keefe 2001). Determine the current status of their Prevention Plan.
• Work with MVPC to implement their management recommendations from the NPS assessment of the
Little River including: o Assist farm property owners with design, cost-sharing and implementation of BMPs o Investigate structural integrity of the City of Newburyport’s municipal sewer lines, particularly in
the industrial park. o Work with the City of Newburyport and the Town of Newbury to map their municipal storm
drainage infrastructure. • Determine if Hero Coatings, Inc. should apply for coverage under the new multi-sector general storm
water permit or if they are eligible for a no-exposure certification.

Parker River Watershed Water Quality Assessment Report 42 91wqar.doc DWM CN 54.0
BULL BROOK (SEGMENT MA91-04) Location: Headwaters in Ipswich to inlet Bull Brook Reservoir, Ipswich Segment Length: 2.2 miles Classification: Class A, ORW Land-use estimates for the subwatershed (map inset, gray shaded area):
Forest 76 % Agriculture 12 % Residential 7%
Bull Brook is protected as an Outstanding Resource Water under the Massachusetts Surface Water Quality Standards. WMA WATER WITHDRAWAL AND NPDES WASTEWATER DISCHARGE SUMMARY: There are no known regulated water withdrawals or surface discharges in this segment. However, Bull Brook is a tributary to Bull Brook Reservoir, a public drinking water supply. USE ASSESSMENT: No current data/information were available, therefore, all uses for Bull Brook are currently not assessed. The MA DEP DWP and the public water supplier, however, maintain current drinking water supply data for Bull Brook Reservoir.
Bull Brook (MA91-04) Use Summary Table Aquatic Life Fish
Consumption Drinking Water
Primary Contact
Secondary Contact Aesthetics
NOT ASSESSED
RECOMMENDATIONS: BULL BROOK (MA91-04) • When the MA DEP DWP SWAP evaluations are completed, review, develop and implement
recommendations to protect Bull Brook (a tributary to a drinking water supply). • Conduct a preliminary analysis to prioritize the need for collecting quality assured data to fully assess
all designated uses of Bull Brook. Review the USGS Statewide Water-Quality Network Report for examples of the monitoring necessary to completely assess all uses (USGS 2001).
NEWBURY
GEORGETOWN
GROVELAND
NEWBURYPORT
IPSWICH
ROWLEY
NEWBURY
Parker River WatershedBull BrookMA91-04
N
Headwaters, Ipswich
Inlet Bull Brook Resevoir, Ipswich

Parker River Watershed Water Quality Assessment Report 43 91wqar.doc DWM CN 54.0
NEWBURY
GEORGETOWN
GROVELAND
NEWBURYPORT
IPSWICH
ROWLEY
NEWBURY
Parker River WatershedEgypt River
MA91-13
East of Jewett Hill, Ipswich
Outlet of Bull BrookReservoir, Ipswich
EGYPT RIVER (SEGMENT MA91-13) Location: Outlet of Bull Brook Reservoir, Ipswich to East of Jewett Hill (Lat 42’42”23.40 long 70’51”47.58) Ipswich Segment Length/Area: 1.1 miles Classification: Class B, ORW Land-use estimates for the subwatershed (map inset, gray shaded area):
Forest 71% Open Land 9% Residential 9%
Marine Biological Laboratory as part of the PIE-LTER study sampled nutrients from the Egypt River at the Route 1A/ 133 Bridge in Ipswich monthly since 1999. These samples were collected to determine nutrient loadings to the Plum Island estuarine system (MBL 2001). WATER WITHDRAWAL SUMMARY:
Facility PWS ID# WMA Permit #
WMA Registration
#
Source G = ground S = surface
Authorized Withdrawal
(MGD)
1999 Average Withdrawal
(MGD)
Ipswich Water
Department* 3144000
Permit Application
under review
31614401
01G – Mile Lane Well 02G – Brown's Well
01S – Dow Brook Reservoir 02S – Bull Brook Reservoir
0.64* reg. 0.20** reg.
01G – 0.05 02G – 0.28 01S – 0.57 02S – 0.0 Total 0.9*
* withdrawal in Parker River Watershed ** authorized withdrawal in Ipswich River Watershed The Ipswich Water Department’s withdrawal from the Parker River subwatershed is not subject to the IBT; the IBT applies when the withdrawals cross both a basin divide and town line. In this case the withdrawals are made in the Town of Ipswich and used in the Town of Ipswich. In 1999, the Water Department withdrew 0.26 MGD over their registered volume from their sources in the Parker River subwatershed alone (their actual withdrawal in 1999 was 1.30 MGD from both the Ipswich and Parker River Watershed sources). The Ipswich Water Department applied for a permit in 1995 but never completed their application. The Water Department has recently signed an ACO with MA DEP to complete the Water Management Permit process. Conditions included within the ACO require the Water Department to implement aggressive water conservation requirements prior to the permit issuance by MA DEP (LeVangie 2001 and O’Keefe 2001). NPDES SURFACE DISCHARGE SUMMARY: There are no known regulated discharges to this segment of the Egypt River. USE ASSESSMENT: Too little instream water quality data were available to assess all uses; they are currently not assessed. However, due to the large water withdrawals by the Ipswich Water Department from the Egypt River subwatershed (MA91-13), the Aquatic Life Use is on “Alert Status”.

Parker River Watershed Water Quality Assessment Report 44 91wqar.doc DWM CN 54.0
Egypt River (MA91-13) Use Summary Table
Aquatic Life*
Fish Consumption Shellfishing Primary
Contact Secondary
Contact Aesthetics
NOT ASSESSED
* “Alert Status” issues identified RECOMMENDATIONS: EGYPT RIVER (MA91-13) • Complete the WMA permit process for the increased water withdrawal by Ipswich Water Department.
Permit process should evaluate the potential impacts of withdrawals on streamflow/habitat. • Conduct instream biological monitoring to determine the effects of water withdrawals on habitat and
aquatic life. • When available, review the results and recommendations from the Marine Biological Laboratory’s
land use and nutrient input study of Plum Island Sound. • Conduct a preliminary analysis to prioritize the need for collecting quality assured data to fully assess
all designated uses of the Egypt River. Review the USGS Statewide Water-Quality Network Report for examples of the monitoring necessary to completely assess all uses (USGS 2001).

Parker River Watershed Water Quality Assessment Report 45 91wqar.doc DWM CN 54.0
EGYPT RIVER (SEGMENT MA91-14) Location: East of Jewett Hill (Lat 42’42’’23.40 long 70’51’’47.58) Ipswich to confluence with Muddy Run and Rowley River, Rowley/Ipswich Segment Area: 0.014 square miles Classification: Class SA, ORW Land-use estimates for the subwatershed (map inset, gray shaded area):
Forest 67% Residential 9% Agriculture 9%
WMA WATER WITHDRAWAL AND NPDES SURFACE DISCHARGE SUMMARY: There are no known regulated water withdrawals or surface discharges in this segment of the Egypt River. The Ipswich Water Department is, however, registered to withdraw 0.64 MGD from the upstream segment of the Egypt River (MA91-13) and is applying for a permit with an increase in volume. USE ASSESSMENT: AQUATIC LIFE No instream water quality data were available to assess the Aquatic Life Use; this segment is currently not assessed. However, due to the large water withdrawals by the Ipswich Water Department from the upstream segment of the Egypt River (MA91-13), the Aquatic Life Use is on “Alert Status”. SHELLFISHING
The DMF Shellfish Status Report of October 2000 indicates that area N4.2 (which includes this entire segment of the Egypt River) is classified as a conditionally approved shellfish bed (0.014 mi2) (DFWELE 2000).
Based on the DMF shellfish status (conditionally approved) the Shellfishing Use for this segment is assessed as partial support.
NEWBURY
GEORGETOWN
GROVELAND
NEWBURYPORT
IPSWICH
ROWLEY
NEWBURY
East of Jewett Hill, Ipswich
Confluence with Muddy Run andRowley River, Rowley/Ipswich
Parker River WatershedEgypt River
MA91-14
N

Parker River Watershed Water Quality Assessment Report 46 91wqar.doc DWM CN 54.0
Egypt River (MA91-14) Use Summary Table Causes Sources
Designated Uses Status Known Suspected Known Suspected
Aquatic Life*
NOT ASSESSED*
Fish Consumption
NOT ASSESSED
Shellfishing
PARTIAL SUPPORT For watershed-wide shellfish growing area data see Appendix E.
Primary Contact
NOT ASSESSED
Secondary Contact
NOT ASSESSED
Aesthetics
NOT ASSESSED
* “Alert Status” issues identified RECOMMENDATIONS: EGYPT RIVER (MA91-14) • Conduct instream biological monitoring to determine the effects of water withdrawals on habitat and
aquatic life. • Conduct a preliminary analysis to prioritize the need for collecting quality assured data to fully assess
all designated uses of the Egypt River. Review the USGS Statewide Water-Quality Network Report for examples of the monitoring necessary to completely assess all uses (USGS 2001).

Parker River Watershed Water Quality Assessment Report 47 91wqar.doc DWM CN 54.0
ROWLEY RIVER (SEGMENT MA91-05) Location: Confluence with Egypt River and Muddy Run Rowley/Ipswich to mouth at Plum Island Sound Rowley/Ipswich Segment Area: 0.3 square miles Classification: Class SA, ORW This segment is on the 1998 303(d) list of impaired waters for pathogens (Table 3). The Parker River Clean Water Association collects water quality and fecal coliform bacteria data from Rowley Town Docks. A summary of their 1999 sampling season results can be found in their Parker River Watch Annual Report (PRCWA 1999). WMA WATER WITHDRAWAL AND NPDES SURFACE DISCHARGE SUMMARY: There are no known regulated water withdrawals or surface discharges in this segment of the Rowley River. The Ipswich Water Department is however, registered to withdraw 0.64 MGD from a headwater tributary (Egypt River MA91-13) and has applied for a permit to increase withdrawal volume. There is a vessel sewage pump-out facility (operating for 24-hours/day, closed winters), at Perley’s Marina located on Warehouse Lane, Rowley. Additionally, there is a pump-out boat on the Rowley River operating Saturday and Sunday 10am – 6pm and on weekdays by appointment (closed winters). USE ASSESSMENT AQUATIC LIFE Chemistry – water Marine Biological Laboratory as part of the PIE-LTER study collected surface water quality data (DO, % saturation, temperature, pH) from one station EST-SO-28 Rowley on the Rowley River. Data are summarized below for the samples collected at both dawn and dusk between 1996 and 2000 (MBL 2001).
DO Dissolved oxygen concentrations ranged between 6.7 and 13.1 mg/L (n=59). Percent saturation ranged from 79 to 111% (n=58) with only four samples greater than 110%. Dissolved oxygen measurements were collected pre-dawn and, therefore, represent a worse-case scenario.
Temperature
The maximum temperature measurement was 21.2°C (n=59).
pH The pH ranged between 7.1 and 8.3 SU (n=16).
Instream physicochemical measurements from the Rowley River indicate high water quality. Based on these data the Aquatic Life Use is assessed as support. However, due to the water withdrawals by the Ipswich Water Department from the headwater tributaries of this segment (see segment MA91-13, Egypt River), the Aquatic Life Use is on “Alert Status”.
SHELLFISHING
The DMF Shellfish Status Report of October 2000 indicates that areas N4.0 and N4.2 (which include this entire segment of the Rowley River) are classified as conditionally approved (0.30 mi2) (DFWELE 2000).
NEWBURY
GEORGETOWN
GROVELAND
NEWBURYPORT
IPSWICH
ROWLEY
NEWBURY
Parker River WatershedRowley River
MA91-05
N
Mouth at Plum Island Sound, Rowley/ipswich
Confluence with Egypt River and Muddy Run, Rowley/Ipswich

Parker River Watershed Water Quality Assessment Report 48 91wqar.doc DWM CN 54.0
Based on the DMF shellfish bed status (conditionally approved) the Shellfishing Use for this segment is assessed as partial support.
PRIMARY AND SECONDARY CONTACT RECREATION
Between January 1997 and February 2001 DMF collected dry weather fecal coliform bacteria samples from one station on this segment of the Rowley River as part of their shellfish growing area classification (Kennedy 2001). Counts ranged between 2 and 46 cfu/100mL with a total of 46 samples collected. Twenty-seven samples were collected during the primary contact recreation season (1 April through 15 October).
Based on these data, both the Primary and Secondary Contact Recreation Uses are assessed as support.
Rowley River (MA91-04) Use Summary Table Causes Sources
Designated Uses Status Known Suspected Known Suspected
Aquatic Life*
SUPPORT*
Fish Consumption
NOT ASSESSED
Shellfishing
PARTIAL SUPPORT For watershed-wide shellfish growing area data see Appendix E.
Primary Contact
SUPPORT
Secondary Contact
SUPPORT
Aesthetics
NOT ASSESSED
* “Alert Status” issues identified RECOMMENDATIONS: ROWLEY RIVER (MA91-05) • Conduct a nonpoint source evaluation to determine if land-based sources of contamination are
impacting the DMF shellfish growing areas. • Conduct instream biological monitoring to determine the effects of water withdrawals on habitat and
aquatic life in the Rowley River. • When available, review the results and recommendations from the Marine Biological Laboratory’s
land use and nutrient input study of Plum Island Sound. • Review the results of the ongoing surveys conducted by Parker River Clean Water Association.
When available work with the PRCWA to implement their recommendations.

Parker River Watershed Water Quality Assessment Report 49 91wqar.doc DWM CN 54.0
PAINE CREEK (SEGMENT MA91-03) Location: Headwaters, Ipswich to confluence with Eagle Hill River, Ipswich Segment Area: 0.08 square miles Classification: Class SA, ORW This segment is on the 1998 303(d) list of impaired waters for pathogens (Table 3). WMA WATER WITHDRAWAL AND NPDES SURFACE DISCHARGE SUMMARY: There are no regulated water withdrawals or wastewater discharges in this segment. USE ASSESSMENT
SHELLFISHING
The DMF Shellfish Status Report of October 2000 indicates that area N4.1 (which includes this entire segment of Paine Creek) is conditionally approved (0.08 mi2)(DFWELE 2000).
Based on the DMF shellfish growing area status (conditionally approved), the Shellfishing Use for this segment is assessed as partial-support.
Paine Creek (MA91-03) Use Summary Table Causes Sources
Designated Uses Status Known Suspected Known Suspected
Aquatic Life
NOT ASSESSED
Fish Consumption
NOT ASSESSED
Shellfishing
PARTIAL SUPPORT For watershed-wide shellfish growing area data see Appendix E.
Primary Contact
NOT ASSESSED
Secondary Contact
NOT ASSESSED
Aesthetics
NOT ASSESSED
RECOMMENDATIONS: PAINE CREEK (MA91-03) • Conduct a preliminary analysis to prioritize the need for collecting quality assured data to fully assess
all designated uses of Paine Creek. Review the USGS Statewide Water-Quality Network Report for examples of the monitoring necessary to completely assess all uses (USGS 2001).
NEWBURY
GEORGETOWN
GROVELAND
NEWBURYPORT
IPSWICH
ROWLEY
NEWBURY
Parker River WatershedPaine Creek
MA91-03
N
Headwaters, Ipswich
Confluence with Eagle Hill River, Ipswich

Parker River Watershed Water Quality Assessment Report 50 91wqar.doc DWM CN 54.0
EAGLE HILL RIVER (SEGMENT MA91-06) Location: Headwaters near Town Farm Road, Ipswich to the mouth at Plum Island Sound, Ipswich Segment Area: 0.4 square miles Classification: Class SA, ORW This segment is on the 1998 303(d) list of impaired waters for pathogens (Table 3). WMA WATER WITHDRAWAL AND NPDES WASTEWATER DISCHARGE SUMMARY: There are no regulated water withdrawals or wastewater discharges in this segment. However, there is a vessel sewage pump-out boat (Ipswich town dock) operating from May through September. USE ASSESSMENT AQUATIC LIFE Chemistry – water Marine Biological Laboratory as part of the PIE-LTER study has collected surface water quality data (DO, % saturation, T, pH) from one station EST-SO-29 Eagle on the Eagle Hill River. Data are summarized below for the samples collected at both dawn and dusk between 1996 and 2000 (MBL 2001).
DO Dissolved oxygen concentrations ranged between 6.4 and 13.4 mg/L (n=55). Percent saturation ranged from 79 to 114% (n=57) with five samples greater than 110%. Dissolved oxygen measurements were collected pre-dawn and, therefore, represent a worse-case scenario.
Temperature
The maximum temperature measurement was 21.3°C (n=57).
pH The pH ranged between 7.2 and 8.32 SU (n=16).
Instream physicochemical measurements from this segment of the Eagle River indicate high water quality. Based on these data the Aquatic Life Use is assessed as support. SHELLFISHING
The DMF Shellfish Status Report of October 2000 indicates that area N4.1 (which includes this entire segment of the Eagle River) is classified as conditionally approved (0.40 mi2) (DFWELE 2000).
Based on the DMF shellfish growing area status (conditionally approved), Shellfishing Use for this segment is assessed as partial-support. PRIMARY AND SECONDARY CONTACT RECREATION
Between January 1997 and February 2001 DMF collected dry weather fecal coliform bacteria samples from one station on this segment of the Eagle Hill River as part of their shellfish growing area classification (Kennedy 2001). Counts ranged between 2 and 347 cfu/100mL with a total of 53 samples collected. Thirty-two samples were collected during the primary contact recreation season (1 April through 15 October).
Based on these data, both the Primary and Secondary Contact Recreation Uses are assessed as support.
NEWBURY
GEORGETOWN
GROVELAND
NEWBURYPORT
IPSWICH
ROWLEY
NEWBURY
Parker River WatershedEagle Hill River River
MA91-06
N
Mouth at Plum Island Sound, Ipswich
Headwaters near Town Farm Road, Ipswich

Parker River Watershed Water Quality Assessment Report 51 91wqar.doc DWM CN 54.0
Eagle Hill River (MA91-06) Use Summary Table Causes Sources
Designated Uses Status Known Suspected Known Suspected
Aquatic Life
SUPPORT
Fish Consumption
NOT ASSESSED
Shellfishing
PARTIAL SUPPORT For watershed-wide shellfish growing area data see Appendix E.
Primary Contact
SUPPORT
Secondary Contact
SUPPORT
Aesthetics
NOT ASSESSED
RECOMMENDATIONS: EAGLE HILL RIVER (MA91-06) • Conduct a nonpoint source evaluation to determine if land based sources of contamination are
impacting the DMF shellfish growing areas.

Parker River Watershed Water Quality Assessment Report 52 91wqar.doc DWM CN 54.0
PLUM ISLAND RIVER (SEGMENT MA91-15) Location: From “high sandy” sandbar just north of the confluence with Pine Island Creek, Newbury to confluence with Plum Island Sound, Newbury. Segment Area: 0.41 square miles Classification: Class SA, ORW Note: Plum Island River was formerly listed as a waterbody in the Merrimack River Basin (MA84A-23). This segment is on the 1998 303(d) list of impaired waters for pathogens (Table 3). WMA WATER WITHDRAWAL AND NPDES WASTEWATER DISCHARGE SUMMARY: There are no regulated water withdrawals or wastewater discharges in this segment. USE ASSESSMENT
SHELLFISHING
The DMF Shellfish Status Report of October 2000 indicates that area N4.0 (which includes this entire segment) is conditionally approved (DFWELE 2000).
Based on the DMF shellfish growing area status, the Shellfishing Use is assessed as partial support for this entire segment.
PRIMARY AND SECONDARY CONTACT RECREATION
Between January 1997 and February 2001 DMF collected dry weather fecal coliform bacteria samples from one station on this segment of the Plum Island River as part of their shellfish growing area classification (Kennedy 2001). Counts ranged between 2 and 243 cfu/100mLs with a total of 89 samples collected. Fifty-two samples were collected during the primary contact recreational season (1 April through 15 October).
Based on these data, both the Primary and Secondary Contact Recreation Uses are assessed as support.
Plum Island River (MA91-15) Use Summary Table Causes Sources
Designated Uses Status Known Suspected Known Suspected
Aquatic Life
NOT ASSESSED
Fish Consumption
NOT ASSESSED
Shellfishing
PARTIAL SUPPORT For watershed-wide shellfish growing area data see Appendix E.
Primary Contact
SUPPORT
Secondary Contact
SUPPORT
Aesthetics
NOT ASSESSED
WestNewbury
Groveland
Newburyport
Newbury
RowleyGeorgetown
Boxford Ipswich
Mouth at Plum Island Sound
Parker River WatershedPlum Island River
MA91-15
N
'High Sandy' sandbar, Newbury

Parker River Watershed Water Quality Assessment Report 53 91wqar.doc DWM CN 54.0
RECOMMENDATIONS: PLUM ISLAND RIVER (MA91-15) • The Plum Island River drains south from ”High sandy” sandbar Newbury into the Plum Island Sound
not north into the Merrimack River Basin. Therefore, in the next review of the SWQS, classify the Plum Island River as a waterbody in the Parker River Watershed, not the Merrimack River Basin.

Parker River Watershed Water Quality Assessment Report 54 91wqar.doc DWM CN 54.0
PLUM ISLAND SOUND (SEGMENT MA91-12) Location: From the mouth of both the Parker River and Plum Island River, Newbury to the Atlantic Ocean, Ipswich (includes Ipswich Bay) Segment Area: 4.7 square miles Classification: Class SA, ORW Note: Plum Island Sound was formerly listed as a waterbody in the Merrimack River Basin (MA84A-24). This segment is on the 1998 303(d) list of impaired waters for pathogens (Table 3). WMA WATER WITHDRAWAL AND NPDES WASTEWATER DISCHARGE SUMMARY: There are no regulated water withdrawals or wastewater discharges in this segment. There is as vessel sewage pump-out boat operating on demand seasonally 24 hours per day on this segment of Plum Island Sound. USE ASSESSMENT AQUATIC LIFE Chemistry - water Marine Biological Laboratory as part of the PIE-LTER study has collected surface water quality data (DO, % saturation, temperature, pH) from four stations within the Plum Island Sound:
EST-SO-26 Nelson Lat. 42.74716149 Long. 70.82008701 EST-SO-27 Far Point Lat. 42.73555086 Long. 70.80121718 EST-SO-30 IBYC Lat. 42.70978014 Long. 70.79483658 EST-SO-31 Spindle Lat. 42.697826 Long. 70.78356249
Data are summarized below for the samples collected at both dawn and dusk between 1996 and 2000 (MBL 2001).
DO Dissolved oxygen concentrations at all four stations combined ranged between 5.7 and 13.1 mg/L (n=206) with only two samples less than 6.0 mg/L. Percent saturation ranged from 67 to 114% (n=207) with only two samples less than 75%. Dissolved oxygen measurements were collected pre-dawn and, therefore, represent a worse-case scenario.
Temperature
The maximum temperature measurement at all stations combined was 22.2°C (n=207).
pH The pH ranged between 6.56 and 8.31 SU (n=56).
Instream physicochemical measurements collected from Plum Island Sound indicate high water quality. Based on these data the Aquatic Life Use is assessed as support.
SHELLFISHING
The DMF Shellfish Status Report of October 2000 indicates that areas N3.0 and N6.0 (which includes 1.19 mi2 of this segment) are approved, area N4.0 (which includes 3.33 mi2 of this segment) is conditionally approved and area N6.1 (which includes 0.18 mi2 of this segment) is prohibited (DFWELE 2000).
Based on the DMF shellfish growing area status, the Shellfishing Use is assessed as support for 1.19 mi2, partial support for 3.33 mi2, and non-support for 0.18 mi2.
NEWBURY
GEORGETOWN
GROVELAND
NEWBURYPORT
IPSWICH
ROWLEY
NEWBURY
Plum Island Sound,Newbury/Rowley/Ipswich
Parker River WatershedPlum Island Sound
MA91-12
N

Parker River Watershed Water Quality Assessment Report 55 91wqar.doc DWM CN 54.0
PRIMARY AND SECONDARY CONTACT RECREATION
Between January 1997 and February 2001 DMF collected dry weather fecal coliform bacteria samples from three stations on Plum Island Sound as part of their shellfish growing area classification (Kennedy 2001). Counts ranged between 2 and 110 cfu/100mL with a total of 140 samples collected. Eighty-two samples were collected during the primary contact recreation season (1 April through 15 October). Additionally, the DMF Shellfish Status Report of October 2000 indicates that areas N3.0 and N6.0 (which includes 1.18 mi2 of this segment) are approved (DFWELE 2000).
Based on the fecal coliform bacteria data and the shellfish status the Primary and Secondary Contact Recreation Uses are assessed as support. AESTHETICS
Most of Plum Island Sound is surrounded by the Parker River National Wildlife Refuge and is also part of the Parker River/Essex Bay Area of Critical Environmental Concern. The Sound has long been recognized as one of the most pristine estuarine habitats in the northeast and is an area of regional and statewide significance. Plum Island Sound is in the center of the 20,000 acres of salt marsh that lies between Cape Ann and the New Hampshire border. This salt marsh is important as a migratory stop for birds, as an anadromous fish run, and as a spawning ground for finfish and other organisms (PRCWA 4 September 2000).
Based on the above information (e.g., pristine habitat, undisturbed, etc), the Aesthetics Use is assessed as support for the Plum Island Sound.
Plum Island Sound (MA91-12) Use Summary Table Causes Sources
Designated Uses Status Known Suspected Known Suspected
Aquatic Life
SUPPORT
Fish Consumption
NOT ASSESSED
Shellfishing
SUPPORT 1.19 mi2 PARTIAL SUPPORT 3.33 mi2 NON-SUPPORT 0.18 mi2 For watershed-wide shellfish growing area data see Appendix E.
Primary Contact
SUPPORT
Secondary Contact
SUPPORT
Aesthetics
SUPPORT

Parker River Watershed Water Quality Assessment Report 56 91wqar.doc DWM CN 54.0
RECOMMENDATIONS: PLUM ISLAND SOUND (MA91-12) • Support boat pump-out programs on Plum Island Sound and on two tributaries (Pine and Grape
Island Creeks) to Plum Island Sound. • When available, review the results and recommendations from the Marine Biological Laboratory’s
land use and nutrient input study of Plum Island Sound. • Plum Island Sound receives the flow from the waters in the Parker River Watershed (e.g., Plum
Island, Little, Parker, Mill, Rowley, Egypt, and Eagle Hill rivers). Therefore, in the next review of the SWQS, classify the Plum Island Sound as a waterbody in the Parker River Watershed, not the Merrimack River Basin.

Parker River Watershed Water Quality Assessment Report 57 91wqar.doc DWM CN 54.0
MA91013
MA91001
MA91012
MA91010
MA91004
MA91007
MA91014
MA91011
MA91003
MA91005
MA91002MA91017
MA91015
MA91008
WEST
NEWBURYPORT
BOXFORDIPSWICH
ROWLEY
NEWBURY
GEORGETOWN
NEWBURYPORT
GROVELAND
2 0 2 4 Miles
N
MERRIMACK RIVERBASIN
IPSWICH RIVERBASIN
ATLANTIC OCEAN
PARKER RIVER WATERSHED – POND SEGMENT ASSESSMENTS A total of 17 ponds/impoundments (the term "ponds" will hereafter be used to include both) have been identified and assigned Pond and Lake Information System (PALIS) code numbers in the Parker River Watershed (Ackerman 1989 and MA DEP 2001a). The total surface area of the Parker River Watershed ponds is 322.6 acres. Almost all of the ponds are relatively small. In fact, only two ponds have surface areas greater than 50 acres. This report presents information on 14 of these ponds that are in the DWM/EPA WBS database. The 14 ponds assessed in this report represent 94% of the acreage in the Parker River Watershed. They lie wholly or partly within eight of the watershed’s nine communities (Figure 7). Three ponds (Georgetown, Warren Street, and Parker River ponds), which total 20 acres, are unassessed; they are not currently included as segments in the DWM/EPA WBS database.
TROPHIC STATUS EVALUATION Ponds are dynamic ecosystems that over time undergo a process of succession from one trophic state to another. Under natural conditions most ponds move from a nutrient poor (oligotrophic) condition through an intermediate (mesotrophic) stage of nutrient availability and biological productivity to a nutrient-rich or highly productive (eutrophic) state. For the purposes of this report trophic status was estimated primarily using visual observations of macrophyte cover and phytoplankton populations observed in 1994 by MA DEP DWM. Occasionally, older data from more detailed diagnostic studies were utilized. A more definitive assessment of trophic status would require more extensive collection of water quality and biological data. The trophic status estimates for the ponds assessed in the Parker River Watershed are presented in Table 6; 63% of the acreage was mesotrophic, 15% was eutrophic, and 5% was hypereutrophic. The trophic status was undetermined for 18% of the pond acreage.
Figure 7. Assessed Ponds in the Parker River Watershed

Parker River Watershed Water Quality Assessment Report 58 91wqar.doc DWM CN 54.0
Table 6. Parker River Watershed Assessed Ponds (Bold indicates 1998 303(d) listed).
Pond Waterbody
Identification Code (WBID)
Class Size (Acres)
Trophic Status Estimate
Baldpate Pond, Boxford MA91001 B 55 mesotrophic
Bull Brook Reservoir*, Ipswich MA91002 A 10 undetermined
Central Street Pond, Rowley MA91003 B 5 eutrophic
Crane Pond, Groveland MA91004 B 19 undetermined
Dow Brook Reservoir, Ipswich* MA91005 A 17 undetermined
Little Crane Pond, West Newbury MA91007 B 5 undetermined
Lower Mill Pond, Rowley MA91008 B 14 hypereutrophic
Pentucket Pond, Georgetown MA91010 B 85 mesotrophic
Quills Pond, Newbury MA91011 B 4 undetermined
Rock Pond, Georgetown MA91012 B 49.6 mesotrophic
Sperrys Pond, Boxford MA91013 B 6 eutrophic
State Street Pond, Newburyport MA91014 B 5 eutrophic
Upper Mill Pond, Rowley MA91015 B 21 eutrophic
Wilson Pond, Rowley MA91017 B 7 eutrophic
POND USE ASSESSMENTS Pond assessments are based on information gathered during DWM 1994 synoptic pond surveys as well as pertinent information from other sources (e.g., abutters, herbicide applicators, diagnostic/feasibility studies, MDPH, etc.). The DWM pond surveys focused on observations of water quality and quantity (e.g., water level, sedimentation, etc.), the presence of native and non-native aquatic plants (both distribution and areal cover) and presence/severity of algal blooms (MA DEP 1994). In cases where it is best professional judgment that conditions have not changed since the 1994 surveys these data were used for assessment purposes. In-pond measurements of dissolved oxygen, pH, and temperature and sampling for nutrients, chlorophyll a and fecal coliform bacteria would have provided sufficient data to completely assess the status of the Aquatic Life and Primary Contact Recreation Uses, but were not readily available. When no visual impairment was identified during the synoptic surveys it could not be assumed that water quality conditions met standards and, therefore, neither the Aquatic Life nor Primary Contact Recreation Uses could be assessed as support – they were not assessed.
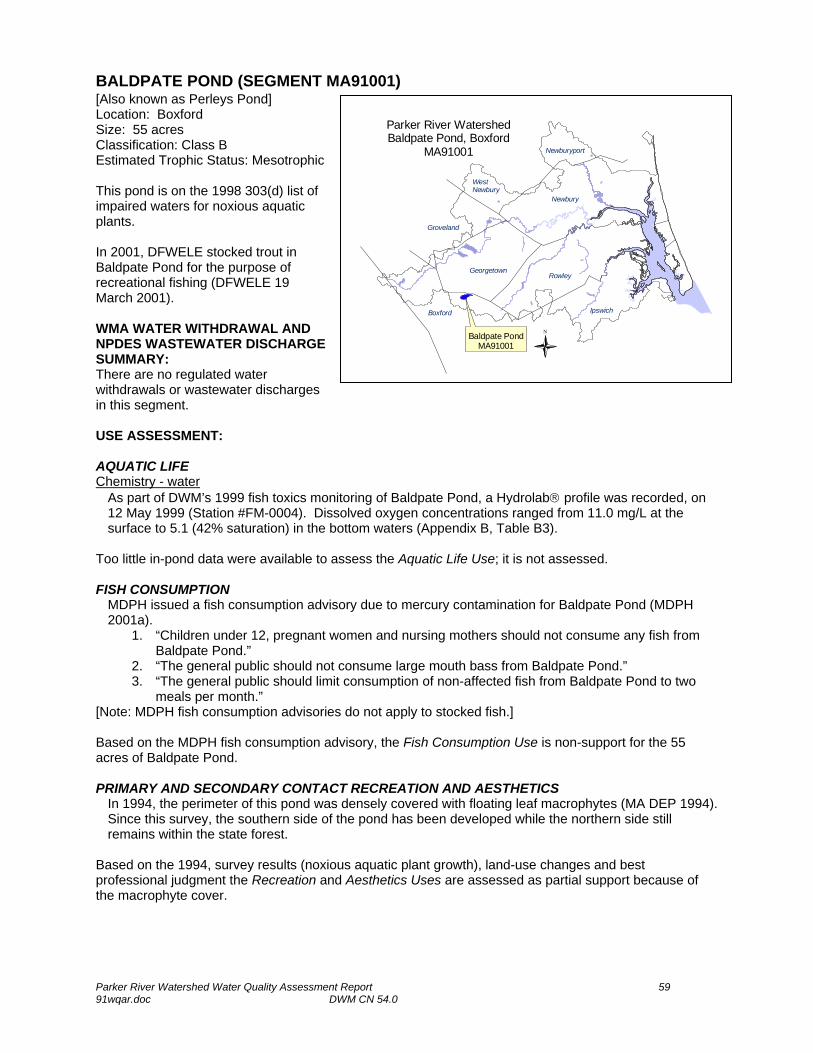
Parker River Watershed Water Quality Assessment Report 59 91wqar.doc DWM CN 54.0
WestNewbury
Groveland
Newburyport
Newbury
RowleyGeorgetown
Boxford Ipswich
N
Parker River WatershedBaldpate Pond, Boxford
MA91001
Baldpate PondMA91001
BALDPATE POND (SEGMENT MA91001) [Also known as Perleys Pond] Location: Boxford Size: 55 acres Classification: Class B Estimated Trophic Status: Mesotrophic This pond is on the 1998 303(d) list of impaired waters for noxious aquatic plants. In 2001, DFWELE stocked trout in Baldpate Pond for the purpose of recreational fishing (DFWELE 19 March 2001). WMA WATER WITHDRAWAL AND NPDES WASTEWATER DISCHARGE SUMMARY: There are no regulated water withdrawals or wastewater discharges in this segment. USE ASSESSMENT: AQUATIC LIFE Chemistry - water
As part of DWM’s 1999 fish toxics monitoring of Baldpate Pond, a Hydrolab® profile was recorded, on 12 May 1999 (Station #FM-0004). Dissolved oxygen concentrations ranged from 11.0 mg/L at the surface to 5.1 (42% saturation) in the bottom waters (Appendix B, Table B3).
Too little in-pond data were available to assess the Aquatic Life Use; it is not assessed. FISH CONSUMPTION
MDPH issued a fish consumption advisory due to mercury contamination for Baldpate Pond (MDPH 2001a).
1. “Children under 12, pregnant women and nursing mothers should not consume any fish from Baldpate Pond.”
2. “The general public should not consume large mouth bass from Baldpate Pond.” 3. “The general public should limit consumption of non-affected fish from Baldpate Pond to two
meals per month.” [Note: MDPH fish consumption advisories do not apply to stocked fish.] Based on the MDPH fish consumption advisory, the Fish Consumption Use is non-support for the 55 acres of Baldpate Pond. PRIMARY AND SECONDARY CONTACT RECREATION AND AESTHETICS
In 1994, the perimeter of this pond was densely covered with floating leaf macrophytes (MA DEP 1994). Since this survey, the southern side of the pond has been developed while the northern side still remains within the state forest.
Based on the 1994, survey results (noxious aquatic plant growth), land-use changes and best professional judgment the Recreation and Aesthetics Uses are assessed as partial support because of the macrophyte cover.

Parker River Watershed Water Quality Assessment Report 60 91wqar.doc DWM CN 54.0
Baldpate Pond (MA91001) Use Summary Table Causes Sources
Designated Uses Status Known Suspected Known Suspected
Aquatic Life
NOT ASSESSED
Fish Consumption
NON SUPPORT Mercury Unknown
Primary Contact
PARTIAL SUPPORT 10 acres NOT ASSESSED 45 acres
Noxious aquatic plants Unknown Land use
changes
Secondary Contact
PARTIAL SUPPORT 10 acres NOT ASSESSED 45 acres
Noxious aquatic plants Unknown Land use
changes
Aesthetics
PARTIAL SUPPORT 10 acres NOT ASSESSED 45 acres
Noxious aquatic plants Unknown Land use
changes
RECOMMENDATIONS: BALDPATE POND (MA91001) • Coordinate with MA DEM and/or other groups conducting pond surveys to collect quality assured water
chemistry/biological data including watershed surveys to identify NPS pollution sources. • Determine if there are any bathing beaches on Baldpate Pond. If so, review data from “Beaches Bill”
required water quality testing (bacteria sampling from all formal bathing beaches) to assess the status of the recreational uses.
• Implement recommendations identified in the Town of Boxford’s Three Pond Study, Nutrient Modeling
Results. • Implement recommendations of the Baldpate TMDL currently in preparation. • Control noxious plant populations:
o To manage aquatic plant populations additional monitoring should be conducted to determine the extent of the problem. The draft Generic Environmental Impact Report for Eutrophication and Aquatic Plant Management in Massachusetts (MA DEP and DEM 1998) should be consulted prior to the development of any pond management plan to control noxious aquatic plant species. Plant control options can be selected from several techniques (e.g., bottom barriers, drawdown, herbicides, etc.) each of which has advantages and disadvantages that need to be addressed for the specific site.
o Another important component of a management plan is prevention of further spreading of certain invasive plant species. Once the extent of the problem is determined and control practices are exercised, vigilant monitoring needs to be practiced to guard against infestations occurring in unaffected areas (of this pond and to other ponds) and to ensure that managed areas stay in check. A key portion of the prevention program should be posting of boat access points with signs to educate and alert pond-users to the problem and responsibility of spreading these species.

Parker River Watershed Water Quality Assessment Report 61 91wqar.doc DWM CN 54.0
IpswichBoxford
GeorgetownRowley
Newbury
Newburyport
Groveland
WestNewbury
IpswichBoxford
GeorgetownRowley
Newbury
Newburyport
Groveland
WestNewbury
IpswichBoxford
GeorgetownRowley
Newbury
Newburyport
Groveland
WestNewbury
Parker River WatershedBull Brook Reservoir, Ipswich
MA91002
NBull Brook ReservoirMA91002
BULL BROOK RESERVOIR (SEGMENT MA91002) Location: Ipswich Size: 10 acres Classification: Class A, ORW Estimated Trophic Status: Undetermined Bull Brook Reservoir is protected as an Outstanding Resource Water under the Massachusetts Surface Water Quality Standards. WATER WITHDRAWAL SUMMARY:
Facility PWS ID# WMA Permit #
WMA Registration
#
Source S = surface
Authorized Withdrawal
(MGD)
1999 Average Withdrawal
(MGD)
Ipswich Water
Department* 3144000
Permit Application
under review
31614401 02S – Bull Brook Reservoir 0.64* reg. 0.20** reg.
02S – 0.0
* withdrawal in Parker River Watershed ** authorized withdrawal in Ipswich River Watershed The Ipswich Water Department’s withdrawal from the Parker River subwatershed is not subject to the IBT; the IBT applies when the withdrawals cross both a basin divide and town line. In this case the withdrawals are made in the Town of Ipswich and used in the Town of Ipswich. In 1999, the Water Department withdrew 0.26 MGD over their registered volume from their sources in the Parker River subwatershed alone (their actual withdrawal in 1999 was 1.30 MGD from both the Ipswich and Parker River Watershed sources). The Ipswich Water Department applied for a permit in 1995 but never completed their application. The Water Department has recently signed an ACO with MA DEP to complete the Water Management Permit process. Conditions included within the ACO require the Water Department to implement aggressive water conservation requirements prior to the permit issuance by MA DEP (LeVangie 2001 and O’Keefe 2001). NPDES WASTEWATER DISCHARGE SUMMARY: Based on the available information, there are no regulated surface wastewater discharges in this segment. USE ASSESSMENT: No current data/information were available, therefore, all uses are not assessed at this time. The MA DEP DWP and the public water supplier do, however, maintain current drinking water supply data.
Bull Brook Reservoir (Segment MA91002) Use Summary Table Aquatic Life Fish
Consumption Drinking Water
Primary Contact
Secondary Contact Aesthetics
NOT ASSESSED

Parker River Watershed Water Quality Assessment Report 62 91wqar.doc DWM CN 54.0
RECOMMENDATIONS: BULL BROOK RESERVOIR (SEGMENT MA91002) • When the MA DEP DWP SWAP evaluations are completed, review, develop and implement
recommendations to protect the Bull Brook Reservoir drinking water supply. • Complete the WMA permit process for the increased water withdrawal by Ipswich Water Department.
Permit process should evaluate the potential impacts of withdrawals on streamflow/habitat • Coordinate with MA DEM and/or other groups conducting pond surveys to collect quality assured water
chemistry/biological data including watershed surveys to identify NPS pollution sources.

Parker River Watershed Water Quality Assessment Report 63 91wqar.doc DWM CN 54.0
WestNewbury
Groveland
Newburyport
Newbury
RowleyGeorgetown
Boxford Ipswich
WestNewbury
Groveland
Newburyport
Newbury
RowleyGeorgetown
Boxford Ipswich
WestNewbury
Groveland
Newburyport
Newbury
RowleyGeorgetown
Boxford Ipswich
Parker River WatershedCentral Street Pond, Rowley
MA91003
N
Central Street PondMA91003
CENTRAL STREET POND (SEGMENT MA91003) [Also known as Marr’s Pond] Location: Rowley Size: 5 acres Classification: Class B Estimated Trophic Status: Eutrophic This pond is on the 1998 303(d) list of impaired waters for noxious aquatic plants (MA DEP 1999a). There is a sand and gravel operation upstream of this pond. WMA WATER WITHDRAWAL AND NPDES WASTEWATER DISCHARGE SUMMARY: There are no regulated water withdrawals or wastewater discharges in this segment. USE ASSESSMENT: PRIMARY AND SECONDARY CONTACT RECREATION AND AESTHETICS
In 1994, approximately two-thirds of the Waterbody was densely covered with floating leaf plants (MA DEP 1994). There have been no known changes to this waterbody since DWM’s 1994 survey (Tomczyk 2001b).
Based on the noxious aquatic plant growth and best professional judgment, three acres of the pond are assessed as non-support for these uses and two acres are currently not assessed.
Central Street Pond (Segment MA91003) Use Summary Table Causes Sources
Designated Uses Status Known Suspected Known Suspected
Aquatic Life
NOT ASSESSED
Fish Consumption
NOT ASSESSED
Primary Contact
NON-SUPPORT 3 acres NOT ASSESSED 2 acres
Noxious aquatic plants Unknown
Secondary Contact
NON-SUPPORT 3 acres NOT ASSESSED 2 acres
Noxious aquatic plants Unknown
Aesthetics
NON-SUPPORT 3 acres NOT ASSESSED 2 acres
Noxious aquatic plants Unknown

Parker River Watershed Water Quality Assessment Report 64 91wqar.doc DWM CN 54.0
RECOMMENDATIONS: CENTRAL STREET POND (SEGMENT MA91003) • There is a sand and gravel operation upstream of this pond. Identify if this facility has any withdrawals
and/or discharges and determine the needs for appropriate permits (WMA and or NPDES). Investigate the impacts from this facility on the Central Street Pond subwatershed.
• Coordinate with MA DEM and/or other groups conducting pond surveys to collect quality assured water
chemistry/biological data including watershed surveys to identify NPS pollution sources. • Work with the Town of Rowley to reduce the number of domestic ducks on this pond through sign
posting and public education. • Implement recommendations of the Total Phosphorus TMDL currently in preparation. • Control noxious plant populations:
o To manage aquatic plant populations additional monitoring should be conducted to determine the extent of the problem. The draft Generic Environmental Impact Report for Eutrophication and Aquatic Plant Management in Massachusetts (MA DEP and DEM 1998) should be consulted prior to the development of any pond management plan to control noxious aquatic plant species. Plant control options can be selected from several techniques (e.g., bottom barriers, drawdown, herbicides, etc.) each of which has advantages and disadvantages that need to be addressed for the specific site.
o Another important component of a management plan is prevention of further spreading of certain invasive plant species. Once the extent of the problem is determined and control practices are exercised, vigilant monitoring needs to be practiced to guard against infestations occurring in unaffected areas (of this pond and to other ponds) and to ensure that managed areas stay in check. A key portion of the prevention program should be posting of boat access points with signs to educate and alert pond-users to the problem and responsibility of spreading these species.
o Educate the public as to the proper use of fertilizers, methods of yard waste disposal, etc. to minimize nutrient inputs that may contribute to excessive plant growth.

Parker River Watershed Water Quality Assessment Report 65 91wqar.doc DWM CN 54.0
WestNewbury
Groveland
Newburyport
Newbury
RowleyGeorgetown
Boxford Ipswich
WestNewbury
Groveland
Newburyport
Newbury
RowleyGeorgetown
Boxford Ipswich
WestNewbury
Groveland
Newburyport
Newbury
RowleyGeorgetown
Boxford Ipswich
Parker River WatershedCrane Pond, Groveland
MA91004
N
Crane PondMA91004
CRANE POND (SEGMENT MA91004) Location: Groveland Size: 19 acres Classification: Class B Estimated Trophic Status: Undetermined This pond is on the 1998 303(d) list of impaired waters for noxious aquatic plants (MA DEP 1999a). This pond is located within the Crane Pond Wildlife Management Area. It is best professional judgment that the noxious aquatic plant growth is naturally occurring. WMA WATER WITHDRAWAL AND NPDES WASTEWATER DISCHARGE SUMMARY: There are no regulated water withdrawals or wastewater discharges in this segment. USE ASSESSMENT: No current data/information were available, therefore, all uses are not assessed at this time.
Crane Pond (Segment MA91004) Use Summary Table Aquatic Life Fish
Consumption Primary Contact
Secondary Contact Aesthetics
NOT ASSESSED
RECOMMENDATIONS: CRANE POND (SEGMENT MA91004) • Coordinate with MA DEM and/or other groups conducting pond surveys to collect quality assured water
chemistry/biological data including watershed surveys to identify NPS pollution sources. • Implement recommendations of the Total Phosphorus TMDL currently in preparation.

Parker River Watershed Water Quality Assessment Report 66 91wqar.doc DWM CN 54.0
WestNewbury
Groveland
Newburyport
Newbury
RowleyGeorgetown
Boxford Ipswich
WestNewbury
Groveland
Newburyport
Newbury
RowleyGeorgetown
Boxford Ipswich
WestNewbury
Groveland
Newburyport
Newbury
RowleyGeorgetown
Boxford Ipswich
Parker River WatershedDow Brook Reservoir, Ipswich
MA91005
NDow Brook Reservoir
MA91005
DOW BROOK RESERVOIR (SEGMENT MA91005) Location: Ipswich Size: 17 acres Classification: Class A, ORW Estimated Trophic Status: Undetermined Dow Brook Reservoir is protected as an Outstanding Resource Water under the Massachusetts Surface Water Quality Standards. WATER WITHDRAWAL SUMMARY:
Facility PWS ID# WMA Permit #
WMA Registration
# Source
S = surface Authorized Withdrawal
(MGD)
1999 Average Withdrawal
(MGD)
Ipswich Water
Department* 3144000
Permit Application
under review
31614401 01S – Dow Brook Reservoir
0.64* reg. 0.20** reg.
01S – 0.57
* withdrawal in Parker River Watershed ** authorized withdrawal in Ipswich River Watershed The Ipswich Water Department’s withdrawal from the Parker River subwatershed is not subject to the IBT; the IBT applies when the withdrawals cross both a basin divide and town line. In this case the withdrawals are made in the Town of Ipswich and used in the Town of Ipswich. In 1999, the Water Department withdrew 0.26 MGD over their registered volume from their sources in the Parker River subwatershed alone (their actual withdrawal in 1999 was 1.30 MGD from both the Ipswich and Parker River Watershed sources). The Ipswich Water Department applied for a permit in 1995 but never completed their application. The Water Department has recently signed an ACO with MA DEP to complete the Water Management Permit process. Conditions included within the ACO require the Water Department to implement aggressive water conservation requirements prior to the permit issuance by MA DEP (LeVangie 2001, and O’Keefe 2001) NPDES WASTEWATER DISCHARGE SUMMARY: Based on the available information, there are no regulated surface wastewater discharges in this segment. USE ASSESSMENT: No current data/information were available, therefore, all uses are not assessed at this time. The MA DEP DWP and the public water supplier, however, maintain current drinking water supply data.
Dow Brook Reservoir (Segment MA91002) Use Summary Table Aquatic Life Fish
Consumption Drinking Water
Primary Contact
Secondary Contact Aesthetics
NOT ASSESSED

Parker River Watershed Water Quality Assessment Report 67 91wqar.doc DWM CN 54.0
RECOMMENDATIONS: DOW BROOK RESERVOIR (SEGMENT MA91005) • When the Drinking Water Program SWAP evaluations are completed, review, develop and implement
recommendations to protect the Dow Brook Reservoir drinking water supply. • Complete the WMA permit process for the increased water withdrawal by Ipswich Water Department.
Permit process should evaluate the potential impacts of withdrawals on streamflow/habitat • Coordinate with MA DEM and/or other groups conducting pond surveys to collect quality assured water
chemistry/biological data including watershed surveys to identify NPS pollution sources. • Conduct instream biological monitoring to determine the effects of water withdrawals on habitat and
aquatic life.

Parker River Watershed Water Quality Assessment Report 68 91wqar.doc DWM CN 54.0
WestNewbury
Groveland
Newburyport
Newbury
RowleyGeorgetown
Boxford Ipswich
WestNewbury
Groveland
Newburyport
Newbury
RowleyGeorgetown
Boxford Ipswich
WestNewbury
Groveland
Newburyport
Newbury
RowleyGeorgetown
Boxford Ipswich
Parker River WatershedLittle Crane Pond, West Newbury
MA91007
N
Little Crane PondMA91007
LITTLE CRANE POND (SEGMENT MA91007) Location: West Newbury Size: 5 acres Classification: Class B Estimated Trophic Status: Undetermined This pond is located within the Crane Pond Wildlife Management Area. WMA WATER WITHDRAWAL AND NPDES WASTEWATER DISCHARGE SUMMARY: There are no regulated water withdrawals or wastewater discharges in this segment. USE ASSESSMENT: No current data/information were available, therefore, all uses are not assessed at this time.
Little Crane Pond (Segment MA91007) Use Summary Table Aquatic Life Fish
Consumption Primary Contact
Secondary Contact Aesthetics
NOT ASSESSED
RECOMMENDATIONS: LITTLE CRANE POND (SEGMENT MA91007) • Coordinate with MA DEM and/or other groups conducting pond surveys to collect quality assured water
chemistry/biological data including watershed surveys to identify NPS pollution sources. • Determine if there are any bathing beaches on Little Crane Pond. If so, review data from “Beaches
Bill” required water quality testing (bacteria sampling from all formal bathing beaches) to assess the status of the recreational uses.

Parker River Watershed Water Quality Assessment Report 69 91wqar.doc DWM CN 54.0
WestNewbury
Groveland
Newburyport
Newbury
RowleyGeorgetown
Boxford Ipswich
WestNewbury
Groveland
Newburyport
Newbury
RowleyGeorgetown
Boxford Ipswich
WestNewbury
Groveland
Newburyport
Newbury
RowleyGeorgetown
Boxford Ipswich
Parker River WatershedLower Mill Pond, Rowley
MA91008
N
Lower Mill PondMA91008
LOWER MILL POND (SEGMENT MA91008) Location: Rowley Size: 14 acres Classification: Class B Estimated Trophic Status: Hypereutrophic This pond is on the 1998 303(d) list of impaired waters for noxious aquatic plants (MA DEP 1999a). WMA WATER WITHDRAWAL AND NPDES WASTEWATER DISCHARGE SUMMARY: There are no regulated water withdrawals or wastewater discharges in this segment. USE ASSESSMENT: AQUATIC LIFE
A DWM survey in 1994 identified 100% cover of aquatic plants on Lower Mill Pond. The exotic aquatic plant species, Trapa natans (Water Chestnut) was also present (MA DEP 1994). Although T. natans was only identified in Lower Mill Pond, possible paths of downstream spreading from this pond include the Mill River through a small, unnamed impoundment to the Parker River.
Based on the presence of the exotic T. natans, the Aquatic Life Use is assessed as partial support. PRIMARY AND SECONDARY CONTACT RECREATION AND AESTHETICS
In 1994, the entire Waterbody was densely covered with aquatic plants and algae (MA DEP 1994). There have been no changes in the Lower Mill Pond subwatershed to improve the recreational and aesthetics uses since the 1994 survey.
Based on the noxious aquatic plant growth and best professional judgment, the Recreation and Aesthetics Uses are assessed as non-support.
Lower Mill Pond (Segment MA91008) Use Summary Table Causes Sources
Designated Uses Status Known Suspected Known Suspected
Aquatic Life
PARTIAL SUPPORT Exotic species Unknown
Fish Consumption
NOT ASSESSED
Primary Contact
NON-SUPPORT Noxious aquatic plants Unknown
Secondary Contact
NON-SUPPORT Noxious aquatic plants Unknown
Aesthetics
NON-SUPPORT Noxious aquatic plants Unknown

Parker River Watershed Water Quality Assessment Report 70 91wqar.doc DWM CN 54.0
RECOMMENDATIONS: LOWER MILL POND (SEGMENT MA91008) • Control T. natans infestation and investigate the downstream spread of this exotic species by:
o For exotic aquatic plant species that are isolated to one or a few location(s), quick action is advisable to manage these populations in order to alleviate the need for costly and potentially fruitless efforts to do so in the future. Two courses of action should be pursued concurrently. More extensive surveys need to be conducted, particularly downstream from these recorded locations (Table 5), to determine the extent of the infestation. And, "spot" treatments (refer to the draft Generic Environmental Impact Report for Eutrophication and Aquatic Plant Management in Massachusetts [MA DEP and DEM 1998] for advantages and disadvantages) should be undertaken to control populations at these sites before they spread further. These treatments may be in the form of carefully hand-pulling individual plants in small areas. In larger areas, other techniques such as selective herbicide application may be necessary. In either case, the treatments should be undertaken prior to fruit formation and with a minimum of fragmentation of the individual plants. These cautions will minimize the spreading of the populations. This draft aquatic plant report (MA DEP and DEM 1998) should be consulted prior to the development of any pond management plan to control exotic aquatic plant species.
o As with the isolated cases, a program to manage the more extensive plant infestations should include additional monitoring efforts to determine the extent of the problem. The draft Generic Environmental Impact Report for Eutrophication and Aquatic Plant Management in Massachusetts (MA DEP and DEM 1998) should be consulted prior to the development of any pond management plan to control exotic aquatic plant species. Plant control options can be selected from several techniques (e.g., bottom barriers, drawdown, herbicides, etc.) each of which has advantages and disadvantages that need to be addressed for the specific site. However, methods that result in fragmentation (such as cutting or raking) should be discouraged because of the propensity for these plants to reproduce and spread vegetatively (from cuttings).
o Another important component of a management plan is prevention of further spreading of these plants. Once the extent of the problem is determined and control practices are exercised, vigilant monitoring needs to be practiced to guard against infestations occurring in unaffected areas (of this pond and to other ponds) and to ensure that managed areas stay in check. A key portion of the prevention program should be posting of boat access points with signs to educate and alert pond-users to the problem and responsibility of spreading these species.
• Coordinate with MA DEM and/or other groups conducting pond surveys to collect quality assured water
chemistry/biological data including watershed surveys to identify NPS pollution sources. • Educate the public as to the proper use of fertilizers, methods of yard waste disposal, etc. to minimize
nutrient inputs that may contribute to excessive plant growth. • Implement recommendations of the Total Phosphorus TMDL currently in preparation.

Parker River Watershed Water Quality Assessment Report 71 91wqar.doc DWM CN 54.0
WestNewbury
Groveland
Newburyport
Newbury
RowleyGeorgetown
Boxford Ipswich
WestNewbury
Groveland
Newburyport
Newbury
RowleyGeorgetown
Boxford Ipswich
WestNewbury
Groveland
Newburyport
Newbury
RowleyGeorgetown
Boxford Ipswich
Parker River WatershedPentucket Pond, Georgetown
MA91010
N
Pentucket PondMA91010
PENTUCKET POND (SEGMENT MA91010) Location: Georgetown Size: 85 acres Classification: Class B Estimated Trophic Status: Mesotrophic In April 1997 members of the Essex County Sportsmans Association built and installed a wooden Denil style ladder at the Pentucket Pond Dam. This ladder was constructed utilizing plans provided by DMF (Iwanowicz 2000). The Parker River Headwaters Stream Team conducts annual alewife fish counts at the Pentucket Pond dam in Georgetown, which is the last barrier to migration before the headwaters spawning ponds (PRCWA 2000). In 1999, the Stream Team identified that fish were swimming directly up the spillway (with difficulty), ignoring the temporary wooden fish ladder (DFWELE 25 August 1999). Warmwater fish species present in this pond include largemouth bass, chain pickerel, brown bullhead, pumpkinseed, bluegill, black crappie and alewife (DFWELE 26 April 2001). Pentucket Pond is stocked every spring with rainbow trout, and sometimes brown trout and brook trout. WMA WATER WITHDRAWAL AND NPDES WASTEWATER DISCHARGE SUMMARY: There are no regulated water withdrawals or surface wastewater discharges in this segment. USE ASSESSMENT: AQUATIC LIFE
The invasive exotic aquatic plant fanwort (Cabomba caroliniana) was found in Pentucket Pond in 1997 (Tomczyk 2001a). Although C. caroliniana was identified in Pentucket Pond, it could possibly spread through Crane Pond, and several small, unnamed impoundments to the Parker River. The town of Georgetown has taken steps to control its spread. As a method of control, Pentucket Pond was treated in 1999 with the chemical SONAR, a fluoridone herbicide (MA DEP 1999b).
Based on the presence of this exotic aquatic plant (C. caroliniana), the Aquatic Life Use is assessed as partial support. FISH CONSUMPTION
In 1994 fish toxics monitoring was conducted by MA DEP DWM in Pentucket Pond, Georgetown. Data from this survey are presented in Parker River segment MA91-01 (Table 4). Based on elevated mercury concentrations, MDPH issued a fish consumption advisory for Pentucket Pond (MDPH 2001a).
1. “Children under 12, pregnant women and nursing mothers should not consume any fish from Pentucket Pond.”
2. “The general public should not consume largemouth bass and black crappie from Pentucket Pond.”
3. “The general public should limit consumption of non-affected fish from Pentucket Pond to two meals per month.”
[Note: MDPH fish consumption advisories do not apply to stocked fish.]
The Fish Consumption Use is non-support for the 85 acres of Pentucket Pond, based on the MDPH fish consumption advisory.

Parker River Watershed Water Quality Assessment Report 72 91wqar.doc DWM CN 54.0
PRIMARY AND SECONDARY CONTACT RECREATION
The Merrimack Valley Planning Commission prepared a Pentucket Pond storm water assessment summary for the Town of Georgetown. This report states that the American Legion beach (a.k.a. town beach) has been closed repeatedly due to violations of the bathing beach standard. Although data from this project did not identify high levels of fecal coliform bacteria in the pond itself, high concentrations of fecal coliform bacteria were identified in a drainage ditch, from discharge pipes, and in stream culverts on multiple occasions (MVPC 2000b). Specifically, in June 1998 Georgetown DPH closed the American Legion bathing beach due to elevated levels of fecal coliform bacteria. The MVPC will also conduct a watershed assessment for Pentucket and Rock ponds from funds secured through the Massachusetts Watershed Initiative – 00-03/MWI (Tomczyk 2001b).
Based on the bathing beach closure and best professional judgment (e.g., discharge pipes, waterfowl populations, etc.) the Primary Contact Recreation Use is assessed as partial support. The Secondary Contact Recreation Use is not assessed at this time due to limited in-pond data.
Pentucket Pond (Segment MA91010) Use Summary Table Causes Sources
Designated Uses Status Known Suspected Known Suspected
Aquatic Life
PARTIAL SUPPORT Exotic species Unknown
Fish Consumption
NON SUPPORT Mercury Unknown
Primary Contact
PARTIAL SUPPORT Pathogens Urban Runoff/Storm Sewers
Secondary Contact
NOT ASSESSED
Aesthetics
NOT ASSESSED
RECOMMENDATIONS: PENTUCKET POND (SEGMENT MA91010) • Determine the effectiveness of the herbicide treatment on the C. caroliniana infestation. Prevent the
further spread of C. caroliniana to unaffected areas (of this pond and to other ponds). Post boat access points with signs to educate and alert pond-users to the problem and responsibility of spreading this exotic species.
• Coordinate with MA DEM and/or other groups conducting pond surveys to collect quality assured water
chemistry/biological data including watershed surveys to identify NPS pollution sources. • Work with the Parker River Stream Team to upgrade the current fishway at the Pentucket Pond dam
to support an anadromous fish run.

Parker River Watershed Water Quality Assessment Report 73 91wqar.doc DWM CN 54.0
• Review results of MVPC storm water assessment project, including (MVPC 2000b): o Encourage initiation of the Stormwater 104(b) project for Pentucket Pond. Storm water
management practices are being implemented by the town to address some of the suspected sources of the bacterial contamination at Pentucket Pond.
o Georgetown Housing Authority, a senior housing complex, installed a new on-site wastewater treatment system. Subsequently, they are discharging a cleaner effluent into the ground than their past systems and will no longer have to pump on almost a daily basis. Determine if the installation of the new system reduces fecal coliform bacteria levels and nutrient inputs to the Pentucket Pond subwatershed.
o Track the progress of the new sewer system installation and additional landscaping at American Legion Park. Determine the effectiveness these improvements on water quality (i.e., lower fecal coliform bacteria levels, lower suspended solids).
o Identify and remove any and all illicit household connections

Parker River Watershed Water Quality Assessment Report 74 91wqar.doc DWM CN 54.0
WestNewbury
Groveland
Newburyport
Newbury
RowleyGeorgetown
Boxford Ipswich
WestNewbury
Groveland
Newburyport
Newbury
RowleyGeorgetown
Boxford Ipswich
WestNewbury
Groveland
Newburyport
Newbury
RowleyGeorgetown
Boxford Ipswich
Parker River WatershedQuills Pond, Newbury
MA91011
N
Quills PondMA91011
QUILLS POND (SEGMENT MA91011) Location: Newbury Size: 4 acres Classification: Class B Estimated Trophic Status: Undetermined WMA WATER WITHDRAWAL AND NPDES WASTEWATER DISCHARGE SUMMARY: There are no regulated water withdrawals or wastewater discharges in this segment.
USE ASSESSMENT: No current data/information was available, therefore, all uses are not assessed at this time.
Quills Pond (Segment MA91011) Use Summary Table Aquatic Life Fish
Consumption Primary Contact
Secondary Contact Aesthetics
NOT ASSESSED
RECOMMENDATIONS: QUILLS POND (SEGMENT MA91011) • Coordinate with MA DEM and/or other groups conducting pond surveys to collect quality assured water
chemistry/biological data including watershed surveys to identify NPS pollution sources.

Parker River Watershed Water Quality Assessment Report 75 91wqar.doc DWM CN 54.0
WestNewbury
Groveland
Newburyport
Newbury
RowleyGeorgetown
Boxford Ipswich
WestNewbury
Groveland
Newburyport
Newbury
RowleyGeorgetown
Boxford Ipswich
WestNewbury
Groveland
Newburyport
Newbury
RowleyGeorgetown
Boxford Ipswich
Parker River WatershedRock Pond, Georgetown
MA91012
N
Rock PondMA91012
ROCK POND (SEGMENT MA91012) Location: Georgetown Size: 49.6 acres Classification: Class B Estimated Trophic Status: Mesotrophic In 2001, DFWELE stocked trout in Rock Pond for the purpose of recreational fishing (DFWELE 19 March 2001).
WMA WATER WITHDRAWAL SUMMARY:
Facility PWS ID# WMA Permit #
WMA Registration # Source
Authorized Withdrawal
(MGD)
1999 Average Withdrawal
(MGD)
G-Town Produce NA NA 31610502 Rock Pond 0.1 (184 days) Not Reported
NPDES WASTEWATER DISCHARGE SUMMARY: There are no regulated wastewater discharges to this segment. USE ASSESSMENT: AQUATIC LIFE Chemistry - water
As part of DWM’s 1999 fish toxics monitoring of Rock Pond, a Hydrolab® profile was recorded (Station #FM-0007). Dissolved oxygen concentrations below 6.0mg/L at 3.5 and 4.6 meters (Appendix B, Table B3).
Too little in-pond data were available to assess the Aquatic Life Use; it is not assessed. FISH CONSUMPTION
In 1999, MA DEP DWM collected fish from Rock Pond, Georgetown as part of both Year 2 of the watershed cycle and the MRS being coordinated by MA DEP’s Office of Research and Standards (Maietta 2000). The mean mercury concentrations in largemouth bass and yellow perch were 1.6 and 0.86 ppm wet weight, respectively. Due to elevated mercury concentrations, MDPH issued the following fish consumption advisory for Rock Pond, Georgetown (MDPH 2001a): The general public should not consume any fish from Rock Pond. [Note: MDPH fish consumption advisories do not apply to stocked fish.]
Based on the MDPH fish consumption advisory the Fish Consumption Use is non-support for the 49.6 acres of Rock Pond.

Parker River Watershed Water Quality Assessment Report 76 91wqar.doc DWM CN 54.0
Rock Pond (Segment MA91012) Use Summary Table Causes Sources
Designated Uses Status Known Suspected Known Suspected
Aquatic Life
NOT ASSESSED
Fish Consumption
NON-SUPPORT Mercury Unknown
Primary Contact
NOT ASSESSED
Secondary Contact
NOT ASSESSED
Aesthetics
NOT ASSESSED
RECOMMENDATIONS: ROCK POND (SEGMENT MA91012) • Coordinate with MA DEM and/or other groups conducting pond surveys to collect quality assured water
chemistry/biological data including watershed surveys to identify NPS pollution sources. • Determine if there are any bathing beaches on Rock Pond. If so review data from “Beaches Bill”
required water quality testing (bacteria sampling from all formal bathing beaches) to assess the status of the recreational uses.
• Request and review G-Town Produce’s average annual withdrawals of water from Rock Pond. • Work with local groups to conduct storm drain stenciling around Rock Pond.

Parker River Watershed Water Quality Assessment Report 77 91wqar.doc DWM CN 54.0
WestNewbury
Groveland
Newburyport
Newbury
RowleyGeorgetown
Boxford Ipswich
WestNewbury
Groveland
Newburyport
Newbury
RowleyGeorgetown
Boxford Ipswich
WestNewbury
Groveland
Newburyport
Newbury
RowleyGeorgetown
Boxford Ipswich
Parker River WatershedSperrys Pond, Boxford
MA91013
N
Sperrys PondMA91013
SPERRYS POND (SEGMENT MA91013) Location: Boxford Size: 6 acres Classification: Class B Estimated Trophic Status: Eutrophic This pond is on the 1998 303(d) list of impaired waters for noxious aquatic plants (MA DEP 1999a). WMA WATER WITHDRAWAL AND NPDES WASTEWATER DISCHARGE SUMMARY: There are no regulated water withdrawals or wastewater discharges in this segment. USE ASSESSMENT: PRIMARY AND SECONDARY CONTACT RECREATION AND AESTHETICS
A 1994 DWM synoptic survey identified very dense aquatic plant coverage on Sperrys Pond (MA DEP 1994). Since the time of the survey no actions have been taken to reduce/impede the plant growth.
Based on best professional judgment and noxious plant growth, the Recreation and Aesthetics Uses are assessed as non-support for Sperrys Pond.
Sperrys Pond (Segment MA91013) Use Summary Table Causes Sources
Designated Uses Status Known Suspected Known Suspected
Aquatic Life
NOT ASSESSED
Fish Consumption
NOT ASSESSED
Primary Contact
NON-SUPPORT Noxious aquatic plants Unknown
Secondary Contact
NON-SUPPORT Noxious aquatic plants Unknown
Aesthetics
NON-SUPPORT Noxious aquatic plants Unknown

Parker River Watershed Water Quality Assessment Report 78 91wqar.doc DWM CN 54.0
RECOMMENDATIONS: SPERRYS POND (SEGMENT MA91013) • Coordinate with MA DEM and/or other groups conducting pond surveys to collect quality assured water
chemistry/biological data including watershed surveys to identify NPS pollution sources • Implement recommendations of the Total Phosphorus TMDL currently in preparation. • Control noxious plant populations:
o To manage aquatic plant populations additional monitoring should be conducted to determine the extent of the problem. The draft Generic Environmental Impact Report for Eutrophication and Aquatic Plant Management in Massachusetts (MA DEP and DEM 1998) should be consulted prior to the development of any pond management plan to control noxious aquatic plant species. Plant control options can be selected from several techniques (e.g., bottom barriers, drawdown, herbicides, etc.) each of which has advantages and disadvantages that need to be addressed for the specific site.
o Another important component of a management plan is prevention of further spreading of certain invasive plant species. Once the extent of the problem is determined and control practices are exercised, vigilant monitoring needs to be practiced to guard against infestations occurring in unaffected areas (of this pond and to other ponds) and to ensure that managed areas stay in check. A key portion of the prevention program should be posting of boat access points with signs to educate and alert pond-users to the problem and responsibility of spreading these species.

Parker River Watershed Water Quality Assessment Report 79 91wqar.doc DWM CN 54.0
WestNewbury
Groveland
Newburyport
Newbury
RowleyGeorgetown
Boxford Ipswich
WestNewbury
Groveland
Newburyport
Newbury
RowleyGeorgetown
Boxford Ipswich
WestNewbury
Groveland
Newburyport
Newbury
RowleyGeorgetown
Boxford Ipswich
Parker River WatershedState Street Pond, Newburyport
MA91014
N
State Street PondMA91014
STATE STREET POND (SEGMENT MA91014) Location: Newburyport Size: 5 acres Classification: Class B Estimated Trophic Status: Eutrophic This pond is listed on the 1998 303(d) list of impaired waters for noxious aquatic plants (MA DEP 1999a). This pond is in a heavily developed residential area of Newburyport and is also bordered by Oak Hill Cemetery. WMA WATER WITHDRAWAL AND NPDES WASTEWATER DISCHARGE SUMMARY: There are no regulated water withdrawals or wastewater discharges in this segment. USE ASSESSMENT: AQUATIC LIFE
A 1994 DWM synoptic pond survey indicated that the pond was mostly filled by the encroachment of plants from the shoreline (MA DEP 1994). Additionally, the exotic aquatic plant, Cabomba caroliniana, (fanwort) was present. Although C. caroliniana was identified in State Street Pond, it could possibly spread from here to a small, unnamed impoundment through an unnamed tributary to the Little River. From the Little River this exotic species could spread to the Parker River. Since the time of the survey, no actions have been taken to reduce/impede the plant growth.
Based on best professional judgment, noxious plant growth and the presence of an exotic aquatic plant, the Aquatic Life Use is assessed as partial support for State Street Pond. PRIMARY AND SECONDARY CONTACT RECREATION AND AESTHETICS
A 1994 DWM synoptic pond survey indicated that the pond was almost entirely covered with dense weeds (MA DEP 1994). Since the time of the survey, no actions have been taken to reduce/impede the plant growth.
Based on best professional judgment and noxious plant growth, the Recreation and Aesthetic Uses are assessed as non-support for four acres of State Street Pond. The remaining acre is not assessed for these uses.

Parker River Watershed Water Quality Assessment Report 80 91wqar.doc DWM CN 54.0
State Street Pond (Segment MA91014) Use Summary Table Causes Sources
Designated Uses Status Known Suspected Known Suspected
Aquatic Life
PARTIAL SUPPORT Exotic species Unknown
Fish Consumption
NOT ASSESSED
Primary Contact
NON-SUPPORT 4 acres NOT ASSESSED 1 acre
Noxious aquatic plants Unknown
Secondary Contact
NON-SUPPORT 4 acres NOT ASSESSED 1 acre
Noxious aquatic plants Unknown
Aesthetics
NON-SUPPORT 4 acres NOT ASSESSED 1 acre
Noxious aquatic plants Unknown
RECOMMENDATIONS: STATE STREET POND (SEGMENT MA91014) • Control C. caroliniana and investigate the downstream spread of these species by:
o For exotic aquatic plant species that are isolated to one or a few location(s), quick action is advisable to manage these populations in order to alleviate the need for costly and potentially fruitless efforts to do so in the future. Two courses of action should be pursued concurrently. More extensive surveys need to be conducted, particularly downstream from these recorded locations (Table 5), to determine the extent of the infestation. And, "spot" treatments (refer to the draft Generic Environmental Impact Report for Eutrophication and Aquatic Plant Management in Massachusetts [MA DEP and DEM 1998] for advantages and disadvantages) should be undertaken to control populations at these sites before they spread further. These treatments may be in the form of carefully hand-pulling individual plants in small areas. In larger areas, other techniques such as selective herbicide application may be necessary. In either case, the treatments should be undertaken prior to fruit formation and with a minimum of fragmentation of the individual plants. These cautions will minimize the spreading of the populations. This draft aquatic plant report (MA DEP and DEM 1998) should be consulted prior to the development of any pond management plan to control exotic aquatic plant species.
o As with the isolated cases, a program to manage the more extensive plant infestations should include additional monitoring efforts to determine the extent of the problem. The draft Generic Environmental Impact Report for Eutrophication and Aquatic Plant Management in Massachusetts (MA DEP and DEM 1998) should be consulted prior to the development of any pond management plan to control exotic aquatic plant species. Plant control options can be selected from several techniques (e.g., bottom barriers, drawdown, herbicides, etc.) each of which has advantages and disadvantages that need to be addressed for the specific site. However, methods that result in fragmentation (such as cutting or raking) should be discouraged because of the propensity for these plants to reproduce and spread vegetatively (from cuttings).
o Another important component of a management plan is prevention of further spreading of these plants. Once the extent of the problem is determined and control practices are exercised, vigilant monitoring needs to be practiced to guard against infestations occurring in unaffected areas (of this pond and to other ponds) and to ensure that managed areas stay in check. A key portion of the prevention program should be posting of boat access points with signs to educate and alert pond-users to the problem and responsibility of spreading these species.
• Coordinate with MA DEM and/or other groups conducting pond surveys to collect quality assured water
chemistry/biological data including watershed surveys to identify NPS pollution sources • Implement recommendations of the Total Phosphorus TMDL currently in preparation. • Educate the public as to the proper use of fertilizers, methods of yard waste disposal, etc. to minimize
nutrient inputs that may contribute to excessive plant growth.

Parker River Watershed Water Quality Assessment Report 81 91wqar.doc DWM CN 54.0
WestNewbury
Groveland
Newburyport
Newbury
RowleyGeorgetown
Boxford Ipswich
WestNewbury
Groveland
Newburyport
Newbury
RowleyGeorgetown
Boxford Ipswich
WestNewbury
Groveland
Newburyport
Newbury
RowleyGeorgetown
Boxford Ipswich
Parker River WatershedUpper Mill Pond, Rowley
MA91015
N
Upper Mill PondMA91015
UPPER MILL POND (SEGMENT MA91015) [Also known as Mill Pond, Stewards Pond] Location: Rowley Size: 21 acres Classification: Class B Estimated Trophic Status: Eutrophic This pond is listed on the 1998 303(d) list of impaired waters for noxious aquatic plants (MA DEP 1999a). WMA WATER WITHDRAWAL AND NPDES WASTEWATER DISCHARGE SUMMARY: There are no regulated water withdrawals or wastewater discharges in this segment. USE ASSESSMENT: PRIMARY AND SECONDARY CONTACT RECREATION AND AESTHETICS
A 1994 DWM synoptic pond survey indicated that the pond was almost entirely covered with dense weeds (MA DEP 1994). Since the time of the survey, no actions have been taken to reduce/impede the plant growth.
Based on best professional judgment and the noxious plant growth, the Recreation and Aesthetics Uses are assessed as non-support for Upper Mill Pond.
Upper Mill Pond (Segment MA91015) Use Summary Table Causes Sources
Designated Uses Status Known Suspected Known Suspected
Aquatic Life
NOT ASSESSED
Fish Consumption
NOT ASSESSED
Primary Contact
NON-SUPPORT Noxious aquatic plants Unknown
Secondary Contact
NON-SUPPORT Noxious aquatic plants Unknown
Aesthetics
NON-SUPPORT Noxious aquatic plants Unknown

Parker River Watershed Water Quality Assessment Report 82 91wqar.doc DWM CN 54.0
RECOMMENDATIONS: UPPER MILL POND (SEGMENT MA91015) • Coordinate with MA DEM and/or other groups conducting pond surveys to collect quality assured water
chemistry/biological data including watershed surveys to identify NPS pollution sources. • Implement recommendations of the Total Phosphorus TMDL currently in preparation. • Control noxious plant populations:
o To manage aquatic plant populations additional monitoring should be conducted to determine the extent of the problem. The draft Generic Environmental Impact Report for Eutrophication and Aquatic Plant Management in Massachusetts (MA DEP and DEM 1998) should be consulted prior to the development of any pond management plan to control noxious aquatic plant species. Plant control options can be selected from several techniques (e.g., bottom barriers, drawdown, herbicides, etc.) each of which has advantages and disadvantages that need to be addressed for the specific site.
o Another important component of a management plan is prevention of further spreading of certain invasive plant species. Once the extent of the problem is determined and control practices are exercised, vigilant monitoring needs to be practiced to guard against infestations occurring in unaffected areas (of this pond and to other ponds) and to ensure that managed areas stay in check. A key portion of the prevention program should be posting of boat access points with signs to educate and alert pond-users to the problem and responsibility of spreading these species.
o Educate the public as to the proper use of fertilizers, methods of yard waste disposal, etc. to minimize nutrient inputs that may contribute to excessive plant growth.

Parker River Watershed Water Quality Assessment Report 83 91wqar.doc DWM CN 54.0
WestNewbury
Groveland
Newburyport
Newbury
RowleyGeorgetown
Boxford Ipswich
WestNewbury
Groveland
Newburyport
Newbury
RowleyGeorgetown
Boxford Ipswich
WestNewbury
Groveland
Newburyport
Newbury
RowleyGeorgetown
Boxford Ipswich
Parker River WatershedWilson Pond, Rowley
MA91017
NWilson PondMA91017
WILSON POND (SEGMENT MA91017) Location: Rowley Size: 7 acres Classification: Class B Estimated Trophic Status: Eutrophic This pond is on the 1998 303(d) list of impaired waters for noxious aquatic plants (MA DEP 1999a). WMA WATER WITHDRAWAL AND NPDES WASTEWATER DISCHARGE SUMMARY: There are no regulated water withdrawals or wastewater discharges in this segment.
USE ASSESSMENT: PRIMARY AND SECONDARY CONTACT RECREATION AND AESTHETICS
A 1994 DWM synoptic pond survey indicated that the pond was almost entirely covered with dense weeds (MA DEP 1994). Since the time of the survey, no actions have been taken to reduce/impede the plant growth.
Based on best professional judgment and the noxious plant growth, the Recreation and Aesthetics Uses are assessed as non-support for Wilson Pond.
Wilson Pond (Segment MA91017) Use Summary Table Causes Sources
Designated Uses Status Known Suspected Known Suspected
Aquatic Life
NOT ASSESSED
Fish Consumption
NOT ASSESSED
Primary Contact
NON-SUPPORT Noxious aquatic plants Unknown
Secondary Contact
NON-SUPPORT Noxious aquatic plants Unknown
Aesthetics
NON-SUPPORT Noxious aquatic plants Unknown

Parker River Watershed Water Quality Assessment Report 84 91wqar.doc DWM CN 54.0
RECOMMENDATIONS: WILSON POND (SEGMENT MA91017) • Coordinate with MA DEM and/or other groups conducting pond surveys to collect quality assured water
chemistry/biological data including watershed surveys to identify NPS pollution sources. • Determine if there are any bathing beaches on Wilson Pond. If so review data from “Beaches Bill”
required water quality testing (bacteria sampling from all formal bathing beaches) to assess the status of the recreational uses.
• Implement recommendations of the Total Phosphorus TMDL currently in preparation. • Control noxious plant populations:
o To manage aquatic plant populations additional monitoring should be conducted to determine the extent of the problem. The draft Generic Environmental Impact Report for Eutrophication and Aquatic Plant Management in Massachusetts (MA DEP and DEM 1998) should be consulted prior to the development of any pond management plan to control noxious aquatic plant species. Plant control options can be selected from several techniques (e.g., bottom barriers, drawdown, herbicides, etc.) each of which has advantages and disadvantages that need to be addressed for the specific site.
o Another important component of a management plan is prevention of further spreading of certain invasive plant species. Once the extent of the problem is determined and control practices are exercised, vigilant monitoring needs to be practiced to guard against infestations occurring in unaffected areas (of this pond and to other ponds) and to ensure that managed areas stay in check. A key portion of the prevention program should be posting of boat access points with signs to educate and alert pond-users to the problem and responsibility of spreading these species.
o Educate the public as to the proper use of fertilizers, methods of yard waste disposal, etc. to minimize nutrient inputs that may contribute to excessive plant growth.

Parker River Watershed Water Quality Assessment Report 85 91wqar.doc DWM CN 54.0
LITERATURE CITED Ackerman, M.T. 1989. Compilation of Lakes, Ponds, Reservoirs and Impoundments Relative to the Massachusetts Lake Classification Program. Publication: #15901-171-50-4-89-c.r. Technical Services Branch, Massachusetts Division of Water Pollution Control, Department of Environmental Quality Engineering. Westborough, MA. Beskenis, J. B. 1996. unpublished Draft Parker River Watershed 1994 Assessment. Massachusetts Department of Environmental Protection, Bureau of Resource Protection, Office of Watershed Management. Grafton, MA. Buchsbaum, R., A. Cooper and LeBlanc, J. 1996. The Plum Island Sound/Rivers Ecosystem: Current Status and Future Management. Massachusetts Audubon: North Shore Conservation Advocacy. Wenham, MA.
DFWELE. 25 August 1999. Adopt-a-Stream - Parker River Headwaters. [Online]. Department of Fisheries, Wildlife, and Environmental Law Enforcement, Riverways Program, Parker River Headwaters Stream Team. http://www.state.ma.us/dfwele/river/rivParkhw.htm. 12 July 2000. DFWELE. 2000. Designated Shellfish Growing Areas Datalayer – October 2000. Published by MassGIS (MA Office of Geographic and Environmental Information), Executive Office of Environmental Affairs for Department of Fisheries, Wildlife, and Environmental Law Enforcement, Division of Marine Fisheries. Boston, MA.
DFWELE. 19 March 2001. Massachusetts Trout Stocked Waters – 2001. [Online]. Department of Fisheries, Wildlife, and Environmental Law Enforcement, Mass Wildlife. http://www.state.ma.us/dfwele/dfw/dfwsttrt.htm. 2 July 2001. DFWELE. 26 April 2001. Pond Maps Online! [Online]. Department of Fisheries, Wildlife, and Environmental Law Enforcement, Mass Wildlife. http://www.state.ma.us/dfwele/dfw/dfw_pond.htm. 12 July 2001. Environmental Law Reporter. 1988. Clean Water Deskbook. Environmental Law Institute. Washington, D.C. EPA. 1997. Guidelines for Preparation of the Comprehensive State Water Quality Assessments (305(b) Reports) and Electronic Updates: Report Contents. US Environmental Protection Agency, Assessment and Watershed Protection Division (4503f). Office of Wetlands, Oceans and Watersheds. Office of Water. Washington D.C.
EPA. 19 November 1999. Federal Register Document. [Online]. United States Environmental Protection Agency. http://www.epa.gov/fedrgstr/EPA-WATER/1998/December/Day-10/w30272.htm. Gaines, J.L. and V. E. Carr 1992. Plum Island Sound Hydrographic Studies May 4-8, 1992. Northeast Technical Services, Shellfish Sanitation Branch in cooperation with Massachusetts Division of Marine Fisheries. U.S. Department of Health and Human Services, Public Health Service, Food Drug Administration, Office of Seafoods. Washington D.C. Halliwell, D.B., W.A. Kimball and Screpetis, A. J. 1982. Massachusetts Stream Classification Program Part I: Inventory of Rivers and Streams. Massachusetts Division of Fisheries and Wildlife, Department of Fisheries, Wildlife, and Recreational Vehicles and Massachusetts Division of Water Pollution Control, Department of Environmental Quality Engineering. Westborough, MA. Hogan, P.H. 2001. Personal Communication. Parker River Watershed: permitting information. Massachusetts Department of Environmental Protection, Bureau of Resource Protection, Division of Watershed Management. Worcester, MA. Iwanowicz R. 2000. Parker River Fishway Stewardship. DMF NEWS [Online], Department of Fisheries, Wildlife, and Environmental Law Enforcement, Division of Marine Fisheries. Volume 17. http://www.state.ma.us/dfwele/dmf/dmfnq297.htm#Parker. 12 July 2001.
Kennedy, J. ([email protected]). 2001. Sanitary Survey Database Printout. Department of Fisheries, Wildlife, and Environmental Law Enforcement, Division of Marine Fisheries, Shellfish Management Program. Newburyport, MA. E-mail to Stella Kiras, MA DEP dated 23 August 2001. Leahy K.W. 1998. Nonpoint Source Comprehensive Implementation Program for the Mill River Subwatershed. Nonpoint Source No. 94-07. Massachusetts Audubon Society: North Shore. Prepared for MA DEP BRP and the EPA. Wenham, MA. LeVangie, D. 2001. Water withdrawal registration and permit information. Water Management Act Database. Massachusetts Department of Environmental Protection, Division of Watershed Management, Database Manager. Boston, MA.

Parker River Watershed Water Quality Assessment Report 86 91wqar.doc DWM CN 54.0
MA DEM. 1993 June. Areas of Critical Concern (ACEC) Program Guide June 1993. Commonwealth of Massachusetts, Executive Office of Environmental Affairs, Department of Environmental Management, ACEC Program. Boston, MA. MA DEM. 2000. Area of Critical Concern (ACEC) Parker River/Essex Bay. [Online]. Department of Environmental Management. http://www.state.ma.us/dem/programs/acec/l-parriv.htm.10 July 2001. MA DEP. 1994. Open File. OWM Parker River Watershed Lake Synoptic Survey Field Sheets. Massachusetts surface water quality standards. Massachusetts Department of Environmental Protection, Office of Watershed Management. Grafton, MA. MA DEP. 1996. (Revision of 1995 report). Massachusetts surface water quality standards. Massachusetts Department of Environmental Protection, Division of Water Pollution Control, Technical Services Branch. Westborough, MA. 114p. (Revision of 314 CMR 4.00, effective June 23, 1996.) MA DEP. 1999a. Final Massachusetts Section 303(d) List of Waters 1998. Massachusetts Department of Environmental Protection, Division of Watershed Management. Worcester, MA. MA DEP. 1999b. License to Apply Chemicals for the Control of Nuisance Aquatic Plants - Database. Department of Environmental Protection. Division of Watershed Management. Boston, MA. MA DEP. 1999c. TM-91-1. DWM 1999 RBP III Habitat assessment field sheets: Parker River Watershed. Massachusetts Department of Environmental Protection, Division of Watershed Management. Worcester, MA. MA DEP. 2000. Commonwealth of Massachusetts Summary of Water Quality 2000. Massachusetts Department of Environmental Protection, Division of Watershed Management. Worcester, MA. MA DEP. 2001a. Open File. PALIS updates. Massachusetts Department of Environmental Protection, Division of Watershed Management. Worcester, MA. MA DEP. 2001b. Open NPDES permit files. Massachusetts Department of Environmental Protection, Division of Watershed Management. Worcester, MA. MA DEP. 2001c. Open WMA permit files. Massachusetts Department of Environmental Protection, Northeast Regional Office. Wilmington, MA. MA DEP and DEM. 1998. Eutrophication and Aquatic Plant Management in Massachusetts Draft Generic Environmental Impact Report. Massachusetts Department of Environmental Protection, Division of Watershed Management. Worcester, MA and Massachusetts Department of Environmental Management. Boston, MA. MassGIS. 2000. Hydrography - statewide 1:25000. MassGIS (MA Office of Geographic and Environmental Information), Executive Office of Environmental Affairs, Boston, MA. MBL. 2001. PLUM ISLAND ECOSYSTEMS LONG-TERM ECOLOGICAL RESEARCH SITE (PIE-LTER). [Online]. Marine Biological Laboratory. http://ecosystems.mbl.edu/PIE. June 2001. MDPH. 1994. Public Health Interim Freshwater Fish Consumption Advisory. Massachusetts Department of Public Health. Boston, MA. MDPH. 2001a. Freshwater Fish Consumption Advisory List. Massachusetts Department of Public Health. Boston, MA. MDPH. 2001b. Public Health Statewide Fish Consumption Advisory. Massachusetts Department of Public Health. Boston, MA. Maietta, R. J. 2000. 1999 Fish Toxics Monitoring Public Request and Year 2 Watershed Surveys. Massachusetts Department of Environmental Protection, Divisions of Watershed Management and Environmental Analysis. Worcester, MA. Mattson, M. 2001. Personal Communication. Parker River Watershed: Lakes TMDL information. Massachusetts Department of Environmental Protection, Division of Watershed Management. Worcester, MA.

Parker River Watershed Water Quality Assessment Report 87 91wqar.doc DWM CN 54.0
MVPC. 2000a. Draft Final Report: Parker River Watershed Assessment and Management of Nonpoint Source Pollution in the Little River Subwatershed. Merrimack Valley Planning Commission. Haverhill, MA. MVPC. 2000b. Summary Report Pentucket Pond Stormwater Assessment Project. Merrimack Valley Planning Commission. Haverhill, MA. O’Keefe, K. 2001. Personal Communication. Parker River Watershed: Permitting information. Massachusetts Department of Environmental Protection, Northeast Regional Office. Wilmington, MA. Persaud, D., Jaagumagi R., and A. Hayton. 1993. Guidelines for the Protection and Management of Aquatic Sediment Quality in Ontario. Water Resources Branch, Ontario Ministry of the Environment, Queen’s Printer for Ontario, Canada. PRCWA. 1997. Parker River Currents. 2:2. Parker River Clean Water Association. Byfield, MA. PRCWA. 1999. Parker River Watch Annual Report: 1999 Sampling Season. Parker River Clean Water Association, Byfield, MA. PRCWA. 2000. Parker River Currents. 5:2. Parker River Clean Water Association. Byfield, MA. PRCWA. 4 September 2000. Parker River Clean Water Association – Plum Island Sound. [Online]. Parker River Clean Water Association. http://www.parker-river.org/. 23 July 2001. PRCWA. 19 November 2000. Parker River Clean Water Association Mission Statement. [Online]. Parker River Clean Water Association. http://www.parker-river.org/. 10 July 2001.
Rojko, A.M., Kimball, W.A. and A.J. Screpetis. 1995. Designated Outstanding Resource Waters of Massachusetts 1995. Massachusetts Executive Office of Environmental Affairs, Department of Environmental Protection, Bureau of Resource Protection, Office of Watershed Management. Grafton, MA. Scarlet, V. 2001. Personal Communication. Parker River Watershed: Storm Water Permitting information. Massachusetts Department of Environmental Protection, Division of Watershed Management. Worcester, MA. Socolow, R.S., Zanca J.L., Murino D. Jr., and L.R. Ramsbey. 2000. Water Resources Data for Massachusetts and Rhode Island, Water Year 1999. U.S. Geological Survey Report MA-RI-99-1. Water Resources Division. Marlborough, MA. Tomczyk, R. 2001a. Parker River Watershed Year 3 Assessment Report: June 2001. Massachusetts Department of Environmental Protection, Northeast Regional Office. Wilmington, MA. Tomczyk, R. 2001b. Personal Communication. Parker River Watershed Information. Massachusetts Department of Environmental Protection, Northeast Regional Office. Wilmington, MA.
UMass Amherst. 1999. Land Use Datalayer - statewide 1:25000. Published by MassGIS (MA Office of Geographic and Environmental Information), Executive Office of Environmental Affairs for the Resource Mapping Project at the University of Massachusetts Amherst, MA. USGS. 1998. Unpublished Data. Provisional data for low-flow frequency statistics for Massachusetts gaging stations. (3.5” floppy disk). U.S. Geological Survey, Water Resources Division. Marlborough, MA. USGS. 5 June 2001. [Online]. Massachusetts and Rhode Island August 1999 Drought Statement. United States Geological Survey. http://ma.water.usgs.gov/current_cond/august_1999_statement.htm. 5 September 2001. USGS. August 2000. Surface-Water Monitoring Activities [Online]. United States Geological Survey. http://nh.water.usgs.gov/CurrentProjects/nawqa/pdf/sw_web.pdf. 13 June 2001. USGS. 2001. Statewide Water-Quality Network for Massachusetts. U.S. Geological Survey. Northborough. MA.

Parker River Watershed Water Quality Assessment Report Appendix A A1 91wqar.doc DWM CN 54.0
APPENDIX A - 1999 MA DEP DWM PARKER RIVER WATERSHED QA/QC REPORT INTRODUCTION The following data were collected in 1999 as part of the MA DEP DWM Parker River Watershed assessment:
- In –situ Hydrolab® readings on two lakes (Baldpate Pond in Boxford and Rock Pond in Georgetown)
- Fish tissue toxics data on two lakes (Baldpate Pond and Rock Pond) - Benthic macroinvertebrates and aquatic habitat assessment at a total of eight biomonitoring
stations in both the mainstem Parker River and selected tributaries. In-situ water quality measurements were reviewed independently by the DWM Hydrolab® Coordinator and Database Manager. Fish tissue monitoring data was reviewed independently by the Wall Experiment Station’s (WES) Quality Assurance Program, the Division of Watershed Management’s (DWM) Quality Control Officer, DWM Assessment Coordinator, and the DWM Database Manager. A programmatic QA/QC review was performed for benthic macroinvertebrate data, consistent with the 1999 benthic macroinvertebrate QAPP (now CN 7.0). In general, data that fell outside established QA/QC acceptance criteria were investigated and may have been subject to censoring. Quality assurance and quality control (QA/QC) activities conducted before, during and after the survey included:
- production of a Quality Assurance Project Plan (QAPP) for fish contaminant monitoring (now CN 13.0)
- production of a QAPP for benthic macroinvertebrate collection (now CN 7.0) - Implementation of field and lab quality control procedures, including that for Hydrolab®
multiprobe use (now CN 4.0) and fish collection/preparation for fish tissue analysis (now CN 40.0) - post-monitoring data review and validation.
This QA/QC Report is divided into five sections: Introduction, Field and Laboratory QA/QC Objectives, Criteria and Procedures; Data Validation, Analytical Methods and Method Detection Limits (MDL), and Conclusions. A.1 FIELD AND LABORATORY QA/QC OBJECTIVES, CRITERIA AND PROCEDURES Data collected by DWM in 1999 in the Parker River Watershed were reviewed for conformance to field and laboratory data quality objectives. Section A.1.1 outlines the Hydrolab® QA/QC procedures. Section A.1.2 provides fish tissue laboratory quality control data. Section A.1.3 briefly discusses quality control for the benthic macroinvertebrate monitoring. A.1.1 In-situ Water Quality Data
Trained DWM staff members conducted in-situ measurements using a Hydrolab® Series 3 Multiprobe instrument that simultaneously measures dissolved oxygen, temperature, pH, conductivity, and depth, and provides calculated estimates for total dissolved solids and % saturation of oxygen. To ensure the quality of the in-situ data, the following QA/QC steps were taken. - Pre-Survey Calibration and Check: Standard pre-survey calibration of the Hydrolab® unit was conducted in accordance with the DWM Standard Operating Procedure (SOP) for Hydrolab® use. After the instrument was calibrated and before the instrument was released to field staff, an instrument check using both a low ionic standard and filtered de-ionized water was performed. The purpose of this check is to make sure that the instrument is providing stable readings as the waters in Massachusetts are typically

Parker River Watershed Water Quality Assessment Report Appendix A A2 91wqar.doc DWM CN 54.0
of low ionic strength. If the instrument failed acceptance criteria, it was not released to field staff until the source of error was identified and corrected. - Post-Survey Check: A standard post survey check of the Hydrolab® unit was performed in accordance with the DWM SOP for Hydrolab® use. Upon return of the Hydrolab® unit to DWM’s lab after a survey run, a visual inspection was performed to identify any physical damage that may have occurred in the field. The calibration of the unit was then checked against both a low ionic standard and filtered de-ionized water. The results of the post survey calibration check were compared to the pre-calibration results. If visual damage was observed and/or post calibration acceptance criteria were not achieved, the source of error was investigated and data collected in the field may have been subject to qualification or censoring. - Data Reduction: The Hydrolab® Coordinator and Database Manager reviewed the Hydrolab® data for instability, instrument malfunction, operator technique and aberrant trends. If any of these conditions were detected, the data were investigated and may have been recommended for censoring. The Database Manager electronically tagged all data recommended for censoring in the database. A.1.2 Fish Tissue Data Fish were collected and processed according to the DWM 1999 SOP for fish contaminant monitoring (now CN 40.0). This SOP adheres to EPA-approved laboratory QA/QC methodologies (EPA 823-R-95-007). Laboratory data quality was assessed at WES by analyzing the following quality control samples:
1) Laboratory Reagent Blank/Method Blank (LRB) – Clean clam tissue matrix extracted with every sample set to ensure that the system is free of target analytes (< MDL) and to assess the potential for blank contamination.
2) Laboratory Fortified Blank (LFB) – Clean clam tissue matrix spiked with a low concentration of target compounds. LFB results are used to establish accuracy of system’s performance. The acceptable laboratory % recovery range is typically 80 – 120%.
3) Laboratory Fortified Matrix (LFM) – Tissue matrix spiked with a low concentration of a target compound. LFM and LFM duplicate results are used to establish accuracy of the extraction and analytical process. The acceptable laboratory % recovery range is typically between 70 – 130% for metal analysis and 60 –140% for PCB/Organochlorine Pesticide analysis.
4) Quality Control Standard (QCS) – A pre-spiked secondary tissue sample. QCS results are used to establish accuracy in the extraction and test methods. The acceptable laboratory % recovery range is typically between 80–120%. 5) Laboratory sample duplicates --- A second lab sample is taken the blended fish tissue slurry for analysis of all analytes. Used to estimate analytical precision, the acceptable laboratory relative percent difference (RPD) for lab duplicates is typically 80-120%.
The WES Laboratory is solely responsible for the administration of its Quality Assurance Program and Standard Operating Procedures. WES laboratory releases tissue data when their established QA/QC criteria are met. Refer to WES’s Quality Assurance Plan (MA DEP 1995) for specific laboratory analytical QA/QC criteria and acceptance limits. A.1.3 Benthic Macroinvertebrate Data Macroinvertebrate sampling and processing was conducted by DWM biologists, as described in the SOP Water Quality Monitoring In Streams Using Aquatic Macroinvertebrates (now 39.0), which is based on EPA Rapid Bioassessment Protocols (RBP III). The QAPP for 1999 biomonitoring outlined general QC steps that included:
1) thorough rinsing of sampling equipment between stations to prevent inter-station effects,

Parker River Watershed Water Quality Assessment Report Appendix A A3 91wqar.doc DWM CN 54.0
2) duplication and checking (for transcription errors) of documentation and database entries, and
3) in-house spot-checking (among two DWM biologists) of taxa identifications for accuracy. A.2 DATA VALIDATION Data validation procedures, as outlined in DWM’s draft Data Validation SOP (draft, 2001; CN 56.0) were applied to Hydrolab® and fish tissue data. The annual Data Validation Report summarizing 1999 DWM monitoring QA/QC results is also available as a separate evaluation of 1999 data as a whole (for the “yellow” basins: Merrimack, Boston Harbor, Cape Cod, Narragansett/Mt. Hope Bay, French/Quinebaug and Parker). Assessment and validation of the benthic macroinvertebrate and habitat data collected for the Parker watershed is not covered here. DWM QA/QC assessment of benthic/habitat data is typically more general in nature (ie. adherence to the SOP and QAPP, discussions with primary staff on QAPP implementation, etc.). A.2.1 In-situ Hydrolab® Data Hydrolab® depth profiles at Rock Pond and Baldpate Pond were evaluated for the following: consistency with the Hydrolab® SOP (specifically, the requirement for five, sequential readings one-minute-apart at appropriate depths, proper field use, etc.),
- accuracy and precision of readings, as assessed through review of pre-survey calibration/check and post-survey check data, as well as field notes for any information on faulty operation and/or unusual field conditions, and
- representativeness of data (review of fieldsheets and notes for any information that might indicate non-representativeness; eg., not taken at the deep hole).
Conclusion(s): Hydrolab® profiles taken in May 1999 at Rock Pond and Baldpate Pond accurately captured representative water quality conditions at the time of sampling. Data for dissolved oxygen, conductivity, pH, temperature, total dissolved solids and percent oxygen saturation were accepted without qualification. No data were censored. A.2.2 Fish Tissue Data Tables A.2-1 through A.2-5 provide specific QA/QC data for laboratory fish tissue analysis. Since there were no field duplicates (additional three fish composite of one species) taken, estimates of overall precision (as RPD) were not possible; precision data provided here is based on lab duplicates. Although DWM now typically collects two same-species, three-fish composites from the same waterbody at a rate of 10% of waterbodies sampled (as a field “duplicate”), this was not performed in 1999 for the Parker watershed. While this information would have been helpful in assessing in-lake/in-river variability in tissue concentrations for same-specie fish, lack of field duplicates does not render the 1999 Parker fish tissue data unusable. Sample holding times prior to analysis and extract holding times prior to GC injection were met for all samples.

Parker River Watershed Water Quality Assessment Report Appendix A A4 91wqar.doc DWM CN 54.0
Table A.2-1. 1999 MA DEP DWM Parker River Watershed laboratory QA/QC blank data for organics in fish tissue. (Data expressed in µg/g wet weight unless otherwise noted.)
ANALYTE DATE ANALYZED LABORATORY SAMPLE NUMBER % Lipid Pesticides PCBs
2 December 1999 BLANK - 1 0.07 ND ND
3 December 1999 BLANK - 2 0.09 ND ND
7 December 1999 BLANK - 3 0.09 ND ND
8 December 1999 BLANK - 4 0.08 ND ND 9 December 1999 BLANK - 5 0.07 ND ND 10 December 1999 BLANK - 6 0.09 ND ND
14 December 1999 BLANK - 7 0.07 ND ND 15 December 1999 BLANK - 8 0.15 ND ND 16 December 1999 BLANK - 9 0.16 ND ND
17 December 1999 BLANK - 10 0.10 ND ND 21 December 1999 BLANK - 11 0.12 ND ND 22 December 1999 BLANK - 12 0.09 ND ND ND - Not detected or the analytical result is at or below the established method detection limit (listed in section A.3).
Table A.2-2. 1999 MA DEP DWM Parker River Watershed laboratory QA/QC duplicate data for organics in fish tissue. The analytes were extracted and analyzed according to the modified AOAC 983.21 procedure for the analysis of PCB Aroclors and Congeners and Organochlorine Pesticides. (Data expressed in µg/g wet weight unless otherwise noted.)
ANALYTE DATE ANALYZED LABORATORY SAMPLE NUMBER Pesticides* PCBs* % Lipid
L990067-7 DDE 0.012 DDT 0.012 BZ# 118 0.0030 0.22
L990067-7 duplicate DDE 0.012 DDT 0.014 BZ# 118 0.0027 0.19 3 December 1999
relative percent difference DDE 0% DDT 15.4% BZ# 118 10.53% 15%
L990178-24 ND ND 0.20 L990178-24 duplicate ND ND 0.23 10 December 1999 relative percent difference NA NA 14% L990212-3 ND ND 0.63 L990212-3 duplicate ND ND 0.63 15 December 1999 relative percent difference NA NA 0%
NA - not applicable ND - not detected *NOTE: Fish tissue organic analytes (listed in Section A.3) not appearing in the above table were included in the analysis and were not detected.

Parker River Watershed Water Quality Assessment Report Appendix A A5 91wqar.doc DWM CN 54.0
Table A.2-3. 1999 MA DEP DWM Parker River Watershed laboratory QA/QC lab fortified matrix and matrix spike duplicate data for organics in fish tissue. The analytes were extracted and analyzed according to the modified AOAC 983.21 procedure for the analysis of PCB Aroclors and Congeners and Organochlorine Pesticides. (Data expressed in µg/g wet weight unless otherwise noted.)
Conclusion(s): Data for fish tissue contaminants at Rock Pond and Baldpate Pond accurately represented catchable/edible fish in these lakes at the time of sampling. Data for tissue metals, PCBs and organochlorine pesticides were accepted without qualification. There was not sufficient information to require censoring of any of the data. Although a watershed QAPP detailing specific data quality objectives (DQOs) for the Parker watershed fish contaminant monitoring was not produced, the analytical QC data generally showed lack of blank contamination, blank and matrix spike recoveries ranging from 80-128 % for all analyte groups and RPDs less than 30 % for lab duplicates. (For comparison, DWM’s current, 2001 DQO’s for overall precision of metal/PCB/pesticide monitoring are generally 30% RPD). The quality control acceptance limits of WES for analytical accuracy and precision were met for all samples. Although the lab fortified blank recovery for DDT was 128% (above the typical criteria of 80-120%, specified in Section A1.2), this was deemed insufficient grounds for qualification or censoring of the DDT data.
DATE ANALYZED 21 December 1999
21 December 1999
23 December 1999
23 December 1999
LABORATORY SAMPLE NUMBER
Matrix Spike L990227-2
Matrix Spike Duplicate
L990227-2
Matrix Spike L990271-1
Matrix Spike Duplicate
L990271-1 %LIPIDS 0.20 0.19 0.11 0.20
ANALYTE PCB A1260 MDL 0.11
PCB A1260 MDL 0.11
Lindane MDL 0.009 Heptachlor MDL 0.012 Aldrin MDL 0.016 DDT MDL 0.011
Lindane MDL 0.009 Heptachlor MDL 0.012 Aldrin MDL 0.016 DDT MDL 0.011
SPIKE AMOUNT 1.14 1.14
Lindane 0.025 Heptachlor 0.025 Aldrin 0.025 DDT 0.050
Lindane 0.025 Heptachlor 0.025 Aldrin 0.025 DDT 0.050
SPIKE RECOVERED 1.08 1.07
Lindane 0.026 Heptachlor 0.024 Aldrin 0.026 DDT 0.052
Lindane 0.026 Heptachlor 0.027 Aldrin 0.028 DDT 0.060
SPIKE % RECOVERY 95 94
Lindane 104 Heptachlor 96 Aldrin 104 DDT 104
Lindane 104 Heptachlor 108 Aldrin 112 DDT 120
MDL – method detection limit NOTE: Parker River Watershed samples were batched with others. These laboratory fortified matrix results are pertinent to Parker River Watershed samples.

Table A.2-4. 1999 MA DEP DWM Parker River Watershed laboratory QA/QC data for metals in fish tissue. (Data expressed in μg/g wet weight unless otherwise noted.)
Precision LFM Accuracy Accuracy* (% Recovery)
Sample ID Analyte Sample Duplicate RPD
Spike Amount
(SA)
Spike Recovered
(SR)
% Spike Recovery
(PSR)
Sample Mean (SM)
LFM (spike + sample) LFB QCS MDL Analytical
Method
L990179-10 Hg 0.52 0.53 1.9 2.0 1.7 85 0.525 2.23 85 97 0.02 EPA 245.6 L990179-24 As <MDL <MDL NA 2.0 NR 91 NA NA 95 94 0.04 EPA 200.9 L990179-24 Se 0.118 0.110 7.0 2.0 2.44 122 0.114 2.55 98 92 0.04 EPA 200.9 L990179-24 Pb <MDL <MDL NA 20 NR 91 NA NA 92 95 0.20 EPA 200.7 L990179-24 Cd <MDL <MDL NA 20 NR 96 NA NA 93 103 0.02 EPA 200.7 L990165-14 Hg 0.96 1.04 8.0 2.0 2.04 102 1.00 3.04 110 101 0.02 EPA 245.6 L990165-20 Se 0.124 0.129 4.0 2.0 1.76 88 0.127 1.89 88 90 0.04 EPA 200.9 L990165-20 As** 0.079 NR NA 2.0 NR NR NA NA 101 106 0.04 EPA 200.9 L990165-20 Pb <MDL <MDL NA 20 NR 91 NA NA 92 95 0.20 EPA 200.7 L990165-20 Cd <MDL <MDL NA 20 NR 93 NA NA 93 102 0.02 EPA 200.7
LFB - Laboratory Fortified Blank NR - Not Reported *see Appendix A, section A.1.2. for further details LFM - Laboratory Fortified Matrix QCS - Quality Control Sample **Method Std. additions used.
MDL - Method Detection Limit RPD - Relative Percent Difference
NA - Not Applicable LFM Calculation: SA x PSR = SR ; SR + SM = LFM
Parker R
iver Watershed W
ater Quality A
ssessment R
eport A
ppendix A
A
6 91w
qar.doc D
WM
CN
54.0

Table A.2-5. 1999 MA DEP DWM Parker River Watershed laboratory QA/QC lab fortified blank data for organics in fish tissue. The analytes were extracted and analyzed according to the modified AOAC 983.21 procedure for the analysis of PCB Aroclors and Congeners and Organochlorine Pesticides. (Data expressed in µg/g wet weight unless otherwise noted.)
DATE ANALYZED 2 December 1999 7 December 1999 8 December 1999 14 December 1999 16 December 1999 LABORATORY SAMPLE NUMBER
Laboratory Fortified Blank #1
Laboratory Fortified Blank #2
Laboratory Fortified Blank #3
Laboratory Fortified Blank #4
Laboratory Fortified Blank #5
%LIPIDS 0.10 0.07 0.10 0.07 0.08
ANALYTE PCB A1260 MDL 0.11 Chlordane MDL 0.11 PCB A1242 MDL 0.26 Toxaphene MDL 0.59
Lindane MDL 0.009 Heptachlor MDL 0.012 Aldrin MDL 0.016 DDT MDL 0.011
Spike Amount 0.96 0.98 1.0 0.96
Lindane 0.010 Heptachlor 0.010 Aldrin 0.010 DDT 0.020
Spike Recovered 0.95 1.0 0.67 0.91
Lindane 0.0098 Heptachlor 0.0115 Aldrin 0.0120 DDT 0.0255
Spike % Recovery 99 102 67 95
Lindane 98 Heptachlor 115 Aldrin 120 DDT 128
MDL – method detection limit NOTE: Parker River Watershed samples were batched with others. These laboratory fortified matrix results are pertinent to Parker River Watershed samples.
Parker R
iver Watershed W
ater Quality A
ssessment R
eport A
ppendix A
A
7 91w
qar.doc D
WM
CN
54.0

Parker River Watershed Water Quality Assessment Report Appendix A A8 91wqar.doc DWM CN 54.0
A.3 Analytical Methods and MDLs The analytical methods used to estimate the levels of metals, PCBs and organochlorine pesticides in tissues of largemouth bass, perch and bullhead (three fish composites of each game fish, with substitutions of similar species as necessary) are provided in Table A.3-1. Table A3-1. Analytical Methods and MDLs for 1999 DWM Sampling
Discrete Water Sample Analytes EPA Method* SM Methods** Other Methods MDLs
Fish Tissue Analytes
ug/g wet wt
PCB Arochlor 1242
AOAC 983.21***
0.26 μg/g wet wt
PCB Arochlor 1254
AOAC 983.21***
0.37 μg/g wet wt
PCB Arochlor 1260
AOAC 983.21***
0.11 μg/g wet wt
Chlordane
AOAC 983.21***
0.11 μg/g wet wt
Toxaphene
AOAC 983.21***
0.59 μg/g wet wt
a-BHC
AOAC 983.21***
0.009 μg/g wet wt
b-BHC
AOAC 983.21***
0.011 μg/g wet wt
Lindane
AOAC 983.21***
0.009 μg/g wet wt
d-BHC
AOAC 983.21***
0.043 μg/g wet wt
Hexachlorocyclopentadiene
AOAC 983.21***
0.33 μg/g wet wt
Trifluralin
AOAC 983.21***
0.18 μg/g wet wt
Hexachlorobenzene
AOAC 983.21***
0.18 μg/g wet wt
Heptachlor
AOAC 983.21***
0.012 μg/g wet wt
Heptachlor Epoxide
AOAC 983.21***
0.015 μg/g wet wt
Methoxychlor
AOAC 983.21***
0.029 μg/g wet wt
DDD
AOAC 983.21***
0.011 μg/g wet wt
DDE
AOAC 983.21***
0.010 μg/g wet wt
DDT
AOAC 983.21***
0.011 μg/g wet wt
Aldrin
AOAC 983.21***
0.016 μg/g wet wt
BZ#81
AOAC 983.21***
0.0005 μg/g wet wt
BZ#77
AOAC 983.21***
0.0005 μg/g wet wt
BZ#123
AOAC 983.21***
0.0011 μg/g wet wt
BZ#118
AOAC 983.21***
0.0025 μg/g wet wt
BZ#114
AOAC 983.21***
0.0008 μg/g wet wt
BZ#105
AOAC 983.21***
0.0019 μg/g wet wt
BZ#126
AOAC 983.21***
0.0004 μg/g wet wt

Parker River Watershed Water Quality Assessment Report Appendix A A9 91wqar.doc DWM CN 54.0
Table A3-1 (Continued) Discrete Water Sample Analytes EPA Method* SM Methods** Other Methods MDLs
BZ#156
AOAC 983.21***
0.0007 μg/g wet wt
BZ#157
AOAC 983.21***
0.0007 μg/g wet wt
BZ#180
AOAC 983.21***
0.0007 μg/g wet wt
BZ#169
AOAC 983.21***
0.0003 μg/g wet wt
BZ#170
AOAC 983.21***
0.0007 μg/g wet wt
BZ#189
AOAC 983.21***
0.0007 μg/g wet wt
Arsenic
EPA 200.9
AOAC 983.21***
0.04 μg/g wet wt
Lead
EPA 200.7
AOAC 983.21***
0.20 μg/g wet wt
Selenium
EPA 200.9
AOAC 983.21***
0.04 μg/g wet wt
Cadmium
EPA 200.7
AOAC 983.21***
0.02 μg/g wet wt
Mercury
EPA 245.6
AOAC 983.21***
0.02 μg/g wet wt
% Lipids
WES SOP
NA
In-Situ Water Quality Analytes
Hydrolab® Multiprobe Series 3
DWM SOP (CN 4.0)
NA
* = “Methods for Chemical Analysis of Water and Wastes”, Environmental Protection Agency, Environmental Monitoring Systems
Laboratory – Cincinnati (EMSL-CI), EPA-600/4-79-020, Revised March 1983 and 1979 where applicable. ** = Standard Methods, Examination of Water and Wastewater, 20th edition *** = PCBs and Organochlorine Pesticides in Biological Tissue, AOAC Official Methods of Analysis, 1990 NA = Not Applicable CONCLUSION The Parker River Watershed fish tissue and Hydrolab® data collected in 1999 were reviewed with regard to DWM data quality objectives (DQOs) and adherence to MA DEP DWM and WES Laboratory SOPs for collection and analysis. Where applicable, the primary DQO elements of precision, accuracy, representativeness, completeness and comparability (PARCC) were evaluated. All samples collected resulted in usable data. There was insufficient evidence on which to base any conclusions to qualify or censor the data.

Parker River Watershed Water Quality Assessment Report Appendix A A10 91wqar.doc DWM CN 54.0
REFERENCES Clesceri, L.S., A.E. Greenberg, and A.D. Eaton, (editors). 1998. Standard Methods for the Examination of Water and Wastewater 20th Edition. American Public Heath Association, Washington, D.C. MA DEP. 1990. Biomonitoring Program Standard Operating Procedures 1990. Department of Environmental Protection, Massachusetts Division of Water Pollution Control, Technical Services Branch. Westboro, MA. MA DEP. 1995 January Draft. Laboratory Quality Assurance Plan and Standard Operating Procedures. Massachusetts Department of Environmental Protection, Division of Environmental Analysis, Senator William X. Wall Experiment Station. Lawrence, MA. MA DEP. 1999a. Open File. 1999 Hydrolab® QAQC. Massachusetts Department of Environmental Protection, Division of Watershed Management. Worcester, MA. MA DEP. 1999b. CN 7.0 QAPP for 1999 Benthic Macroinvertebrate Monitoring 11/99. Massachusetts Department of Environmental Protection, Division of Watershed Management. Worcester, MA. MA DEP. 1999c. CN 13.0 Fish Contaminant Monitoring Program, Quality Assurance Project Plan, 1999. Massachusetts Department of Environmental Protection, Division of Watershed Management. Worcester, MA. MA DEP. 1999d. CN 4.0 Hydrolab® Series 3 Multiprobe, Standard Operating Procedure. September 23, 1999. Massachusetts Department of Environmental Protection, Division of Watershed Management. Worcester, MA. MA DEP. 1999e. CN 40.0 Collection and Lab Preparation for Fish Toxics Monitoring, 1999. Massachusetts Department of Environmental Protection, Division of Watershed Management. Worcester, MA.

Parker River Watershed Water Quality Assessment Report Appendix B B1 91wqar.doc DWM CN 54.0
APPENDIX B - 1999 MA DEP DWM PARKER RIVER WATERSHED FISH TOXICS MONITORING SURVEY RESULTS
INTRODUCTION Fish toxics monitoring is aimed primarily at assessing human health risks associated with the consumption of freshwater fishes. The program is a cooperative effort between three MA DEP Offices/Divisions, (Watershed Management, Research and Standards [ORS], and Environmental Analysis), the Department of Fisheries and Wildlife Environmental Law Enforcement, and the Department of Public Health (MDPH). Fish tissue monitoring is typically conducted to assess the concentrations of toxic contaminants in freshwater fish, identify waterbodies where those concentrations may pose a risk to human health, and identify waters where toxic contaminants may impact fish and other aquatic life. Fish tissue analysis has been restricted to edible fillets. The fish toxics monitoring was designed to screen the edible fillets of several species of fish representing different feeding guilds (i.e., bottom dwelling omnivores, top-level predators, etc.) for the presence of heavy metals (Pb, Cd, Se, Hg, As), PCB and organochlorine pesticides. These data are then used by the Massachusetts Department of Public Health in assessing human health risks associated with the consumption of freshwater fishes (MA DEP 1999a). As part of the ongoing fish toxics monitoring program and in support of an intensive mercury sampling program in northeastern Massachusetts designed by the MA DEP Office of Research and Standards (ORS), fish were sampled at two sites (Figure B1) in the Parker River Watershed. Baldpate Pond is a 55 acre pond located in Boxford and Rock Pond is a 49.6 acre pond located in Georgetown. MATERIALS AND METHODS Fish were collected by DWM staff via gill nets, trot lines, and boat mounted electrofishing gear at Baldpate Pond, Boxford on 13 May 1999 (MA DEP 1999a). Rock Pond in Georgetown was sampled by DWM staff using gill nets and boat mounted electrofishing gear on 19 May 1999. Fish were held in an onboard livewell until an appropriate sample number was reached, at which time the samples were placed in an ice filled cooler and brought back to the DWM laboratory for processing. Protocols designed to assure accuracy and prevent cross-contamination of samples were followed for collecting, processing and shipping fish. Lengths and weights were measured and fish were visually inspected for tumors, lesions, or other anomalies. Scale or pectoral fin spine samples were obtained from each fish to determine age. Fish were filleted (skin off) on glass cutting boards and prepared for freezing. All equipment used in the filleting process was rinsed in tap water to remove slime, scales, and other fluids such as blood, then re-rinsed in deionized water twice before (and/or after) each sample. Composite samples (single fillets from three like-sized individuals of the same species) targeted for % lipids, PCBs and organochlorine pesticide analysis were wrapped together in aluminum foil. Composite samples targeted for metals analysis were placed in VWR 32-ounce high density polyethylene (HDPE) cups with covers. Individual samples targeted for Hg analysis only were also placed in VWR 32-ounce high density polyethylene (HDPE) cups with covers. Samples were tagged and frozen for subsequent delivery to the Department’s Wall Experiment Station (WES). Methods used at WES for metals analysis were as follows:
- mercury - cold vapor method, Perkin Elmer, FIMS (Flow Injection Mercury System) with Flow Injection Atomic Absorption Spectroscopy
- cadmium and lead - Perkin Elmer, Optima 3000 XL ICP – Optical Emission Spectrophotometer - arsenic and selenium - Perkin Elmer, Zeeman 5100 PC, Platform Graphite Furnace, Atomic
Absorption Spectrophotometer PCB/organochlorine pesticide analysis was performed on a gas chromatograph equipped with an electron capture detector. Additional information on analytical techniques used at WES is available from the laboratory (MA DEP 1995).

Parker River Watershed Water Quality Assessment Report Appendix B B2 91wqar.doc DWM CN 54.0
Figure B1. 1999 MA DEP DWM Parker River Watershed fish contaminant monitoring stations: Baldpate Pond, Boxford (F0068) and Rock Pond, Georgetown (F0070) RESULTS Survey results (MA DEP 1999c) are presented in Tables B1 and B2.
#
#
F0070
F0068
Rivers and Streams
Fish Contaminant Monitoring Stations#
Ponds and Lakes
MA Towns
Legend
N
3 0 3 6 Miles

Parker River Watershed Water Quality Assessment Report Appendix B B3 91wqar.doc DWM CN 54.0
Baldpate Pond, Boxford (Table B1) (F0068) Samples of largemouth bass, yellow perch, and brown bullhead were collected from Baldpate Pond, Boxford. Fish were processed at the DWM laboratory as individual samples or composite samples comprised of tissue from three like-sized individual fish. Cadmium, PCB and lead were not detected in the edible fillets of any sample analyzed for these analytes from Baldpate Pond. Selenium was detected in all samples analyzed; ranging from 0.064 to 0.201 mg/kg wet weight. Arsenic was detected in all samples analyzed; ranging from 0.079 to 0.161 mg/kg wet weight. Mercury in the fish tissue from Baldpate Pond ranged from 0.37 to 1.6 mg/kg wet weight. With the exception of the brown bullhead sample from Baldpate Pond, which contained a detectable level of dichlorodiphenyl ethylene - DDE (0.019μg/g), pesticide levels in all other samples were below detection. The % lipids content of the fish analyzed ranged between 0.06 and 0.79. According to standard practice, all laboratory analytical results were forwarded to the Massachusetts Department of Public Health (MDPH) for review. The mercury data triggered a site-specific advisory against the consumption of fish from Baldpate Pond, Boxford (MA DPH 1999). Rock Pond, Georgetown (Table B2) (F0070) Samples of largemouth bass, yellow perch, and brown bullhead were collected from Rock Pond, Georgetown. Fish were sorted by type and processed at the DWM laboratory as individual samples or composite samples comprised of tissue from three like-sized individual fish. Cadmium, lead, PCB and pesticides were not detected in the edible fillets of any sample analyzed for these analytes from Rock Pond. Selenium was detected in all samples analyzed; ranging from 0.084 to 0.178 mg/kg wet weight. In one sample analyzed arsenic was detected at 0.042 mg/kg wet weight, all other samples analyzed were below the method detection limit of 0.04 mg/kg. Mercury in the fish tissue from Rock Pond ranged from 0.39 to 1.9 mg/kg wet weight. The % lipids content of the fish analyzed ranged between 0.05 and 0.18. According to standard practice, all laboratory analytical results were forwarded to MDPH for review. The data triggered a site-specific advisory against the consumption of fish from Rock Pond, Georgetown (MA DPH 1999).

Table B1. 1999 MA DEP DWM fish toxics monitoring data for Baldpate Pond (F0068), Boxford. Results (mg/kg wet wt.) are from fish fillets with skin off and are of individual fillets or composite samples as noted.
Sample ID
Collection Date
Species1 Code
Length (cm)
Weight (g)
Individual Sample ID
(lab sample #) Hg
Composite Sample ID
(lab sample #) Cd Hg Pb As Se Lipids
(%) PCB
(μg/g) Pesticides
(μg/g)
BOXBP-01 5/13/99 LMB 32.1 409.6 99113 (L990165-1) 1.3
BOXBP-02 5/13/99 LMB 29.5 308.9 99093 (L990165-2) 1.2 <0.02 <0.20 0.079 0.124
BOXBP-03 5/13/99 LMB 31.5 398.6 99094 (L990165-3) 1.3
99111 (L990165-20)
BOXBP-04 5/13/99 LMB 30.1 306.4 99095 (L990165-4) 1.4
BOXBP-05 5/13/99 LMB 30.7 326.2 99096 (L990165-5) 1.1 0.06 ND ND
BOXBP-06 5/13/99 LMB 30.4 318.0 99097 (L990165-6) 1.4
99112 (L990165-21)
BOXBP-07 5/13/99 LMB 32.7 410.0 99098 (L990165-7) 1.2
BOXBP-08 5/13/99 LMB 37.5 710.1 99099 (L990165-8) 1.6
BOXBP-09 5/13/99 LMB 35.7 649.9 99100 (L990165-9) 1.5
BOXBP-10 5/13/99 YP 27.9 227.2 99101 (L990165-10) 0.41
BOXBP-11 5/13/99 YP 28.3 252.4 99102 (L990165-11) 0.37 <0.02 <0.20 0.090 0.201
BOXBP-12 5/13/99 YP 27.7 213.1 99103 (L990165-12) 0.39
99114 (L990165-22)
BOXBP-13 5/13/99 YP 29.3 262.0 99104 (L990165-13) 0.45
BOXBP-14 5/13/99 YP 26.8 232.8 99105 (L990165-14) 1.0 0.14 ND ND
BOXBP-15 5/13/99 YP 26.4 201.7 99106 (L990165-15) 0.76
99115 (L990165-23)
BOXBP-16 5/13/99 YP 22.0 112.8 99107 (L990165-16) 0.62
BOXBP-17 5/13/99 YP 25.5 186.6 99108 (L990165-17) 0.87
BOXBP-18 5/13/99 YP 20.8 89.0 99109 (L990165-18) 0.58
BOXBP-19 5/13/99 BB 29.7 339.0 <0.02 <0.20 0.161 0.064 0.79 ND 0.0192 BOXBP-20 5/13/99 BB 26.9 283.4 BOXBP-21 5/13/99 BB 26.8 235.8
99117 (L990165-24)
99110 (L990165-19) 0.37
1Species brown bullhead (BB) Ameiurus nebulosus 2 DDE
largemouth bass (LMB) Micropterus salmoides ND – not detected or the analytical result is at or below the method detection limit (MDL). See Appendix A for MDL. yellow perch (YP) Perca flavescens
Parker R
iver Watershed W
ater Quality A
ssessment R
eport
Appendix B
B
4 91w
qar.doc D
WM
CN
54.0

Table B2. 1999 MA DEP DWM fish toxics monitoring data for Rock Pond (F0070), Georgetown. Results (mg/kg wet wt.) are from fish fillets with skin off and are of individual fillets or composite samples as noted.
Sample ID
Collection Date
Species1 Code
Length (cm)
Weight (g)
Individual Sample ID
(lab sample #) Hg
Composite Sample ID
(lab sample #) Cd Hg Pb As Se Lipids
(%) PCB
(μg/g) Pesticides
(μg/g)
GTNRP-01 5/19/99 LMB 32.0 384.4 99180 (L990179-1) 1.2
GTNRP-02 5/19/99 LMB 35.2 603.1 99181 (L990179-2) 1.9 <0.02 <0.20 0.042 0.136
GTNRP-03 5/19/99 LMB 34.1 458.8 99182 (L990179-3) 1.9
99199 (L990179-20)
GTNRP-04 5/19/99 LMB 34.7 604.5 99183 (L990179-4) 1.6
GTNRP-05 5/19/99 LMB 30.3 357.1 99184 (L990179-5) 1.6 0.05 ND ND
GTNRP-06 5/19/99 LMB 34.5 614.1 99185 (L990179-6) 1.7
99179 (L990179-21)
GTNRP-07 5/19/99 LMB 33.4 418.6 99186 (L990179-7) 1.6
GTNRP-08 5/19/99 LMB 30.7 299.1 99187 (L990179-8) 1.5
GTNRP-09 5/19/99 LMB 34.4 530.6 99188 (L990179-9) 1.7
GTNRP-10 5/19/99 YP 21.9 136.5 99189 (L990179-10) 0.52
GTNRP-11 5/19/99 YP 21.5 131.2 99190 (L990179-11) 0.90 <0.02 <0.20 <0.04 0.178
GTNRP-12 5/19/99 YP 21.3 127.2 99191 (L990179-12) 0.70
99178 (L990179-22)
GTNRP-13 5/19/99 YP 23.5 171.6 99192 (L990179-13) 0.85
GTNRP-14 5/19/99 YP 22.0 140.4 99193 (L990179-14) 1.1 0.06 ND ND
GTNRP-15 5/19/99 YP 21.8 118.3 99194 (L990179-15) 0.84
99177 (L990179-23)
GTNRP-16 5/19/99 YP 22.6 138.9 99195 (L990179-16) 0.83
GTNRP-17 5/19/99 YP 21.6 131.0 99196 (L990179-17) 1.1
GTNRP-18 5/19/99 YP 21.3 118.5 99197 (L990179-18) 0.89
GTNRP-19 5/19/99 BB 29.5 356.9 <0.02 <0.20 <0.04 0.084 0.18 ND ND GTNRP-20 5/19/99 BB 29.9 440.0 GTNRP-21 5/19/99 BB 30.3 410.8
99176 (L990179-24)
99198 (L990179-19) 0.39
1Species brown bullhead (BB) Ameiurus nebulosus ND – not detected or the analytical result is at or below the method detection limit (MDL). See Appendix A for MDL. largemouth bass (LMB) Micropterus salmoides yellow perch (YP) Perca flavescens
Parker R
iver Watershed W
ater Quality A
ssessment R
eport
Appendix B
B
5 91w
qar.doc D
WM
CN
54.0

Parker River Watershed Water Quality Assessment Report Appendix B B6 91wqar.doc DWM CN 54.0
IN-SITU WATER QUALITY MEASUREMENT In conjunction with fish toxics monitoring, Hydrolab®data were collected at Baldpate Pond, Boxford on 12 May 1999 and Rock Pond, Georgetown on 19 May 1999. The Hydrolab®in-situ results are provided in Table B3. MA DEP DWM water quality data is managed and maintained in the Water Quality Access Database. Table B3. 1999 MA DEP DWM Parker River Watershed in-situ Hydrolab® data
Time (24hr)
Measurement Depth (m)
Temp (°C)
pH (SU)
Cond (μS/cm)
TDS (mg/L)
DO (mg/L)
SAT (%)
Baldpate Pond, Boxford (PALIS #: 91001) Station: Hole
F0068 5/12/99 12:01 0.4 16.7 7.7 224 143 11.0 110 12:20 3.1 15.6 7.8 227 145 11.6 114 12:08 5.8 12.0 6.9 220 141 8.3 76 12:14 9.3 8.0 6.5 206 132 5.1 42 Rock Pond, Georgetown (PALIS #: 91012) Station: Hole
F0070 5/19/99 11:12 0.4 19.4 7.1 207 132 9.7 103 11:19 3.5 14.5 6.5 204 131 5.9 56 11:25 4.6 12.3 6.4 207 132 3.2 29
REFERENCES MA DEP. 1995 January Draft. Laboratory Quality Assurance Plan and Standard Operating Procedures. Massachusetts Department of Environmental Protection, Division of Environmental Analysis. Wall Experiment Station, Lawrence, MA. MA DEP. 1999a. CN 13.0. Fish Contaminant Monitoring Program, Quality Assurance Project Plan, 1999. Massachusetts Department of Environmental Protection, Division of Watershed Management. Worcester, MA. MA DEP. 1999b. Open File. 1999 Fish Toxics Monitoring Data in the Parker River Basin. Massachusetts Department of Environmental Protection, Division of Watershed Management, Worcester, MA.
MA DPH. 1999. Freshwater Fish Consumption Advisory List. Massachusetts Department of Public Health. Boston, MA.

Parker River Watershed Water Quality Assessment Report Appendix C C1 91wqar.doc DWM CN 54.0
APPENDIX C - 1999 DEP DWM BIOMONITORING TECHNICAL MEMORANDUM Technical Memorandum (TM-91-1) Subject: Parker Watershed 1999 Biological Assessment Prepared by: John Fiorentino, DEP/ Division of Watershed Management, Worcester, MA Date: 7 December 2000
INTRODUCTION Biological monitoring is a useful means of detecting anthropogenic impacts to the aquatic community. Resident biota (e.g., benthic macroinvertebrates, fish, periphyton) in a Waterbody are natural monitors of environmental quality and can reveal the effects of episodic and cumulative pollution and habitat alteration (Barbour et al. 1999, Barbour et al. 1995). Biological surveys and assessments are the primary approaches to biomonitoring. As part of the Massachusetts Department of Environmental Protection/ Division of Watershed Management’s (MA DEP/DWM) 2000 Parker River watershed assessments, aquatic benthic macroinvertebrate biomonitoring was conducted to evaluate the biological health of various portions of the watershed. A total of eight biomonitoring stations were sampled in both the mainstem Parker River and selected tributaries to investigate the effects of various nonpoint source stressors—both historical and current—on the aquatic communities of the watershed. Some stations sampled during the 1999 biomonitoring survey were previously “unassessed” by DEP, while historical DEP biomonitoring stations—most recently assessed in 1994 (Fiorentino 1996a and 1996b)—were reevaluated to determine if water quality and habitat conditions have improved or worsened over time. Sampling locations, along with station identification numbers and sampling dates, are noted in Table 1. Sampling locations are also shown in Figure 1. To provide information necessary for making basin-wide aquatic life use assessments required by Section 305(b) of the Federal Clean Water Act (CWA), all Parker River watershed stations were compared to a regional reference station thought to represent the “best attainable” (i.e., least-impacted) conditions in the watershed. Use of a regional reference station is particularly useful in assessing nonpoint source (NPS) pollution impacts (e.g., physical habitat degradation) at upstream control sites as well as downstream sites suspected as chemically-impacted from known point source stressors (Hughes 1989). Cart Creek, originally recommended as a reference station by the Parker River Clean Watershed Association (PRCWA), was determined by DWM to be inappropriate as the reference condition due to the extremely low base-flow observed during reconnaissance activities (i.e., site visits) in the watershed. As a result, the regional reference station was established in Fish Brook, which is located in the nearby Ipswich River watershed. As a coastal basin, the Ipswich River watershed shares many similar characteristics with the Parker River watershed with respect to hydrology, channel geomorphology, and instream habitat quality. The Fish Brook station was situated upstream from all known point sources of water pollution, and was also assumed to be relatively unimpacted by nonpoint sources. Additional, site-specific bioassessments were conducted at two stations (PR00 and PR02) in the mainstem Parker River, with comparisons made to an upstream control at PR01B. These upstream-downstream comparisons were made to assess potential effects of nearstream groundwater withdrawals on downstream aquatic communities in the Parker River. During "year 1" of its 5-year basin cycle, problem areas within the Parker River watershed were better defined through such processes as coordination with appropriate groups (EOEA Parker River Basin Team, EPA, PRCWA, Essex County Greenbelt Association, USGS), assessing existing data, conducting site visits, and reviewing NPDES and water withdrawal permits. Following these activities, the 1999 biomonitoring plan was more closely focused and the study objectives better defined. Table 2 includes a summary of the perceived problems/issues—both historical and current—addressed during the 1999 Parker River watershed biomonitoring survey.

Parker River Watershed Water Quality Assessment Report Appendix C C2 91wqar.doc DWM CN 54.0
The main objectives of biomonitoring in the Parker River watershed were: (a) to determine the biological health of streams within the watershed by conducting assessments based on aquatic macroinvertebrate communities; and (b) to identify problem stream segments so that efforts can be focussed on developing NPDES permits, Water Management Act permits, stormwater management, and control of other nonpoint source (NPS) pollution. Specific tasks were: 1. Conduct benthic macroinvertebrate sampling at locations throughout the Parker River watershed. 2. Based upon the macroinvertebrate data, identify river segments within the watershed with potential
point/nonpoint source pollution problems; and 3. Using the benthic macroinvertebrate data and supporting water chemistry and field data, assess the
types of water quality and/or water quantity problems that are present, and if possible, make recommendations for remedial actions. Provide macroinvertebrate data to DWM’s Environmental Monitoring and Assessment Program to be used in making aquatic life use assessments required by Section 305(b) of the Federal Clean Water Act (CWA).
Table 1. List of macroinvertebrate biomonitoring stations sampled during the 1999 Parker River watershed survey, including station identification number, drainage area, station description, and sampling date.
Station Drainage
Area (mi2)
Parker River Watershed Station description
Sampling Date
PR00 21.12 Parker River, upstream from Main Street, Byfield, Newbury, MA 3 August 1999
PR01B 2.90 Parker River, downstream from Route 133, Boxford, MA 4 August 1999
PR02 6.15 Parker River, at Bailey Lane, Georgetown, MA 5 August 1999
MR03 12.40 Mill River, upstream from Route 1, Rowley, MA 3 August 1999
OX03 1.81 Ox Pasture Brook, downstream from Fenno Road, Rowley, MA 4 August 1999
PB01 3.92 Penn Brook, upstream from Parsonage and North Street, Georgetown, MA 3 August 1999
JK01 0.58 Jackman Brook, downstream from Jackman Street, Georgetown, MA 5 August 1999
FB00* 12.16 Fish Brook, upstream from Middletown Road, Boxford, MA 28 July 1999 * located in the Ipswich River watershed Table 2. List of perceived problems addressed during the 1999 Parker River watershed biomonitoring survey. Specific biomonitoring stations addressing each problem are also listed, as is the sampling methodology employed at each station. Parker River Watershed
Stations Issues/Problems Sampling method
PR00 unknown NPS, impoundments/dams RBPIII--kick sampling
PR01B* groundwater withdrawals/reduced flows RBPIII--kick sampling
PR02 groundwater withdrawals/reduced flows, unknown NPS Qualitative--multi-habitat jabs
MR03* stormwater, road runoff, agriculture, septic systems RBPIII--kick sampling
OX03* stormwater, road runoff, agriculture RBPIII--kick sampling
PB01 road runoff, town dump (capped), trash, NPS inputs (e.g., yard waste) from adjacent homes Qualitative--multi-habitat jabs
JK01* miscellaneous NPS (habitat degradation, stormwater/road runoff, new home construction) RBPIII--kick sampling
* biomonitoring conducted here by DEP in 1994

Parker River Watershed Water Quality Assessment Report Appendix C C3 91wqar.doc DWM CN 54.0
#
#
#
#
##
#
PR00
MR03
OX03JK01
PR01B
PB01PR02
Benthic Macroinvertebrate Monitoring Stations#
MA Towns
Rivers and Streams
Legend
Ponds and Lakes
N
2 0 2 4 Miles
Figure 1. Location of DWM biomonitoring stations for the 1999 Parker River watershed survey.

Parker River Watershed Water Quality Assessment Report Appendix C C4 91wqar.doc DWM CN 54.0
METHODS Macroinvertebrate Sampling -- RBPIII
The macroinvertebrate sampling and processing procedures are described in the Water Quality Monitoring In Streams Using Aquatic Macroinvertebrates standard operating procedures (Nuzzo 1999), and are based on US EPA Rapid Bioassessment Protocols (RBPs) (Barbour et al. 1999). Sampling was conducted by DWM biologists throughout a 100 m reach, in riffle/run areas with fast currents and cobble/gravel substrates—generally the most productive habitats, supporting the most diverse communities in the stream system. Ten kicks in squares approximately 0.46 m x 0.46 m were composited for a total sample area of about 2 m2. Samples were preserved in the field with denatured 95% ethanol, then brought to the DEP/DWM lab for processing. Habitat Assessments An evaluation of physical and biological habitat quality is critical to any assessment of ecological integrity (Karr et al. 1986; Barbour et al. 1999). Habitat assessment supports understanding of the relationship between physical habitat quality and biological conditions, identifies obvious constraints on the attainable potential of a site, assists in the selection of appropriate sampling stations, and provides basic information for interpreting biosurvey results (US EPA 1995). Before leaving the sample reach during the 1999 biosurveys, habitat qualities were scored using a modification of the evaluation procedure in Barbour et al. (1999). The matrix used to assess habitat quality is based on key physical characteristics of the Waterbody and surrounding land use. Most parameters evaluated are instream physical attributes often related to overall land use and are potential sources of limitation to the aquatic biota (Barbour et al. 1999). The ten habitat parameters are as follows: instream cover, epifaunal substrate, embeddedness, sediment deposition, channel alteration, velocity/depth combinations, channel flow status, right and left (when facing downstream) bank vegetative protection, right and left bank stability, right and left bank riparian vegetative zone width. Habitat parameters are scored, totaled, and compared to a regional reference station and/or a site-specific control (upstream reference) station to provide a final habitat ranking. Macroinvertebrate Sample Processing And Analysis Macroinvertebrate sample processing entailed distributing a sample in pans, selecting grids within the pans at random, and sorting specimens from the other materials in the sample until approximately 100 organisms (±10%) were extracted. Specimens were identified to genus or species as allowed by available keys, specimen condition, and specimen maturity. Taxonomic data were analyzed using a modification of Rapid Bioassessment Protocol III (RBP III) metrics and scores (Barbour et al. 1999). Based on the taxonomy various community, population, and functional parameters, or “metrics”, were calculated which allow an investigator to measure important aspects of the biological integrity of the community. This integrated approach provides more assurance of a valid assessment because a variety of biological parameters are evaluated. Deficiency of any one metric should not invalidate the entire approach (Barbour et al. 1999). Metric values for each station were scored based on comparability to the reference station, and scores were totaled. The percent comparability of total metric scores for each study site to those for a selected “least-impacted” reference station (i.e., “best attainable” situation) yields an impairment score for each site. RBP III analysis separates sites into four categories: non-impacted, slightly impacted, moderately impacted, and severely impacted. Impacts to the benthic community may be indicated by the absence of generally pollution-sensitive macroinvertebrate taxa such as Ephemeroptera, Plecoptera, and Trichoptera (EPT); dominance of a particular taxon, especially the pollution-tolerant Chironomidae and Oligochaeta taxa; low taxa richness; or shifts in community composition relative to the reference station (Barbour et al. 1999). Those biological metrics calculated and used in the analysis of Parker River watershed macroinvertebrate data are listed and defined below. For a more detailed description of metrics used to evaluate benthos data see Barbour et al. (1999): 1. Taxa richness—a measure based on the number of taxa present. The lowest possible taxonomic level is
assumed to be genus or species. 2. EPT Index—a count of the number of genera/species from the orders Ephemeroptera (mayflies),
Plecoptera (stoneflies), and Trichoptera (caddisflies). As a group these are considered three of the more

Parker River Watershed Water Quality Assessment Report Appendix C C5 91wqar.doc DWM CN 54.0
sensitive aquatic insect orders. Therefore, the greater the contribution to total richness from these three orders, the healthier the community.
3. Biotic Index—Based on the Hilsenhoff Biotic Index (HBI), this is an index designed to produce a
numerical value to indicate the level of organic pollution. Organisms have been assigned a value ranging from zero to ten based on their tolerance to organic pollution. A value of zero indicates the taxon is highly intolerant of pollution and is likely to be found only in pollution-free waters. A value of ten indicates the taxon is tolerant of pollution and may be found in highly polluted waters. The number of organisms and the individually assigned values are used in a mathematical formula that describes the degree of organic pollution at the study site. The formula for calculating HBI is:
HBI= ∑ xiti
n
where xi = number of individuals within a taxon ti = tolerance value of a taxon n = total number of organisms in the sample
4. Ratio of EPT and Chironomidae Abundance—The EPT and Chironomidae abundance ratio uses relative
abundance of these indicator groups as a measure of community balance. Skewed populations having a disproportionate number of the generally tolerant Chironomidae (“midges”) relative to the more sensitive insect groups may indicate environmental stress.
5. Percent Contribution Dominant Taxon—is the percent contribution of the numerically dominant taxon
(genus or species) to the total numbers of organisms. A community dominated by few species indicates environmental stress. Conversely, more balance among species indicates a healthier community.
6. Ratio of Scraper and Filtering Collector Functional Feeding Groups—This ratio reflects the community
food base. The proportion of the two feeding groups is important because predominance of a particular feeding type may indicate an unbalanced community responding to an overabundance of a particular food source (Barbour et al. 1999). Scrapers predominate when diatoms are the dominant food resource, and decrease in abundance when filamentous algae and mosses prevail. Filtering collectors thrive where filamentous algae and mosses are prevalent and where fine particulate organic material (FPOM) levels are high.
7. Community Similarity—is a comparison of a study site community to a reference site community.
Similarity is often based on indices that compare community composition. Most community similarity indices stress richness and/or richness and abundance. Generally speaking, communities will become more dissimilar as stress increases. In the case of the Parker River watershed bioassessments, an index of macroinvertebrate community composition was calculated based on similarity to the reference community, expressed as percent composition of the following organism groups: Oligochaeta, Ephemeroptera, Plecoptera, Coleoptera, Trichoptera, Chironomidae, and Other.
Macroinvertebrate Sampling -- Qualitative Macroinvertebrate biomonitoring was conducted at two stations (Table 2) based on modifications to the RBP I protocol, a screening or reconnaissance assessment that documents specific visual observations made in the field by a trained professional. The RBP I procedure was used at these stations due to habitat and flow constraints that made the application of the RBP III methodology impractical. RBP I is used to discriminate obviously impacted and non-impacted areas from potentially affected areas. A biosurvey component focuses on qualitative sampling of benthic macroinvertebrates, supplemented by a preliminary field examination of other aquatic biota (periphyton, macrophytes, and fish). Qualitative benthic samples are collected from all available habitats using a kick net; Benthic macroinvertebrate orders/families are listed on a field data sheet. A cursory evaluation of habitat is conducted in lieu of the RBPIII habitat assessment matrix. On the basis of the observations made on habitat, water quality, physical characteristics, and the qualitative biosurvey, the investigator determines whether impairment is detected.

Parker River Watershed Water Quality Assessment Report Appendix C C6 91wqar.doc DWM CN 54.0
RESULTS AND DISCUSSION
The taxonomic list of macroinvertebrates collected at each sampling station is attached as an appendix (Table A1). Included in the taxa list are total organism counts, and the functional feeding group (FG) and tolerance value (TV) of each taxon. Table A1 also includes a listing of family level taxa observed at those stations where sampling was conducted qualitatively (presence is indicated with an “x”). Summary tables of the RBP III data analyses, including biological metric calculations, metric scores, and impairment designations, are included in the Appendix as well. Table A2 is the summary table for all Parker River watershed stations using Fish Brook (FB00) as the regional reference station. Table A3 is a summary of the RBPIII data analyses when the mainstem Parker River station PR00 is compared to the more upstream station PR01B. Habitat assessment scores for each station are also included in the summary tables, while a more detailed summary of habitat parameters is shown in Table A4. The 1999 biomonitoring data for this watershed generally indicate various degrees of nonpoint source-related problems in many of the mainstem and tributary stations examined. Urban runoff, habitat degradation, and other forms of NPS pollution compromise water quality and biological integrity throughout the watershed. That said, some streams examined in the Parker River watershed remain relatively non-impacted and are indicative of the “best attainable” conditions in the watershed. Parker River Watershed The Parker River watershed lies between the drainage basins of the Ipswich and Merrimack rivers in Northeastern Massachusetts. All or part of nine communities lie within the 60 square mile area drained by the Parker River. The watershed is generally rural-residential in nature, with only minor industrial development. The Parker River is formed by the confluence of two unnamed streams in a wetland area of West Boxford. From this confluence, the river, which is little more than two feet wide, meanders through wetlands in a northeasterly direction which caries it into Rock Pond in Georgetown. Three small tributaries join the Parker River during its journey to Rock Pond. Stream velocity increases as the Parker nears the Rock Pond inlet; however, the river is still very narrow and shallow. The outlet of Rock Pond is located at its northern tip and is only one-tenth of a mile from the inlet. The Parker then flows one-third of a mile in a northeasterly direction to the entrance of Pentucket Pond in Georgetown. The general direction of flow in the pond is to the southeast. At the outlet of Pentucket Pond is a four-foot high dam which is the first of six dams on the Parker River. Below the dam, the river follows a southeasterly course to the confluence with Penn Brook. The river then turns abruptly northward and follows a meandering course through wetlands in Georgetown. The stream channel widens, and on two occasions the river splits into two distinct channels. The Parker continues to meander in a northerly direction and is joined by two unnamed tributaries before entering Crane Pond, which is located in the midst of extensive wetlands in Groveland. Downstream of the outlet of Crane Pond, the Parker turns to the east and meanders to the confluence with Beaver Brook, which flows out of Ash Swamp. The river continues eastward into Byfield, where a series of low dams create several small impoundments. Downstream of the last of these impoundments is a USGS stream gage. At the Byfield Gage, the Parker River has drained an area of 21.6 square miles and has an average discharge of 31.5 cubic feet per second (cfs). From the gage, the river flows in a southeasterly direction under Interstate 95 and enters another small impoundment. The direction of the stream flow remains southeasterly until the Parker reached the confluence with Wheeler Brook in Georgetown. The river then turns and meanders in a northeasterly direction to the dam at Central Street in Newbury which marks the rise of the tide. Beyond this point, the river channel progressively widens as the Parker flows through extensive saltwater marshes to its mouth in Plum Island Sound. There are numerous tributaries to the tidal portion of the Parker River, with the most significant being the Mill River and the Little River. At its mouth, the Parker has drained a total of 60 square miles and has an estimated discharge of 97.2 cfs. From its source in West Boxford to its mouth in Plum Island Sound, the Parker River falls a total of 95 feet. Thirty-six feet of that fall are taken up by the six dams on the river.

Parker River Watershed Water Quality Assessment Report Appendix C C7 91wqar.doc DWM CN 54.0
Fish Brook FB00—Fish Brook, mile point 3.5, upstream from Middletown Road, Boxford, MA Habitat The FB00 sampling reach began approximately 200 m upstream from Middletown Road, in a forested and relatively undeveloped portion of Boxford in the Ipswich River watershed. The reach consisted of a series of shallow, short riffles interspersed with deeper run areas. Rocky substrates were prevalent, including an abundance of cobble and pebble, as well as gravel and a fair amount of sand—the latter resulting in occasional small areas of deposition. Instream mosses and emergent macrophytes—most notably burreed (Sparganium sp.)—provided additional microhabitat for macroinvertebrates; however, epifaunal habitat was considered suboptimal. Fish habitat was suboptimal as well, with submerged logs and overhanging shrubs providing the majority of the cover. Both stream banks were well-vegetated and stabilized with an abundance of shrubby and herbaceous vegetation. A diverse assemblage of shrubs and herbaceous growth, consisting of riverbank grape (Vitis riparia), rose (Rosa multiflora), honeysuckle (Lornicera sp.), skunk cabbage (Symplocarpus foetidus), Joe-Pye weed, (Eupatorium sp.) and ferns, dominated the riparian zone along both banks. Farther from the stream channel riparian vegetation was dominated by a mix of evergreens and hardwoods that included white pine (Pinus strobus), red maple (Acer rubrum), ash (Fraxinus americana), and oak (Quercus sp.). Riparian vegetation extended undisturbed from the left (west) bank, while the wide wooded buffer along the right (east) bank eventually gave way to a large uncultivated pasture. FB00 received a composite habitat score of 158/200—the highest received by a biomonitoring station during the 1999 Parker River watershed survey (Table A4). This was the designated regional reference station by virtue of its habitat evaluation, presumed good water quality, and minimal upstream/nearstream land use impacts (i.e., absence of point source inputs, lack of channelization, minimal development or agricultural activity nearby, undisturbed and well-vegetated riparian zone, minimal NPS inputs). Benthos This portion of Fish Brook was characterized by a macroinvertebrate assemblage indicating a healthy aquatic community. A richness of 29, including 8 intolerant EPT taxa, was recorded—the most of any biomonitoring station in the survey—and most of the metric values were indicative of clean water and “least-impacted” conditions (Table A2). In particular, those attributes that measure components of community structure (i.e., taxa richness, biotic index, EPT index)—which display the lowest inherent variability among the RBP metrics used (Resh 1988)—scored well, further corroborating the designation as a reference station. A relatively low biotic index (4.81) and high scraper/filterer metric value (1.50) relative to other biomonitoring stations in the survey indicated the dominance of the Fish Brook benthos assemblage by pollution-sensitive taxa, and good overall trophic balance. FB00 received a total metric score of 38 (Table A2). Jackman Brook JB01—Jackman Brook, mile point 0.60, downstream from Jackman Street, Georgetown, MA Habitat The JB01 sampling reach began approximately 20 m downstream from Jackman Street and terminated at the road crossing. Due to the extremely limited benthos habitat here, the reach was considerably shorter than the 100 m called for in the biomonitoring SOP. Most of the kick sampling was confined to the few very shallow riffle areas near the Jackman Street crossing. While those riffle areas present contained cobble and gravel substrates, the majority of the reach consisted of sand and silt not conducive to macroinvertebrate colonization. Snags, fallen trees, and undercut banks—generally considered good fish habitat if submerged—were left exposed and unavailable as fish cover due to channel flow status at the time of sampling (only 50% of channel contained water). As a result of the habitat constraints caused by

Parker River Watershed Water Quality Assessment Report Appendix C C8 91wqar.doc DWM CN 54.0
seasonal low base-flow, both epifaunal and fish habitat were considered marginal. In addition, instream deposits of organic and inorganic materials resulted in shifting, unstable bars and substrate embeddedness that further compromised fish and macroinvertebrate habitat. The Jackman Street crossing was the most likely source of sediment inputs to the JK01 sampling reach; however, recent housing construction and/or agricultural activities upstream were potential sources of NPS pollution as well. Land-use in the immediate area of the sampling reach consisted of undeveloped hardwood forest. Both stream banks were well-vegetated and stabilized with mosses and root masses. Riparian vegetation extended undisturbed from each bank, with a thin herbaceous/shrub layer of ferns, mosses, grasses, skunk cabbage (Symplocarpus foetidus), and elderberry (Sambucus canadensis) giving way to red maple (Acer rubrum) and oak (Quercus sp.). JK01 received a total habitat assessment score of 126/200 (Table A4). Benthos JK01 received a total metric score of 38, representing 100% comparability to reference conditions at FB00 (Table A2). The resulting “non-impacted” bioassessment is somewhat surprising, given the low habitat evaluation here relative to other biomonitoring stations in the 1999 survey. The JK01 benthos assemblage was dominated by pollution-sensitive macroinvertebrates, including an abundance of the highly intolerant (tolerance value= 0) stonefly, Leuctra sp. (Table A1), and resulting in the lowest biotic index of all the Parker River watershed biomonitoring stations (Table A2). Richness was second only to the reference station in terms of number of taxa present, and an EPT index of 11 was actually higher than at FB00 or anywhere else sampled during the 1999 survey. The high scoring (score= 6) community similarity metric further supports that community composition at JK01 was indicative of the “best attainable” conditions in the watershed. It appears, then, that habitat constraints resulting from reduced base-flow and sediment deposition do not cause any appreciable impact to resident biota at JK01, as was perceived following the 1994 biosurvey which found a “slightly impacted” community here (Fiorentino 1996a). It is unclear whether improved metric performance at JK01 in 1999 is a result of improved water quality conditions or simply due to new sampling methodologies that may be more efficient (i.e., more rigorous) than those employed during the 1994 survey. Regardless, potential NPS inputs from Jackman Street and other upstream sources threaten biological integrity here and should be minimized as much as possible. Effects from sediment deposition, in particular, may be exacerbated by low base-flow and the shallow nature of this small tributary. Mill River MR03—Mill River, mile point 6.40, upstream from Route 1 (downstream from Hillside Street/Mill Street), near Jewel Mill, Rowley, MA Habitat The MR03 sampling reach began approximately 100 m downstream from Mill Street/Hillside Street and ended at the road crossing. This portion of Mill River is extremely straight—the result of historical channelization probably related to the activities of the now-defunct Jewel Mill. Despite the lack of meander, the abundance of large rocky substrates (boulder and cobble) subjected to well-developed riffle and runs provided macroinvertebrates with excellent epifaunal habitat. Fish habitat was only marginal, however, due to shallow water (channel only about 50% full) and limited cover. Aquatic vegetation, mostly in the form of mosses, covered about 10% of the reach. Filamentous forms of green algae were observed on cobble substrates, but were fairly minimal. The lack of a well-established algal community here was quite different than conditions observed during the 1994 biosurvey, when the presence of large balls of the blue-green alga, Nostoc sp., suggested elevated nutrient levels in this portion of Mill River—a problem documented by the Massachusetts Department of Environmental Management (MA DEM) and the Massachusetts Audubon Society (Cooper 1993). The suppressed algal community observed at MR03 during the 1999 biosurvey may in fact reflect the effects of reductions in nutrient loadings to Mill River—possibly the result of the efforts of the Massachusetts Audubon Society, who has been working with landowners in this subwatershed to control NPS pollution through a 319 Nonpoint Source Grant Program

Parker River Watershed Water Quality Assessment Report Appendix C C9 91wqar.doc DWM CN 54.0
study entitled The Mill River Watershed Nonpoint Source Reduction Implementation Project (Cooper 1995). The Hillside/Mill Street crossing was a potential source of localized NPS inputs to the MR03 sampling reach; however, there were no obvious signs (e.g., sediment deposition, substrate embeddedness) of road runoff during the time of sampling. Both stream banks were well-vegetated and stabilized by an established layer of shrubby and herbaceous growth. The dense layer of riverbank grape (Vitis riparia), rose (Rosa sp.), jewelweed (Impatiens capensis), and purple loosestrife (Lythrum salicaria) along the right (east) bank gave way to a wide riparian zone dominated by a mix of hardwoods—most notably ash (Fraxinus americana), elm (Ulmus rubra), red maple (Acer rubrum), and willow (Salix sp.). Similar types of herbaceous and shrubby growth provided only a minimal riparian buffer along the left (west) bank, however, due to the close proximity of a road along the entire length of the sampling reach. MR03 received a total habitat assessment score of 146/200 (Table A4). Benthos The benthos assemblage at MR03 received a total metric score of 28, representing 74% comparability to the reference community at FB00 and resulting in a “slightly impacted” assessment of biological condition (Table A2). The low scoring community similarity metric (score= 0) inferred that community composition was highly dissimilar to the reference community at FB00. In addition, taxa richness and EPT index were lower than at FB00 (Table A2). Interestingly, both total taxa richness and EPT richness were higher at MR03 in 1994—when they were 26 and 8 respectively—than during the 1999 bioassessment (Fiorentino 1996a); however, this discrepancy may simply be the result of temporal variability or differing sampling procedures. The numerous filter-feeding caddisflies (Cheumatopsyche sp., Hydropsyche betteni gr., and Chimarra sp.) found at MR03 suggest that an abundance of fine particulate organic material (FPOM) provides an important food resource in this portion of the river. Much of this FPOM probably originates from the impoundments (Upper and Lower Mill ponds) immediately upstream from MR03. Typically, in lentic systems such as ponds and impoundments, the primary source of organic matter is autochthonous (produced within the system), with secondary inputs of allochthonous (transported into the system from someplace else) materials from shoreline vegetation and fluvial inputs (Wetzel 1975, Merritt et al. 1984). Phytoplankton production—and to a lesser extent, littoral vascular plant production—and associated dissolved organic matter (DOM), are the primary source of autochthonous matter (Wetzel 1975). It is the physical-chemical flocculation (nonbiological) of this DOM and/or other biological processes that leads to the formation of FPOM, the primary nutrition resource utilized by filter-feeders (Wetzel 1975). While FPOM production in lotic systems is primarily a result of the processing of course particulate organic material (CPOM) contributed by aquatic shredders, the high concentration of FPOM in stream systems immediately below pond and reservoir outlets has mainly lentic origins. If these lentic systems are subjected to increasingly eutrophic conditions the resulting effects of enrichment (i.e., increased algal, plant, and DOM production) can be seen not only in the lentic fauna, but also in the lotic aquatic communities immediately downstream. Nutrient/organic loadings originating from various nonpoint sources in the Mill River sub-basin, such as inadequate septic systems or agricultural runoff, probably contribute to the productive conditions that supply the abundant FPOM food resource to the MR03 aquatic community. Indeed, elevated nutrient levels were documented by DEP at multiple locations in Mill River during the 1994 Parker River watershed assessment (MA DEP, unpublished data, 1994). In addition, the proliferation of noxious aquatic vegetation—specifically the water chestnut, Trapa natans—was documented by DEP in both the Upper and Lower Mill ponds during the 1994 survey, corroborating the productive nature of this portion of Mill River (MA DEP 1999). Trophic structure at MR03 did not grossly favor a FPOM-based benthos assemblage, however, as indicated by the high scoring (score= 6) scraper/filterer metric (Table A2). Indeed a periphyton-based community, comprised of algal grazers such as the elmid and psephenid beetles, was well represented (Table A1). Nevertheless, every effort should be made to minimize nutrient loads and other NPS inputs to Mill River, as further loads may contribute to additional reductions in taxa richness as well as a lack of trophic balance among the MR03 community.

Parker River Watershed Water Quality Assessment Report Appendix C C10 91wqar.doc DWM CN 54.0
Ox Pasture Brook OX03—Ox Pasture Brook, mile point 0.70, downstream from Fenno Road, Rowley, MA Habitat The OX03 sampling reach began approximately 1.0 km downstream from Fenno Road and was located within the densely forested Mill Creek Wildlife Management Area. Although DWM conducted macroinvertebrate biomonitoring at Fenno Road (OX02) during the 1994 biosurvey, habitat constraints—most notably in the form of shallow, stagnant water and unproductive mucky substrates—precluded the ability to apply current DWM sampling protocols and produce useful benthos data here during the 1999 survey. Because the 1999 biosurvey of Ox Pasture Brook was conducted considerably farther downstream from OX02 and in a portion of the stream with far superior habitat, it is impossible to determine if water quality and habitat quality have improved at OX02 since the 1994 survey. However, findings of the 1999 benthic macroinvertebrate survey at OX03 should still provide DWM with the necessary information needed to make aquatic life use assessment decisions for this stream. The OX03 sampling reach contained an abundance of cobble, boulder, and woody material subjected to swift current velocity; however, extremely low base-flow (channel only 50% full) resulted in much exposed substrate and unusable fish cover. As a result, epifaunal benthos habitat and fish habitat were considered marginal and poor respectively. Bank and riparian habitat parameters scored well. Banks were well-vegetated and stabilized with boulders and root masses. Riparian vegetation was dominated by red maple (Acer rubrum), red oak (Quercus rubra), ash, (Fraxinus americana) and some conifers (white pine, Pinus strobus) and extended undisturbed from the moss-covered banks. There was no evidence of instream sediment deposition or other NPS-related habitat degradation, as was the case farther upstream at OX02 during the 1994 biosurvey. OX03 received a total habitat assessment score of 148/200 (Table A4). Benthos The benthic community at OX03 received a total metric score of 30, representing 79% comparability to FB00 and placing it just outside the “non-impacted” biological condition category (Table A2). Despite point reductions in the richness (taxa richness; EPT index) metric scores, a biotic index of 3.94 was actually lower than that for the reference community at FB00 (Table A2). Contributing most to the low biotic index was the pollution-sensitive mayfly, Stenonema sp, as well as the elmid beetles—a relatively intolerant insect family whose plastron respiration requires well-oxygenated instream conditions (Peckarsky et al. 1990). In addition, the abundance of these algal scrapers indicates the importance of periphyton as a food resource at OX03 and is corroborated by the high scoring (score= 6) scraper/filterer metric (Table A2). Based on the balance in trophic structure and presence of numerous pollution-sensitive taxa among the OX03 macroinvertebrate community, it appears that habitat constraints rather than water quality are probably most limiting to biological potential in this portion of Ox Pasture Brook. In particular, naturally occurring base-flow reductions and the resulting effects (e.g., exposed substrates) on epifaunal sustrate availability may most shape community composition at OX03; yet, impacts to the resident biota currently appear minimal at most, as reflected in the “non/slightly impacted” bioassessment. Road and stormwater runoff originating in downtown Rowley—believed to compromise both habitat and water quality at the OX02 biomonitoring station during the 1994 survey (Fiorentino 1996a)—does not appear to impact biological integrity in the OX03 sampling reach. It is possible that BMP implementation (e.g., Stormtreat™ installation near Rowley center) resulting from findings of the 1994 bioassessment of Ox Pasture Brook has helped to minimize the effects of NPS pollution here. Penn Brook PB01—Penn Brook, mile point 0.10, upstream from Parsonage and North streets, Georgetown, MA Habitat

Parker River Watershed Water Quality Assessment Report Appendix C C11 91wqar.doc DWM CN 54.0
Sampling at PB01 commenced immediately upstream from Parsonage Street and extended for approximately 20 m. This heavily developed portion (housing subdivisions) of Penn Brook is located downstream from the recently capped town dump serving Georgetown. Flow constraints, as well as degraded riparian and instream habitat quality in Penn Brook, precluded valid benthos comparisons to the regional reference station (FB00). Nevertheless, a qualitative bioassessment was conducted in attempt to discern the effects of gross impairment to the resident biota. The collection procedure consisted of numerous “jabs” in beds of the rooted emergent macrophyte, Sparganium sp. (burreed), as well as “kicks” in the limited hard substrates (snags, gravel/cobble) available immediately upstream from Parsonage Road. Although some riffle areas did exist in the PB01 sampling reach, they were extremely shallow and usually in areas with soft substrates. Flow regimes were predominantly comprised of isolated mud-bottom pools with no perceptible current velocity. NPS inputs in the form of trash, grass clippings, and other yard waste were observed along much of the stream, especially where the vegetative buffer from encroaching yards was minimal. In addition, sediment deposition was evident throughout the sampling reach, presumably the result of runoff from nearby yards and the adjacent road (North Street) along the minimally buffered left (west) bank. The effects of runoff and severe bank erosion along the left bank were probably exacerbated by the extremely thin riparian zone here, consisting of a few trees (red maple, Acer rubrum; ash, Fraxinus americana) and beds of poison ivy (Rhus radicans). Much of the riparian vegetation along the right (east) bank consisted of the invasive purple loosestrife (Lythrum salicaria). Turbid instream conditions, and heavy deposits of FPOM on substrates and accumulating in pools, suggested water quality problems possibly related to organic enrichment associated with NPS pollution. Benthos The qualitative nature of the macroinvertebrate sampling efforts at PB01 precludes the generation of an assessment score for biological condition here; however, the benthos assemblage observed suggests the absence of gross levels of organic pollution. Despite the extremely limited benthos habitat throughout the PB01 sampling reach, a total of 15 taxa were observed, including 4 EPT families and representing every major trophic guild (Table A1). Other fairly sensitive taxa observed here include the Elmidae, Sialidae, and Aeshnidae. Although an upstream landfill is a perceived threat to biological integrity in this portion of Penn Brook, more localized NPS pollution may compromise biological potential most here. One major threat to the resident benthic community at PB01 is instream sedimentation. Sand and other fine sediments drastically reduce macroinvertebrate microhabitat by filling the intersticial spaces of epifaunal substrates. In addition, the filling of pools with sediment reduces fish cover and may be detrimental to fish egg incubation. Removal and/or disturbance of riparian vegetation may exacerbate the effects of NPS pollution related to road runoff and yard waste originating from adjacent residences. Outreach efforts are recommended to educate residents on how improper yard waste disposal impacts aquatic life “in their own back yard,” as well as the importance of maintaining a riparian buffer zone. In addition, local clean-up efforts to remove instream trash and debris should be encouraged.
Parker River Watershed Water Quality Assessment Report Appendix C C12 91wqar.doc DWM CN 54.0
Parker River PR01B—Parker River, mile point 19.60, downstream from Route 133, Boxford, MA Habitat The PR01B sampling reach began approximately 600 m downstream from Route 133, in a predominantly forested portion of Boxford. Upstream from several groundwater wells serving the town of Georgetown, it was anticipated that PR01B would serve as an upstream control for biological comparisons with downstream monitoring stations that may be impacted by flow reductions associated with these water withdrawals. While DWM established baseline biological “control” conditions a short distance farther downstream near Pine Plain Road (PR01A) during the 1994 biomonitoring survey, the effects of beaver activity (i.e., dams) made it impossible to sample the now-flooded wetland encountered there during the 1999 biomonitoring survey. The fully shaded PR01B stream reach meandered through a dense forest of hemlock (Tsuga canadensis), white pine (Pinus strobus), red oak (Quercus rubra), and red maple (Acer rubrum) with an abundance of fern along the stream banks and understory. The reach consisted of isolated, short riffle areas interspersed with slow runs and pockets of standing water before gradually giving way to “flat” water farther downstream that was more typical of this portion of the subwatershed. The top of the reach was delineated by an enormous (approximately 40 m wide) beaver dam responsible for extensive flooding of the river upstream and altered (i.e., sluggish) flow downstream. Fish habitat was adequate, with snags and submerged logs providing ample cover in some of the deeper pools present. Epifaunal habitat for macroinvertebrates was only marginal due to limited riffle areas and a preponderance of soft (sand and silt) substrates and FPOM deposits probably originating from the wetland upstream and/or beaver activity. Snags submerged in shallow riffles provided some productive benthos habitat in addition to occasional gravel beds and undercut banks. Instream vegetation consisted of small amounts of free- floating duckweed (Lemna sp.) and a thin film of surface algae. Both stream banks were well-vegetated with ferns and mosses, and root masses and the remnants of an old stone wall provided good bank stability. Riparian vegetation, consisting of a woodland forest with an even mix of deciduous and evergreen trees, extended undisturbed in both directions. There were no obvious sources of NPS pollution; however, slight sediment deposition was noted in portions of the sampling reach. PR01B received a total habitat assessment score of 134/200 (Table A4). Benthos The macroinvertebrate assemblage at PR01B received a total metric score of 26, representing 68% comparability to the FB00 assemblage. Reductions in total taxa richness, as well as EPT richness, contributed to the “slightly impacted” bioassessment (Table A2). An abundance of filter-feeding organisms (e.g., Hydropsychidae and Chironomidae), along with gathering collectors such as the gammarid amphipods, indicated that suspended and deposited forms of organic matter are the primary food resources in this portion of the river. In addition, the biotic index for the PR01B benthos assemblage was highest of all the Parker River watershed biomonitoring stations, corroborating the effects of mild organic enrichment here. Contributing greatly to the high biotic index value was the abundant midge, Rheotanytarsus exiguus gr., a tolerant taxon that has been found to be an indicator of high levels of suspended organic particulate matter (Bode and Novak 1998). The absence of a periphyton-based trophic guild (i.e., algal grazers) was evidenced by the conspicuous lack of scrapers (scraper/filterer metric score= 0) in the PR01B macroinvertebrate assemblage (Tables A1 and A2). In lieu of anthropogenic perturbations in this mostly undeveloped portion of the Parker River, instream organic loads here may be naturally occurring—the result of extensive upstream wetland areas that may offer substantial organic inputs in the form of allochthonous materials. Recent beaver activity may also compound the effects (e.g., possible low dissolved oxygen levels, FPOM deposits, slight turbidity) of organic enrichment at PR01B. In addition, beaver activity may remove or adversely affect productive benthos habitat as a result of altered flow regimes due to dams.

Parker River Watershed Water Quality Assessment Report Appendix C C13 91wqar.doc DWM CN 54.0
Parker River PR02—Parker River, mile point 17.4, at Bailey Lane, Georgetown, MA Habitat The PR02 sampling reach, which during the 1994 biosurvey contained at least some productive lotic habitat for macroinvertebrates in the form of short riffle areas with cobble/gravel substrates, displayed virtually no perceptible current velocity during the 1999 survey. A beaver dam constructed immediately upstream from the Bailey Lane crossing now results in slow/deep, lentic habitat with a primarily muddy bottom and flooded wetland margins throughout this portion of the Parker River. Due to flow constraints and substrates dissimilar to either the upstream or regional reference station, and not suitable for the RBPIII sampling methodologies, only a qualitative assessment of biological conditions at PR02 could be made during the 1999 survey. Instream vegetation provided virtually all the productive habitat for macroinvertebrates here during the 1999 survey. Rooted submergent burreed (Sparganium sp.) and Arrow Arum (Peltandra virginica) were the most common macrophytes observed, with floating duckweed (Lemna sp.) abundant as well. Channel margins were dominated by purple loosestrife (Lythrum salicaria) and various wetland shrubs (dogwood, Cornus sp.; buttonbush, Cephalanthus occidentalis) before giving way to forested areas of red oak (Quercus rubra) and red maple (Acer rubrum). Localized NPS pollution in the form of sediment deposition was observed immediately downstream from Bailey Lane, most likely originating from the road crossing via a paved “swale” along the right (south) bank or from the road itself. Benthos Despite the limited epifaunal habitat encountered here during the 1994 biosurvey, an abundance of relatively pollution-sensitive taxa contributed to overall high taxa richness. And while several of the insect orders present (e.g., Hemiptera and Odonata) during the 1994 survey were more typical of lentic wetland-dominated systems, lotic forms were well represented also (Fiorentino 1996b). This contrasts markedly with the benthos sample taken during the 1999 biosurvey at PR02, which yielded only 8 taxa—most of which were non-insect forms (e.g., Viviparidae, Gammaridae, and Asellidae) typical of lentic habitats (Table A1). The discrepancy in community composition between the 1994 and 1999 benthos samples may be related to changes in flow regimes here, as recent beaver activity (i.e., dams) has dramatically altered hydrology in this portion of the river since the 1994 biosurvey when riffle areas were still present. Biological sampling efforts at PR02 in 1999 found a deep, pool-dominated wetland channel with no appreciable current velocity. At this time it is unclear whether nearby groundwater withdrawals have affected discharge and flow regimes at PR02; however, the ability to discern these potential impacts will no doubt be confounded by the hydrological effects of beaver activity in this portion of the Parker River. Parker River PR00—Parker River, mile point 10.90, upstream from Main Street, Byfield, Newbury, MA Habitat The PR00 sampling reach began approximately 10 m upstream from Main Street, in the Byfield section of Newbury, and extended 100 m upstream to the base of a small dam which marked the top of the reach. A fish ladder extending from near the bottom of the reach to the impoundment just upstream, and a stone wall along much of the left (north) bank, were evidence of the historical mill activity in this portion of the river. Some deposition of FPOM was observed on the rocky substrates and pool areas of the PR00 reach—probably a result of its location downstream from the impoundment. Nevertheless, well-developed riffle areas with an abundance of moss-covered cobble and boulder substrates dominated the reach, providing some of the best fish and macroinvertebrate habitat observed during the 1999 Parker River watershed survey. Bank stability along the left bank was good, with boulders and the adjacent wall providing reinforcement. A wide and undisturbed riparian zone consisting of red maple (Acer rubrum), ash (Fraxinus americana), and elm (Ulnus rubra) extended from the well-vegetated left bank as well. Bank stability was slightly less than optimal along the right bank, with erosion effects probably exacerbated by the removal of bank and riparian vegetation in the vicinity of an adjacent residential property and nearby
Parker River Watershed Water Quality Assessment Report Appendix C C14 91wqar.doc DWM CN 54.0
road (Main Street). The close proximity of the road resulted in only a narrow riparian zone to buffer the effects of potential NPS inputs in the form of runoff. PR00 received a total habitat assessment score of 155/200 (Table A4). Benthos Despite the excellent epifaunal habitat found at PR00, the benthos assemblage received a total metric score of only 26, representing 68% comparability to the regional reference station (Table A2). Between the hydropsychids and another net-spinning caddisfly, Philopotamidae, filter-feeding Tricopterans comprised more than half of the benthos sample, indicating an unbalanced community responding to a preponderance of suspended FPOM in this portion of the Parker River. The low scoring (score= 0) scraper/filterer metric further supports that filter-feeders have displaced periphyton grazers as the dominant trophic guild (Table A2). Upstream impoundments probably deliver an abundance of organic particulates to the PR00 community. As previously discussed, deposits of FPOM were indeed observed on much of the epifaunal substrate in the PR00 sampling reach. It appears, then, that water quality rather than habitat quality is most limiting to biological potential at PR00, with the impounded nature of this portion of the river having a pronounced effect on community composition and trophic structure, and resulting in a “slightly impacted” bioassessment of the PR00 aquatic community (Table A2). When compared to the more upstream mainstem station PR01B, the PR00 benthic community received a total metric score of 38, representing 90% comparability. Several metrics at PR00—including EPT index, biotic index, and EPT/Chironomidae—performed better than for the PR01B assemblage, resulting in a “non-impacted” bioassessment (Table A3). However, the impairment detected at PR01B (“slightly impacted” when compared to the FB00 regional reference station) may render it inappropriate as a control station and undermine the utility of these upstream-downstream comparisons.
SUMMARY/RECOMMENDATIONS Jackman Brook (JK01)—The macroinvertebrate community at JK01 was dominated by highly sensitive taxa, reflecting overall excellent biological integrity and good water quality in this portion of Jackman Brook. Every effort should be made to maintain the diverse benthic community encountered here—maintaining current base-flow as well as instream and riparian habitat is essential. Instream deposition probably threatens biological potential most here. Sediment inputs—which can be detrimental to trout spawning habitat and epifaunal benthos habitat, and that most likely originate from the Jackman Street crossing—should be minimized. Biomonitoring (macroinvertebrates and fish) is recommended here during the next DEP Parker River watershed survey in 2004. Mill River (MR03)—Despite the efforts of both the Massachusetts Audubon Society and landowners to control NPS pollution in this subwatershed, the MR03 benthic communty continues to reflect the effects of organic enrichment—most likely the result of nutrient loadings to Upper and Lower Mill ponds or elsewhere along Mill River. Nutrient/organic loadings originating from inadequate septic systems, or various forms of runoff (e.g., agriculture, lawns, stormwater), probably contribute to the productive conditions of the upstream impoundments that supply an abundant FPOM food resource to the MR03 aquatic community. Outreach on septic system maintenance in concert with investigation of septic systems in this subwatershed should be conducted. Outreach on NPS pollution associated with agricultural practices is warranted as well. Biomonitoring (macroinvertebrates and fish) is strongly recommended here during the next DEP watershed survey in 2004, allowing DEP to document any improvements made as a result of the 319 grant entitled The Mill River Watershed Nonpoint Source Reduction Implementation Project. In addition, water quality monitoring throughout the Mill River subwatershed—especially bacteria and nutrient sampling—may help to isolated sources of anthropogenic impacts. That algal cover was not as prolific here compared to the 1994 biosurvey is somewhat encouraging. Ox Pasture Brook (OX03)—While water quality may be suspect in the upper portions of this subwatershed, it appears that habitat constraints are probably most limiting to biological potential in this

Parker River Watershed Water Quality Assessment Report Appendix C C15 91wqar.doc DWM CN 54.0
segment of Ox Pasture Brook. In particular, naturally occurring base-flow reduction and the resulting effects (e.g., exposed substrates) on epifaunal substrate availability may most shape community composition at OX03. Every effort should be made to maintain current base-flow here, as numerous pollution-sensitive taxa were encountered during the biosurvey. Additional fish community and macroinvertebrate sampling should be conducted here during the next “year 2” phase of the basin cycle for the Parker River watershed. Monitoring physico-chemical parameters such as dissolved oxygen and pH may aid in the interpretation of future biomonitoing data collected here. Penn Brook (PB01)—Habitat degradation poses a serious threat to biological integrity in this portion of Penn Brook. In particular, removal and/or disturbance of riparian vegetation may exacerbate the effects of NPS pollution related to yard waste originating from adjacent residences and runoff from North Street (upstream road crossings may contribute sediment loads as well). Outreach efforts are recommended to educate residents on how improper yard waste disposal impacts aquatic life “in their own back yard,” as well as the importance of maintaining a riparian buffer zone. In addition, local clean-up efforts to remove instream trash and debris should be encouraged. Biomonitoring should be conducted here again during the 2004 DEP watershed survey in this basin. If possible, more intensive (i.e., RBPIII) macroinvertebrate sampling should be conducted, coupled with water quality monitoring. Parker River (PR01B; PR02; PR00)—Both the PR01B and PR00 stations were characterized by a benthos assemblage structured in response to mild organic enrichment. The preponderance of FPOM—both deposited and suspended—provides an important food resource to high densities of filter feeders and gathering collectors at PR01B and PR00 respectively. The organic loads that appear to shape community composition and trophic structure at both these stations may originate from naturally productive wetland systems and/or FPOM-rich impoundments located upstream. In addition, upstream beaver activity may result in the delivery of particulate organic materials to the benthos at PR01B and PR02, while at the same time altering channel morphology and instream flow regimes. While habitat constraints made it impossible for DWM to effectively assess the potential impacts of groundwater withdrawals on the aquatic community in this portion of the Parker River, efforts should be made to address this again during the 2004 biosurveys here—possibly after further development by DWM of macroinvertebrate sampling methodologies that accurately assess biological condition in low gradient, wetland-dominated stream systems. An investigation of land-use and possible NPS pollution along the mainstem Parker River upstream from PR00 (especially in the vicinity of the impoundments in Byfield) may be warranted. Biomonitoring is recommended here again as part of the 2004 monitoring efforts for the Parker River watershed. Diurnal dissolved oxygen monitoring, nutrient sampling, and chlorophyll a sampling may help to better understand primary productivity in this portion of the Parker River.

Parker River Watershed Water Quality Assessment Report Appendix C C16 91wqar.doc DWM CN 54.0
REFERENCES Barbour, M. T., J. B. Stribling, and J. R. Carr. 1995. The multimetric approach for establishing biocriteria and measuring biological condition. pp. 63-80. in W. S. Davis and T. P. Simon (eds.). Biological Assessment and Criteria: Tools for Water Resource Planning and Decision Making. Lewis Publishers, Boca Raton, FL. 415 p. Barbour, M. T., J. Gerritsen, B. D. Snyder, and J. B. Stribling. 1999. Rapid Bioassessment Protocols for Use in Streams and Rivers: Periphyton, Benthic Macroinvertebrates, and Fish. Second Edition. EPA 841-B-99-002. Office of Water, US Environmental Protection Agency, Washington, DC. 151 p. + appendices Bode, Robert and Margaret Novak. 1998. Differences in environmental preferences of sister species of Chironomidae. Presented at the 22nd annual New England Association of Environmental Biologists meeting at Kennebunkport, Maine, 11-13 March 1998. Cooper, Andrea. 1995. Quality Assurance Plan for the Mill River Watershed Nonpoint Source Reduction Implementation Project. Massachusetts Audubon Society: North Shore, Wenham, MA. 9 p. + attachments Cooper, Andrea. 1993. Comprehensive Nonpoint Source Implementation Program for the Mill River Sub-Watershed. Massachusetts Audubon Society: North Shore, Wenham, MA. 26 p. Fiorentino, J. F. 1996a. Parker River Basin – Macroinvertebrate Community Evaluation, 1994 Survey. Technical Memorandum. Massachusetts Department of Environmental Protection, Office of Watershed Management. Grafton, MA. 7 p. Fiorentino, J. F. 1996b. Parker River Basin – PR02 Macroinvertebrate Summary, August 1994. Technical Memorandum. Massachusetts Department of Environmental Protection, Office of Watershed Management. Grafton, MA. 5 p. Hughes, R. M. 1989. Ecoregional Biological Criteria. Water Quality Standards for 21st Century. 147-151. Karr, J. R., K. D. Fausch, P. L. Angermeier, P. R. Yant, and I. J. Schlosser. 1986. Assessing Biological Integrity in Running Waters: A Method and Its Rationale. Special Publication 5. Illinois Natural History Survey. Champaign, IL. 28 p. MA DEP. 1994. Open File. 1994 Water Quality Survey Data in the Parker River Basin. Massachusetts Department of Environmental Protection, Division of Watershed Management. Worcester, MA. MA DEP. 1999. Massachusetts Section 303(d) List of Waters – 1998. Massachusetts Department of Environmental Protection, Division of Watershed Management. Worcester, MA. 129 p. Merritt, R. W., K. W. Cummins, and T. M. Burton. 1984. The role of aquatic insects in the processing and cycling of nutrients. pp. 134-163. in V. H. Resh and D. M. Rosenberg (eds.). The Ecology of Aquatic Insects. Praeger Publishers, New York, NY. 625 p. Nuzzo, R. 1999. Standard Operating Procedures (Working Draft): Water Quality Monitoring in Streams Using Aquatic Macroinvertebrates. Massachusetts Department of Environmental Protection, Division of Watershed Management. Worcester, MA. 8 p. Peckarsky, B. L., P. R. Fraissinet, M. A. Penton, and D. J. Conklin, Jr. 1990. Freshwater macroinvertebrates of northeastern North America. Comstock Publishing Assoc. Ithaca, NY. 442 p. Resh, V. H. 1988. Variability, accuracy, and taxonomic costs of rapid bioassessment approaches in benthic biomonitoring. Presented at the 36th annual North American Benthological Society meeting at Tuscaloosa, Alabama, 17-20 May 1988. US EPA. 1995. Generic Quality Assurance Project Plan Guidance for Programs Using Community Level Biological Assessment in Wadeable Streams and Rivers. U.S. Environmental Protection Agency, Office of Water. 71 p. Wetzel, R. G. 1975. Limnology. W. B. Saunders Co., Philadelphia, PA. 743 p.

Parker River Watershed Water Quality Assessment Report Appendix C C17 91wqar.doc DWM CN 54.0
APPENDIX
Macroinveretebrate taxa list, RBPIII analyses, and Habitat evaluations Table A1. Species-level taxa list and counts, functional feeding groups (FG), and tolerance values (TV) for macroinvertebrates collected during the Parker River watershed survey between 28 July and 5 August 1999. An “x” indicates taxon presence at those stations sampled qualitatively. Refer to Table 1 for a complete listing and description of sampling stations.
TAXON FG1 TV2 FB00 JK01 MR03 OX03 PB01 PR00 PR01B PR02Hydrobiidae SC 8 1 x x Viviparidae SC 6 x Laevapex fuscus SC 7 1 Pisidiidae FC 6 5 1 3 8 x 8 2 x Nais elinguis GC 10 1 Tubificidae (immature w/o capilliform chaetae) GC 10 x Lumbriculus sp. GC 8 3 4 1 1 4 Asellidae GC 8 x x Caecidotea communis GC 8 1 2 2 Gammaridae GC 6 x x Gammarus sp. GC 6 33 23 1 2 21 Baetidae GC 4 3 1 Baetidae (subequal terminal filaments) GC 6 1 1 Eurylophella sp. GC 2 1 Heptageniidae SC 4 x Stenonema sp. SC 3 2 3 28 1 Leptophlebiidae GC 2 1 4 Paraleptophlebia sp. GC 1 2 Aeschnidae PR 3 x Calopterygidae PR 5 x Coenagrionidae PR 9 1 x Acroneuria sp. PR 0 2 Hansonoperla sp. PR 1 2 Leuctra sp. SH 0 7 24 1 Neoperla sp. PR 3 2 Perlesta sp. PR 5 1 Hemiptera PR 5 x Corydalidae PR 5 x Nigronia sp. PR 0 5 1 1 Sialidae PR 4 x Sialis sp. PR 4 2 Brachycentrus sp. FC 1 1 Glossosoma sp. SC 0 2 Philopotamidae FC 3 x Chimarra sp. FC 4 8 19 32
1 Functional Feeding Group (FG) lists the primary feeding habit of each species and follows the abbreviations: SH-Shredder; GC-Gathering Collector; FC-Filtering Collector; SC-Scraper; PR-Predator. 2 Tolerance Value (TV) is an assigned value used in the calculation of the biotic index. Tolerance values range from 0 for organisms very intolerant of organic wastes to 10 for organisms which are very tolerant.

Parker River Watershed Water Quality Assessment Report Appendix C C18 91wqar.doc DWM CN 54.0
Table A1. (Continued) TAXON FG1 TV2 FB00 JK01 MR03 OX03 PB01 PR00 PR01B PR02
Dolophilodes sp. FC 0 1 Cheumatopsyche sp. FC 5 5 16 2 3 19 Hydropsyche sp. FC 4 1 5 1 Hydropsyche betteni gr. FC 6 2 21 8 17 Lepidostoma sp. SH 1 3 7 Leucotrichia sp. SC 6 1 Uenoidae SC x Neophylax sp. SC 3 1 Oecetis sp. PR 5 1 Psilotreta sp. SC 0 1 Limnephilidae SH 4 x Pycnopsyche sp. SH 4 1 1 Rhyacophila sp. PR 1 2 Elmidae SC 4 x Microcylloepus sp. GC 3 2 4 Microcylloepus pusillus GC 3 1 1 Optioservus sp. SC 4 5 2 2 8
Optioservus ovalis SC 4 2 Oulimnius latiusculus SC 4 1 5 2 1 Promoresia sp. SC 2 1 Promoresia tardella SC 2 6 6 Psephenidae SC 4 x Psephenus herricki SC 4 1 12 2 1 Stenelmis sp. SC 5 1 11 6 8 4
Stenelmis crenata SC 5 2 Chironomidae GC 6 x x Conchapelopia sp. PR 6 1 2 1 7 Krenopelopia sp. PR 7 1 Procladius sp. PR 9 1 Thienemannimyia sp. PR 6 1 Corynoneura sp. GC 4 1 Micropsectra sp. GC 7 8 2 2 11 Microtendipes pedellus gr. FC 6 3 2 Microtendipes rydalensis gr. FC 6 1 Parametriocnemus sp. GC 5 1 1 Phaenopsectra sp. SC 7 1 Polypedilum aviceps SH 4 8 3 Polypedilum fallax SH 6 1 Polypedilum flavum SH 6 17 1 Polypedilum tritum SH 6 1 3 Rheotanytarsus distinctissimus gr. FC 6 3 Rheotanytarsus exiguus gr. FC 6 18
1 Functional Feeding Group (FG) lists the primary feeding habit of each species and follows the abbreviations: SH-Shredder; GC-Gathering Collector; FC-Filtering Collector; SC-Scraper; PR-Predator. 2 Tolerance Value (TV) is an assigned value used in the calculation of the biotic index. Tolerance values range from 0 for organisms very intolerant of organic wastes to 10 for organisms which are very tolerant.

Parker River Watershed Water Quality Assessment Report Appendix C C19 91wqar.doc DWM CN 54.0
Table A1. (Continued) TAXON FG1 TV2 FB00 JK01 MR03 OX03 PB01 PR00 PR01B PR02
Stempellinella sp. GC 2 2 Tanytarsus sp. FC 6 2 1 Tvetenia bavarica gr. GC 5 1 8 2 Culicidae FC na x Chelifera sp. PR 6 1 Simulium sp. FC 5 1 Tipulidae SH 5 x Dicranota sp. PR 3 2 2 Paradelphomyia sp. PR 5 2
TOTAL 97 99 106 113 QUALITATIVE 106 108 QUALITATIVE
1 Functional Feeding Group (FG) lists the primary feeding habit of each species and follows the abbreviations: SH-Shredder; GC-Gathering Collector; FC-Filtering Collector; SC-Scraper; PR-Predator. 2 Tolerance Value (TV) is an assigned value used in the calculation of the biotic index. Tolerance values range from 0 for organisms very intolerant of organic wastes to 10 for organisms which are very tolerant.
Table A2. Summary of RBP III data analysis for macroinvertebrate communities sampled during the Parker River watershed survey between 28 July and 5 August 1999. Shown are the calculated metric values, metric scores (in italics) based on comparability to the reference station (FB00), and the corresponding assessment designation for each biomonitoring station. Refer to Table 1 for a complete listing and description of sampling stations.
STATION # FB00 JK01 MR03 OX03 PR01B PR00
STREAM Fish Brook
Jackman Brook
Mill River
Ox Pasture Brook
Parker River
Parker River
HABITAT SCORE 158 126 146 148 134 155
TAXA RICHNESS 29 6 25 6 18 4 22 4 21 4 18 4
BIOTIC INDEX 4.81 6 3.70 6 4.66 6 3.94 6 5.70 4 4.90 6
EPT INDEX 8 6 11 6 6 2 6 2 6 2 7 4
EPT/CHIRONOMIDAE 0.70 6 2.39 6 14.75 6 7.50 6 0.57 6 3.50 6
SCRAPERS/FILTERERS 1.50 6 0.60 4 0.79 6 1.46 6 0.11 0 0.15 0
COMMUNITY SIMILARITY 100% 6 71% 6 31% 0 45% 2 62% 4 49% 2
% DOMINANT TAXON 34% 2 24% 4 20% 4 25% 4 19% 6 30% 4
TOTAL METRIC SCORE 38 38 28 30 26 26
% COMPARABILITY TO REFERENCE STATION 100% 74% 79% 68% 68%
BIOLOGICAL CONDITION-DEGREE IMPAIRMENT
REFERENCE NON- IMPACTED
SLIGHTLY IMPACTED
NON/ SLIGHTLY IMPACTED
SLIGHTLY IMPACTED
SLIGHTLY IMPACTED

Parker River Watershed Water Quality Assessment Report Appendix C C20 91wqar.doc DWM CN 54.0
Table A3. Summary of RBP III data analysis for macroinvertebrate communities sampled at stations in the Parker River on 4 and 5 August 1999. Shown are the calculated metric values, metric scores (in italics) based on comparability to the upstream reference station (PR01B), and the corresponding assessment designation for the PR00 biomonitoring station. Refer to Table 1 for a complete listing and description of sampling stations.
STATION # PR01B PR00
STREAM Parker River
Parker River
HABITAT SCORE 134 155
TAXA RICHNESS 21 6 18 6
BIOTIC INDEX 5.70 6 4.90 6
EPT INDEX 6 6 7 6
EPT/CHIRONOMIDAE 0.57 6 3.50 6
SCRAPERS/FILTERERS 0.11 6 0.15 6
COMMUNITY SIMILARITY 100% 6 55% 4
% DOMINANT TAXON 19% 6 30% 4
TOTAL METRIC SCORE 42 38 % COMPARABILITY TO REFERENCE STATION 90% BIOLOGICAL CONDITION-DEGREE IMPAIRMENT REFERENCE NON-IMPACTED
Table A4. Habitat assessment summary for macroinvertebrate biomonitoring stations sampled during the 1999 Parker River watershed survey. For primary parameters, scores ranging from 16-20 = optimal; 11-15 = suboptimal; 6-10 = marginal; 0-5 = poor. For secondary parameters, scores ranging from 9-10 = optimal; 6-8 = suboptimal; 3-5 = marginal; 0-2 = poor. Refer to Table 1 for a complete listing and description of sampling stations.
STATION FB00 JK01 MR03 OX03 PR00 PR01B PRIMARY PARAMETERS (range is 0-20) INSTREAM COVER 15 8 7 5 18 11 EPIFAUNAL SUBSTRATE 13 8 17 10 18 7 EMBEDDEDNESS 15 11 19 19 19 14 CHANNEL ALTERATION 16 19 15 20 15 14 SEDIMENT DEPOSITION 15 6 18 20 15 16 VELOCITY-DEPTH COMBINATIONS 10 6 13 6 14 7 CHANNEL FLOW STATUS 16 8 9 8 11 6 SECONDARY PARAMETERS (range is 0-10 for each bank)
BANK VEGETATIVE PROTECTION 10 10
10 10
9 10
10 10
10 6
10 10
BANK STABILITY 10 8
10 10
8 10
10 10
10 8
10 10
RIPARIAN VEGETATIVE ZONE WIDTH 10 10
10 10
1 10
10 10
10 1
9 10
TOTAL SCORE 158 126 146 148 155 134 %COMPARABILITY TO REFERENCE (FB00) 80% 92% 94% 98% 85%

Parker River Watershed Water Quality Assessment Report Appendix D D1 91wqar.doc DWM CN 54.0
APPENDIX D - MA DEP GRANT AND LOAN PROGRAMS Excerpted from the MA DEP DWM World Wide Web site, http://www.mass.gov/dep/water/grants.htm, ‘1999 Grant and Loan Programs - Opportunities for Watershed Planning and Implementation’. 604(b) WATER QUALITY MANAGEMENT PLANNING GRANT PROGRAM This grant program is authorized under the federal Clean Water Act, Section 604(b); for water quality assessment and management planning. Section 604(b) projects in the Parker River Watershed include: • 98-02/604 Little River NonPoint Source Assessment. This project will comprehensively inventory,
map, and assess nonpoint sources of pollution in the Little River subwatershed of the Parker River Basin.
104(b)(3) WETLANDS AND WATER QUALITY GRANT PROGRAM This grant program is authorized under Section 104(b)(3) of the federal Clean Water Act. The water quality proposals received by MA DEP under this National Environmental Performance Partnership Agreement (NEPPA) with the U.S. Environmental Protection Agency is a results-oriented approach that will focus attention on environmental protection goals and the efforts to achieve them. The goals of the NEPPA are to: 1) achieve clean air, 2) achieve clean water, 3) protect wetlands, 4) reduce waste generation, and 5) clean up waste sites. Section 104(b)(3) projects include: • 99-07/104 Identifying Sources of Microbiology Contaminants of Freshwater Beaches. Numerous
beaches in the Commonwealth are closed to swimming periodically due to microbiological contamination. This project would field test a cooperative approach involving MA DEP, local officials and local basin watershed associations to identify sources of bacterial contamination at freshwater beaches by sampling dry and wet weather discharges from stormwater outfalls. It will also involve using techniques such as comparing microbiological contamination from illicit sewage connections versus contamination from street runoff.
319 NONPOINT SOURCE GRANT PROGRAM This grant program is authorized under Section 319 of the CWA for implementation projects that address the prevention, control, and abatement of nonpoint source (NPS) pollution. In order to be considered eligible for funding projects must: implement measures that address the prevention, control, and abatement of NPS pollution; target the major source(s) of nonpoint source pollution within a watershed/subwatershed; have a 40 percent non-federal match of the total project cost (match funds must meet the same eligibility criteria as the federal funds); contain an appropriate method for evaluating the project results; and address activities that are identified in the Massachusetts NPS Management Program Plan. RESEARCH AND DEMONSTRATION GRANT PROGRAM The Research and Demonstration (R&D) Program is authorized by Section 38 of Chapter 21 of the Massachusetts General Laws and is funded by proceeds from the sale of Massachusetts bonds. Specifically, the R&D Program was established to enable the Department to conduct a program of study and research and demonstration relating to water pollution control and other scientific and engineering studies “...so as to insure cleaner waters in the coastal waters, rivers, streams, lakes and ponds of the Commonwealth.” SOURCE WATER AND TECHNICAL ASSISTANCE/LAND MANAGEMENT GRANT PROGRAM The Source Water Protection Technical Assistance/Land Management Grant Program provides funds to third party technical assistance organizations that assist public water suppliers in protecting local and regional ground and surface drinking water supplies.

Parker River Watershed Water Quality Assessment Report Appendix D D2 91wqar.doc DWM CN 54.0
MASSACHUSETTS WATERSHED INITIATIVE PROJECTS Each year EOEA Watershed Team Leaders, in conjunction with State and Federal agencies, municipal governments and regional planning agencies, universities, local watershed associations, businesses and other groups, develop work plans that identify the most important goals for each watershed and the specific projects and programs which are needed to meet those goals. • 00-03MWI Development of Watershed Management Plans for Rock and Pentucket Ponds. The
purpose of this project is to prepare action-oriented, watershed management plans for both Rock and Pentucket ponds in the Parker River watershed. This project will compile and summarize existing data, inventory and map key watershed characteristics, assess point and nonpoint source pollution, develop comprehensive management recommendations to enhance water quality, and conduct public outreach.
WELLHEAD PROTECTION GRANT PROGRAM The Wellhead Protection Grant Program provides funds to assist public water suppliers in addressing wellhead protection through local projects and education. CLEAN WATER STATE REVOLVING LOAN FUND (SRF) PROGRAM The Massachusetts State Revolving Loan Fund for water pollution abatement projects was established to provide a low-cost funding mechanism to assist municipalities seeking to comply with federal and state wateer quality requirements. The SRF Program is jointly administered by the Division of Municipal Services of the Department of Environmental Protection and the Massachusetts Water Pollution Abatement Trust. Each year the Department solicits projects from Massachusetts municipalities and wastewater districts to be considered for subsidized loans , which are currently offered at 50%grant equivalency (approximates a no interest loan). In recent years the program has operated at an annual capacity of $150 to $200 million per year, representing the financing of 40 to 50 projects annually. The SRF Program now provides increased emphasis on watershed management priorities. A major goal of the SRF Program is to provide incentives to communities to undertake projects with meaningful water quality and public health benefits and which address the needs of the communities and the watershed. • In the Parker River Watershed, The town of Newburyport was awarded an SRF Grant in 2000 for
improvements to the wastewater treatment facility and collection systems.
COMMUNITY SEPTIC MANAGEMENT PROGRAM The enactment of the Open Space Bond Bill in March of 1996 provided new opportunities and stimulated new initiatives to assist homeowners with failing septic systems. The law appropriated $30 million to the MA DEP to assist homeowners. The DEP will use the appropriation to fund loans through the Massachusetts Water Pollution Abatement Trust. The fund will provide a permanent state/local administered revolving fund to assist income-eligible homeowners in financing necessary Title 5 repairs. Working together, the MA DEP and the Trust have created the Community Septic Management Program to help Massachusetts’ communities protect threatened ground and surface waters while making it easier to comply with Title 5. This loan program offers three options from which a local governmental unit can choose. • Between 1998 and 2000, the towns of Georgetown, Rowley, and West Newbury were awarded
funding under the Community Septic Management Program.

Parker River Watershed Water Quality Assessment Report Appendix E E1 91wqar.doc DWM CN 54.0
APPENDIX E - DMF SHELLFISH DATA, PARKER RIVER/PLUM ISLAND SOUND COASTAL DRAINAGE AREA
It is the mission of the Division of Marine Fisheries (DMF) to manage, develop, and protect the Commonwealth's renewable living marine resources to provide the greatest public benefit. DMF fosters protection of the marine environment by cooperating with other state and federal agencies on pollution abatement, coastal wetlands protection and other programs concerning coastal waters and marine life. DMF monitors coastal contaminant levels in fish and shellfish, operates a shellfish depuration facility, and evaluates the impacts of coastal development on marine fish and their habitats. DMF provides assistance to local shellfish officers on matters affecting the management of shellfish, and provides expertise on anadromous fish and construction assistance on fishways. Other DMF programs assist commercial and recreational fishermen and educate the public on marine resource issues and values. The DMF Shellfish Management Program manages shellfish growing areas in compliance with the National Shellfish Sanitation Program (NSSP). The NSSP is a federal/state cooperative program recognized by the U.S. Food and Drug Administration (FDA) and the Interstate Shellfish Sanitation Conference (ISSC). One goal of this program is the sanitary control of shellfish harvested and sold for human consumption. Growing areas are managed with respect to shellfish harvest for direct human consumption and comprise at least one or more classification areas. The classification areas are the management units, and range from being approved to prohibited (six different classification types in all) with respect to shellfish harvest (Tables E1, E2 and E3). Table E1. DMF Shellfish Management Program Managed Shellfish Growing Area Classifications.
Classification Type Definition
Approved Open for harvest of shellfish for direct human consumption.
Conditionally Approved During the time the area is approved, it is open for harvest of shellfish for direct human consumption subject to local rules and state regulations.
Conditionally Restricted During the time the area is restricted, it is only open for the harvest of shellfish with depuration subject to local rules and state regulations.
Restricted Open for harvest of shellfish with depuration subject to local rules and state regulations for the relay of shellfish.
Management Closure Closed for the harvest of shellfish. Not enough testing has been done in the area to determine whether it is fit for shellfish harvest or not.
Prohibited Closed for the harvest of shellfish. Classification area codes and town names identify each DMF shellfish area. The Parker River/ Plum Island Sound Coastal Drainage Area 1999 Water Quality Assessment Report describes each shellfishing area by its classification area code and the assessed region is defined in square miles within the DEP/DWM water body system segment. As of October 2000 DMF classified a total of 11,137.968 acres in the Parker River/ Plum Island Sound Coastal Drainage Area (Table E2).

Parker River Watershed Water Quality Assessment Report Appendix E E2 91wqar.doc DWM CN 54.0
Table E2. Summary Shellfish Classification Area Information as of October 2000. Classification Type Area (acres)
Approved 7106.453 Conditionally Approved 3494.853
Prohibited 536.662 Table E3. DMF - Shellfish Project Classification Area Information as of October 2000.
Town Classification Area Code Classification Type Area (Acres) Ipswich N3.0 Approved 997.216Ipswich N4.0 Conditionally Approved 1620.143Ipswich N4.1 Conditionally Approved 274.464Ipswich N4.2 Conditionally Approved 23.021Ipswich N5.2 Prohibited 0.023Ipswich N6.0 Approved 425.862Ipswich N6.1 Prohibited 32.473
Newbury N2.0 Prohibited 58.259Newbury N3.0 Approved 1430.912Newbury N4.0 Conditionally Approved 640.801Newbury N4.3 Prohibited 160.868Newbury N4.4 Prohibited 159.468Newbury N3.0 Approved 2590.512
Newburyport N1.0 Prohibited 0.006Newburyport N2.0 Prohibited 10.666Newburyport N3.0 Approved 135.445Newburyport N3.0 Approved 338.444
Rowley N3.0 Approved 402.639Rowley N4.0 Conditionally Approved 920.102Rowley N4.2 Conditionally Approved 6.322Rowley N4.4 Prohibited 29.131Rowley N3.0 Approved 785.423
Salisbury N1.0 Prohibited 61.23Salisbury N2.0 Prohibited 24.538