Parker Hannifin Corporation Annual Shareholders Meeting€¦ · Presented by: Don Washkewicz...
76
Presented by: Don Washkewicz Chairman, CEO & President October 24, 2012 Parker Hannifin Corporation Annual Shareholders Meeting
Transcript of Parker Hannifin Corporation Annual Shareholders Meeting€¦ · Presented by: Don Washkewicz...

Presented by: Don Washkewicz Chairman, CEO & President
October 24, 2012
Parker Hannifin Corporation Annual Shareholders Meeting

2
Forward-Looking Statements
Forward-looking statements contained in this and other written and oral reports are made based on known events and circumstances at the time of release, and as such, are subject in the future to
unforeseen uncertainties and risks. All statements regarding future performance, earnings projections, events or developments are forward-looking statements. It is possible that the future performance and
earnings projections of the company, including its individual segments, may differ materially from current expectations, depending on economic conditions within its mobile, industrial and aerospace markets, and
the company's ability to maintain and achieve anticipated benefits associated with announced realignment activities, strategic initiatives to improve operating margins, actions taken to combat the
effects of the current economic environment, and growth, innovation and global diversification initiatives. A change in economic conditions in individual markets may have a particularly volatile effect on segment
performance. Among other factors which may affect future performance are: changes in business relationships with and purchases by or from major customers, suppliers or distributors, including delays
or cancellations in shipments, disputes regarding contract terms or significant changes in financial condition, changes in contract cost and revenue estimates for new development programs and changes
in product mix; uncertainties surrounding timing, successful completion or integration of acquisitions; ability to realize anticipated cost savings from business realignment activities; threats associated with and efforts to combat terrorism; uncertainties surrounding the ultimate resolution of outstanding legal
proceedings, including the outcome of any appeals; competitive market conditions and resulting effects on sales and pricing; increases in raw material costs that cannot be recovered in product pricing; the
company’s ability to manage costs related to insurance and employee retirement and health care benefits; and global economic factors, including manufacturing activity, air travel trends, currency
exchange rates, difficulties entering new markets and general economic conditions such as inflation, deflation, interest rates and credit availability. The company makes these statements as of the date of
this disclosure, and undertakes no obligation to update them unless otherwise required by law.

Non-GAAP Financial Measures
This presentation reflects certain non-GAAP financial measures, the reconciliations for which can be found at www.phstock.com

4
FY2012 Review
Business Update
Outlook for FY2013
Presentation Agenda
5
FY2012 Results

6
Another Outstanding
Year!
FY12 Results

7
Setting New Records !
FY12 Results
8
Operating Margin Goal
15%

123456789
1011121314
1970 1972 1974 1976 1978 1980 1982 1984 1986 1988 1990 1992 1994 1996 1998 2000
15% Goal
R O S
14 13 12 11 10 9 8 7 6 5 4 3 2 1
15 15
30 Years before Win Strategy
11.1% 11.1%

10
15.2%
FY12 Record We Did It!

123456789
10111213141516
1970 1973 1976 1979 1982 1985 1988 1991 1994 1997 2000 2003 2006 2009 2012
R O S
16 15 14 13 12 11 10 9 8 7 6 5 4 3 2 1
The Win Strategy Result
15.2%
15% Goal 11.1%
11.1%

New 15% Record
12
Accomplished in a Difficult Global
Economy

All Time Records
13
Sales $13.1B
Net Income 8.8% Net Income
$1.2B
Cash From Operating Activities
$1.5B EPS $7.45
Operating Margin 15.2%
Ind’l N/A 17.8%

14
Congratulations Global Team !
FY12 Performance

15
Global Market Trends

16
Parker FY12 Country Growth
France -1%
China -4%
USA +9% U.K. -4%
Germany +8%
Brazil 0% Canada +16%
S. Korea +10%
Italy -7%
Sweden +9%
17
FY12 Presentation
Key Financials

18
FY11-12 FY11 FY12 Change
Net Sales $12,346 $13,146 6.5%
Net Income * $1,049 $1,152 9.8%
ROS 8.5% 8.8% ---
EPS $6.37 $7.45 17.0%
* attributable to common shareholders
FY12 Results $MM

19
Sales Trend
6.98.1
9.410.7
12.1
10.3 10.0
12.3 13.1
$0$2$4$6$8
$10$12$14
2004 2005 2006 2007 2008 2009 2010 2011 2012
8 Yr CAGR 8.4% 2004-2012
$Billions
Record
20
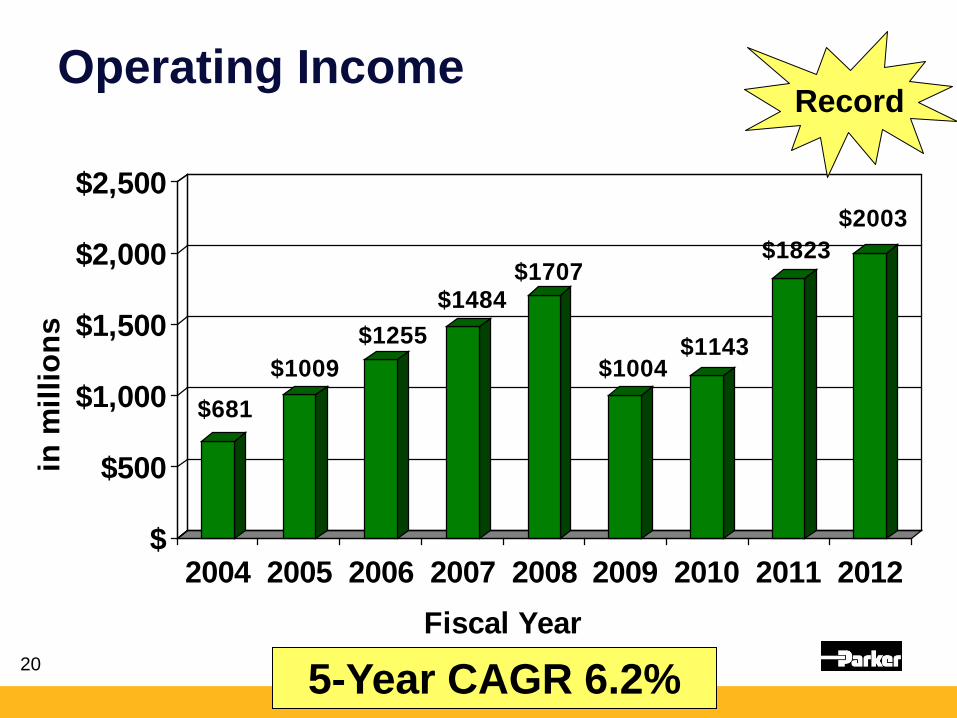
Operating Income
$681$1009
$1255$1484
$1707
$1004$1143
$1823$2003
$
$500
$1,000
$1,500
$2,000
$2,500
in m
illio
ns
2004 2005 2006 2007 2008 2009 2010 2011 2012Fiscal Year
5-Year CAGR 6.2%
Record

21
EPS
$0.75 $1.08$1.86
$2.95$3.52
$4.68$5.53
$3.13 $3.40
$6.37
$7.45
0.001.002.003.004.005.006.007.008.00
2002 2003 2004 2005 2006 2007 2008 2009 2010 2011 2012
Fiscal Year
$/Share
From continuing operations
Record

22
FY12
Cash Flow

23
Cash Flow $’s
631 663737
10511118
1329
1129
1530
1319
936
1567
$400$500$600$700$800$900
$1,000$1,100$1,200$1,300$1,400$1,500$1,600
02 03 04 05 06 07 08 09 10 11 12Fiscal Year
$ M
illio
ns
From operating activities, before discretionary pension contributions

24
-0.6%
2.4%
3.2%
4.2%
5.6%
5.7%
5.9%
6.1%
6.7%
7.5%
7.8%
8.0%
8.1%
8.7%
9.0%
9.8%
9.8%
9.9%
10.0%
10.5%
10.7%
14.2%
-2.0% 0.0% 2.0% 4.0% 6.0% 8.0% 10.0% 12.0% 14.0% 16.0%
ITT
JCI
Flowserve
SPX
Eaton
Honeywell
Textron
35th Percentile
Deere
Ingersoll Rand
Caterpillar
50th Percentile
Cummins
Cooper
Rockwell
Illinois Tool
Pall
75th Percentile
Dover
Parker
Emerson
Goodrich
Danaher
Free Cash FlowPH Fiscal 2012 vs Peer Calendar 2011*
-20.0%JCI
ITT
Free Cash Flow %
Parker
* Data for Parker is fiscal year 2012 vs. peers 2011 calendar year end. Free Cash Flow = Cash from Operating Activities less Capital Expenditures
Free Cash Flow % of Sales

25
Other Accomplishments
FY12

26
Parker Board ranked #1 in “highest average director weight” – average business experience of each director by James Drury survey
ADW Rank Company ADW
# of Directors Industry
Revenue Rank
Revenue ($B)
1 Parker Hannifin 9.2 11 Industrial Manufacturing 248 $10.0
2 Marathon Oil 8.9 12 Mining, Oil & Gas 29 68.4
3 PPG Industries 8.9 10 Industrial Manufacturing 181 13.4
4 Sherwin-Williams 8.8 10 Industrial Manufacturing 308 7.8
5 R.R. Donnelly & Sons 8.8 8 Business Services 247 10.0
6 Apple 8.7 7 Technology 35 65.2
7 Micron Technology 8.7 7 Technology 287 8.5
8 Radio Shack 8.7 6 Consumer Services 492 4.5
9 Ecolab 8.5 10 Industrial Manufacturing 378 6.1
10 General Cable 8.5 6 Technology 465 4.9
#1 on Director Experience

(5.0%)
0.0%
5.0%
10.0%
15.0%
20.0%
25.0%
3 Year 5 Year 10 Year
S&P 500 Index S&P 500 Industrials Parker
27
Parker Delivers Strong Returns Total Shareholder Returns
(Annual Equivalent)
23.6%
5.1%
10.9%

28
FY12 Dividends
Increased 23%

29
FY12 Share Repurchase
6.4 Million Shares
$ 455 Million

30
Strengthened Balance Sheet
Q1 Q2 Q3 Q4
25.8% 25.2% 24.3% 26.1%
2012 Debt to Total Cap
Target 40% Max.

31
FY12 Accomplishments
Winovation Progress

32
The Challenges of Mankind…
Defense Energy
Food
Water
Life Sciences
Infrastructure
Environment Transportation

33
Active projects in the funnel
3% of Sales

34
Energy Recovery
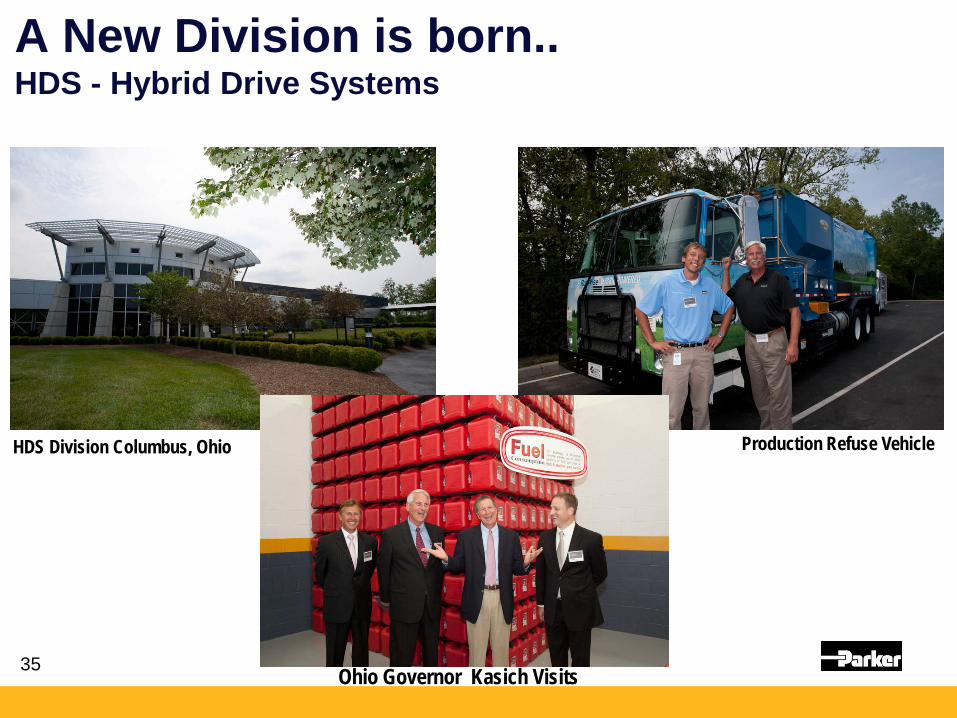
A New Division is born.. HDS - Hybrid Drive Systems
35
HDS Division Columbus, Ohio
Ohio Governor Kasich Visits
Production Refuse Vehicle

36
Innovation Video follows presentation

37
FY2012
Win Strategy

38
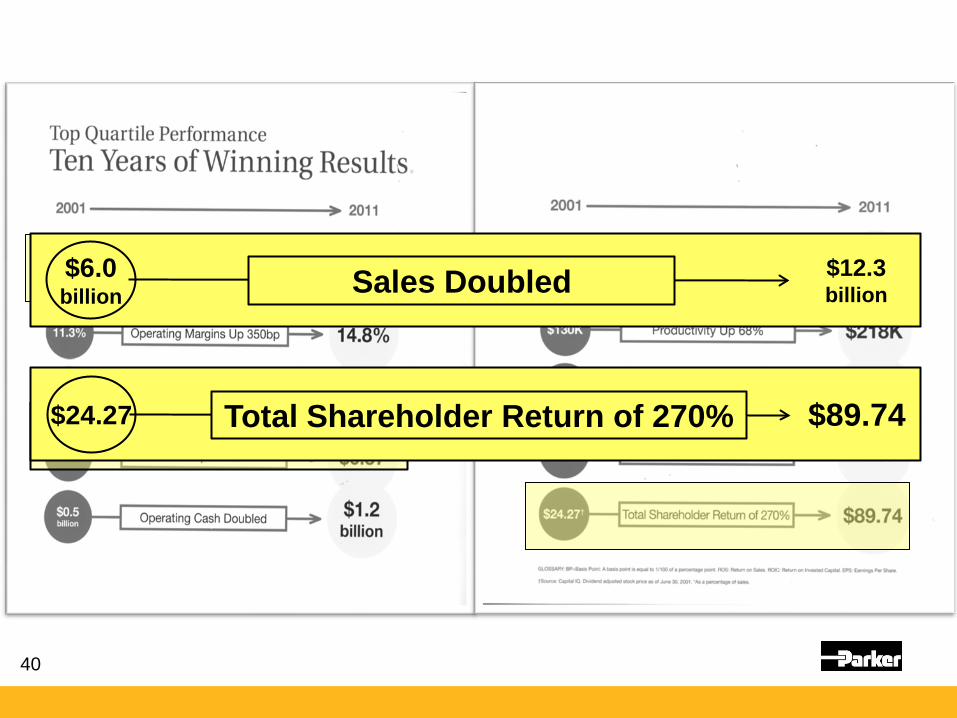
Win Strategy 10 Year Report Card

39
40
$24.27 Total Shareholder Return of 270% $89.74
$6.0 billion Sales Doubled $12.3
billion

41
Parker’s Win Strategy
Goals #1 Premier Customer Service
Financial Performance
Profitable Growth
S T R A T E G I E S
Internal
Acquisitions Globalization ♦Delivery of Quality
Products on Time
♦ Value Added Services
♦ Best Systems-PHconnect
♦ Suppliers ⇒ STRATEGIC PROCUREMENT
♦Operation ⇒ LEAN
♦ Customers ⇒ STRATEGIC PRICING
♦ European Initiatives
♦
♦ Innovative Products
♦ Systems Solutions
♦ Strong Distribution
Vision The #1 Motion & Control Company
Empowered Employees

42
Parker’s Culture
The Customer is #1
43
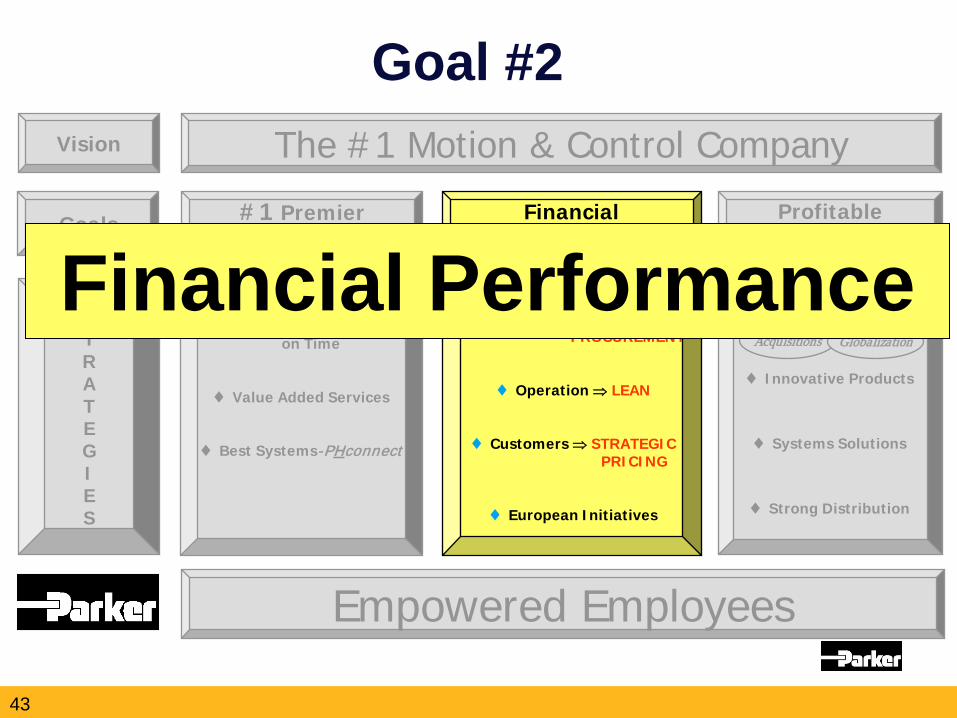
Goals #1 Premier Customer Service
Financial Performance
Profitable Growth
S T R A T E G I E S
Internal
Acquisitions Globalization ♦Delivery of Quality Parts
on Time
♦ Value Added Services
♦ Best Systems-PHconnect
♦ Suppliers ⇒ STRATEGIC PROCUREMENT
♦Operation ⇒ LEAN
♦ Customers ⇒ STRATEGIC PRICING
♦ European Initiatives
♦
♦ Innovative Products
♦ Systems Solutions
♦ Strong Distribution
Vision The #1 Motion & Control Company
Empowered Employees
Goal #2
Financial Performance

44
The “Win Strategy” Objective
Maximize ROIC

45
Return on Net Assets Performance
0.0%
5.0%
10.0%
15.0%
20.0%
25.0%
0.50 0.60 0.70 0.80 0.90 1.00 Net Assets/Sales
Ret
urn
on
Sal
es
Goal
FY 2006 FY 2007 FY 2008 FY2009 FY2010 FY2012 FY2011
Record 24.9%

46
Lean Records

47
17.5%
18.7%
17.9%
17.1%16.8%
17.0%16.4%
15.7%15.6%
15.4%
14.6%
14.0%14.0%
14.5%
13.4%
12.6%
12.9%13.5%
12.7%
12.6%12.7%
12.9%
12.2%
11.8%
12.4%
13.1%12.8%
12.3%12.1%
12.4%
11.7%
12.2%
13.4% 13.5%
12.7%
11.7%
12.3%11.9%
11.4% 11.4%11.2%
10.9%
10.7%10.0%
12.0%
14.0%
16.0%
18.0%
20.0%
FY02 FY03 FY04 FY05 FY06 FY07 FY08 FY09 FY10 FY11 FY12
Goal = 10¢
Inventory to Sales
Record 10.7%

48
125 130 132135
154168
174189
204
179191
218226
120
140
160
180
200
220
FY00 FY01 FY02 FY03 FY04 FY05 FY06 FY07 FY08 FY09 FY10 FY11 FY12
Productivity Sales/Employee
$000’s
With annualized acquisition volume
Record

49
Global Growth

50
Goals #1 Premier Customer Service
Financial Performance
Profitable Growth
S T R A T E G I E S
Internal
Acquisitions Globalization ♦Quality Products on Time
♦ Value Added Services
♦ Best Systems-PHconnect
♦ Suppliers ⇒ STRATEGIC PROCUREMENT
♦Operation ⇒ LEAN
♦ Customers ⇒ STRATEGIC PRICING
♦ European Initiatives
♦
♦ Innovative Products
♦ Systems Solutions
♦ Strong Distribution
Vision The #1 Motion & Control Company
Empowered Employees
A Clear Roadmap – “Win Strategy”

51
FY12 Acquisitions $141M Asia Pacific Instrumentation &
Fluid Connectors Filtration
$22 million $16 million $100 million
Automation Fluid Connectors Hydraulics
India
$3 million $35 million * $200 million *
* Revenues previously consolidated

52
Europe – Middle East Africa
Global Growth

53
European Headquarters Etoy, Switzerland
113 Employees
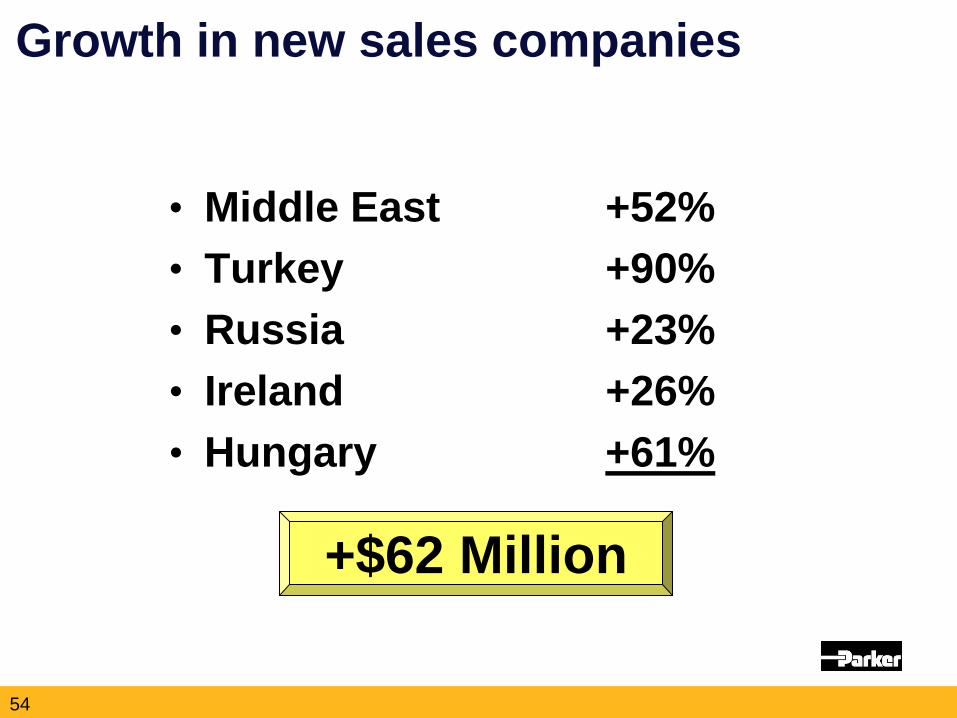
Growth in new sales companies
• Middle East +52% • Turkey +90% • Russia +23% • Ireland +26% • Hungary +61%
54
+$62 Million

507 ParkerStores - EMEA + 54 Stores in
FY12
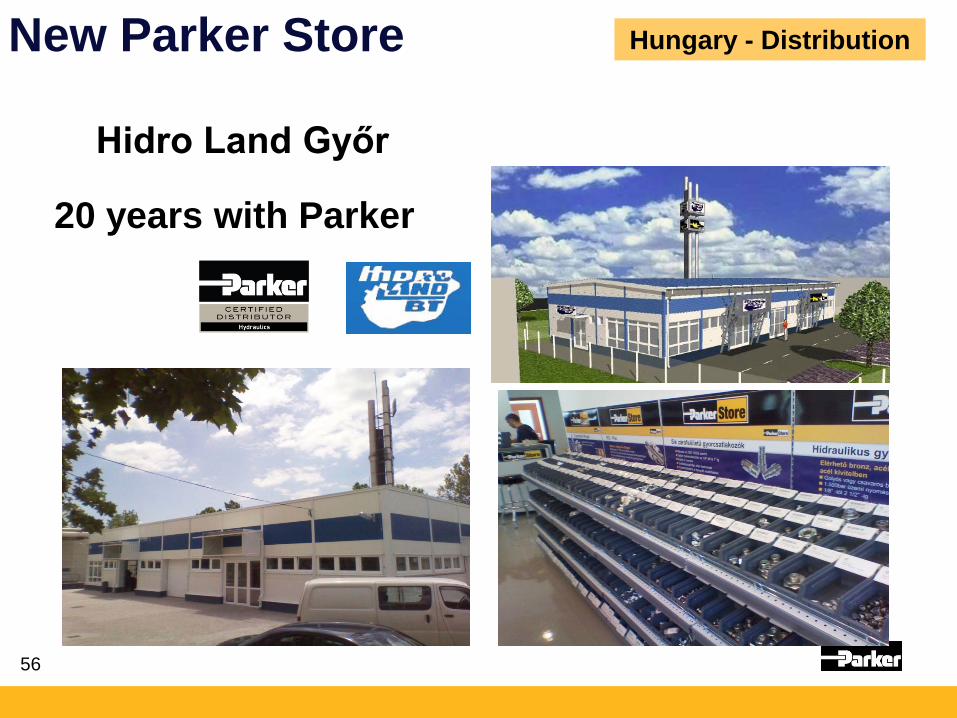
56
New Parker Store
Hidro Land Győr
20 years with Parker
Hungary - Distribution

57
Asia
Global Growth

59
2004 2005 2006 2007 2008 2009 2010 2011 2012 2013PLAN
.5B .6B.8B
1.4B1.6B
1.3B 1.4B1.8B 1.8B
Asia Sales Growth
All shown at FY13 Rates
2.0B
Fiscal Year
Japan + KPL 168
China 903
Korea 418
Rest 603
Taiyo 273
2.0
1.6
1.2
.8
.4
0
5 Year CAGR 5.4%
60
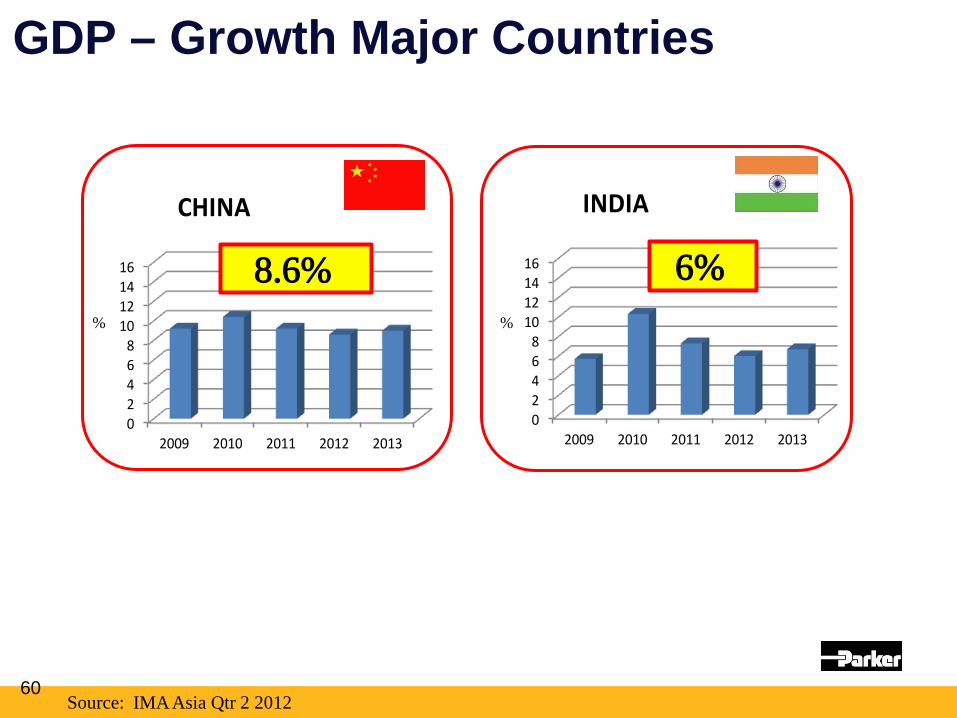
02468
10121416
2009 2010 2011 2012 2013
CHINA
02468
10121416
2009 2010 2011 2012 2013
INDIA
% %
Source: IMA Asia Qtr 2 2012
GDP – Growth Major Countries
8.6% 6%

952 ParkerStores - Asia + 134 Stores in FY12

62
Profitable Growth
Growth through Strong Distribution

ParkerStores - Global
386 417 450 489
628
821
1053
1351
1531
1685
1891
2092
0
500
1000
1500
2000
2500
FY01 FY02 FY03 FY04 FY05 FY06 FY07 FY08 FY09 FY10 FY11 FY12
+ 201 Stores in FY12

64
Global Growth
Aerospace Growth

Recent Platform Wins $20B
Airbus A350XWB • Hydraulic System
• Fuel Systems • Fuel Tank Inerting System
Gulfstream AAP • Flight Control System
• Hydraulic System Components
COMAC C919 • Flight Control System
• Hydraulic System • Fuel System
Bombardier Global 7000/8000 • Flight Control System
• Hydraulic System
Bombardier C-Series • Flight Control System
• Hydraulic System • Fuel System
Embraer Legacy 450/500 • Flight Control System
• Hydraulic System • Fuel System
65
$20 Billion

66
FY13 Plan

Forecast
67

FY13 Assumptions
68

FY13 Assumptions
69

70
FY13 Assumptions
U.S.A. Election Year Economy

71
FY2013 1st Quarter Results
Fiscal Year 2013

72
First Quarter Results
FY12 FY13 Change
Net Sales $3,234 $3,215 (.6%)
Net Income * $297 $240 (19.3%)
Net ROS 9.2% 7.5% ---
Diluted EPS * $1.91 $1.57 (17.8%)
* Attributable to common shareholders
$MM
73
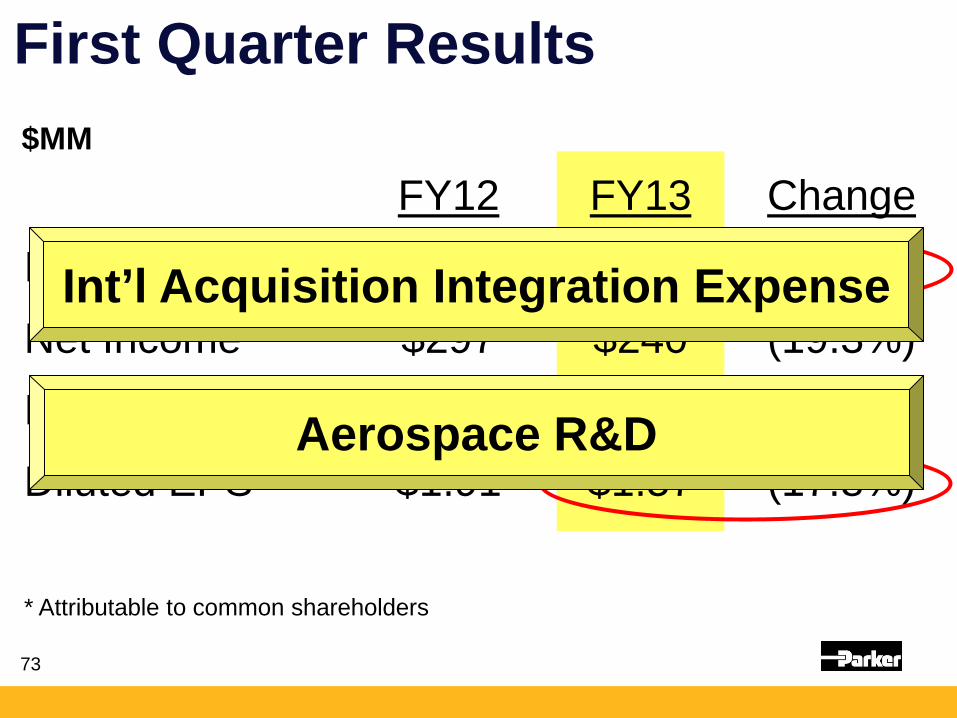
First Quarter Results
FY12 FY13 Change
Net Sales $3,234 $3,215 (.6%)
Net Income * $297 $240 (19.3%)
Net ROS 9.2% 7.5% ---
Diluted EPS * $1.91 $1.57 (17.8%)
* Attributable to common shareholders
$MM
Int’l Acquisition Integration Expense
Aerospace R&D
134
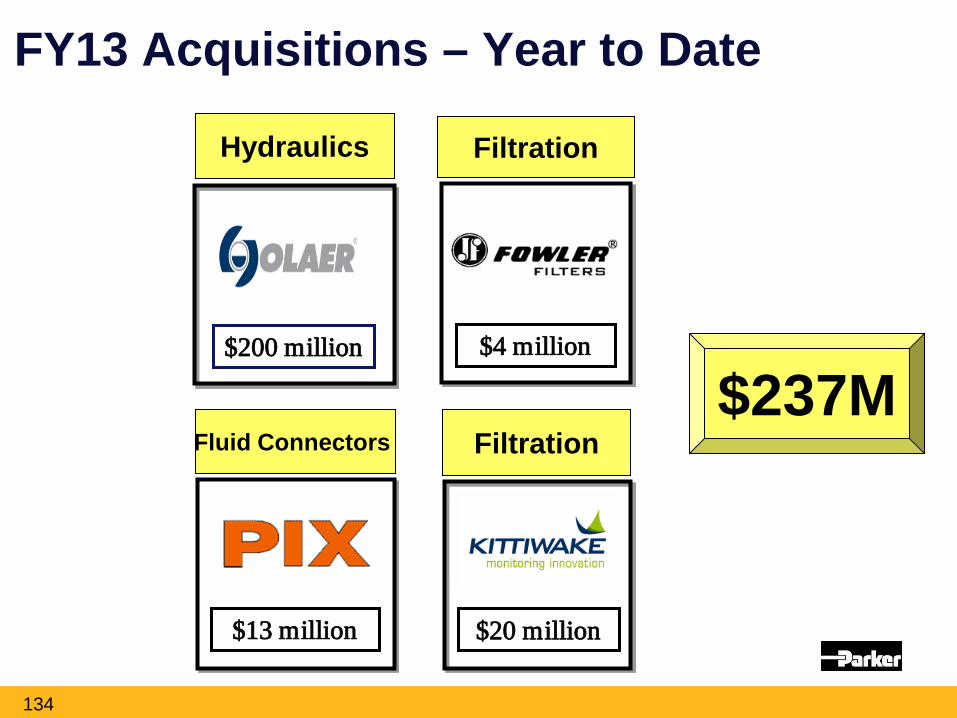
FY13 Acquisitions – Year to Date
Hydraulics
Fluid Connectors
Filtration
$4 million $200 million
$13 million
Filtration
$20 million
$237M

75
20% Market Share
Top quartile ROIC
The Premier Diversified Industrial
A/S
ROS NxNW
Top quartile P/E Multiple
10% CAGR
The Future -- What does good look like?

76
Video: Runwise Advanced Series Hydraulic Hybrid Chassis for
Refuse Vehicles

77
Thank You