Parivartan - 2 - Leading Business School in Navi...
69
-
Upload
nguyenkhanh -
Category
Documents
-
view
216 -
download
2
Transcript of Parivartan - 2 - Leading Business School in Navi...


EDITORIAL BOARD
• Copyright © by ORIENTAL INSTITUTE OF MANAGEMENT, VASHIThis book is circulated subject to the condition that no part of this publication may bereproduced, stored, or transmitted in any form or by any means (electronic, mechainical,photocopying, recording or otherwise), without the prior written permission of the copyrightowner.
• Disclaimer :The editorial committee has taken utmost care to provide quality editorial articles in thiscompendium of papers.
• Printed at :KUNAL CREATIVE ARTSShop No. 38, Jai Jawan Market, Sector - 17, Vashi, Navi Mumbai - 400 703.Tel.: 4013 4143 | Mob.: 9892346012
DR. RONALD S. ROCHONProvost & Vice President for Academic Affairs,
University of Southern Indiana, USA
DR. MENON SREEDHARANDirector, Rajiv Gandhi Institute of Management
Ghansoli, Navi Mumbai.
DR. RAMESH G. SONIChair & Professor, Management Dept.,
Eberly IUP Indiana PA, USA
DR. P. K. BANDGARDirector, OIM Vashi, Navi Mumbai.
DR. M. G. SHIRAHATTIDirector General, OIM Vashi, Navi Mumbai.
DR. SUNIL R. KARVEDirector, Babasaheb Gawde Institute of
Management Studies, Mumbai.
DR. N. A. MAJUMDARFormar Advisor to RBI Mumbai.
DR. RASHMI SONIDean Academics, OIM Vashi, Navi Mumbai.

It is indeed a moment of much pride for us to present to you the first issue of “PARIVARTAN”the Journal of Management Research at the Oriental Institute of Management (OIM) – asa part of OIM’s endeavor to nurture research and innovation. The broader mission andgoal behind bringing out “PARIVARTAN” is to publish original, high quality, managementresearch that will have a significant impact on the management theory and practice.
“PARIVARTAN” is a scholarly journal that aims to publish scientific research on the practiceof management in areas related to strategy, entrepreneurship, innovation, informationtechnology and various functional areas of management like accounting, finance,marketing, people management and operations. The journal also publishes studies onorganizational, managerial and individual decision making from both normative anddescriptive perspectives.
Articles published in the journal are reviewed by external and internal reviewers and areprimarily based on the foundational disciplines of economics, mathematics, psychology,sociology, and statistics. We encourage cross-functional, multidisciplinary research thatreflects the diversity of the management profession and practice. We also strive tostimulate research in emerging domains created by economic globalization, public policyshifts, technological improvements and trends in management practice.
We ensure that articles accepted for publication in the journal have clear implications forpracticing managers based on one or more of a variety of rigorous research methodologies.We also endeavor to publish insightful analyses of the management literature, conceptual/theoretical studies, comments on past articles, studies concerning various aspects ofmanagement practice, real life case studies, sample surveys, and experimental studies.
The primary audience of our journal includes academicians at business schools,practitioners who have a concern for keeping abreast of the state of the art in practice ofmanagement and all those - who are interested in undertaking advanced research in thefield of management. The journal presents to this audience the concepts, theories, andmanagerial perspectives that address currently cutting-edge issues in the theory andpractice of management.
Most of the articles in this journal are prominent in their respective areas. The writershave put in their best efforts to convey the message to the readers that could be recognizedand imbibed in their personal life, at the corporate and institutions. We sincerely thankall the writers and supporters for their whole- hearted support and seek to have thecontinued support on an ongoing basis.
Dr. Rashmi SoniEditor
EDITORIAL


Pg. No.
1. Dr_Clifford_Machogu_paper 01-07Dr. Clifford G. Machogu, Dr. Jairus B. Amayi, Mr. Nicas Nibengo
2. IFRS: A Devise for Standard Convergence 08-12Dr. Ratna Sinha
3. An Introspection of IPOs 13-21Mr. N. Chidambaram, Dr. P. Vikkraman
4. NPA Analysis of Public Sector Banks and Private Sector Banks (Sector wise) 22-27Dr. M. Sukanya, S. Sirisha
5. Impact of Women Self Help Groups in Trichy District, Tamil Nadu 28-32P. Murali
6. Work Life-Balance In Selected Private Banks With Reference To Aurangabad Region 33-37Sonali Ramesh Kshirsagar
7. Knowledge Management: Driving Force for organizations in today’s competitive environment 38-44Prof. Pratibha Giri, Prof. Reeva Verma
8. Women Empowerment Through Self Help Groups An Analytical Study Of Entrepreneurial 45-51Development Integrated Wasteland Development Programme Rajnagar, Jharkhand:A successful InitiativeDr. A. V. Hemalatha
9. Integrated Wasteland Development Programme Rajnagar, Jharkhand : A Successful Initiative 52-56Dr. Ritesh Dwivedi, Priyanka Singh
10. An Empirical Study on Occupational Stress in Academicians with special reference 57-62to Bangalore cityMrs Purnima Thampi V, Dr. Lakshmi Jagannathan
INDEX
1
AbstractThis paper analyzes perceptions of both financial institutions and customers towards supply and demand offinancial capital towards income poverty reduction. The paper examines the level of Public awareness on financialcapital services as the driving force in Mwanza, Tanzania. It further discusses constraints for demand and supplyof financial capital and the level of magnitude of financial capital contributions on income poverty reduction.The study is based on collected primary data using a questionnaire. Measures of central tendency were used toanalyze data.The paper establishes that over 50% of the respondents believe that financial capital contributes to the growthof economic activities and social well being is high, or conversely, less than half the respondents believe thatfinancial capital’s contribution to economic growth and social well being is positive. Positive economiccontributions are attributed to growth of business sales revenue and profit by averagely 32.57%, and 25.71 %respectively. On account of expansion in business assets, 15.43% was recorded while provision of employmentrecorded 8.57 %. On business linkages and networking 9.71% was recorded. The 9.71% attributed positivecontribution to social well being was due to commitment and accountability to personal development, improvededucation, land and housing, acquisition of household items, food and health accessibility, and healthimprovement.
Key Words: Credit, Financial Institutions, Customers, Perceptions
INTRODUCTION
he Government of Tanzania has beenadopting various measures for economic
growth and poverty reduction through fiscal andmonetary policies since independence. In the 1990s,attention focused on economic growth as the meansof achieving improvements in human welfare with themind set of ‘trickle down effect of economic growth’.However, Poverty and Human development Reportsof the years 2007 and 2008 which assessed the trendof poverty in 2007 based on Household Budget Surveys(HBS) of 2006/07 and 2007/08 revealed that despite thehigh economic growth of 6.8% to 7.8%, respectively,36% of Tanzanians were living below poverty line. Inthe year 2007/08, it was estimated that 19% ofTanzanians lived below the food poverty line (Povertyand Human Development Report, 2008). The reportindicated that the percentage of households belowpoverty line, by region, 2007/08 for Mwanza was 48%(HBS: 2007/08).Despite the financial system reforms initiated in 1990,the National Microfinance Policy of 2000 and Small andMedium Enterprises Development Policy of 2003 (URT:2003), which enabled availability and access to financialcapital (Chijoriga: 2000): credits, hire purchase, leasefinancing, agro-inputs loans, agro-input vouchers;saving schemes and insurance schemes, public
perception on the contribution of financial capital onincome poverty reduction was not known. Besides,income poverty remains high in Tanzania, a marvel thathas not been known with the current financial capitalparadigm?The study therefore was an endeavour to determinethe level of Public awareness on contribution offinancial capital on income poverty reduction. Thestudy analyzed the driving forces for demand andsupply of financial capital and the magnitude offinancial capital contributions on income povertyreduction.
Literature ReviewThe paper is based on the concept that financial capital,if correctly perceived can play an important role inincreasing efficiency and productivity. Although growthis not a sufficient condition for poverty alleviation,there is evidence that higher incomes in the communitybenefit the poor segments of the populationproportionately (Ikara, 2003). Financial sector is a keyelement in generating growth, and thus, it is animportant ingredient in poverty reduction. Dollar andKraay (2000), indicated that on average the poor dobenefit from growth, as an increase in the rate of GDPper capita leads to a one for one increase in the averageincome of the poorest. The Financial Sector provides
T
Credit Drivers; Financial Institutions &Customers' Perceptions In Tanzania* Dr. Clifford G. Machogu
** Dr. Jairus B. Amayi
*** Mr. Nicas Nibengo
* Seniour Lecturer, School of Business and Economics, Kabianga University College, Kericho, Kenya ** Lecturer,*** Assistant Lecturer, Accounting and Finance, Faculty of Business Administration, St Augustine University of Tanzania,

2
the best alternative source of capital to poorpopulation, especially through micro financing.According to Collins and Borthworth (1996), the use offactor productivity in growth diagnostics, assesses therelative contribution of the factors of production andTotal Productivity (TFP). The production functions aremainly founded on econometric work of different levelsof sophistication from standard two inputs case tomulti-inputs case. Thus Q= f (k, l) in the two input case,where Q= output, k = Capital, l= labour input andf=function. This model provides an incrementalreasoning on the contribution of capital in economicdevelopment. The role of financial and non financialinstitutions is to provide capital to deficit units whichinvest this capital in different economic activities.Financial capital theory suggests that, as financialcapital increases within networks of transactingpartners, the average level of benefits increases andthe disparity of benefits decreases. In part, this inverserelationship between disparity of income and averageincome results from terms of trade in financial capital-rich networks which favours transacting partners, fromincreased investment in real assets and ultimatelyprovide opportunities independent of one’s income.
Financial Capital and Poverty
The connections between financial capital and povertyare two fold: Financial capital and poverty reductionare connected in that financial capital is an importantresource that if properly managed can be used toreduce poverty. Utilization of financial capital directlyreduces poverty through spill-over-effects ofinvestment. Attitude toward investment will directindividuals’ life cycle (Eakins, 1999). The lesson of thepast several decades is that the productivity of physical,social, human and natural forms of capital depends onfinancial capital.
Financial Capital Paradigm
A paradigm, Robison at el; (2002), is a description of asubject that includes definitions, identification of anddescription of variables, and expected cause and effectrelationships. As paradigm mature, the proposed viewof the subject becomes generally accepted by expertsin the field. A mature paradigm can facilitatecooperative action in a particular area, because itreduces conflict and cost of obtaining agreements. Thefinancial capital paradigm describes the influence ofrelationships on financial goods, and economictransactions and contains concepts drawn from nearlyall of the social sciencesThe elements of financial capital paradigm, besidefinancial capital, include perceptions, financial systems,participants, financial institutions, financial markets,financial instruments, policies and regulations.
The link between Financial Capital and PovertyReduction in Tanzania
Financial Capital schemes through financial institutionsand markets delivery in Tanzania were initiated early2000 to meet different objectives. The most commonlymentioned objectives included: poverty alleviation andimproved living standards, offering financing to thepoor (Harper et al; 2009), women empowerment, andthe development of business sector as a means ofachieving high standards and reducing market failure(Chijoriga; 2000)According to Blomström and Kokko, (2003) andBorenzstein, De Gregorio, and Lee (1998), thecontributions of Financial capital to the developmentof a country are widely recognized as filling thegap between desired investment and domesticallymobilized saving, increasing tax revenues, andimproving management and technology, as well aslabour skills. These could help the country to fight itsway out of poverty.
Research Methodology
This was a survey study design. The study collectedinformation from households, financial institutions,non-financial institutions, experts, opinion leaders,business community, and salaried workers fromNyamagana and Ilemela districts in Mwanza CityTanzania. The financial institutions’ population wasdrawn from 8 commercial banks, 3 non bank financialinstitutions 3 foreign bureau and 54 savings and creditcooperatives. The total population of financialinstitutions was 68. The business population was drawnfrom 4,570 registered trade/industrial businesses,which included whole sellers and retailers. Thegovernment sample was drawn from 1 branch of Bankof Tanzania and 2 district councils. The population offinancial market was drawn from Dar es salaam StockExchange Market since Mwanza has no its ownregistered stock exchange market. Total sample sizestudied was 175 of which 125 were households and 50key informants. Households sample was extracted fromindividual lists, which was obtained from list ofborrowers from financial institutions and markets.Primary data were obtained using interviews with keyinformants and individual households’ members.
Data Analysis, Discussion and Findings.Level of Awareness on Contribution of FinancialCapital on Income Poverty Reduction
Figure 1 (here)Figure 2 (here)
As shown in figures 1 and 2 responses from keyinformants, households and focus group discussionhelped to assess the level of public awareness on usesand access of financial capital and its contribution to

3
poverty reduction. When respondents were asked thequestion, “do you know what the financial capital is allabout”, 89.60% of house hold respondents said theydid, while 10.40 % said they did not. On the other hand,96% of key informants said they knew, while only 4.00%of them said they did not .On average 91.43% ofrespondents said they were aware of the meaning offinancial capital, while 8.73% were not aware of themeaning of financial capital. Table 2(here)Given the findings as indicated in table1, financialcapital contribution to the growth of industrial sectoris ranked with the lowest perception at 81.71%,followed by agricultural sector with 65.14%, servicesand infrastructure with 57.71%, natural resources with51.43%, health with 50.86%, building and constructionwith 43.43% and cooperatives with 41.7%. The highestperception rating was as follows: Education sector wasrated highest by 89.71%, trading and commerce 81.1%,vending 69.71 %, cooperatives 58.29 %, building andconstruction 56.57 %, health 49.14 percent, naturalresources 48.57 %, services and infrastructures 42.29%, agriculture 34.89 % and industrial sector 18.29 %.
Driving Forces for Demand of Financial Capital inMwanza CityTable 2 (here)Both Household and Key informant respondentsmentioned nine reasons that drive people to seekfinancial capital assistance; financing working capital25.71 %, education development 17.14 %, medicalexpenses 9.14%, building and construction 10.29 %,purchasing machinery, tools and equipments 4.57 %,long term investment 5.14 % and purchasing motorvehicles 8 %Table 3 (here)
Driving Forces for Supply of Financial Capital inMwanza City.The forces that drive financial institutions to providefinancial capital to the public include: Profit accounting46%, provision of capital to the public 39%, pressurefrom political forces 29%, financial institutionssustainability and growth 21 % and 9 % respectively,economic growth stimulation 17% and public serviceprovision 14 %.
Constraints for Demand of Financial Capital Table 4 (here)Constraints for demand of financial capital asmentioned by respondents include: Public inadequateentrepreneurial and business management skills 18.29%, High interest rates associated with financial capital17.71%, non formalization of business activities17,14%, unconducive business environment 13.14% ,unfavourable terms and conditions associated to
financial capital 12.57%, poor property regulation 12%and little awareness of credit information 9.14%.
Constraints Facing Financial Institutions In Supply ofFinancial Capital to the PublicConstraints mentioned include; Public inadequateentrepreneurial and managerial skills 22.29%, poorregulatory environment 16.57%, limited availability ofreliable credit information from the public 13.71%, hightransaction costs for small volume 10.29%, high costsfor financial intermediation 9.14% and high costs forestablishing rural branches 7.43%.
Providers of Financial Capital in Mwanza CityEleven actors that provide financial capital to the publicin Mwanza City include; NMB bank with 24.57%, CRDBbank 20%, NBC 8.57%, saving and Finance 5.71%, PostalBank 1.14%, Azania Bank 8.57%, Stanbic Bank 2.29%,Bank of Africa 2.29%, SACCOS 12.5%, NGOs 4 % andTUNAKOPESHA 10.29%.
Perceived Magnitude on the Contribution of FinancialCapital on Business Activities
Table 5 (here)Respondents mentioned financial capital to contributeto growth of business sales revenue 32.57%, profitincrease 25.71% increase in business assets 15.43%,opening new branches 8 percent, provision ofemployment, 8.57% and increase in business linkagesand networking 9.71%
Perceived Magnitude on the Contribution of FinancialCapital on Personal Well beingPerceived contribution were in terms of: increasedpersonal commitment and accountability 9.71%,improvement in education 37.71%, improvement inshelter and housing 24% , acquisition of householditems and furniture 7.43%, increased accessibility tofood 12% and improvement in general health 9.14%.
Perceived Forms and Experiences of Financial CapitalServicesThe perceived forms and experiences in accessing andusage of financial capital as mentioned by respondentsinclude: short term loans 85.14%, long term loans 28percent, salaried workers loans 56%, overdraft facilities28%, agricultural loans 31.43%, livestock loan 13.71 %.Leasing 2.29% and housing loans 29.14%.
Qualitative Contribution of Financial Capital onGrowth of Economic and Social IndicatorsRespondents qualitatively ranked the contribution offinancial capital to ten economic and social indicators.The low perception rating was as follows: industrialsector rated lowest by 81.71%, agricultural sector65.14%, services and infrastructure 57.71, natural

4
resources 51.43 %, health 50.86%, building andconstruction 43.43 %, cooperatives 41.71 % andeducation 10.29 %. The highest perception rating wasas follows: Education sector was rated highest with89.71 %, trading and commerce 81.14%, vending69.71%, cooperatives 58.29 %, building andconstruction 56.57%, health 49.14 %, natural resources48.57%, services and infrastructure 42.29 percent,agriculture 34.89% and industrial sector 18.29 %.
Statistical Analysis and Description on the Findingsusing the median as measure of central tendency theresults indicate that, over half of the populationbelieves contribution of financial capital to growth ofeconomic activities and social well being is high.Conversely, less than half the population believecontribution of financial capital to economic growthand social well being is low.
ConclusionFinance is an important component of development,including poor people. Indeed, evidence from this studyhas shown that more than half the populationperceived financial capital to have reduced incomepoverty and lowered income inequality. In addition tofacilitating overall economic growth, financial capitalhad helped individuals smooth their income, insureagainst risks, and broaden investment opportunities.Testimonies have been evidenced in promotingindividuals education, facilitated trade and commerceand improved individual accessibility to food and goodhealth.Despite this positive contribution, productive sectorssuch as industrial and agriculture have been perceivedto have low accessibility to financial capital, hence lesscontribution to GDP. Therefore the most importantfactor for a prosperous future of contribution offinancial capital on income poverty reduction lies inhonesty and mutual concern by financing industrial,agricultural, infrastructural and construction sectors.
Recommendation Based on the findings above, the study makes thefollowing recommendations to improve thecontribution of financial capital on income povertyreduction.
The Financial SystemThe financial system should be at the service of man,systems, and governments, by allowing individuals andsocieties to come to their utmost fulfilment byassuming responsibility for their own development.
Supplier of Financial CapitalSupplier of financial capital i.e. financial institutions andMarkets should improve accessibility of financial capital
services by: (1) Lowering interest rates that help tofacilitate the growth of client businesses. (2) Financingindustries, agricultural and construction sectors. (3)Offering training and couching their clients onentrepreneurship and business management skills. (4)Promote their financial capital services to the publicto make them aware of the facility. (5) Be flexible andoffer favourable credit terms and conditions.
Users of Financial CapitalUsers of financial capital i.e., the society should: (1)Formalize business activities to be able to attractfinanciers. (2) Formalize property rights anddocumentation. (3) Observe credit agreements, adhereto honesty and accountability. (4) Invest in mostproductive sectors, such as industry, agriculture andconstruction
The GovernmentThe government should: (1) establish entrepreneurshipincubation centres to enable the community to acquireentrepreneurship skills and be competent ininvestment and business undertaking. (2) improvemonetary system, fiscal policy and regulatoryenvironment to protect both lenders and borrowers..
International CommunityInternational Community should have a political willto stop World financial institutions such as World Bankand IMF from wasting productive capacity on financingthe manufacture of arms and then selling the same topoor countries. Instead, they should finance productionthat is geared towards the satisfaction of real humanneeds.
Area for Further ResearchThis study recommends further research in Innovationand Inclusions in financial system issues, strategies andoptions in Developing Countries.
ReferencesADAM, R.H. 2004. Economic Growth, Inequality andPoverty: Estimating the Growth Elasticity of Poverty
ALBERT, Ernest. 2008. The Disinherited of the Earth,ORDISEF Association, Kampala Uganda
MBELLE, Amon .2006. Prospects for achieving broad-based and equitable growth in Tanzania: A researchreport presented to eleventh REPOA ResearchWorkshop White Sands Hotel, Dar es Salaam, Tanzania
ATKINSON, A.B .1991. Comparing Poverty RatesInternationally: Lessons from Resent Studies inDeveloped Countries: The World Bank Economic ReviewVol. 5no.1.pp.3-21
BAGACHWA, M.S.D. 1994. Poverty alleviation inTanzania: Dar es Salaam. Dar es Salaam University Press

5
BANDERA, O.M.S. 1997. Micro and small enterprisesPotentials for Development: General Considerations: Apaper presented to the workshop of Micro and SmallEnterprises Research, November, Dar Es Salaam
CHIJORIGA, M.M. 2000. The performance andSustainability of Microfinance Institutions in Tanzania:Working paper
COLLINS, S and B. Bosworth. 1996. The Empirics ofGrowth: Brookings Institution
DORWARD, A; J.Kydd, J. Morrison and I. Urey. 2004. APolicy Agenda for Pro-poor Agricultural Growth; WorldDevelopment, Volume 33, Number 1, January, pp.73-90
EELE, G,J. Semboja, S.B; Likwelile and S.Ackroyd. 2000.Meeting International Poverty Targets in Tanzania;development Policy Review, Vol.18 pp.66-88
HARPER, V.L et all.1999. Measuring Transformationassessing and improving the impact of Micro Credit;
Paper Presented at Micro Credit Summit meeting ofcouncils in Abidjan Cote de’Ivore, June
KOTHARI, C.R. 1990. Research Methodology: Methodsand Techniques; H.S Poplai 2nd Edition
KUZILWA, J.A .2002. The role of Credit for Small BusinessSuccess; A study of the National EntrepreneurshipDevelopment Fund in Tanzania, A paper presented atthe 6th Annual International Conference onEntrepreneurship and Small Business Development(ICAESB), White Sand Hotel, Dar es Salaam
PACK, H.and C. Paxson.2001. “Is Africa ManufacturingSkill Constrained?”
SZIRIMAI, A and Ranis, G; F.Stewart and A.Ramirez.2000. “Economic Growth and Human Development“World Development” Vol.28 No 2, pp 197-219
SEVERINE SA.Kessy and Fratern M.Urion. 2006. Thecontribution of Microfinance Institutions to PovertyReduction in Tanzania; REPOA Research Report no 06.3Mkuki na Nyota, Dar Es Salaam Tanzania
Figure 1 Awareness on the meaning of financial capital
Source: Field data, (2009)

6
Table 1 Perception on the performance of financial capital contribution to economic growth
Source: Field Data (2010)
Figure 2 Public awareness on uses and accessibility of financial capital
Source: Field data, (2010)
Perception on the perform ance of financial capital contributes to economic growthQuallitative ranking
Respondents ranking oncontribution of financial Very Verycapital to economic growth Sectors Low Low High High Total House holds Agriculture, Forest and Fishing 42 38 12 33 125
Industry 54 45 16 10 125Trading and commerce 12 23 67 23 125Services and infrastructures 33 34 26 32 125Vending 6 52 67 0 125Education 0 23 98 4 125Health 23 34 43 25 125Building and constructions 12 44 56 13 125Natural Resources 87 14 7 17 125Cooperatives 3 56 54 12 125
Very VerySectors Low Low High High Total
Key respondents Agriculture, Forest and Fishing 8 16 23 3 50Industry 29 11 2 8 50Trading and commerce 7 6 37 0 50Services and infrastructures 8 17 23 2 50Vending 4 27 13 6 50Education 1 3 41 5 50Health 6 12 32 0 50Building and constructions 6 17 24 3 50Natural Resources 18 7 19 6 50Cooperatives 0 13 35 2 50
Very VerySectors Low Low High High Total
Combined key informants Agriculture, Forest and Fishing 50 54 35 36 175and House holds Industry 83 56 18 18 175
Trading and commerce 19 29 104 23 175Services and infrastructures 41 51 49 34 175Vending 10 79 80 6 175Education 1 26 139 9 175Health 29 46 75 25 175Building and constructions 18 61 80 16 175Natural Resources 105 21 26 23 175Cooperaties 3 69 89 14 175

7
Table 2 Driving forces for demand for Financial Capital in Mwanza
Source: Field Data(2010)
Table 3 Perceived-driving forces for institution supply of financial capital
Source: Field data, (2010)
Table 4 Constraints for public demand of financial capital
Source: Field data, (2010)
Table 5 Perceived magnitude on the contribution of financial capital on business activities
Source: Field data, (2010)
Driving forces by pecentage rating
House hold 25.60 17.60 8.80 9.60 12.00 4.00 0.80 12.80 8.80 100key informants 26.00 16.00 10.00 12.00 4.00 6.00 16.00 4.00 6.00 100Average 25.71 17.14 9.14 10.29 9.71 4.57 5.14 10.29 8.00 100
Demand forfinancial capital
WorkingCapital
Educationdevelopement
MedicalExpenses
Building andconstruction
Farmingand
livestock
Machinerytools and
equipmentLong terminvestment
Homefurniture
Car andMotorVehicle Total
House hold 23.20 10.40 - 11.20 26.40 11.20 17.60 100Key informants 34.00 16.00 18.00 - 1200 600 14.00 100Average 2629 1200 5.14 8.00 2229 9.71 16.57 100
Supply forfinancial capital
Profitmaking Institution
InstitutionGrowth
PublicService
ProvisionCapital
Provision
Economicgrowth
stimulationPoliticalforces Total
Driving forces for supply of financial capital
House hold 11.20 7.20 20.00 9.60 16.80 12.80 22.40 100Key informants 36.00 14.00 10.00 18.00 2.00 14.00 6.00 100Average 18.29 9.14 17.14 12.00 12.57 13.14 17.71 100
Constraints fordemana of
financial capital
Consutraints for demand of financial capital
Inadequateenterpreneurial
skills
Little awarenes ofcredit information
Nonformalizationof business
activities
Poorproperty
rights
ufavouablecredit terms& conditions
unconducivebusiness
environment
Highinterest
ratesTotal
Constraints offinancial capitalto the business
Perceptions on the contribution of financial capital on business activities
Salesrevenue
increasedProfit
increasedBusiness
assetsincreased
Increasein
businessbranches
Employmor staff
BusinessLinkages
andnetworking
Total
House hold 36.00 26.40 14.40 9.60 8.00 5.60 100Key informants 24.00 24.00 18.00 4.00 10.00 20.00 100All respondents 32.57 25.71 15.43 8.00 8.57 9.71 100

8
IFRS: A Devise for Standard Convergence- An empirical study on Indian Economy
ABSTRACTIndian Economy is continually increasing integration with the global economies, and it would be an even
more attractive country to get FDI, which was much-needed for its development. Under this circumstance, itwould be imperative for Indian corporate to adopt International Financial Reporting Standards (IFRS) for theirfinancial reporting. The new standards will give them access to resources around the world at reduced costs.Moreover, it will make it easy for FDI to come into the country. The International Accounting Standards Board(IASB) can help countries cope with transitional challenges they face. As the capital markets become increasinglyglobal in nature, convergence of accounting standards towards a common set of high-quality accounting prin-ciples is a move in the right direction. Compliance with new accounting standards will significantly change theaccounting practices in India and will align Indian accounting practices with global accounting practices. Withthe growth of Indian Economy and increasing integration with the global Economies, Indian corporate is raisingcapital globally. So in the process of restructuring the economy in the line of Global Path Indian industries joinsthe major global financial revolution commonly known as International Financial Reporting Standards (IFRS)Convergence. This study tries to analyze the information available on IFRS adoption process in India. It alsodiscusses the IFRS adoption procedure in India and the utility for India in adopting IFRS. The paper discuss theproblems faced by the stakeholders (Regulators, Accountants, Firms etc) in the process of adoption of IFRS inIndia. In conclusion part, Paper brings out the ways through which these problems can be addressed.
Keywords: Accounting, International Financial Reporting Standards (IFRS)
OBJECTIVES OF THE STUDY1. To study the how India would get benefitted in
adopting IFRS.2. To provide a conceptual framework between GAAP
& IFRS.3. To analyze the problems faced by the stakeholders
(Regulators, Accountants, Firms etc) in the processof adoption of IFRS and suggest some suggestion forovercome the
LIMITATION OF THE STUDYThough we discuss challenges about applying IFRS inthroughout the world, Indian Multinationals have stillnot adapted the same. So this paper analyse majorissues relatively practical difficult to implement IFRS.
REASERCH METHODOLOGYThe present study is theoretical in nature and hence isbased on secondary data published by different sourcessuch as data published by ICAI Members, journals, newspapers and data published by other research scholars.The study is basically undertaken to provide aconceptual framework between GAAP & IFRS and alsoto give a briefing on how India would get benefited inadopting the same.
INTRODUCTION:
he economic reform (1990), popularly knownas, Liberalization, Privatization and
Globalization (LPG model) aimed to make the Indianeconomy as fastest growing economy and globallycompetitive. Indian economy shifting from agricultureto manufacturing and services, as part of thedevelopment process, the finance professionals playedan increasingly important role. This will enhance theconfidence of investors in financial statements issuedby Indian companies. Indian companies demonstratedtheir capability to take advantages of opportunitiesemerged from the restructuring of the economy andto compete equally with global leaders. The IRFS givecompanies more discretion over how they present theirfinancial standing, leading to a diversification ofprocessing formats. But given the greater leewaycompanies would have in processing the figures, thevalidity of such comparisons would be tenuous at best.There are many in the accounting profession and in thecorporate world who accept the early implementationof accounting standards fully convergent with IFRS. SoIFRS in a business situation can have a significant effecton the financial results and position of a division or anentire business enterprise which help companies tomake tax expertise, and able re-examine all aspects ofthe tax planning and compliance life cycle.
T
*Dr. Ratna Sinha
* Assistant Professor, The City College of Business Management, Bangalore, Jaya Nagar Bangalore.
9
REVIEW OF LITERATURERay Ball (2006), In his paper he discusses the advantagesand disadvantages of uniform accounting rules withincountry, let alone internationally and also addressingthe issues, which is economic and political. On the "pro"side of the ledger, He concludes that extraordinarysuccess has been achieved in developing acomprehensive set of "high quality" standards and inpersuading almost 100 countries to adopt them. On the"con" side, a deep concern is that the differences infinancial reporting quality that are inevitable amongcountries have been pushed down to the level ofimplementation, and now will be concealed by a veneerof uniformity.Daske Holger (2008), This paper examines theeconomic consequences of mandatory IFRS reportingaround the world and also analyzes the effects onmarket liquidity, cost of capital in 26 countries using alarge sample of firms that are mandated to adopt IFRS.The author finds that many adopting countries havemade concurrent efforts to improve enforcement andgovernance regimes.Business standard (2010), According to the publishedinformation that international firms will protect theirlearning to retain their competitive advantage.Therefore, it is for the benefit of the country that eachcompany makes judicious choice of the accounting firmas its partner without limiting its choice to internationalaccounting firms. Public sector companies should takethe lead and the ICAI should develop a clear strategy todiffuse the learning.
OUTLINE OF THE IFRSIFRS are accounting rules ("standards") issued by theInternational Accounting Standards Board (IASB), anindependent organization based in London, UK. Theypurport to be a set of rules that ideally would applyequally to financial reporting by public companiesworldwide. "The IASB founded on July 1, 2000 isdeveloping a single set of high quality, understandableand enforceable International Financial ReportingStandards (IFRSs) for general purpose financialstatements.IFRS is to provide a global framework for how publiccompanies prepare and disclose their financialstatements. IFRS provides general guidance for thepreparation of financial statements, rather than settingrules for industry-specific reporting.
IFRS in Indian progressIn procession with the global trend, IFRS conversion hasstarted steaming in India 1 April, 2011. Institute ofChartered Accountants of India is actively promotingthe IASB's pronouncements in the country with a viewto facilitating global harmonization of AccountingStandards and ICAI has pronounced that Indian GAAP
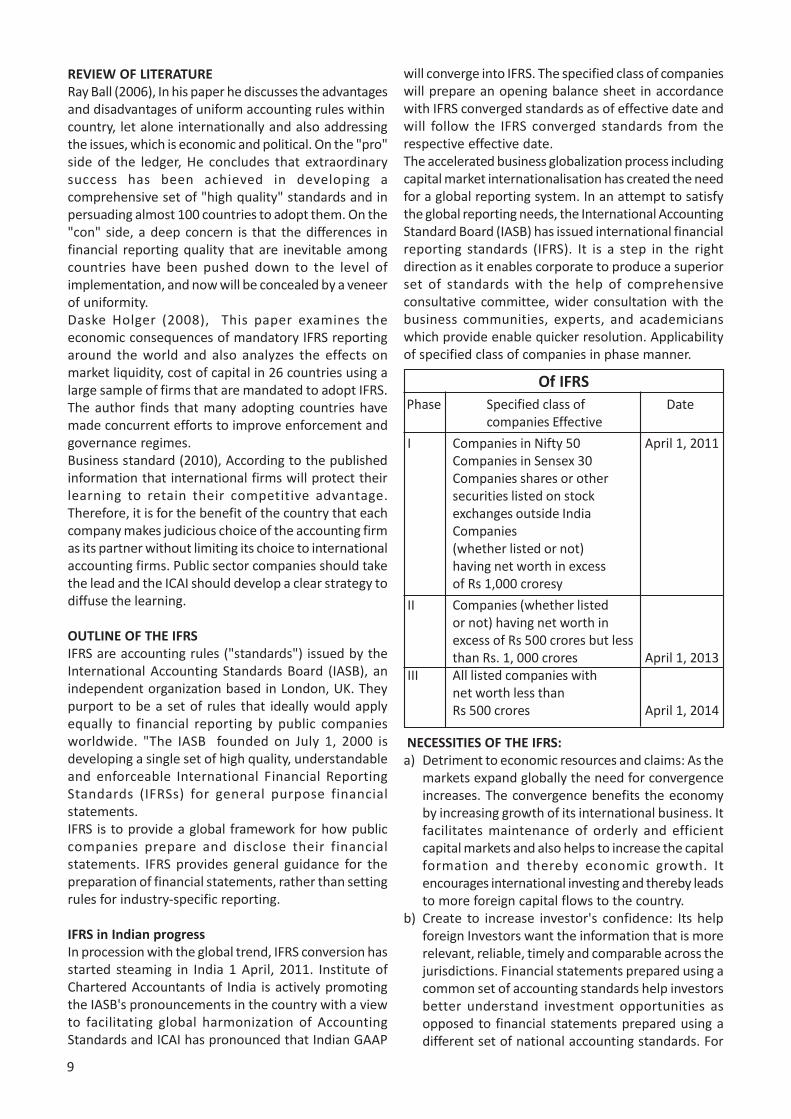
will converge into IFRS. The specified class of companieswill prepare an opening balance sheet in accordancewith IFRS converged standards as of effective date andwill follow the IFRS converged standards from therespective effective date.The accelerated business globalization process includingcapital market internationalisation has created the needfor a global reporting system. In an attempt to satisfythe global reporting needs, the International AccountingStandard Board (IASB) has issued international financialreporting standards (IFRS). It is a step in the rightdirection as it enables corporate to produce a superiorset of standards with the help of comprehensiveconsultative committee, wider consultation with thebusiness communities, experts, and academicianswhich provide enable quicker resolution. Applicabilityof specified class of companies in phase manner.
NECESSITIES OF THE IFRS:a) Detriment to economic resources and claims: As the
markets expand globally the need for convergenceincreases. The convergence benefits the economyby increasing growth of its international business. Itfacilitates maintenance of orderly and efficientcapital markets and also helps to increase the capitalformation and thereby economic growth. Itencourages international investing and thereby leadsto more foreign capital flows to the country.
b) Create to increase investor's confidence: Its helpforeign Investors want the information that is morerelevant, reliable, timely and comparable across thejurisdictions. Financial statements prepared using acommon set of accounting standards help investorsbetter understand investment opportunities asopposed to financial statements prepared using adifferent set of national accounting standards. For
Of IFRS Phase Specified class of Date
companies Effective
I Companies in Nifty 50 April 1, 2011Companies in Sensex 30Companies shares or othersecurities listed on stockexchanges outside IndiaCompanies(whether listed or not)having net worth in excessof Rs 1,000 croresy
II Companies (whether listedor not) having net worth inexcess of Rs 500 crores but lessthan Rs. 1, 000 crores April 1, 2013
III All listed companies withnet worth less thanRs 500 crores April 1, 2014

10
better understanding of financial statements, globalinvestors have to incur more cost in terms of thetime and efforts to convert the financial statementsso that they can confidently compare opportunities.Convergence with IFRSs contributes to investorsunderstanding and confidence in high qualityfinancial statements.
c) Accordance the Industries: IFRS is a step change infinancial accounting and reporting and is intendedto harmonies accounting practices across the world.This consistency is intended to make it easier forstakeholders across country borders to measure andcompare performance and to truly embrace a globalinternational accounting language. "Multinationalsseeking to enter new markets and expandoperations to a foreign country may need to reportusing IFRS in order to obtain an operating license orraise capital and the ease of using one consistentreporting standard from subsidiaries in manydifferent countries.
FUNDAMENTAL DIFFERENCES BETWEEN GAAP ANDIFRS : There should be similarity in the concepts of USGAAP and IFRS regarding materiality and consistencythat entities have to consider in preparing their financialstatements but at the conceptually level there are somedifferences, IFRS is considered more of a "principlesbased" accounting standard in contrast to U.S. GAAPwhich is considered more "rules based. Under IFRS, LIFO(Last in First out) cannot be used while under U.S. GAAP,companies have the choice between LIFO and FIFO(First in first out). Some of Key differences between thetwo accounting frameworks are below:a) Financial statement presentation: - In IFRS Financial
Statements does not prescribe a standard layout,but includes a list of minimum items. Comparativeinformation must be disclosed in respect of theprevious period for all amounts reported in thefinancial statements.Entities may present expenses based on eitherfunction or nature (for example, salaries,depreciation). However, if function is selected,certain disclosures about the nature of expensesmust be included in the notes.US GAAP prepare the balance sheet and incomestatement in accordance with a specific layout, andIncome statement classification of expensesclassification of required to present expenses basedon function (cost of sales, administrative).It Presentall changes in each caption of stockholders' equityin either a footnote related or separate statement.
b) Consolidations, joint venture accounting and equitymethod investees: - IFRS consolidated the effects ofsignificant events occurring between the reportingdates when different dates are used are adjusted
for in the financial statements. "Under IFRS, acompany will no longer have a free choice betweena one-line pick-up of their net share of a joint ventureentity or inclusion of its share of each asset, liability,revenue and expense individually ("proportionateconsolidation") . It requires that certain jointarrangements be equity accounted while for others,the investor's interest in the individual assets,liabilities, revenues and expenses will be recognized.Equity method investment is a technique that acompany uses to assess earnings from investmentsin other companies over which it exerts a significantinfluence (holdings of twenty to twenty-five percentof another companies stock. In US GAAPconsolidated financial statements different reportingdates of parent the effects of significant eventsoccurring between the reporting dates whendifferent dates are used are disclosed in the financialstatements. For joint ventures where a companydoes not have a majority or controlling interest, thefinancial statements are not consolidated and equityaccounting is applied. "Financial statement in equitymethod investees provides the option to accountfor equity-method investments at fair value . Forthose equity-method investments for whichmanagement does not elect to use the fair valueoption, the equity method of accounting is required.Uniform accounting policies between investor andinvestee are not required.
c) Impairment of long-lived assets, goodwill andintangible assets: - IFRS process is the One-stepapproach requires that impairment testing beperformed if impairment indicators exist. Goodwillis allocated to a cash generating unit (CGU) at whichthe goodwill is monitored for internal managementpurposes and cannot be larger than an operatingsegment. And in tangible assets is the amount bywhich the carrying value of the asset exceeds itsrecoverable amount.US GAAP requires Two-step approach recoverabilitytest be performed first (carrying amount of the assetis compared to the sum of future undiscounted cashflows generated through use and eventualdisposition). If it is determined that the asset is notrecoverable, impairment testing must be performed.Goodwill is allocated to a reporting unit, which is anoperating segment or one level below an operatingsegment. Intangible assets refereed as the amountby which the carrying value of the asset exceeds itsfair value.
d) Foreign currency Transaction: "Foreign exchangegains or losses an available-for-sale monetaryfinancial asset, the entity recognizes changes in thecarrying amount relating to changes in foreignexchange rates in profit or loss, and other changesin the carrying amount in other comprehensive

11
income .U.S. GAAP functional currency changes betweenfrom reporting currency to foreign currency andfrom foreign currency to reporting currency.Different specific requirements apply. In the contextof foreign exchange value all changes in fair valuerelating to financial instruments remeasured at fairvalue through other comprehensive income(available-for-sale) are recognized in othercomprehensive income.
CONCEPTUAL ISSUES WITH IFRSa) Concern of Early Implementation:-The arguments
some are trivial like that USA can decide to adoptIFRS after the year 2014, what is the hurry toimplement IFRS in India. Compliance with newaccounting standards will significantly change theaccounting practices in India and will align Indianaccounting practices with global accountingpractices. This will enhance the confidence ofinvestors in financial statements issued by Indiancompanies. There are many in the accountingprofession and in the corporate world who opposedthe early implementation of accounting standardsfully convergent with IFRS.
b) Cost Detriment: The direct costs of conversion toIFRS will be in the crores of rupees, and much of itwill go to auditors for new "services" like training,systems refiguring and whatever else companies canbe induced to pay for. So it will increase the increasein the cost of capital there is too many companiesare going to be spending far too much money ontheir internal controls over financial reporting andreceiving far too little benefit, and problem forsmaller companies are more to adopt IFRS.
c) IFRS is not "Principles-Based" than US GAAP :-thecore principle underlying IFRS is undocumented,amorphous and vacuous. The IASB's track record isanything but principles-based.
d) Alertness of International Financial ReportingPractices: Adoption of IFRS means a complete setof different reporting standards have to bring in. Theawareness of these reporting standards is still notthere among the stakeholders like Firms, Banks,Stock Exchanges, and Commodity Exchanges etc. Tobring a complete awareness of these standardsamong these parties is a difficult task.
e) Taxation: IFRS adoption will affect most of the itemsin the Financial Statements and consequently, thetax liabilities would also undergo a change. Currently,Indian Tax Laws do not recognize the AccountingStandards. A complete overhaul of Tax laws is themajor challenge faced by the Indian Law Makersimmediately. Enough changes are to be made in Taxlaws to ensure that tax authorities recognize IFRS-Compliant financial statements otherwise it willduplicate the administrative work for the Firms.
FINDINGS AND SUGGESTION:The transition to IFRS will imply a change in Differentindustries like management reporting and format ofdata required. In IT Industries systems will have to beupgraded in order to gather information on liquidityrisks in accordance with IFRS, and Financial Instruments.And R&D costs, your company will have to defineprocedures to enable the gathering and review of costsrelated to development that may be capitalized. ICAI,regulators, Government and business houses scrambleto decide, in what form, whether to converge or adopt,when it will apply. Business houses are well confusedto implement because Very few professionals in Indiahave any form of IFRS practical exposure and Fourelements of conversion cost (training, IFRS software,advisory cost and audit fees) creates the increase theexpenses. In India, Accounting Practices are governedmainly by Companies Act 1956 and Indian GAAP.Existing laws such as Securities Exchange Board of Indiaregulations, Indian Banking Laws & Regulations, ForeignExchange Management Act also provide someguidelines on preparation of Financial Statements inIndia. Indian Tax Laws makers have to provide majorlaws which recognize the Accounting Standards help totackle overhaul of Tax laws faced by the Indian Law.Changes have to be made in Tax laws to ensure that taxauthorities recognize IFRS-Compliant financialstatements. Since the demand for the accountingprofessionals is ever increasing, the need forprofessionals qualified with the new accountingstandards in the context of IFRS will also increase. HenceICAI have to equip more experts with the theoreticaland practical knowledge of the various InternationalFinancial Reporting Standards.
CONCLUSION:India being an important emerging economy in theworld and the world's capital markets stand to benefitsignificantly from widespread acceptance and use ofglobal accounting standards that are high quality,comprehensive and rigorously applied. A growingnumber of jurisdictions require public companies to useIFRS for stock-exchange listing purposes, and inaddition, banks, insurance companies and stockbrokerages may use them for their statutorily requiredreports. Converting to IFRS is therefore not a quick-fixprocess but should be regarded as a re-engineeringprocess. It is time-consuming, requires considerableefforts and also entails in heavier workloads both tothe accountants and external auditors. For this reasonsome developing countries have not been able to transitfrom the local standards to IFRS. They have preferredutilising their funds to address other priorities such aspoverty alleviation and health problems. But largeEuropean countries show the larger positive reaction,which is consistent with investor's expectation that IFRSadoption will result in greater informational benefitsfor firms.

12
Reference:1. Ball. Ray (2006), "International Financial Reporting Standards (IFRS): Pros and Cons for Investors" http://
papers.ssrn.com/sol3/papers.cfm? abstract_id=929561.
2. BUSINESS STANDARD (2010), Ashish K Bhattacharyya New Delhi "IFRS: transition date will be April 1,2011"http://www.businessstandard.com/india/news/ifrs-transition-date-will-be-april-1-2011/384940.
3. Holger Daske (2008), Mandatory IFRS Reporting Around the World: Early Evidence on the EconomicConsequences
4. Ramanna, Karthik and Sletten, Ewa (2009), "Why do Countries Adopt International Financial ReportingStandards?", Harvard Business School Accounting & Management Unit Working Paper No.PP 09-102.
5. Tanaji G. Rathod, The Chartered Accountant, January 2006, research Paper on "IFRSs: Emerging Opportuni-ties and Challenges for India", PP 988- 992.
6. IFRS Convergence, Challenges and Implementation Approaches for Banks in India", KPMG Report 2008.
7. P.K. 2007. Measuring de jure Harmonisation: A content analysis of accounting standards of three coun-tries: South Africa, Mauritius and Tanzania and IFRS. The Journal of Applied Accounting Research, India, 8,PP 110-138
8. Al-Akra, M., Hajangir, A. & Marashdeh, O. 2009. Development of accounting regulation in Jordan. TheInternational Journal of Accounting, 44, PP163-186.
9. KPMG., (2009) Implementing IFRS in the insurance industry, KPMG International.
10. Lex., (2006) "Problems with IFRS. Financial Times, 3 March.
11. Mukheerje.Kanchn,(2010), "IFRS Adoption:-cut -over challenges", The chartered ccountant,59(6)PP 68-75
12. Jones, C, Richard, 2010, 'IFRS Adoption: Some General Issues to Remember', CPA Journal(July 2010) PP36-38.
Web Sites:1. http://ifrs.icai.org/inner/generic/chairman_message.asp2. http://www.excellentguru.com/index.php?option=com_content&view=article&catid=35%Aaccounting-
and-finance&id=50%3Aifrs-conversion-in-india&Itemid=59&limitstart=23. http://www.articleseen.com/Article_the-great-indian-corporate-confusion-ifrs-in-india_59472.aspx4. www.pwc.com/en_IN/in/assets/pdfs/ifrs-us-gaap-indian-gaap.5. http://www.pwc.com/en_IN/in/assets/pdfs/ifrs-us-gaap-indian-gaap.pdf6. http://www.pwc.com/en_US/us/ifrs-tax-issues/assets/ifrs_conversion_r_and_d_tax_credit.pdf

13
An Introspection of IPOs
ABSTRACT
Owning stocks is a happiest thing and is a special featured high-risk category instrument, without adoubt, one of the greatest tools ever invented for building wealth. Such a proud ownership over stocksand hence ultimately a company can be attained either through the participation in primary market(read as Initial Public Offer) or secondary market. Over the last few decades, the average person'sinterest in the stock market has grown exponentially. It is buttressed by the recent statistics that retailinvestor's participation in IPOs is on increasing trend. This renewed vigorous participation and hope forincredible, windfall gains really forcing one to address the following unanswered questions. Is the opin-ion on IPO that 'they are rich on listing, lacklustre later holds' any value? Is IPOs always a good bet thansecondary market instruments? If so, how much of returns? Does it attract more traders or investors? Isit capable of beating the market returns? etc. The study revealed that market participants had a meanpositive return of 7.62% on listing, 10.30% on first-day, and 6% on first-year holding period. IPOs duringthe study period clocked a highest listing gain of 60%, 102.63% on first-day of listing and an impressive240.58% on one-year holding. On the other hand, these new entrants of stock market facilitated inves-tors to suffer a negative or zero return subjecting to a maximum yearly loss of -69.56% to erode theirinvested sum. Further the relationship between listing price and issue price, Total traded quantity onlisting day and listing gain were also explored. There were 17 IPOs out-performed the market and 34under-performed the market.
Key Words: IPO, Listing, Gain, Returns, Index, Out-performer, Under-performer.
INTRODUCTION TO THE STUDY :Owning stocks is a happiest thing and is a special
featured category instrument, without a doubt, one ofthe greatest tools ever invented for building wealth.Stocks are a part, if not the cornerstone, of nearly anyinvestment portfolio. Over the last few decades, theaverage person's interest in the stock market has grownexponentially. What was once a darling of rich(es) hasnow turned into the vehicle of choice of everybody formaking and amassing wealth. Increased demand withwider and renewed participation of retail investors forstocks coupled with advances in trading technology hasopened up the markets for nearly anybody to ownstocks.
Despite their popularity, however, most peopledon't fully understand stocks. Stocks can create massiveamounts of wealth, but they aren't without risks. OurIndian capital market has come a long way after thederegulation of the economy in 1992. Both thesecondary market and primary markets as avenues ofinvestments have gone through reforms pertaining tostructural and policy changes. Out of these reforms thenew pricing mechanism - the book building method -introduced by SEBI after the recommendations of Y HMalegam committee in 1995 was a baby step in granting
the assessing power to the market participant(s). Bookbuilding mechanism allowed corporates to raise moneyat a fairly price against historical pricing mechanism.Although this has emerged as the most practical andefficient way for the price discovery mechanism,mispricing still exists in the market.
In general people who are investing in Initial PublicOffers (IPO) just call their broker and request them tosend application. Yet another characteristic of ourIndian IPO is it have been oversubscribed a number oftimes. This kind of insatiable response to an IPO mootsseveral questions like, Is IPOs always a good bet thansecondary market instruments? If so, how much ofreturns? Does it attract more traders or investors? Is itcapable of beating the market returns? etc. Thereforethis attempt has been made to probe into the statisticsof IPOs made in Financial Year 2009-10 & Financial Year2010-11.
OBJECTIVES OF THE STUDY• To capture the IPO statistics of Industries/
Companies issued during FY 2009-10 and 2010-11.• To compute the returns generated by IPOs over
various periods of holding like listing, first-day, first-month, and One-year, listed in NSE platform during
*Mr. N. Chidambaram**Dr. P. Vikkraman
*Assistant Professor, SNS College of Engineering, Kurumbapalayam **Director I/C, School of Management Studies ,Anna Universityof Technology, Jothipuram, Coimbatore

14
FY 2009-10 & FY 2010-11.• To make a comparison of one-year holding period
returns Vis-à-vis S&P CNX NIFTY.• To test the correlation of returns based on various
period of holding and to categorize theirperformance.
HYPOTHESIS OF THE STUDY• H0: There is no significant relationship between the
Listing Price and Issue price of an IPO issue.• H0: There is no significant relationship between the
total traded quantity on listing day and listing gain/loss.
• H0: There is no significant relationship betweentotal traded quantity on completion of one yearfrom listing and One year holding period gain/loss.
DEFINITIONS:IPOAn IPO is an abbreviation for Initial Public Offer. Whena company goes public for the first time or issues a freshstock of shares, it offers it to the public directly. Thishappens in the primary market.
LISTINGListing means admission of securities of an issuer totrading privileges on a stock exchange through a formalagreement. The prime objective of admission todealings on the Exchange is to provide liquidity andmarketability to securities, as also to provide amechanism for effective management of trading.
METHODOLOGY"Nothing will improve unless it is measured"In view of the above adage and answering thosequestions in the introduction part of this study theresearcher collected secondary data from the websiteof NSE about IPOs handled by it during the FY 2009-10and FY 2010-11. This study is purely an analyticalresearch based on facts and figures already available.Statistical analysis was performed by using percentageanalysis, ranking, Correlation with the help of SPSSpackage. IPOs handled by NSE were considered. Scrip/Index returns were computed based on the closingdetails of appropriate day. In case of absence of thosedetails, next day's details were taken for analysis.
FINDINGS/RESULTS(Table 1) IPO ISSUANCE STATISTICS
IPO Issuance through NSE* Total Issuesin
Frequency Percent FY 2009-10 FY 2010-11
The Second Quarter of FY 2009-10 8 9.9The Third Quarter of FY 2009-10 7 8.6The Fourth Quarter of FY 2009-10 18 22.2 33The First Quarter of FY 2010-11 11 13.6The Second Quarter of FY 2010-11 9 11.1The Third Quarter of FY 2010-11 22 27.2The Fourth Quarter of FY 2010-11 6 7.4 48
Total 81 100.0

15
(Table 2) IPO ISSUANCE - INDUSTRYWISE* STATISTICSIPO Issuance During
Industry Second Third Fourth First Second Third FourthQuarter Quarter Quarter Quarter Quarter Quarter Quarter
of of of of of of ofFY FY FY FY FY FY FY
2009-10 2009-10 2009-10 2009-10 2010-11 2010-11 2010-11 TOTAL
Banks 0 0 1 0 0 1 0 2Brew/Distilleries 1 0 0 0 0 1 0 2Chemicals - Inorganic 0 0 0 0 1 0 0 1Chemicals - Speciality 0 0 0 0 0 0 1 1Computers - Hardware 0 1 0 0 0 0 0 1Computers - Software 1 1 1 2 0 1 1 7Construction 0 0 6 2 0 4 0 12Electrical Equipment 0 0 0 0 1 0 0 1Engineering 0 0 0 0 1 4 0 5Finance 0 0 0 0 1 1 1 3Food And Food Processing 0 0 1 0 0 0 0 1Gems Jewellery And Watches 0 0 1 2 0 0 1 4Hotels 1 0 0 0 0 0 0 1Leisure Facilities 0 0 0 1 0 0 0 1Media & Entertainment 0 1 1 0 0 1 0 3Metals 0 0 0 0 0 1 0 1Mining 0 0 0 0 0 2 0 2Miscellaneous 0 0 0 0 0 1 0 1Oil Exploration/Prod 1 0 0 0 0 0 0 1Packaging 0 0 1 0 0 0 0 1Personal Care 0 0 0 0 1 0 0 1Pesticides & Agrochem 0 1 0 0 0 0 0 1Pharmaceuticals 0 0 1 0 1 0 0 2Power 2 1 1 2 0 1 0 7Printing & Publishing 0 0 1 0 1 0 0 2Shipping 0 1 0 0 1 0 0 2Solvent Extraction 1 0 0 0 0 0 0 1Steel & Steel Products 0 0 1 0 1 3 0 5Telecommunication - Equipment 0 0 0 0 0 1 0 1Textile Products 0 0 0 2 0 0 2 4Textiles - Synthetic 1 0 0 0 0 0 0 1Travel And Transport 0 1 2 0 0 0 0 3Total 8 7 18 11 9 22 6 81
From the above table it is inferred that the Third Quarter of FY 2010-11 attracted 22 issues while the FourthQuarter of FY 2010-11 attracted 6 issues only. In Toto, FY 2009-10 and 2010-11 witnessed 33 issues and 48issues respectively.

16
TOP 10 IPOs BASED ON LISTING GAIN DURING THE FY 2010-11
FY 2010-11 offered a listing gain of 60.88% whereas FY 2009-10 offered only 40%.
* For the FY 2010-11, although 48 issues were issued out of which 18 issues alone has completed one year fromthe day of listing and therefore First year Gain/Loss computations were made only for those scrips.
Name of the IPO Listing Gain in % RankGravita India Limited 60.88 1Moil Limited 50.66 2Career Point Infosystems Limited 48.74 3Gujarat Pipavav Port Limited 21.95 4Punjab & Sind Bank 20.00 5Coal India Limited 18.77 6Eros International Media Limited 17.39 7Lovable Lingerie Limited 17.07 8Persistent Systems Limited 16.64 9Talwalkars Better Value Fitness Ltd 15.58 10
TOP 10 IPOs BASED ON LISTING GAIN DURING THE FY 2009-10
Name of the IPO Listing Gain in % RankARSS Infrastructure Projects Ltd 40.00 1Man Infraconstruction Limited 26.19 2Mahindra Holidays & Resorts India Ltd 23.33 3Syncom Healthcare Limited 19.86 4D.B. Corp Limited 19.81 5NHPC Limited 16.66 6United Bank Of India 13.48 7Jubilant Foodworks Limited 10.34 8Adani Power Limited 8.00 9JSW Energy Limited 6.00 10
FY: 2010-11 Total Scrips (N): 48 Listing Gain/Loss First Day Trading First Year (In %) Gain/Loss Gain/Loss
(In %) (In %)Mean 8.52 11.80 -26.73*Minimum Return -15.04 -52.60 -83.48*Maximum Return 60.88 102.63 72.19*
(Table 3) SCORE CARD OF IPOsDescriptive Statistics
N Minimum Maximum Mean Std. Deviation
Listing Gain/Loss (In %) 81 -15.04 60.88 7.78 12.551
First Day Trading Gain/Loss (In %) 81 -52.60 102.63 10.58 26.838
First Month Gain/Loss (In %) 81 -67.14 142.36 3.47 39.470
First Six Month Gain/Loss (In % ) 77 -77.54 218.14 5.21 61.134
First Year Gain/Loss (In %) 51 -91.66 240.59 -5.27 63.634
FY: 2009-10 Total Scrips (N): 33
Listing Gain/Loss First Day Trading First Year Gain/Loss(In %) Gain/Loss (In %) (In %)
Mean 6.72 8.81 6.43Minimum Return -5.45 -36.11 -91.66Maximum Return 40.00 63.88 240.59
17
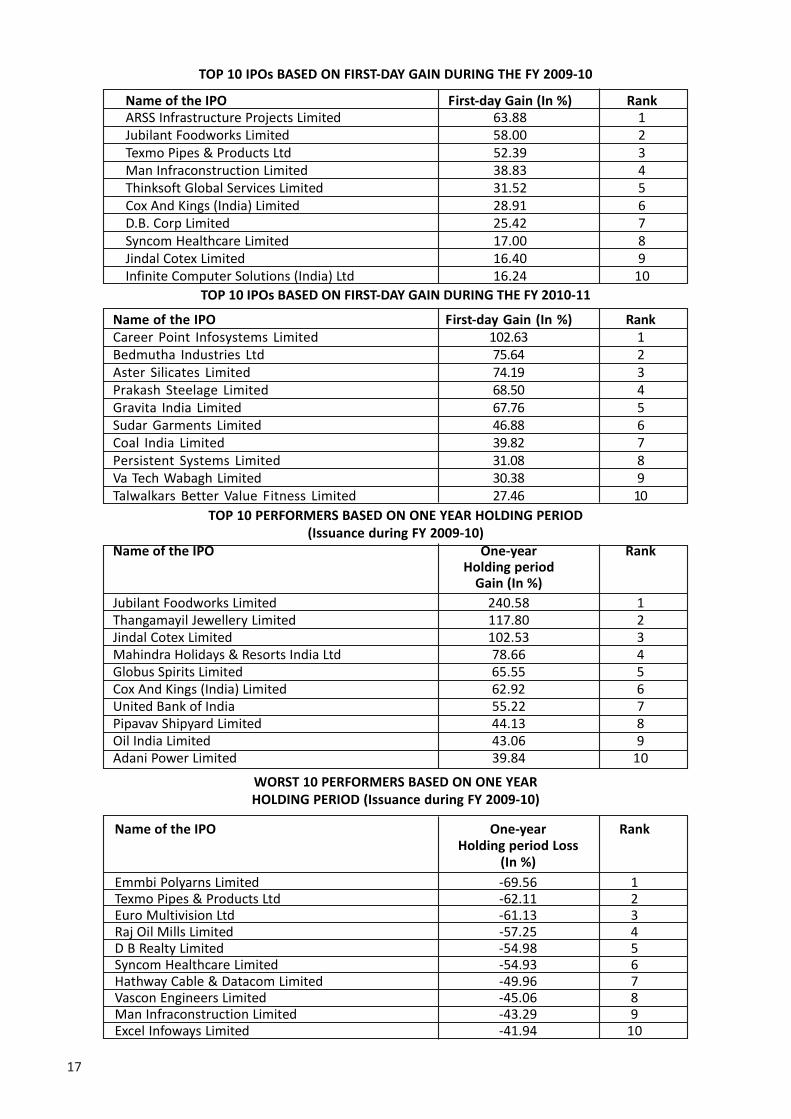
TOP 10 IPOs BASED ON FIRST-DAY GAIN DURING THE FY 2009-10
Name of the IPO First-day Gain (In %) RankARSS Infrastructure Projects Limited 63.88 1Jubilant Foodworks Limited 58.00 2Texmo Pipes & Products Ltd 52.39 3Man Infraconstruction Limited 38.83 4Thinksoft Global Services Limited 31.52 5Cox And Kings (India) Limited 28.91 6D.B. Corp Limited 25.42 7Syncom Healthcare Limited 17.00 8Jindal Cotex Limited 16.40 9Infinite Computer Solutions (India) Ltd 16.24 10
TOP 10 PERFORMERS BASED ON ONE YEAR HOLDING PERIOD(Issuance during FY 2009-10)
Name of the IPO One-year RankHolding period
Gain (In %)Jubilant Foodworks Limited 240.58 1Thangamayil Jewellery Limited 117.80 2Jindal Cotex Limited 102.53 3Mahindra Holidays & Resorts India Ltd 78.66 4Globus Spirits Limited 65.55 5Cox And Kings (India) Limited 62.92 6United Bank of India 55.22 7Pipavav Shipyard Limited 44.13 8Oil India Limited 43.06 9Adani Power Limited 39.84 10
WORST 10 PERFORMERS BASED ON ONE YEARHOLDING PERIOD (Issuance during FY 2009-10)
Name of the IPO One-year RankHolding period Loss
(In %)Emmbi Polyarns Limited -69.56 1Texmo Pipes & Products Ltd -62.11 2Euro Multivision Ltd -61.13 3Raj Oil Mills Limited -57.25 4D B Realty Limited -54.98 5Syncom Healthcare Limited -54.93 6Hathway Cable & Datacom Limited -49.96 7Vascon Engineers Limited -45.06 8Man Infraconstruction Limited -43.29 9Excel Infoways Limited -41.94 10
TOP 10 IPOs BASED ON FIRST-DAY GAIN DURING THE FY 2010-11
Name of the IPO First-day Gain (In %) RankCareer Point Infosystems Limited 102.63 1Bedmutha Industries Ltd 75.64 2Aster Silicates Limited 74.19 3Prakash Steelage Limited 68.50 4Gravita India Limited 67.76 5Sudar Garments Limited 46.88 6Coal India Limited 39.82 7Persistent Systems Limited 31.08 8Va Tech Wabagh Limited 30.38 9Talwalkars Better Value Fitness Limited 27.46 10

18
(TABLE 4) IPO RETURNS A COMPARATIVE CHART
Listing Gain/Loss (In %) IPO issuance duringFY 2009-10 FY 2010-11 Total
-16.00 to -11.01 0 1 1-11.00 to -6.01 0 3 3-6.00 to 0.00 5 8 130.01 to 6.00 19 16 356.01 to 12.00 2 6 812.01 to 17.00 2 6 817.01 - 22.00 2 5 722.01 to 27.00 2 0 237.01 to 42.00 1 0 147.01 to 52.00 0 2 257.01 to 62.00 0 1 1Total 33 48 81
Around 35 % of the total issuance gave a listing gain around 6.00%.
One year Holding Period Gain/Loss (In %) FY 2009-10 FY 2010-11 Total
-95.00 to -75.01 2 2 4
-75.00 to -55.01 4 2 6
-55.00 to -35.01 6 7 13
-35.00 to -15.01 2 3 5
-15.00 to 0.00 3 0 3
0.01 to 20.00 3 0 3
20.01 to 40.00 4 2 6
40.01 to 60.00 3 0 3
60.01 to 80.00 3 2 5
80.01 to 100.00 0 0 0
100.01 to 120.00 2 0 2
120.01 and above 1 0 1
Total 33 18 51
It is inferred from the above table that at least 60% of scrips either produced zero or negativereturns right from its offer, a year ago. It is really an alarming figure to note.
TOP PERFORMERS* BASED ON ONE YEAR HOLDING PERIOD(Issuance during FY 2010-11)
Name of the IPO One-yearHolding period Gain
and Loss (In %) Rank
Talwalkars Better Value Fitness Ltd 72.18 1Prakash Steelage Limited 68.50 2Mandhana Industries Limited 38.50 3Persistent Systems Limited 31.17 4SJVN Limited -18.07Hindustan Media Ventures Limited -19.72Pradip Overseas Limited -22.22Shree Ganesh Jewellery House Limited -36.86Parabolic Drugs Limited -45.19Technofab Engineering Limited -45.27
* 18 scrips that completed one year from listing date were considered.

19
(TABLE 5) TABLE COMPARING THE RETURNS FROM IPO WITH MARKET RETURNS
1 Mahindra Holidays & Resorts India 78.67 27.47 Outperformer2 Excel Infoways Limited -41.94 15.46 Underperformer3 Raj Oil Mills Limited -57.25 21.51 Underperformer4 Adani Power Limited 39.85 20.54 Outperformer5 Nhpc Limited -15.42 18.30 Underperformer6 Jindal Cotex Limited 102.53 19.34 Outperformer7 Globus Spirits Limited 65.55 19.91 Outperformer8 Oil India Limited 43.07 18.61 Outperformer9 Pipavav Shipyard Limited 44.14 24.08 Outperformer10 Euro Multivision Ltd -61.13 18.67 Underperformer11 Thinksoft Global Services Limited -8.84 22.35 Underperformer12 Indiabulls Power Limited -37.89 29.84 Underperformer13 Den Networks Limited 10.26 15.23 Underperformer14 Astec Lifesciences Limited -25.55 13.54 Underperformer15 Cox And Kings (India) Limited 62.92 15.44 Outperformer16 JSW Energy Limited 0.00 17.47 Underperformer17 Godrej Properties Limited 25.78 15.19 Outperformer18 D.B. Corp Limited 23.40 14.51 Outperformer19 MBL Infrastructures Limited 9.58 9.61 Underperformer20 Infinite Computer Solutions Ltd 7.33 12.06 Underperformer21 Jubilant Foodworks Limited 240.59 11.60 Outperformer22 Syncom Healthcare Limited -54.93 14.14 Underperformer23 Vascon Engineers Limited -45.06 14.14 Underperformer24 Thangamayil Jewellery Limited 117.80 13.91 Outperformer25 Aqua Logistics Ltd -91.66 11.65 Underperformer26 Emmbi Polyarns Limited -69.56 8.32 Underperformer27 D B Realty Limited -77.49 8.32 Underperformer28 Hathway Cable & Datacom Limited -49.96 9.13 Underperformer29 ARSS Infrastructure Projects Limited 35.08 8.81 Outperformer30 Texmo Pipes & Products Ltd -62.11 7.39 Underperformer31 Man Infraconstruction Limited -43.29 6.08 Underperformer32 United Bank Of India 55.23 2.44 Outperformer33 Il&Fs Transportation Networks Ltd -7.58 9.98 Underperformer
ISSUANCE DURING FY 2010-1134 Pradip Overseas Limited -22.23 10.09 Underperformer35 Persistent Systems Limited 31.18 9.80 Outperformer36 Shree Ganesh Jewellery House Ltd -36.87 7.91 Underperformer37 Intrasoft Technologies Limited -50.52 10.71 Underperformer38 Goenka Diamond & Jewels Limited -51.93 8.86 Underperformer39 Talwalkars Better Value Fitness Ltd 72.19 6.69 Outperformer40 Nitesh Estates Limited -48.70 7.06 Underperformer41 Tarapur Transformers Limited -71.80 7.00 Underperformer42 Mandhana Industries Limited 38.50 10.34 Outperformer43 SJVN Limited -18.08 10.89 Underperformer44 Jaypee Infratech Limited -49.46 9.24 Underperformer45 Parabolic Drugs Limited -45.20 7.16 Underperformer46 Technofab Engineering Limited -45.27 3.21 Underperformer47 Hindustan Media Ventures Limited -19.73 2.63 Underperformer48 Aster Silicates Limited -80.51 1.67 Underperformer49 SKS Microfinance Limited -67.75 -7.06 Underperformer50 Bajaj Corp Limited -83.48 -9.76 Underperformer51 Prakash Steelage Limited 68.50 -11.40 Outperformer
S. No
ISSUANCE DURING FY 2009-10
Name of the Issue
One-year HoldingGain/Loss
(In %)MarketReturn(In %)
One-year Holding PeriodReturns Vs
Market Returns
From the above table it can be understood that FY 2009-10 produced 13 Out-performers and 20Under-performers while FY 2010-11 had 04 Out-performers and 14 Under-performers.

20
**. Correlation is significant at the 0.01 level (2-tailed).
The above table infers a very strong positive correlation between listing price and issue price. Statistically, r (33)= 0.989, p = .000, thus it is proved to reject H
0. Therefore a strong positive linear relationship exists between
listing price and Issue price of IPOs.
(TABLE 9) TABLE DISPLAYING THE ASSOCIATION BETWEEN TOTAL TRADED QUANTITY ON COMPLETION OFFIRST YEAR AND FIRST YEAR GAIN/LOSS
CORRELATION FOR THE FY 2009-10
First Year Total TradedGain/Loss Quantity on
completion offirst year
First Year Gain/Loss Pearson Correlation 1 .052Sig. (2-tailed) .775N 33 33
The above table interprets that there is a very weaker correlation between total traded quantity on completion of first yearand the resultant first year gain/loss. Statistically, r (33) = 0.052, p = .775, thus it is proved to accept H
0. In other words,
volume of trading has no role to determine the ultimate gain/loss on completion of first year from listing.
(TABLE 8) TABLE DISPLAYING THE ASSOCIATION BETWEEN TOTAL TRADED QUANTITYON LISTING DAY AND LISTING GAIN/LOSS
CORRELATION FOR THE FY 2009-10
The above table interprets that there is a weaker correlation between total traded quantity on listing day andthe resultant listing gain/loss. Statistically, r (33) = 0.163, p = .364, thus it is proved to accept H0. Therefore aweaker relationship exists between total traded quantity on listing day and the resultant listing gain/loss. Inother words, volume of trading plays a negligible role in determining listing day gain/loss.
Listing Gain/Loss Total Traded
Quantity on
Listing Day
Listing Gain/Loss Pearson Correlation 1 .163
Sig. (2-tailed) .364
N 33 33
**. Correlation is significant at the 0.01 level (2-tailed).
Like the FY 2009-10, it is inferred that FY 2010-11 also displays a very strong positive correlation between listingprice and issue price. Statistically, r (48) = 0.992, p = .000, thus it is proved to reject H0. Therefore a strongpositive linear relationship exists between listing price and Issue price of IPOs.
(TABLE 7) CORRELATION BETWEEN LISTING PRICE ANDISSUE PRICE DURING THE FY 2010-11
Listing Price (Rs) Issue Price (Rs)
Listing Price (Rs) Pearson Correlation 1 .992**
Sig. (2-tailed) .000
N 48 48
(TABLE 6) CORRELATION BETWEEN LISTING PRICE AND ISSUE PRICE DURING THE FY 2009-10
Listing Price (Rs) Issue Price (Rs)
Listing Price (Rs) Pearson Correlation 1 .989**
Sig. (2-tailed) .000
N 33 33

21
(TABLE 10) TABLE DISPLAYING THE RELATIONSHIP BETWEEN TOTAL TRADED QUANTITY ON LISTING DAYAND LISTING GAIN/LOSS
CORRELATION FOR THE FY 2010-11
Listing Gain/Loss Total TradedQuantity onListing Day
Listing Gain/Loss Pearson Correlation 1 .095
Sig. (2-tailed) .520
N 48 48
The above table interprets that there is a weaker correlation between total traded quantity on listing day andthe resultant listing gain/loss. Statistically, r (48) = 0.095, p = .520, thus it is proved to accept H0. Therefore norelationship exists between total traded quantity on listing day and the resultant listing gain/loss.
LIMITATIONS OF THE STUDY• The arrived outcome of this work is heavily
dependent on the secondary data provided by NSE.• This study concentrated only on the IPO issues made
during the FY 2009-10 and FY 2010-11, and relevantinformation/data was processed based on availabilityand need.
• Follow-on Public issues made in the same durationare falling out of this study purview.
• Determination of gain/loss over various holdingperiod was made on the basis of capital appreciation,and dividend yield was not considered.
CONCLUSIONIt is a well-known fact that IPOs not only point toindustrial growth but also reflect the confidence levelsof investors in the market, trading system and on theoverall performance. There are many reasons whichaffect the return on an IPO like the fundamentals of thecompany, management of the company, pricing of theissue, State of the Market, FII investment, and manyother economic factors. Each of these factors differsfrom company to company and so does the returns.Many are jumping into this IPO foray just to make akilling on the day of listing. Thereafter market
participants are losing the steam and thereafter thosescrips journey downwards, heavily supported byvanishing interest. This fact is witnessed very well onthe trading volumes of those scrips now and earlier.Although in general market participants opines infavour of IPOs but it is without a valid proof. No doubtinvestment in IPO warrants careful thought and an in-depth, objective analysis.
REFERENCES1. S. Doshi, Rahul Agrawal, “A study on the Indian IPOmarket”, Portfolio Organizer, ICFAI University Press,December 2005, Vol-VI, Issue – XII, pp.23-27.2. Namrata Gada, “Primary market set to witness hugeinflows”, Business Line, 24 August 2006, p.15.3. Ritter, Jay R.(1991), “The Long Run Performance ofInitial Public Offerings”, Journal of Finance, 46: p.3-27.4. Wang Meijin, Zhang Song, “Study intoUnderperformance of China’s IPOs”, EconomicResearch” Issue 9: 2000, p.49-56.5. Reilly, F. and Hatfield, K, “Investor experience withnew stock issues”, Financial Analysts Journal, 1969,25(5), p. 73-80.
(TABLE 11) TABLE DISPLAYING THE ASSOCIATION BETWEEN TOTAL TRADED QUANTITY ON COMPLETIONOF FIRST YEAR AND FIRST YEAR GAIN/LOSS
CORRELATION FOR THE FY 2010-11
First Year Total TradedGain/Loss Quantity on close
of first year
First Year Gain/Loss Pearson Correlation 1 .496*
Sig. (2-tailed) .036
N 18@ 18
*. Correlation is significant at the 0.05 level (2-tailed).@ Scrips that completed one year listing duration.
The above table interprets that there is a moderate correlation between total traded quantity on completionof first year and the resultant first year gain/loss. Statistically, r (18) = 0.496, p = .036, thus it is proved toreject H
0. In other words, volume of trading plays a moderate role in determining gain/loss. Probably this
could be possible due to the consideration of only 18 scrips.

22
NPA Analysis of Public Sector Banks andPrivate Sector Banks (Sector wise)* Dr. M. Sukanya
** S. Sirisha
ABSTRACT: Several prudential and provisioning norms have been introduced, and these are pressurizing banks toimprove efficiency and trim down Non Performing Assets (NPAs) to improve the financial health in the bankingsystem. In the background of these developments, this study strives to examine the state of affair of the NPAsof the public sector banks and private sector banks in India. With this backdrop, the present treatise is anattempt to diagnose the sector wise NPAs of all domestic scheduled commercial banks. In light of this, Thepresent research paper study was carried out to examine the trends in non-performing assets of prioritysector and non priority sector of public sector and private sector banks and makes a comparison of publicsector banks and private sector banks and further attempts to study the performance of nationalized banks,SBI group, old Private sector banks and new private sector banks by using data from the past ten years (2001– 2010). The results indicate that the share of Non Priority Sector NPAs is more out of the total NPAs in caseof Private Sector Banks during the period of study. The paper concludes that the public sector banks are indominant position in terms of bring down their NPAs .Although there was a gradual decrease in the ratio ofnonperforming loans to total loans for both public and private sector banks from 2001 to 2008, there hasbeen a gradual increase from 2009 to 2010 and this increase is significantly higher for private sector banksover their public sector counterparts.
KEY WORDS : Non Performing Assets, public sector banks, Sector wise, Prudential Norms
INTRODUCTIONThe recovery performance of commercial banks is thesin qua non for their liquidity of funds. Loan recoveryis the main factor that determines the quality of loanassets of banks. Lower recovery indicates erosion ofbanks’ profitability and blocking of bank credit todevelopmental projects of the area. The mounting overdues lead to high level of non-performing assets (NPA)and thereby deteriorate the asset quality. Thus,improving the quality of loan assets is the true test ofimproved efficiency of banking system. The importanceof efficiency has assumed a critical significance for theviability of commercial banks in the liberalized eraparticularly in the backward regions of the country. Thesuccess of the commercial banks to maintain a healthyprofit growth not only depends on the hardening ofinterest rate, which owes its origin to reduction inoperational expenses, but also rests on improvementin their assets quality The NPA of banks is an importantcriterion to assess the financial health of banking sector.It reflects the asset quality, credit risk and efficiency inthe allocation of resources to productive sectors.
LITERATURE REVIEWThere have been many researches and studies onpriority sector lending by banks in India. A brief reviewof these studies is highlighted in the followingparagraphs to highlight the importance of the study
Ahmed (2005) in a diagnosis observed that commercialbanks together have gradually increased the quantumof advances to small industries but the proportion inwhich total bank credit in priority sector has expanded,the relative share of small sector has not grown in thesame ratio during the reform regime. The weakinfrastructure facilities may have prevented the greaterflow of credit. The industrial campaign, awarenessprogrammes and industrial training to the prospectiveentrepreneurs from the appropriate authority may bethe remedy in this respect. D. Naik (2003) opined thatRBI feels that the banks have been neglecting theirprimary function of credit creation in favour of “narrowbanking” for short-term gains. While this could beappropriate in times of easy liquidity, themacroeconomic performance of the banking systemin the long term would hinge on its ability to fundindustrial and other enterprises The present articlestudies NPA’s sector-wise and makes a comparisonbetween public sector banks, old private sector banks,new private sector banks and foreign sector banks.F inally the article attempts to understand therelationship between NPA’s and net-profit and totaladvances. Niranjana and Anbumani (2002) observedthat there is anxiety among the bankers that theadvances to priority sector resulted in a loss of interestincome due to highly subsidized lending rates. In thecontext of enormous demand for funds for priority
*Dr. M Sukanya is Associate Professor, Sree Nidhi Institute of Science and Technology, Ghatkesar, Hyderabad**S.Sirisha, Faculty, Warangal Institute of Management

23
sector,Shete, (2002) examined priority sector advancesby PSBs during the post reform years and found thatthe PSBs are not able to reach the prescribed target oflending to priority sector. Sooden and Kumar (2007)analyzed the priority sector lending in the post reformperiod and suggested for a balanced approach asdevelopment agent and sustainability of directedlendings keeping in view the quantum of NPA in prioritysector advances.From the above review of earlier studies it is revealedthat not many studies based exclusively on the NPAs ofpriority sector and non priority sector of banks. Mostof the studies relate to the lending aspects of the banksand they were lacking in depth as well as in coverageThe present study is suggested in this background andan attempt has been made for a detailed analysis ofsector wise NPAs.
RESEARCH METHODOLOGY :
Objectives of the study:To understand the NPA’s. Sector-wise and make acomparative study of NPA’s sector-wise of public sectorbanks, and private sector banks.
To study the share of nationalized banks NPAs and SBIgroup NPAs in the public sector NPAs sector wise.To identify the share of old private sector banks NPAsand new private sector banks NPAs in the private sectorbanks NPAs sector wise
Sources of dataThe study is analytical in nature, and it is based on dataavailable from the secondary published sourcesretrieved from Report on Trend and Progress of Bankingin India
Data Analysis:The data has been analyzed using percentage methodand CAGR (Compound Annual Growth Rate)
Scope of the Study:In order to have an in-depth idea of the issue, areasonably suited period of 10 years commencing from2000 -2001 to 2009-2010 has been considered for thestudy
Limitations of the Study:The study is limited to the analysis of sector wise NPA’sonly and of only public sector banks and private sectorbanks
ANALYSIS AND INTERPRETATION OF NPAS ON THE BASIS OF SECTOR WISE:
Table 1Sector wise comparative study between Public Sector Banks and Private Sector Banks
(Amount in Rs Crores)
Source: Report on Trend and Progress 2001-2010-Nil / negligibleBy seeing the above table we can analyse that public sector Banks is good than the Private Sector Banks in caseof NPAs regarding both Priority and Non Priority Sectors during the study Period.
2001 24156.24 1834.71 27307.01 4452.26
2002 25139.34 2546.35 30251.5 9089.77
2003 24938.36 2445.4 26781.41 9326.52
2004 23840.33 2481.93 25697.75 7795.81
2005 23397.38 2188.46 23848.61 6569.03
2006 22373.74 2284.03 18663.99 5541.37
2007 22953.62 2884.18 15157.99 6352.51
2008 25286.67 3418.53 14163.14 9557.52
2009 24,318 3640 19251.0 13172.0
2010 30848 4792 25929 12592
CAGR 2.48% 10.08% -0.52% 10.96%
Priority Sector NPAs Non Priority Sector NPAs
YearsPublic Sector
BanksPrivate Sector
BanksPublic Sector
BanksPrivate Sector
Banks

24
Table 2 Sector wise comparative study between Nationalised banks and State Bank Group
(Amount in Rs Crores)
Source: Report on Trend and Progress 2001-2010
The above table depicts that there is a marginal increase in priority sectors and a decrease in public sector NPAswhereas in the case of Non Priority Sector there is a decrease in nationalized banks and increase in state bankgroup.
Table 3Sector wise comparative study between Old Private Sector banks and New Private Sector Banks
(Amount in Rs Crores)
2001 16.277.89 8928.35 17,267.44 10,049.57
2002 16120.6 9018.75 20,145.74 10,105.41
2003 16885.52 8052.84 18,401.97 8,379.44
2004 16,704.78 7,135.55 17,894.78 7,802.97
2005 16,380.50 7,016.89 15,300.80 7,623.55
2006 15,123.92 7,249.83 12,845.35 5,818.64
2007 15,511.63 7,175.08 8,861.01 5,192.60
2008 16384.94 8901.73 7941.13 6222.01
2009 15871 8,447 10,001 9,250
2010 19,908 10,940 15283 10,646
CAGR 2.03% 2.05% -1.21% 0.58%
Priority Sector NPAs Non Priority Sector NPAs
Years NationalisedBanks
State BankGroup
NationalisedBanks
State BankGroup
2001 1691.48 243.23 3,096.97 1,356.29
2002 1909.06 637.29 2,933.01 6,156.762003 1761.9 683.5 2,865.75 6,460.772004 1,801.90 680.03 2,590.90 5,204.902005 1,781.90 406.56 2,443.84 4,125.192006 1,631.55 652.48 2,078.33 3,463.042007 1416.15 1468.03 1552.36 4800.152008 1338.49 2080.04 1218.66 8338.862009 1233 2407 1839 113342010 1,613 3,179 1,999 10,594CAGR -0.47% 29.31% -4.28% 22.82%
Priority Sector NPAs Non Priority Sector NPAs
Years Old PrivateSector Banks
New PrivateSector Banks
Old PrivateSector Banks
New PrivateSector Banks
Source: Report on Trend and Progress 2001-2010
Nil / negligibleFrom the above table it is witnessed that during the period of study the old private sector banks NPAs werereduced in case of both priority Sector and Non Priotiy sector, whereas in the case of New Private sector banksthe NPAs were increased in both the cases that is priority and non priority sector during the same period of thestudy.
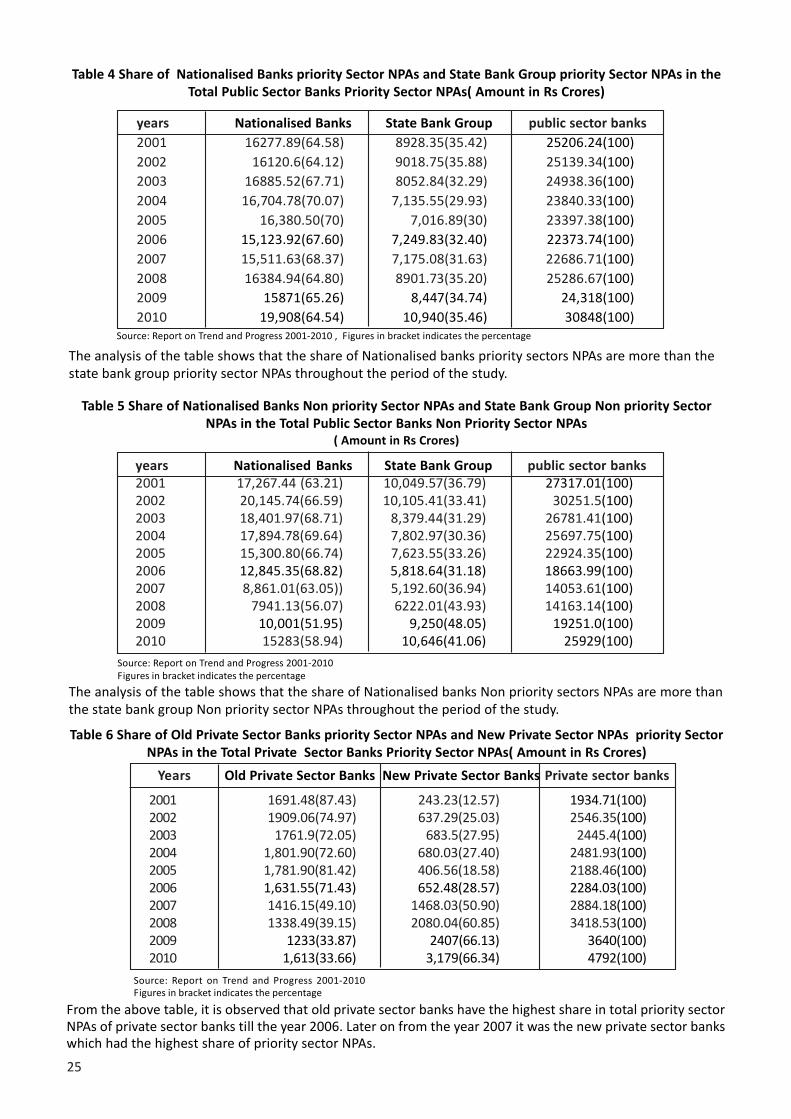
25
Table 4 Share of Nationalised Banks priority Sector NPAs and State Bank Group priority Sector NPAs in theTotal Public Sector Banks Priority Sector NPAs( Amount in Rs Crores)
The analysis of the table shows that the share of Nationalised banks priority sectors NPAs are more than thestate bank group priority sector NPAs throughout the period of the study.
years Nationalised Banks State Bank Group public sector banks2001 16277.89(64.58) 8928.35(35.42) 25206.24(100)2002 16120.6(64.12) 9018.75(35.88) 25139.34(100)2003 16885.52(67.71) 8052.84(32.29) 24938.36(100)2004 16,704.78(70.07) 7,135.55(29.93) 23840.33(100)2005 16,380.50(70) 7,016.89(30) 23397.38(100)2006 15,123.92(67.60) 7,249.83(32.40) 22373.74(100)2007 15,511.63(68.37) 7,175.08(31.63) 22686.71(100)2008 16384.94(64.80) 8901.73(35.20) 25286.67(100)2009 15871(65.26) 8,447(34.74) 24,318(100)2010 19,908(64.54) 10,940(35.46) 30848(100)
Source: Report on Trend and Progress 2001-2010 , Figures in bracket indicates the percentage
Table 5 Share of Nationalised Banks Non priority Sector NPAs and State Bank Group Non priority SectorNPAs in the Total Public Sector Banks Non Priority Sector NPAs
( Amount in Rs Crores)
The analysis of the table shows that the share of Nationalised banks Non priority sectors NPAs are more thanthe state bank group Non priority sector NPAs throughout the period of the study.
Table 6 Share of Old Private Sector Banks priority Sector NPAs and New Private Sector NPAs priority SectorNPAs in the Total Private Sector Banks Priority Sector NPAs( Amount in Rs Crores)
Source: Report on Trend and Progress 2001-2010Figures in bracket indicates the percentage
From the above table, it is observed that old private sector banks have the highest share in total priority sectorNPAs of private sector banks till the year 2006. Later on from the year 2007 it was the new private sector bankswhich had the highest share of priority sector NPAs.
years Nationalised Banks State Bank Group public sector banks2001 17,267.44 (63.21) 10,049.57(36.79) 27317.01(100)2002 20,145.74(66.59) 10,105.41(33.41) 30251.5(100)2003 18,401.97(68.71) 8,379.44(31.29) 26781.41(100)2004 17,894.78(69.64) 7,802.97(30.36) 25697.75(100)2005 15,300.80(66.74) 7,623.55(33.26) 22924.35(100)2006 12,845.35(68.82) 5,818.64(31.18) 18663.99(100)2007 8,861.01(63.05)) 5,192.60(36.94) 14053.61(100)2008 7941.13(56.07) 6222.01(43.93) 14163.14(100)2009 10,001(51.95) 9,250(48.05) 19251.0(100)2010 15283(58.94) 10,646(41.06) 25929(100)
Source: Report on Trend and Progress 2001-2010Figures in bracket indicates the percentage
2001 1691.48(87.43) 243.23(12.57) 1934.71(100)2002 1909.06(74.97) 637.29(25.03) 2546.35(100)2003 1761.9(72.05) 683.5(27.95) 2445.4(100)2004 1,801.90(72.60) 680.03(27.40) 2481.93(100)2005 1,781.90(81.42) 406.56(18.58) 2188.46(100)2006 1,631.55(71.43) 652.48(28.57) 2284.03(100)2007 1416.15(49.10) 1468.03(50.90) 2884.18(100)2008 1338.49(39.15) 2080.04(60.85) 3418.53(100)2009 1233(33.87) 2407(66.13) 3640(100)2010 1,613(33.66) 3,179(66.34) 4792(100)
Years Old Private Sector Banks New Private Sector Banks Private sector banks

26
Table 7 Share of Old Private Sector Banks Non Priority Sector NPAs and New Private Sector NPAs NonPriority Sector NPAs in the Total Private Sector Banks Non Priority
Sector NPAs ( Amount in Rs Crores)
It is observed from the above table that the only during the year 2000 -2001 the Old Private Sector Banks hadhighest share of Non priority Sector NPAs out of the total NPAs .during the rest of the period of the study i.e.,from 2001- 2002 to 2009 – 2010 the New Private banks had the highest share in the Non priority Sector NPAsout of the total private Sector Bank NPAs.
IMPLICATIONS OF THE STUDY
The study will be more beneficial for the bankers andpolicy makers to make some important decisions andto make policy measures to improve their performance.The study will be more helpful to the academicians andresearchers for further study in this respect.
FINDINGS AND RECOMMENDATIONS
• Between 2009 and 2010 Priority sector NPAs,which constituted little over half of the totalNPAs of domestic banks up to 2008 had showna steep decline in 2009 attributable primarilyto the Agricultural Debt Waiver and Debt ReliefScheme of 2008. Between 2009 and 2010,however, the share of priority sector NPAs ingeneral went up for domestic banks, partly areflection of the impact of the financial crisisand the economic slowdown that had set inthereafter.
• New private banks, however, had substantialaddition to their NPAs, reflecting the impact ofmerger
• The sharp rise in NPAs of non-priority sector wasreflective of the slowdown in the economy andstressed financial conditions of corporate
CONCLUSIONFrom the comparative analysis, it may be concludedthat banks have managed its NPAs proficiently. Thestudy observes that the prudential and provisioningnorms and other initiatives taken by the regulatorybodies has pressurized banks to improve theirperformance, and consequently resulted into trimdown of NPA as well as improvement in the financialhealth of the Indian banking system There was overalldecline in the NPA’s. The NPA’s for public sector loanswere least. The study finally concludes that banks wereperforming well in managing there NPA’s. The mainreasons could be attributed to prudential norms andRBI guidelines, securitizations and changes in law.
2001 3,096.97(69.54) 1,356.29(30.46) 4453.26(100)
2002 2,933.01(32.27) 6,156.76(67.73) 9089.77(100)
2003 2,865.75(30.73) 6,460.77(69.27) 9326.52(100)
2004 2,590.90(33.23) 5,204.90(66.77) 7795.81(100)
2005 2,443.84(37.20) 4,125.19(62.80) 6569.03(100)
2006 2,078.33(37.51) 3,463.04(62.49) 5541.37(100)
2007 1552.36(24.44) 4800.15(75.56) 6352.51(100)
2008 1218.66(12.75) 8338.86(87.25) 9557.52(100)
2009 1839(13.96) 11334(86.04) 13172.0(100)
2010 1,999(15.88) 10,594(84.12) 12592(100)
Years Old Private Sector Banks New Private Sector Banks Private sector banks
Source: Report on Trend and Progress 2001-2010Figures in bracket indicates the percentage

27
REFERENCES
Angadi, V.B. 1983. Bank’s Advances to Priority Sectors: An Enquiry in to the Causes of Concentration, Economic& Political Weekly, XVIII (13):503-510, March 26
Joshi, P,N. 1972. Financing of Priority Sectors by Commercial Banks, The Journal of Indian Institute of Bankers,XLIII(1):27-34
Niranjana. S, and Anbumani, V. 2002. Social Objectives and Priority Sector Lending, Banking and Financial SectorReforms in India, Deep and Deep Publications, PP- 231
Patel, S.G. 1996. Role of Commercial Banks’ Lending to Priority Sector in Gujarat - An Evaluation, Finance India,X(2): 389-393
Rajagopal, S. 1994. The Priority Sector, IBA Bulletin, XVI (1): 52-54, January,
RBI Internal Working Group 2005 Priority Sector Lending, Rural Planning and Credit Department Central Office,RBI, Mumbai, September
Shete, N.B 2002 Priority Sector Advances By Public Sector Banks during the Post Reform Period (1992-93 to2000-01). Working Paper, NIBM, Pune, March 2002
Sooden, M and Kumar, S. 2007. Priority Sector Lending in Post Reform Period, Finance India, December, XXI(4):1389-1404

28
ABSTRACTMicrofinance is emerging as a powerful instrument for poverty alleviation in the new economy. In India,
Microfinance scene is dominated by Self Help Group (SHGs)-Bank Linkage Programme as a cost effectivemechanism for providing financial services to the “Unreached Poor” which has been successful not only in meetingfinancial needs of the rural poor women but also strengthen collective self help capacities of the poor ,leading totheir empowerment. Rapid progress in SHG formation has now turned into an empowerment movement amongwomen across the country.
Economic empowerment results in women’s ability to influence or make decision, increased self confidence,better status and role in household etc. Micro finance is necessary to overcome exploitation, create confidencefor economic self reliance of the rural poor, particularly among rural women who are mostly invisible in thesocial structure.
This paper puts forward how Self Help Group has received extensive recognition as a strategy for economicempowerment of women. This paper seeks to examine the impact of Micro finance with respect to povertyalleviation and socioeconomic empowerment of rural women. An effort is also made to suggest the ways toincrease women empowerment.
INTRODUCTION
Women form a vital part of the Indian Economy,who constitute one third of the labour resource, andprimary member contributing in the survival of thefamily. It is true that women form the backbone ofagriculture sector, comprising the majority ofagricultural labourers in India. Gender divisions inagriculture are stark with all activities involving manuallabour assigned to women. While all operationsinvolving machinery and drought animals generallyperformed by men. Female agricultural labourers areamong the poorest sections of Indian society.Agricultural wages for women are on an average 30-50percent less than those for men. The greater isdependence on women’s income. Despite severalprogresses made since independence in the lives ofwomen, a gender analysis of most social and economicdata demonstrates that women in India continue to berelatively disadvantaged in matters of survival, health,nutrition, literacy and productivity.
India lives in her 6, 38,345 villages with 24 crore poorengaged in micro enterprises. As per the Governmentof India’s Ministry of Micro, Small and MediumEnterprises (MSES) Annual report 2008-2009, there are133.68 lakhs (in number) micro enterprises in India.Poverty in India is widespread with the nation estimatedto have a third of the world’s poor. The credit needsand other financial services are provided to the ruralmasses in general and to the poor in particular through
the rural financial markets comprising an unorganizedsector consisting of commission agents, moneylenders,landlords, etc., and an organized sector consisting ofpyramid type cooperative credit institution – broadlyclassified into urban credit cooperatives and rural creditcooperatives.
In order to enlarge the flow of credit to the hard-corepoor, NABARD launched a scheme of organizing themin self-help groups (SHGs) and linking the SHGs withbanks, in 1992. The scheme is broadly on the patterndevised by Bangladesh Grameen Bank. Under thescheme, poor, preferably the women are organized inSHGs and banks financing these SHGs for on lendingto poor are eligible for concessional refinance fromNABARD.
There are three distinct modes to route the credit tomicro enterprises. While under the first mode, bankslend directly to the SHGs for lending to microentrepreneurs. Under the second mode, banks provideloans to the NGOs for on lending to the SHGs andultimately to micro entrepreneurs. Under the thirdmode, banks extend credit to the SHGs with theNGO as facilitator.
Though the SHGs were started in 1997 in Tamil Nadu,the concept penetrated down only in recent years.Now there is a greater amount of socio-economicemancipation among the members of the SHGs. Hencethere is a need for evaluating the social and economicimpact of the SHGs on their members.
Impact of Women Self Help Groups inTrichy District, Tamil NaduP. Murali
*Assistant Professor, Department of MBA, Selvam College of Technology, Namakkal, Tamil Nadu, India

29
Among the various districts of Tamil Nadu, TrichyDistrict occupies a predominant position in the startingof SHGs. In Trichy district the urban centers have morerural bias and the economic activities are more agro-based. Hence the SHGs have been formed for meetingthe needs of industrial and agricultural activities. Ason November 2008, there were 3.78 lakhs SHGs inTamil Nadu with a membership of 60.63 lakhs.
The present study deals with the SHGs formed in Trichydistrict. The empirical findings of this study would pavethe way for taking certain policy decisions forstrengthening the SHGs and hence the study has beenundertaken in Trichy district. Trichy district has an areaof 4403.83 sq. kms as per 2001 census, it has a totalpopulation of 23, 88,831 of which male constitute49.99 % and female population accounts for 50.01 %.The urban population is 46.65 % and the remaining53.35 % is in rural areas.
STATEMENT OF THE PROBLEM
Poverty and unemployment are the twin problemsfaced by the developing countries. According to thePlanning Commission more than one third of India’stotal population i.e. 320 million live below the povertyline. In India, the financial institutions have not beenable to reach the poor households particularly womenin the unorganized sector. Structural rigidities andoverheads led to high cost in advancing small loans.
Experience in implementing different anti-poverty andother welfare programmes has shown that the key tosuccess lies in starting appropriate community-basedorganizations with participation at the grass-root level.Moreover, the group approach may be one of theeffective ways to reduce the difficulties of smallbusinessmen and agriculturists. Motivating individualfarmers, artisans and entrepreneurs to form smallgroups to pool their resources to handle selectedoperations may lead to a great success.
Peoples’ participation in credit delivery and recoveryand linking of formal credit institutions to borrowersthrough the SHGs have been recognized as asupplementary mechanism for providing credit supportto the rural poor. The SHGs are informal groupsformed on a voluntary basis, for providing thenecessary support to their members for their socialand economic emancipation. These groups are distinctfrom co-operative societies, mainly in terms of theirsize, homogeneity and functions. Non-GovernmentalOrganizations play an important role in preparing themembers by changing their attitude to participate in-group activities.
The NABARD is a pioneer in conceptualizing andimplementing the concept of the SHGs through thepilot project of linking SHGs with banks. In 1992 theproject was commenced throughout the country
through a set of well-defined guidelines with specialreference to the objectives, criteria for selection ofSHGs, size of group, assessment of credit needs, rateof interest, repayment period and security. Efforts werealso made by NABARD to popularize the project amongbankers and the NGOs by organizing a series ofworkshops and seminars at different levels. Theresponse from banks and the NGOs was encouragingand positive.
The distinguishing feature of the SHGs is creating socialand economic awareness among the members. Thesocial awareness enables the members to lead theirlife in a sound hygienic environment and pursue abetter living. The woman members involve themselvesmore in taking decisions regarding the education oftheir children, the investment of the family, managingthe economic assets of the family and bringing upcohesion among the members of the family and othersfor a better living.
On the economic point of view both men and womenwork shoulder to shoulder to increase the income ofthe family. Every member of the SHGs has felt theneed for more involvement in economic activities. Thespirit for social and economic upliftment of membersis the significant contribution of each and every SHG.There is a general tendency to consider the SHGs as apanacea for all the ills of the rural community. This isevident from mushroom growth of self help group inthe states and also in Trichy District. In Trichy District,in the year 1998, the number of SHGs formed was 945.But in the year 2008 it was 18,773. In many cases ithas been a blind replication of success models withoutconsidering the intricacies involved in group formationand sustainability. Hence the present study isundertaken to study the performance of SHG in Trichydistrict. Further an attempt is also made to evaluatethe social and economic benefits accruing to themembers of the SHGs.
OBJECTIVES OF THE STUDY
The objectives of the present study are as follows:To analyse the genesis and development of SHGs inTrichy District; To evaluate the performance of thesample SHGs in Trichy District selected for the study;To anlayse the changes in the social conditions of themembers of the self-help groups; To measure theimpact of the SHGs on the economic development ofthe members; To analyse the attitude of the membersof the SHGs towards economic impact, social impact,psychological impact and political impact; and Tooffer suggestions to improve the working of the SHGs.
SCOPE OF THE STUDY
The present study attempts to examine the socio-economic impact of the SHGs on the beneficiaries. It

30
examines how far the programme has helped in raisingthe incomes and levels of living of the rural poorwomen and in enabling them to cross the poverty line.The present study is from the standpoint of the SHGsand their members.
HYPOTHESES
The hypotheses framed are: there is no significantdifference in the performance of SHGs and tenure ofexistence, literacy level of the leader and size ofmembership of the groups; there is no significantdifference in the social and economic condition of themembers before joining SHGs and afterwards; andthere is no significant difference in the perceptionscores of t he different groups of members and socialfactors and the attitude of the members.
METHODOLOGY
The present study is based on both primary andsecondary data. The primary data were collectedthrough two interview schedule, one for SHGs andanother for SHG’s members. The secondary data werecollected from books, journals, websites and recordsof Mahalir Thittam Office, Trichy. The data werecollected from 180 self help groups and 540 membersthrough interview schedule. The collected data wereanalyzed by applying the statistical tools like Mc Nemartest, Sign test, chi-square test and Kolmogorov-Simirnov test.
FINDINGS
An attempt is made to analyse the performance ofSHGs in Trichy district and social and economic impacton members of SHGs.In order to measure the performance of SHGs in Trichydistrict, various factors such as homogeneity, regularityin conducting the meetings, regularity in attendance,role of NGOs in meetings, repayment performance,decision on financial transactions, utilization ofcommon fund, increased rate of savings, awareness ofrules and regulations, and maintenance of accountshave been taken into account. It is found that 63% ofSHGs conducted meeting once in a week. There wasmore NGO participation. The performance ofrepayment is better in all groups. 80% of the loan isutilized for productive purposes. The savingsperformances of SHGs are up to the mark. All themembers of SHGs availed training facilities providedby the Mahalir Thittam. The books of accounts areproperly maintained. Further it is found that there issignificant difference in performance scores amongthe different groups in conduct of meeting,regularity in attendance, participation of NGOs inmeeting, repayment performance, decision onfinancial transactions, utilisation of common fund and
training. But there is no significant difference in theperformance scores among the different groupsobtained indicators such as homogeneity, share ofproduction loan to total loan, increased rate savings,awareness of rules and regulations and maintenanceof books of accounts. It is also found that there is noinfluence of the tenure of existence of the SHGs onperformance. But the literacy level of leader and thesize of the membership of the SHGs influence theperformance of SHGs.To assess the social impact of the SHGs on its members,first the socio – economic factors of the members arestudied. Then social issues like self confidence,awareness of social evils, behavioral changes, changein education level, access to amenities and politicalparticipation also discussed. It is found that associationwith SHGs encompasses a large cross section of peoplewith self – confidence. Association with SHGs increasesthe helping tendency. The membership in SHGs gaveimportance to woman in family decision. It is alsofound thatthere is a significant shift in the level of communication,which might be due to association with the SHGs. SHGscreate awareness among members on the social evils.The study also shows that there is a positive impact ofSHGs on members in resisting social evils. It isinteresting to note that all the members of SHGs availall the social living amenities in the urban and ruralareas to the fullest level possible. It is inferred that96.1% of members have shown their interest incontesting elections after joining the SHGs.The economic impact of the SHGs on the membershave been analysed in terms of their level of savings,amount of borrowings, creation of assets, employmentgeneration, income generation, poverty level andexpenditure pattern. It is found that after joiningSHGs, the awareness level of savings increased. Thereis a paradigm shift from loans borrowed forconsumption purposes to productive purposes afterassociation with SHGs. It is found that the SHGprogrammes have positive effect on alleviation ofpoverty. The consumption expenditure of the membershas increased after becoming members of SHGs. TheComposite Index of standard of living shows that theimpact of micro credit encompassing economic as wellas social aspects was relatively more pronounced onthe social aspects than on the economic aspects.The perception of the sample respondents regardingthe economical impact, social impact, psychologicalimpact and political impact shaped by the SHGs hasbeen analysed with the help of a scaling technique. Itis found that the perception of the sample memberson social impact occupies first place followed bypsychological impact, economical impact and politicalimpact. It is also found that the four categories of impactare equally important. Chi- square test was used to

31
explore relationship between personal variables andthe perception of impact. It is found that the age,occupational pattern, marital status and communityinfluences the perception of members on the natureof the impact. On the other hand, the level of literacyhad no influence on perception of members of theimpact of the SHGs.
SUGGESTIONS
Based on the above findings, the following suggestionsare made.
• 144 (75.8%) sample SHGs are purely dependingupon the NGOs in financial decision makingprocess. In the inception period, the NGOs areforming and giving necessary training to SHGs. Aftersome period, they have to give the freedom tothink and work especially in decision makingprocess. The financial decisions are to be takenby all the members unanimously. Hence, it issuggested that the necessary skills with regard tofinancial decision making may be inculcated to themembers of SHGs. In this regard, a financial literacyand credit counseling centre may be opened inevery district with suitable financial experts, bankofficials etc. This credit counseling centre may givethe suitable training to all the members of SHGs inthe field of financial management.
• The study shows that 62.1% of SHGs are formedin rural panchayats, 18.11% in town panchayats,29.29% in municipal areas. As the SHGs are playinga crucial role in alleviation of poverty, steps maybe taken on war footing basis to form more numberof SHGs not only in rural but also in municipal andcorporation areas in Namakkal District. In thisregard, the state Government may consider givingpreference to uncovered areas for promoting theSHGs.
• Mahalir Thittam Office, Trichy has arranged morenumber of training for the members of SHGs tostart their own economic activities. The trainingwas given only on the conventional or traditionalbusiness activities. Apart from this, only half of therespondents have received training and orientationfor capacity building. These training programmeswere attended by some members only. Overall, thetraining programmes have no t been useful to theparticipants. It is suggested that training oninnovative economic activities by using theresources in and around the district may be givento the SHGs members. The training in the areassuch as vermicelli making, beautician training,training on bakery unit may also be given. For thispurpose, Entrepreneurship development cell in thedistrict, resource persons from small scale sectors,private ventures may also be properly used. And
chances should be given to all members by rotationto attend the training programmes. In this way theSHGs can able to know the innovative ideas forincome generating activities and all the memberscan develop their skill.
• Only 8 groups have recorded as poor repaymentperformance of loan in the district.
• It is suggested that incentives may be given forprompt repayment. This will catch the attention ofthe groups to repay the loan. Further, suitableadvice may also be given the members of SHGs forprompt repayment of loan.
• Among the sample only 35.78% (68) of SHGs areincreased their savings less than 20%. Hence, it issuggested that motivational campaign may beconducted for inculcating saving habit in the mindsof the members. The campaign should give theexposure of savings, its future benefits, how thesavings of members are utilized for rotation amongthe members, how the amount of groups’ savingsform a base for getting government sponsoredscheme for income generating activities and thebenefits to the individual member.
• It is found that among the sample 40 (21.05%)SHGs are faced the problem of delay in sanctioningthe loan. It is suggested that the bank should visitSHGs and grade them based on their quality. Thegrading system and format is already approved byNABARD. If needed, banks can outsource the taskof grading the SHGs to third party to expedite thesanctioning of loan. Further, the loan applicationsof SHGs should not be delayed beyond 15 days.Banks can fix a day for transactions of SHGs. Theformalities while opening the SHG accounts inbanks and while advancing loan to them shouldbe minimum and procedures should be simplified.There should be uniform format for accountopening and loan applications across banks. It is alsosuggested that necessary instructions may be givento the authorities and bank officials to avoid thedelay in sanctioning the loan and to respond thequarries of SHG members.
• It is observed that 17.89% (34) of SHGs were facedthe problem of administrating the affairs of itsbusiness. It is suggested that suitable administrativetraining to all the members of SHGs should be givenor at least the animators and representatives of thegroups may be given administrative traininginitially, then the same may be given to themembers gradually. Further, Extensionparticipation programme may be arranged withextension agencies for the SHGs to visit theirbusiness houses to know the functions and itsadministration. And also this extension
32
participation programme will create awareness andskills of the business.
• It is also observed that 22 sample (11.57%) SHGswere faced the problem of in adequate loanamount. Loan amount is one of the basiccomponents to start an activity and also womencan be financially sound when loan amount is givensufficiently. Loan amount should be increased tothe extent that they can take up an incomegenerating activity.
• Majority (92.45%) of the members said that theycould sign after joining the SHGs. Only 2.63% ofthe members are completed their XII standard.Education plays a crucial role in administering theaffairs of the business. Hence, it is suggested thatadult education system may also be adapted to themembers of SHGs to upgrade their educationalstatus.
• The development of a nation is vested on theshoulders of both men and women. Now a daysthe women self help groups are playing apredominant role in the eradication of povertyamong the rural poor. It is suggested that the SHGconcept for men is not adopted in the study area.If this has been implemented, the youth especiallyunemployed can be benefitted and they can alsoinvolve themselves in the process of povertyeradication.
CONCLUSIONThe new millennium has thrown many challengessubjecting many nations to undergo transformationcutting across their established tradition and culture.New issues have to be addressed to effect social andeconomical progress of our nation. The most importantone is women’s empowerment through Self-helpgroups. SHGs have undoubtedly begun to make asignificant contribution in poverty alleviation andempowerment of poor, especially women in rural areasof our country. Women are the vital infrastructure andtheir empowerment would hasten the pace of socialdevelopment. Investing in women’s capabilities andempowering them to achieve their choices andoppturnities is the definite way to contribute toeconomic growth and overall development. Theempowerment of rural women leads to benefit notonly to individual women and women groups, but alsoto the families and the community as a whole. Thepresent study is an attempt to analyses the socio-economic development of members and theperformance of SHGs in Trichy district. Theperformance of SHGs was good. The greaterpercentage of women were impacted positively bybeing members of SHGs. Women’s participation in
SHGs enabled them to discover inner strength, gainself confidence, social, economical, political andpsychological empowerment and capacity building. Ifthe aforesaid suggestions are carried out by theauthorities concerned, the SHGs will improve in TrichyDistrict.
REFERENCE:
1. Fisher, Thomas and M.S. Sriram ed., 2002, BeyondMicro-credit: Putting Development Back intoMicrofinance, New Delhi: Vistaar Publications;Oxford: Oxfam.
2. Harper, Malcolm, 2002, “Promotion of Self HelpGroups under the SHG Bank Linkage Program inIndia”, Paper presented at the Seminar on SHG-bankLinkage Programme at New Delhi, November 25-26, 2002.
3. Kabeer N (2001), “Conflicts Over Credit: Re-evaluation the Empowerment Potential of Loans toWomen in Rural Bangladesh”: World Development,Vol.29, No.1.
4. Mayoux, L. 1998a. Women’s Empowerment andMicro-finance programmes: Approaches, Evidenceand Ways Forward. The Open University WorkingPaper No 41.
5. Ackerley, B. (1995). Testing the Tools ofDevelopment: Credit Programmes, LoanInvolvement and Women’s Empowerment. WorldDevelopment, 26(3), 56-68.

33
ABSTRACT:You can pay workers to work, but you can’t pay them to love it. Rick Bayan, Rick’s Notebook: “Work” (August2000), at The Cynic’s Sanctuary website. Yes it is very true as Work is an unavoidable part of our day to day lifeand source of our bread and butter. If we take an average we daily expend around 12-13 hours in the work spotwhich is one third of our whole life. It has a great impact on overall quality of life. One of the main aspects whichaffect a good quality of work life is the Work Life balance of an employee. It is the opportunity for individuals tobalance their homes and work lives. It is also been said “Balance in your life between work and your personal lifeis very important. Without balance, you eventually burnout negatively affecting your performance at work.”Byron & Catherine Pulsifer, What Are the Benefits to Me, which means that if work life balance of an employeeis disturbed, it leads to disturbance in personal life and disturbance in personal life eventually affects the employeeperformance at work? Despite the fact that work-life conflict has significant business costs associated with lackof engagement, absenteeism, turnover rates, low productivity and creativity or poor retention levels, theimportance of Work life balance was overlooked by most of the organizations in the past. Now there have beena progressive increase in considerations in work life of an employee in the work spot but there is still a lot toimprove in work life environment This paper examines the various issues of employees’ work-life balance inselected private banks of Aurangabad region and suggest some measures to improve Work life Balance thatwill give new dimensions to the management in terms of improved quality and quantity of work which canretain not only the existing skilled man power but also attract juvenile and potential talent.
KEYWORDS: work life Balance, Stress & Flexibility.
Work Life-Balance In Selected Private BanksWith Reference To Aurangabad Region
INTRODUCTION:You can pay workers to work, but you can’t pay them
to love it. Rick Bayan, Rick’s Notebook: “Work” (August2000), at The Cynic’s Sanctuary website. Yes it is verytrue as Work is an unavoidable part of our day to daylife and source of our bread and butter. If we take anaverage we daily expend around 12-13 hours in thework spot which is one third of our whole life. It has agreat impact on overall quality of life. One of the mainaspects which affect a good quality of work life is theWork Life balance of an employee. It is the opportunityfor individuals to balance their homes and work lives.It is also been said “Balance in your life between workand your personal life is very important. Withoutbalance, you eventually burnout negatively affectingyour performance at work.” Byron & Catherine Pulsifer,What Are the Benefits to Me, which means that if worklife balance of an employee is disturbed, it leads todisturbance in personal life and disturbance in personallife eventually affects the employee performance atwork. Despite the fact that work-life conflict hassignificant business costs associated with lack ofengagement, absenteeism, turnover rates, lowproductivity and creativity or poor retention levels, theimportance of Work life balance was overlooked bymost of the organizations in the past. Now there havebeen a progressive increase in considerations in work
* ASST. PROF., DEPT. OF MANAGEMENT SCIENCE, DR. BABASAHEB AMBEDKAR MARATHWADA UNIVERSITY, AURANGABAD.431001
Sonali Ramesh Kshirsagar
life of an employee in the work spot but there is still alot to improve in work life environment. For futurecommercial sustainability, organizations need to ensurethey not just encourage but mandate a practical andworkable work/life balance policy, benefiting andmeeting the needs of both the organization and itsemployees. And importantly, organizations notproviding real opportunity for employee work Lifebalance are opening themselves up to increasingnumbers of dissatisfied and unproductive employeesand hence increased attrition rates. Merely creating awork life policy framework is not enough; fostering anorganizational culture that supports the use of availablePolicies are also of great importance.
2. OBJECTIVES:1.To understand the issues regarding the work life-
Balance in banking industries with reference toAurangabad region.
2.To suggest the measures to improve work life-Balancein banking industries.
3.SIGNIFICANCE/ SCOPE OF THE STUDY:Quality of work life encompasses varied aspects andhas broad scope. The research will be helpful inunderstanding the current position of the banks, whichin turn will be applicable to all the organizations

34
wherever the human resource is needed. The study ofQWL is having following importance in the BankingSector:1) A satisfied employee will give better output, makegood decision and positively contributes to theorganizational goals and objectives.2) It will give new dimensions to the management interms of improved quality and quantity of work.3) The study will be helpful to ensure a good qualityof work life which can retain not only the existingexperienced man power but also attract young andbudding talent.The areas identified that will be benefitted most outof this research are:
a) Service industries. E.g.: banking, finance,insurance, stock exchange etc.
b) Academia
4. LITERATURE REVIEW:
1.Concept of Work Life BalanceV S Rao on December 6, 2007; Life is like a game and
an individual has to play with work, family, health,friends and spirit. Work is like a rubber ball. If droppedit will bounce back but the other four aspects family,health, friends and spirit are made of glass. Assumingone of these are dropped they will be irrevocablyscuffed, marked, nicked, damaged, or even shattered.They will never be the same. One must understand thatand strive for balance in life.
Industries have realized the importance of the above.Organizations are setting up policies for maintaining awork life balance. They are going in for innovativemethods to keep their employees happy and satisfied,as it makes office a better place to work and alsopositively impact productivity. The concept of work-life balance (WLB) is not a new but with the changingpace of life and increase in stress levels, negativelyaffecting the quality of work, has made manyorganizations think about the strategies for maintaininga work life balance.
There is a strong link between work life balance policiesand reduced absenteeism, increased productivity andjob satisfaction. Other benefits include improvedrecruitment and retention rates with associated costsavings, a reduction stress, greater levels of jobsatisfaction and loyalty and an improved corporateimage.
Hudson; The case for Work life balance; 20:20 series.Work life balance is generally associated withequilibrium, or maintaining an overall sense ofharmony in life. The study of work life balance involvesthe examination of people’s ability to managesimultaneously the multi-faceted demands of life.
4.2 A Balance of Family, Life and Work
In recent years, the term ‘work/life balance’ hasreplaced what used to be known as ‘work/familybalance’. Although the concept of family has broadenedto encompass extended families, shared parenting,same-sex relationships and a wide range of social andsupport networks and communities, the semantic shiftfrom work/family to work/life arises from a recognitionthat care of dependent children is by no means theonly important non-work function. Other life activitiesthat need to be balanced with employment mayinclude study, sport and exercise, volunteer work,hobbies or care of the elderly. ‘Eldercare’ in particularis becoming a growing issue for employers.
4.3 Why Balance Has Become More DifficultThe 1990s saw an increase in the number of workingwomen, dual-earner and single-parent families,sandwich employees and employees who hadresponsibility for eldercare. During this decadeemployers downsized, right sized and restructured, jobinsecurity increased for many and time in work rose.At the same time, technological change blurred theboundary between work and family.
As noted below, each of these factors can be linked toincreased work-life conflict.
4.4 Stress and work-life balance
The number of stress-related disability claims byAmerican employees has doubled according to theEmployee Assistance Professionals Association inArlington, Virginia. Seventy-five to ninety percent ofphysician visits are related to stress and, according tothe American Institute of Stress, the cost to industryhas been estimated at $200 billion-$300 billion a year. Steven L. Sauter, chief of the Applied Psychology andErgonomics Branch of the National Institute forOccupational Safety and Health in Cincinnati, Ohio,states that recent studies show that “the workplacehas become the single greatest source of stress”.Michael Feuerstein, professor of clinical psychology atthe Uniformed Services University of the HealthSciences at Bethesda Naval Hospital states, “We’reseeing a greater increase in work-related neuro skeletaldisorders from a combination of stress and ergonomicstressors”.
It is clear that problems caused by stress havebecome a major concern to both employers andemployees. Symptoms of stress are manifested bothphysiologically and psychologically. Persistent stress canresult in cardiovascular disease, sexual healthproblems, a weaker immune system and frequentheadaches, stiff muscles, or backache. It can also resultin poor coping skills, irritability, jumpiness, insecurity,exhaustion, and difficulty concentrating. Stress mayalso perpetuate or lead to binge eating, smoking, andalcohol consumption.

35
4.5 What Can Be Done by the Employer to ReduceWork-Life Conflict?The employer can intervene to reduce all threedimensions of work-life conflict: perceived flexibility,ability to refuse overtime, and supportivemanagement.
4.5.1 Increase FlexibilityEmployees who have greater work time and worklocation flexibility (i.e., find it easier to vary when theywork, where they work, interrupt their work day andreturn, take holidays when they want, arrange theirwork schedule to meet personal and familycommitments) report lower levels of role overload,work to family and family to work interference, evenwhen hours of work are controlled for. In other words,employees with more flexibility can work longer hourswithout feeling overloaded and that work and non-work roles conflict with each other. Perceived flexibilityseems to have the greatest positive effect on work tofamily interference, perhaps by allowing employees tobetter co-ordinate their work and non-work lives.
4.5.2 Increase the Number of Supportive ManagersEmployees who work for a supportive manager – onewho is a good communicator, focuses on output ratherthan hours, demonstrates respect for employees andsupports their career development are better able tobalance work and family than those who work for anon-supportive manager Having a supportive managerhelps employees cope with all three aspects of work-life conflict.
4.5.3 Make It Possible for Employees to RefuseOvertimeEmployees who can refuse overtime are better able tobalance work and family demands. Whereas the abilityto refuse overtime is associated with reduced roleoverload, this form of control really affects the extentto which an employee experiences high roleinterference (either works to family or family to work).The data would suggest that allowing employees somecontrol over their overtime hours appears to be aparticularly effective way of reducing high roleinterference, perhaps because it makes it possible foremployees to schedule family time and deal withunexpected events. It should be noted that employeeswith supportive managers are significantly more likelyto feel that they can refuse overtime work than aretheir counterparts with non-supportive managers.
4.5.4 Make the Work Environment More SupportiveAn organization’s culture also appears to play a role inan employee’s ability to balance work and family.Employees who perceive that their organizationpromotes an environment that supports balance, haspolicies in place that are supportive of work-lifebalance, and encourages the use of supportive policiesreport lower role overload (RO) and lower work to
family and family to work interference than theircounterparts who work in organizations without thesevalues. While these aspects of the culture have positivebenefits on all three dimensions of work-life conflict,they have their most positive impacts in the area ofrole overload The organization’s culture around “facetime” and hours at work also has a large impact on allthree dimensions of work-life balance. Employees whobelieve that they will not advance if they cannot worklong hours, that family responsibilities make it difficultto advance, and that it is not acceptable to say no tomore work report higher levels of all three types ofwork-life conflict. Employees who work fororganizations whose culture focuses on hours notoutput (i.e., who believe they cannot say no, feeladvancement is linked to hours) are more likely toexperience more problems.
5. RESEARCH METHODOLOGY:5.1 Sample Design:The data is generated with the help of the selectedsamples from the study area which is consideredrepresentative of the whole universe.5.1.1 Universe: Private Banks in Aurangabad region
& its employees5.1.2 Sample unit: (Area) Aurangabad region.
Employees of selected private bank branches5.1.3 Sample size: 20 employees of total selected bank
branches5.1.4 Sampling procedure: Convenience Random
Sampling5.2 data collection:To complete this study the primary as well as secondary
source of information is used.5.2.1 Primary data:The primary data was collected from the employeesof selected private banks from the Aurangabad region.The method of data collection was survey method forwhich structured Questionnaire was prepared.Data collection Method: 1) Survey -StructuredInterviewsSurvey Method: Questionnaire
5.2.2 Secondary Data:Secondary data was collected from relevant nationaljournals, report, magazines & books from libraries,published & unpublished thesis and websites.
6.DATA ANALYSIS/ FINDINGS:The data was first classified and analyzed. The papermainly focuses on the issues regarding the work lifeBalance in banking industries with reference toAurangabad region. Firstly we discuss the current issuesof Work Life Balance faced by the bank employees inAurangabad region with the help of analyzed

36
questionnaire. The figures below shows the totalnumber of responses in y-axis and the x-axis shows theoptions selected by the respondents.1.I spend as much time as I’d like with my loved ones.
Strongly Agree Agree Disagree Strongly disagree
2 5 7 6
2. My job makes me feel tired to do things thatneed my attention at home.
Strongly agree Agree Disagree Stronglydisagree
4 10 4 21
3. In a working day I spend some time on theousehold activities & preserving my Hobbies.
Strongly agree Agree Disagree Stronglydisagree
3 4 10 3
4. My family is frequently upset with me about howmuch time I spend working.
Strongly agree Agree Disagree Stronglydisagree
6 9 5 6
5. My organization provides some work life balanceprograms.
Strongly agree Agree Disagree Stronglydisagree
2 5 7 6
7. CONCLUSION:You’ve achieved success in your field when you don’tknow whether what you’re doing is work or play(William Martin, p. 213, 2004). Yes very correctly saidthat when you love your work which you are doing andthere is no indisposition for you to do that work thenand then only you can achieve success. It is also verytrue that you cannot achieve success without thecooperation of the organization in which you work. Thestudy reveals that the work overload, non flexibility,unbalanced work life and unbalance family life aresome of the problems of human resources in thespecified region. Below are some of the suggestionsto overcome the problems of human resources:
1. Suggestions:1. Employees with more flexibility can work longer
hours without feeling overloaded and that work andnon-work roles conflict with each other.

37
2. Increase the Number of Supportive Managers helps employees cope with all three aspects of work-life conflict.3. Increase employee’s sense of control, and focus on creating a more supportive work environment4. Allowing the employees control over their overtime hours appears to be a effective way of reducing high role
interference, because it makes it possible for employees to schedule family time and deal with unexpectedevents.
2. REFERENCES:1. Rick Bayan, Rick’s Notebook : “Work” (August 2000), at The Cynic’s Sanctuary website
2. Warren Beatty, as quoted in The Best Liberal Quotes Ever : Why The Left Is Right (2004) by William Martin, p.213
3. K. Ashwathapa (1997), “Human Resource And Personnel Management” Tata Mcgraw- Hill publishing CompanyLimited, New Delhi- 110001.
4. P. Subbarao, (2009), “Personnel and Human Resource Management” Himalaya Publishing House, Mumbai-400004.
5. John M. Ivancevich (2003), “Human Resource and Personnel Management” Tata Mcgraw- Hill publishingCompany Limited, New Delhi- 110001.
6. C.R. Kothari (2009), “Research Methodology” Wishwa Prakashan Publication, Chennai.

38
Knowledge Management: Driving Force fororganizations in today’s competitive environment
* Prof. Pratibha Giri
* Prof. Reeva Verma
AbstractKnowledge Management attempts to manage the process of creation or identification, accumulation, andapplication of knowledge across an organisation. It is the introduction of some new tools, new methods, newprocesses and new strategies that enabled us to think, for the first time, very differently about knowledge, andhow to make some substantial improvements in the way we manage knowledge, as individuals, teams,organizations, and between organizations. It attempts to bring under one set of practices various strands ofthought and practice relating to the knowledge worker, knowledge economy, organisations becoming a learningorganisation. Various enabling technologies such as knowledge bases and expert systems, help desks, intranet,extranet etc. The ability of an organization to compete in the global village is defined by its ability to manage its knowledgeand knowledge workers. Knowledge management has become an important issue in all type of organizationsand industries. It is being said that only those organizations that are able to create a culture for knowledgemanagement will be able to survive and grow in near future.World has no boundaries today, and in this era of globalization changing technology requires adaptation at abreathtaking rate. Knowledge management is a new branch of management with its focus on the managementof change, uncertainty and complexity. With this tool, organisation can achieve developmental results, increaseorganizational flexibility, can create desire and motivation among workforce and can retain talent also which isthe major concern of today’s organisations.This paper highlights the issues about knowledge management which acts like a key force in a businessorganisation and explains how knowledge acts as a driving force for the success of organizations in today’scompetitive environment.
Key Words: Knowledge Management, Expert System, Globalization, Adaptation, Driving force, Competitive.
INTRODUCTIONKnowledge is a fluid mix of framed experiences,
values, contextual information, and expert insight thatprovides a framework for evaluating and incorporatingnew experiences and information. It originates and isapplied in the minds of knower. In organizations, it oftenbecomes embedded not only in documents orrepositories but also in organizational routines,processes, practices and norms. KnowledgeManagement (KM) refers to a range of practices usedby organisations to identify, create, represent, anddistribute knowledge for reuse, awareness and learningacross the organisation. Knowledge Managementprograms are typically tied to organisational objectivesand are intended to lead to the achievement of specificoutcomes such as shared intelligence, improvedperformance, competitive advantage, or higher levelsof innovation.It is an approach to managing thoughts, insights, ideas,lessons learnt, best and worst practices, experiencesmade available, etc. Managing this knowledge requiresthat knowledge is captured where it is created, shared
between people and applied in business processes. Ifthe culture allows and encourages it, and if technologysupports it, then learning will happen. Currently, 85%of organizations said their ability to strategicallymanage knowledge is weak, 80% said hiring,evaluation, and compensation practices do not takeknowledge into account, and 70% believe knowledgeassets can fuel growth - both revenue and corecompetencies. KM has become embedded in the policy,strategy, and implementation processes of worldwidecorporations, governments, and institutions. Doublingin size from 2001, the global KM market has beenprojected to reach US$8.8 billion during this year.Likewise, the market for KM business applicationcapabilities such as CRM (Malhotra, 2004a) is expectedto grow to $148 billion by the next year. KM is alsoexpected to help save $31 billion in annual re-inventioncosts at Fortune 500 companies. The broaderapplication context of KM, which includes learning,education, and training industries, offers similarlysanguine forecasts. Annual public K-12 education is
* Asst. Prof., Dept. of Management Studies, JSS Academy of Technical Education, Noida

39
estimated at $373 billion dollars in US alone, with highereducation accounting for $247 billion dollars. Inaddition, the annual corporate and government trainingexpenditures in the US alone are projected at over $70billion dollars.The key to change and growth is awareness, sharingideas and coming up with new and innovative ways ofstaying ahead of the competition.In the twenty first centuries and the knowledge society,the business landscape is changing rapidly. Survival andsuccess depends entirely on the Organisation’s abilityto adjust to the dynamics of the business environment.Changes in information technology have generatedgaps in access and control of information andknowledge.
What is Knowledge Management“Knowledge Management is the discipline of enablingindividuals, teams and entire organisations tocollectively and systematically create, share and applyknowledge, to better achieve their objectives”Ron Young, CEO/CKO Knowledge AssociatesInternational Knowledge Management is newlyemerging, interdisciplinary business model that focuseson knowledge within the frame work of an organisation.There are several definitions of knowledgemanagement. Awad (2003) has described KnowledgeManagement as a “systematic process for capturing andcommunicating knowledge people can use”. KnowledgeManagement acts something like a library in that it notonly provides a repository for written information on agiven subject but it also tries to make available to theorganisation as a whole the knowledge that is in peopleshead.Horwitch and Armacost (2002) KM is the creation,extraction, transformation and storage of the correctknowledge and information in order to design betterpolicy, modify action and deliver results.Several definitions and concepts of knowledgemanagement explain that knowledge management isa combination of people, technology and process asshown in the figure-1, (Awad, 2003). The overlappingpart in the figure contains several integral parts usingaccessible knowledge of outside source embedding andstoring it in business process, products and services,documenting and storing knowledge, promoting itsgrowth through organizational culture, transferring andsharing knowledge and assessing its value.knowledge and information have become the mediumin which business problems occur. As a result, managingknowledge represents the primary opportunity forachieving substantial savings, significant improvementsin human performance, and competitive advantage.
Dimensions of Knowledge ManagementPersonal Knowledge Management
A number of organizations have implemented a KMstrategy for personal knowledge management. This isa ‘bottom up’ approach and comes from the belief thatby improving the personal ability of employees tobetter identify, capture, store, share and apply theirpersonal knowledge this will inevitably result, as anautomatic outcome, in better knowledge managementat the team, organizational, and inter-organizationallevels.
The other driver for personal knowledge managementis the growing need, for many individuals andorganizations, to better tackle ‘information overload’and make more sense of our world, to develop morefocus, to become more proactive in task prioritizationand decision making, to better manage time andprojects. This also comes from the realisation that thiswill reduce stress, increase personal creativity andproductivity, and lead to greatly improved work-lifebalance. The strategies, methods and tools used for thisdimension are at the personal level, and includemethods and tools to personally capture, learn,interpret, envision, analyze, synthesize, communicate,create, share and apply.
Team Knowledge ManagementA number of organizations have implemented a KMstrategy for team knowledge management. This is anapproach that comes from the realisation that teamsare ‘the key knowledge work units’ or knowledgeengines of the organization.It has been recognized that a team that ‘collaborates’well transfers knowledge between members muchfaster, and, as importantly, is a powerful creator of newknowledge. Project team leaders can now produce newknowledge as a key deliverable, as well as, andalongside the traditional project deliverables.Team knowledge management, therefore, is based on‘Share’ or ‘Pull’ models of information and knowledgetransfer, as opposed to the overused ‘Send’ or ‘Push’models that create information overload. It is alsobased on team knowledge plans.As with personal knowledge management, teamknowledge management has been greatly acceleratedby mobile, wireless and web-based toolscommunication and collaboration tools.
Organizational Knowledge ManagementThis approach is primarily a ‘top down approach’. Itstarts by identifying the key knowledge assets, or criticalknowledge assets of the organization that are neededto achieve its objectives, and then sets out to developand leverage those assets as fast as possible.To do this, the organization sets up an organization-wide infrastructure to enable the identification,capturing, storing, sharing and applying of knowledge,retention and the re-use of knowledge assets.

40
Powerful organizational knowledge systems and toolsare used to support these organization-wide knowledgeactivities, including intranets, knowledge portals,taxonomies, collaborative work spaces, locators• Changes in strategic direction may result in the loss
of knowledge in a specific area.• Products and services are increasingly complex,
endowing them with a significant informationcomponent.
Objectives of Knowledge Management• The foremost aim of Knowledge Management is
empowering employees who are the internalcustomers of an organization. The employees areempowered by sharing knowledge, replicatingknowledge, getting recognized and getting rewarded.
• Standardized process with minimal variation.• Improving cost efficiency through storage of
required knowledge.• Innovative services using the past experience and
the content. Replication allows people to spend timeon ‘real innovations’.
Model of Knowledge ManagementThe communication model by Maurer Tochtermann inFigure 2 clearly illustrates in which way KM goesbeyond (distributed) information systems anddatabases. F igure 2 shows a group of peopleexchanging knowledge with one another, whereby alarge portion of this knowledge is exchanged over anetworked computer system (this being asynchronous,i.e. time-delayed, as well). Each of the arrows 1 through7 has the following particular meaning attached to it:Arrow 1 shows that people exchange knowledgedirectly with one another, e.g. during coffee breaks,on business trips, over the telephone, etc. It is this typeof exchange that the organizational side of knowledgemanagement is mainly concerned with and will not behandled further in this paper .Arrows 2 through 4symbolize the different ways that information is putinto the KM system, while arrows 5 and 6 indicate thatthere are at least two ways for knowledge to bedelivered from the KM system to the users. Moreprecisely, arrow 2 symbolizes the explicit input ofinformation in the system and arrow 3 symbolizes theimplicit input. It should be noted that the gathering ofthis information and knowledge occurs as a by-productof other activities that are carried out, i.e. newknowledge is created within the KM system withoutadditional work being required. Arrow 4 signifies thata KM system is also able to “systematically” generateinformation by observing users. Arrow 5 symbolizes thetraditional querying of information in an informationsystem or database. Users enter explicit queries andreceive the corresponding answers from the KMsystem, which can be anything from fragments of
information to large coherent documents, such asmanuals, books or teaching modules. Perhaps even“more interesting” is arrow 6, which symbolizes that aKM system can act on its own to deliver knowledge tothe user, even without an explicit request. Finally, arrow7 symbolizes that a KM system is able to generate newknowledge out of existing knowledge.Figure 2 illustrates quite clearly the differencesbetween classical information systems (databases) andKM systems. Taking away the arrows 3, 4, 6 and 7 away,then what is left is the exact model of a classicalinformation system. Thus, the question of whether KMsystems are really different from classical informationImportant Aspect of Knowledge Management .Fig.2systems depends on whether the behavior symbolizedby arrows 3, 4, 6 and 7 is actually feasible. The answerto this question will be answered affirmatively in thefollowing sections.KM for Organizations, depicted inFigure 2, can also stand for KM for Archives, if arrows 1and 3 are ignored. This confirms the previous statementthat attention can be focused on KM for Organizationssince KM for Archives is included within it by definition.
Knowledge management approachesThe term “knowledge management” is now in awidespread use and there are, of course, many waysto categorize the multi-disciplinary knowledgemanagement. In a posting to the KnowledgeManagement Forum, Karl-Erik Sveiby identified two“tracks” of knowledge management:Management of Information: To researchers in thistrack, according to Sveiby, “… knowledge = Objects thatcan be identified and handled in information systems.”Management of People: For researchers andpractitioners in this field, knowledge consists of “…processes, a complex set of dynamic skills, know-how,etc., that is constantly changing.”Sveiby’s characterization is on target, but it may notcapture the important distinctions in approaches toorganizational knowledge management.At Knowledge Praxis, we have adopted a three-partcategorization: (1) mechanistic approaches, (2) cultural/behaviouristic approaches, and (3) systematicapproaches to knowledge management.
Mechanistic approaches to knowledge management1. It is characterized by the application of technologyand resources to sheer volume of information will makeit work. The main assumptions of the mechanisticapproach include:2. Better accessibility to information is a key, includingenhanced methods of access and reuse of documents(hypertext linking, databases, full-text search, etc.)3. Networking technology in general (especiallyintranets), and groupware in particular, will be keysolutions.

41
Cultural/behaviouristic approaches to knowledgemanagementWith the substantial roots in process re-engineeringand change management, it tends to view the“knowledge problem” as a management issue.Technology — though ultimately essential for managingexplicit (recorded) knowledge resources — is not thesolution. These approaches focus more on innovationand creativity i.e. “learning organization” than onleveraging existing explicit resources.
Assumptions of
cultural/behaviouristic approaches include:
1. Organizational behaviours and culture need to bechanged… dramatically else our information-intensive environments, organizations becomedysfunctional relative to business objectives.
2. Organizational behavior and culture can be changed,but traditional technology and methods ofattempting to solve the “knowledge problem” havereached their limits of effectiveness. A “holistic” viewis required.
3. It is the process that matters, not the technology.
4. Nothing happens or changes unless a managermakes it happen.
• Systematic approaches to knowledge managementThese approaches to knowledge management retainthe traditional faith in rational analysis of theknowledge problem i.e. the problem can be solved, butnew thoughts and ideas of many kind are required.Systematic approaches show the most promising andpositive cumulative impact, measurability, andsustainability.
• Knowledge Management as a Growth Driver in anOrganisationKnowledge management provides the process andstructure to create, capture, analyze and act oninformation. It highlights the conducts to knowledge,as well as the bottlenecks. Now the knowledge is takingthe place of capital (intellectual capital) as the drivingforce in organisation world wide. Knowledgemanagement not only answers the critical question ofsurvival of organisations but also induces growth byproviding a cutting edge over others. Whether tominimize loss and risk improve organisational efficiencyor embrace innovation, knowledge managementefforts and initiatives add great value to anorganisation.
Foster Innovation: Knowledge management inducesinnovation by encouraging free flow of ideas. By sharingknowledge an organisation creates exponentialbenefits from the knowledge as people learn from it.Knowledge management processes induces greaterencouragement for learning and sharing of knowledge
to build skills sets in the most valuable assets oforganisation i.e. employees , which leads to growth ofover all organisation.
Improved customer service & efficiency: Knowledgemanagement helps in improving customer services bystreamlining the response time. Adopting knowledgemanagement leads to improved ways of customerservice which enhances the organisations image in thecompetitive. Employees are able to access compiledsubject customer reference and resource files availableeither directly through the system or from CD- ROMsavailable to all offices. Employees are enabled forresponding quickly to customer in this manner.
Boosts Revenue: Knowledge Management improvesthe revenue by getting the products and services fasterin the market. Today technology has enabled companiesto reengineer the ways to do business.
Building Sensitivity to Brain-Drain (retention): Howdoes the firm replace expertise when it retires, resignsor simply leaves? More and more companies realizethe importance of managing and pressuring expertiseturnover. Knowledge management tries to enhanceemployee retention rates by recognizing the value ofemployee’s knowledge and rewarding them for it’.Knowledge management creates the environment thatwill motivate existing personnel and appeal to potentialrecruits. It supports higher levels of understanding thattacit knowledge and the implicit skills are key resources.Smart managers strive to ensure the right matchbetween various vocational needs (achievement, abilityutilization, recognition etc.) of their knowledge workersand the requirements of their jobs for workersatisfaction and retention in the organisation.
Reduction of Cost: Knowledge management reducesthe cost by eliminating redundant and unnecessaryprocesses for higher productivity. Knowledgemanagement adoption leads to improved ways ofsupporting people through the provision of appropriateprocesses and information.
Knowledge Management used as Key Driver forSuccess: Some ExamplesMost of the giant players like to Infosys, HCL, Wipro,Philips used to give a lot of value their intellectual assetor knowledge workers. There are some examples asfollows:• Hewlett-Packard- by sharing expertise already in the
company, but not known to their developmentteams, now bring new products to market muchfaster than before.
• Texas Instruments – by sharing best practicebetween its semiconductor fabrication plants savedthe equivalent of investing in a new plant.
• Dow Chemical – by focusing on the activemanagement of its patent portfolio have generated

42
over $125 million in revenues from licensing andother ways of exploiting their intangible assets.
• Skandia Assurance – by developing new measuresof intellectual capital and aiming their managers onincreasing its value have grown revenues much fasterthan their industry average.
• BP – by introducing virtual teamwork usingvideoconferencing have speeded up the solution ofcritical operation problems.
• Hoffman La Roche – through its right first timeprogramme has reduced the cost and time to achieveregulatory approvals for new drugs.
• HLL - by adopting measures like buildingcommunities of practice (CoP), IT interventions,culture change initiatives ,a system of reward andrecognition for collaborative team effort, trainingand performance development practices.
Success mantras for an effective KnowledgeManagement CompanyThe basic but open secrets termed as the mantras forthe company to become an effective knowledgemanagement company are namely,1) Culture 2 )Knowledge Management Organization 3 ) Strategy,System & Infrastructure , 4 ) Effective &Systematicprocesses 5 ) MeasuresBased on the above factors ,the following facts couldbe added for the future requirements to ensure KMinitiatives to succeed:• High priority given to the initiative at the very top of
the hierarchy;• Well developed and co-ordinated communications
plan for the initiative;• Strong involvement of staff in the reform;• Establishment of incentives to share knowledge;• Allocation of sufficient financial resources;The success of the initiative is ultimately determinedby sufficient combination of the above mention factorsand their incorporation within the line of Organization.
Implementation Measures for Facilitating KnowledgeManagement• Instead of the traditional emphasis on controlling
the people and their behaviors by setting up pre-defined goals and procedures, they would need toview the organization as a human communitycapable of providing diverse meanings toinformation outputs generated by the technologicalsystems.
• De-emphasize the adherence to the company viewof ‘how things are done here’ and ‘best practices’so that such ways and practices are continuouslyassessed from multiple perspectives for theiralignment with the dynamically changing externalenvironment.
• Invest in multiple and diverse interpretations toenable constructive conflict mode of inquiry and,thus, lessen oversimplification of issues orpremature decision closure.
• Encourage greater proactive involvement of humanimagination and creativity to facilitate greaterinternal diversity to match the variety andcomplexity of the wicked environment.
• Give more explicit recognition to tacit knowledgeand related human aspects, such as ideals, values,or emotions, for developing a richerconceptualization of knowledge management
• Implement new, flexible technologies and systemsthat support and enable communities of practice,informal and semi-informal networks of internalemployees and external individuals based on sharedconcerns and interests.
• Make the organizational information baseaccessible to organization members who are closerto the action while simultaneously ensuring thatthey have the skills and authority to execute decisiveresponses to changing conditions.
Roadblocks to adoption of Knowledge ManagementThere are many barriers on the individual,organizational levels some of the barriers related toorganizational aspects are observed as follows :• Top Management Involvement : In a dynamic,
turbulent and uncertain environment, members ofthe top management in an organization get busymanaging and exploiting marketing opportunitiesin the global village. When top management doesnot invest enough time in educating organizationalmembers, they can not institutionalize values andnorms and create organizational culture. In theabsence of any culture building initiatives from thetop management, knowledge workers also becomemarket focused and try to maximize their payoffsfor the knowledge they have.
• Cross-functional Ownership: A good KM systemshould help an organization deliver what its marketsand its customers require. Hence it should havestrong linkages with organizational strategies. TheHR department should be actively associated withits design and management. Information andnetwork technology should be effectively utilizedfor knowledge sharing and knowledge generation.Thus different functional specialists should beinvolved in designing and managing the KM system.However, organizations are usually pressed for timeand do not create process to institutionalize cross-functional ownership for the KM system. In theabsence of multi-functional involvement andownership, KM systems do not deliver what isexpected of them.

43
• Obstructive Organizational Structure: Inhierarchical organizations, information flow fromlower to higher levels is hindered. Hierarchies limitthe contributions of people at lower levels inknowledge sharing. Interestingly, even in flatterorganizations, knowledge sharing did not occureasily. It has been observed that knowledge workerswere reluctant to learn from and share theirknowledge with their colleagues.
• Lack of Pull for KM System: An organization mayinitiate a KM system without defining what is usefulor essential knowledge for its employees. Havingcreated a KM system, and under pressure to showresults, the concerned authority may depositwhatever knowledge is easily available rather thanensuring that only relevant knowledge isincorporated in the KM system. Whenorganizational members find that the knowledge inthe system is not relevant, they lose the motivationto use it again.
• Dysfunctional Reward System : Organizations areincreasingly using big discretionary rewards tomotivate their employees for excellentperformance. This makes every person in theorganization mindful of the decisive performancecriteria, which again leads to organizations usingperformance criteria that are tangible, visible,involving short duration and which appear to beobjective. Some of the KM processes being long-drawn, subjective and not easily measurable, suchperformance criteria and reward systems becomedysfunctional for knowledge generation andknowledge sharing. Similar findings were reportedby other studies on knowledge transfer. Ernst andYoung found that culture was the biggest barrier toknowledge transfer (54%). The other major factorsthat were perceived to be barriers to knowledgetransfer were top management failure to signalimportance (32%), lack of shared understanding ofstrategy of business model (30%),organizationalstructure (28%), and lack of ownership of theproblem (28%).
• ConclusionThe value of knowledge is derived from the value ofthe decisions with which it is associated. Themeasurement of knowledge management success istherefore related to improved decision making and theachievement of objectives. Some measures may beobjective; others may be more subjective such asattitude surveys among stakeholders.The biggest challenge is to change the mindset of the
people regarding the importance of knowledge sharingcompared to just retaining it. It is challenging really toconvert the culture from believing that knowledge ispower to believing that knowledge sharing is power.This dramatic contrast change is not at all easy toestablish and therefore would require a constanttraining and development of human resources of theorganisation in all spheres. Knowledge Management is helping all managers toestablish knowledge resource management as part oftheir toolkit. So implementation of knowledgemanagement in the organisation will lead to betterappreciation and expression of the skills required andavailable, improved ways of supporting people throughthe provision of appropriate processes and information,greater encouragement for learning and sharing ofknowledge to build skill sets, higher levels ofunderstanding that tacit knowledge and the implicitskills are key management resources, creating theenvironment that will motivate existing personnel andappeal to potential recruits. We are in a knowledgerevolution. Knowledge has replaced other sources ofproduction as the main source of wealth creation. Thetraditional sources of competitive advantage are fadingaway and are being copied easily, knowledgemanagement has emerged as the source of sustainablecompetitive advantage. Francis Bacon has said that“Knowledge is power, But mere knowledge is notpower; it is only possibility. Action is power; and itshighest manifestation is when it is directed byknowledge.”
References• Prahalad, C. K. and Hamel, G. The core competence
of the corporation. Harvard Business Review, 68,1990, 79-91
• Barney, J. Firm resources and sustained competitiveadvantage. Journal of Management, 17 (1) 1991, 99-120
• Bureau (2000), The Hindu Opportunities, A Guide ToBetter Positions And Better Performance, “What isKnowledge Management”, February 02.
• Tochtermann, K., Maurer,H.: Umweltinformatik undWissensmanagement Tagungsband des 14.Internationalen GI-Symposiums Informatik fr denUmweltschutz, Bonn, Metropolis Verlag (2000) 462-475
• Pradhan, Nihar (2001), The Hindu Opportunities, AGuide To Better Positions And Better Performance,“Careers in Knowledge Management”, November 07.
• Jayakar, Archana (2001), The Hindu Opportunities, AGuide To Better Positions And Better Performance,“Content(ed) Opportunities”, January 10th.
• Callaghan, J. (2002), Inside Intranets & Extranets:Knowledge Management and the Struggle for Power,Palgrave Macmillan

44
• Eg Wilson, T.D. (2002) “The nonsense of ‘knowledgemanagement’” Information Research, 8(1), paper no.144
• Horwitch, Mark, & Armacost, Robert. (2002). Helpingknowledge management be all it can be.The Journalof Business Strategy, 23, 26-31
• Bureau (2003), The Hindu, On line edition, “Creatingthe instruments for A knowledge revolution in ruralIndia”, July 20th.
• Easterby-Smith, M. and M. A. Lyles (2003), TheBlackwell Handbook of Organizational Learning andKnowledge Management, Oxford, Blackwell Publishing
• Awad, Elias M., Ghaziri, Hassan M. (2003), ‘KnowledgeManagement’, Pearson Education.
• Becerra-Fernandez, I., A. González and R. Sabherwal(2004), Knowledge Management: Challengers,Solutions and Technologies.
• Samanta, Mousumi, Sanata, Bimal, (2005),‘Knowledge Management in Technical Education’ TheIndian Journal of Technical Education, Vol. 28, 85-92
• Iyyanki, Srikanth,(2006), ‘Knowledge Management:the need of hour’, HRD newsletter, pg-25.
Sowa, John, ‘Knowledge Management: Practicaltechniques for building’, Vikas Publication.
• Tiwana, A, ‘Knowledge Management: Practicaltechniques for building’, Print Well Publication.
• Pollard, Dave, October 2003, ‘The Future ofKnowledge Management’
• Platt, Nina, July 2003‘Knowledge is Power: Knowledgemanagement Remains Vital to Firm Success’
• Willard, Nick, July 2004, ‘Knowledge Management- asynopsis in five frames’
• Rusanow, Gretta, 2006 ‘Global Law Firm KnowledgeManagement Survey’http://www.unc.edu/~sunnyliu/inls258/Introduction_to_Knowledge_Managementhttp://www.emeraldinsight.comhttp://www.knowledge-management-online.com/understanding-the-four-dimensions-of-knowledge-management.htmlhttp://www.knowledgepoint.com.au/knowledge_management/Articles/KM-India-http://www.crl.du.ac.in/ical09/papers/index_files/ical-22_210_446_1_RV.pdfhttp://www.brint.com/km/whatis.htm
Figure 1: Knowledge Management Factors
Figure 2:Communication Model of Knowledge Management by Maurer Tochtermann

45
INTRODUCTIONEmpowerment of women entails a social process
that signifies the participation of both male and femalein the development arena of the economy. The presenteconomic system stressed the necessity for such amove as both constitute somewhat equal proportionof total population. History reveals that there arewomen who could demonstrate high feats and bringglory in their lives as well as to the nation. Howevermajority of women who reside in rural areas aredestined to be poor and continued to be in a state ofvulnerability and deprivation in many parts of thecountry. The need for bringing them to the forefrontof economic process is thus essential for a growthoriented process.
Women in Kerala show a lead in terms of socialindicators of development like literacy rate, humandevelopment index and gender development indexcompared to women of other Indian states. But theseachievements have not been adequately reflected inthe standard of living of the rural women in Kerala. Theysuffer from financial difficulties for meeting their daytoday requirements. Thus credit is needed for creatinga resource base and to give relief to satisfy their
requirements. Banks and other financial institutionshesitate to lend money to women, since they lackassets to offer as securities and due to theapprehension on prompt repayment.
A novel approach facilitating credit requirementsto the poor on easy terms, called as Microfinance wasintroduced in the country following the footsteps ofProf. Muhammed Yunus, a great reformer inBangladesh who successfully practiced the system ofcredit to the poor through ‘Grameen Bank ofBangladesh’. This movement named as micro creditor micro finance through SHG approach works with themain focus on economic welfare based on the principleof self help and mutual help. The system works withthe formation of small groups of persons especiallywomen, named as Self Help Groups (SHGs) joiningtogether voluntarily and making use of the thriftcollected from among them. Micro finance has madea positive impact on the quality of life of millions ofpoor people by providing greater access to credit,savings, insurance, transfer remittances and otherfinancial services which would otherwise beunreachable to them.1 (Soundarapandian. M, (2005).
Women Empowerment Through Self HelpGroups - An Analytical Study OfEntrepreneurial DevelopmentDr. A. V. Hemalatha
ABSTRACTThe present economic system stressed the necessity for a move that emphasises the involvement of both menand women who constitute somewhat equal proportion of total population. Of course, there are women whocould demonstrate high feats and bring glory in their lives as well as to the nation. However majority of womenwho reside in rural areas are destined to be poor and continued to be in a state of vulnerability and deprivationin many parts of the country. The need for bringing them to the forefront of economic process is thus essentialfor a growth oriented process. A novel approach of formation of groups of persons especially women, namedas Self Help Groups (SHGs) introduced in the country during 80’s known as micro finance works with the mainfocus on economic welfare based on the principle of self help and mutual help. The present study is an attemptto examine the nature and working of SHGs in Kerala and assessing the benefits enjoyed by women in terms ofempowerment and entrepreneurial competence by joining as members in SHGs.
The study is designed as descriptive cum analytical. Both primary and secondary data are used in the study. Thesocio economic conditions, level of empowerment and the extent of entrepreneurial competence achieved bywomen are analysed by framing relevant variables. The collected data are processed and analysed by usingstatistical tools like percentages, weighted average, and Kendall’s coefficient of concordance, Chi-square testand Analysis of Variance. For assessing the level of empowerment of members, a comparison was made withthe position of non members of SHGs. The study revealed that members are for ahead of non members in thelevel of empowerment and entrepreneurial competence.
Key words : Empowerment, Micro finance, Homogeneous class of women, Self Help Groups, EntrepreneurialCompetence, Micro enterprises.
*Associate professor in Commerce, Pazhassi Raja NSS College, Mattanur.

46
Significance of the study
Prevalence of many government programme andpolicies that are exclusively meant for women, has notcontributed much in improving their socio economiccondition. Formation of homogeneous groups ofwomen named as SHGs endeavours as a potentialforum for orienting the women folk and for buildingawareness and capacity to work and develop.Membership in SHGs helps them to inculcate savinghabit and to have access to resources for meeting theirrequirements. So the need for promoting SHGs as adevice for empowering women and developingentrepreneurial competence appears as a momentousmeasure for effectuating requisite change in theexisting status. The present study assumes significanceagainst this background, as it concentrates onexamining the nature and working of SHGs in Keralaand assessing the benefits enjoyed by women in termsof empowerment and entrepreneurial competence bytaking membership in SHGs.
Objectives of the study1. To examine the nature and working of Self Help
Groups in Kerala.
2. To analyse the extent to which members of Self HelpGroups achieved social, economic and politicalempowerment when compared to non members.
3. To analyse the extent to which members of Self HelpGroups attained entrepreneurial competence inestablishing micro enterprises compared to nonmembers.
4. To examine the problems faced by women inestablishing and maintaining micro enterprises.
Hypothesis
1. There is significant difference between the extentof empowerment achieved at the individual leveland at the group level.
2. SHG members are socially, economically andpolitically better empowered than non members.
3. Inadequate finance is the most dominant of theproblems in establishing and running of microenterprises.
4. SHG members are entrepreneurially morecompetent than non members.
Data source and Methodology
The study is designed as descriptive cum analytical.Both primary and secondary data are used in the study.Primary data is collected with the help of a wellstructured and pre-tested questionnaire. The socioeconomic conditions, level of empowerment and theextent of entrepreneurial competence achieved bywomen are analysed by framing relevant variables.
Multi stage random sampling method was adopted forthe selection of sample. Since, the study is Kerala basedand to give representation to the whole state, sixdistricts were selected for the study. Two districts wereselected on random sampling basis from each of thethree parts, namely, southern, central and northernregion. Districts selected are, Thiruvananthapuram andAlapuzha from southern region, Idukki and Trissur fromcentral region, Wayanad and Kannur from northernregion. From each district, 25 SHGs promoted by NGOsare selected. On an average 16 members are found inthe selected groups and 25 percent of this average istaken as sample. From each SHG, four members areselected on random basis, constituting 600 members.A peer group consisting of 240 non-members withsimilar socio-economic status as that of members ofSHGs was taken from the study area on purposivesampling basis, for comparative assessment.
Tools of analysis
The collected data are processed and analysed by usingstatistical tools like percentages, weighted average, andKendall’s coefficient of concordance, Chi-square testand Analysis of Variance. Software package Statisticaand Micro Soft Excel are used for analysis.
Findings of the studyA. Functioning of Self Help Groups
• NGOs with their dedicated social service constitutethe major motivators for women in all regions tostart SHG. They continue to provide necessarysupport and assistance. A few are self motivatedand some are motivated by banks.
• Prime motivation for starting the group is theconsideration of members to the principle of selfhelp and mutual help which forms the basis ofgroup approach
• Participation of entire members is the practicefollowed by 57.3 per cent of the groups andmajority of the members attend the meeting in thecase of 64 (42.7 %) groups.
• Thrift collected from members of the group isdeposited in a savings account opened in the nameof the group in a local bank. Average annual savingsof the sample groups figure to 14304.36 andstandard deviation 11093.39.
• The mean value of total asset holdings of the groupis 53193.93 with standard deviation 28244.79.
• Majority (84%) of the groups receives assistancefrom external agencies like local government,banks and agencies like CAPART in the form offinancial assistance, training faci lities anddevelopmental support, thereby adding strengthto their efforts.
• Majority (82%) of the groups gets repayment ofloan from members in time, a default is caused

47
occasionally in some cases (15.3 %) and a lowof 2.7 per cent experiences irregularity inrepayment.
• Some of the groups (23.3%) have to facecompetition from nearby groups as they take upthe same line of activities without proper marketstudy. This appears as a practice to be discouraged.
• Groups take up enterprising activities like tradingbusiness, small enterprises, cultivation ofagricultural products.
• The perception of the group leaders about the levelof empowerment achieved at group level variessignificantly in comparison to the opinion ofmembers of the group regarding their individualempowerment.
B. Measuring Empowerment• A higher level of economic empowerment is
displayed by members compared to non members.Region wise analysis reveals significant differencein the level of empowerment between regions.
• The extent of political empowerment achieved bymembers of SHG when compared to non membersis significant. The level of political empowermentof respondents shows insignificant variation amongregions.
• Members achieve a higher level of socialempowerment when compared to non members.Region has no influence upon the level of socialempowerment among the respondents.
• Measuring the degree of empowerment validatesan improvement in the empowerment level ofmembers than non members. The level of overallempowerment achieved by members of SHG ishigher compared to non members.
C. Entrepreneurial competence• Majority of the members expressed their
confidence to start small enterprises with thecompetence they acquired through membership inSHG.
• Majority of them could earn profit from the units,since they are producing goods based on readydemand and lower incidental expenses wereinvolved in the process.
• The degree of competence achieved by membersof SHG remains at an average position in the caseof 71.83 percent of members.
• Majority (90 per cent) of members expressed theirconfidence to initiate ventures and 68 per centattended various training on group relatedactivities, as low as 40 per cent could engage inentrepreneurial activities.
Recommendations
1. SHGs should ensure the participation of entiremembers in their meeting. The meeting should bearranged considering the opinion of all members,to enable total participation.
2. The practice of dividing the common fund whenaccumulated into a larger amount by some of thegroups should be discouraged. In fact the amountshould be channelized for productive investment.
3. Proper guidance and education in the utilization offund should be given by the NGOs to the groupsfor better performance in sustenance.
4. Effective monitoring through frequent interactionand monthly review of performance should bepractised by the NGOs for the growth andsustainability of SHGs.
5. Encouragement and assistance should be given bythe authorities, like NGOs and Governmentagencies to those groups which have the initiativeto start enterprises. While lending money by thegroup, members should be encouraged to investthe whole amount or at least a part of it forestablishing income generating activities.
6. Necessary support and assistance needed forstarting enterprises should be imparted to thegroup and NGOs should take efforts to raise thegroups to a level of self managed entity.
7. Members should be given intensive training inmotivation, leadership, group dynamics, womenempowerment schemes, sensitization of genderissues, welfare programmes, accounting andentrepreneurship.
8. Efforts should be taken by the promotionalinstitutions like NGOs and NABARD to help thegroup members to tackle the problemsencountered while establishing units.
9. Women of younger age should also be encouragedto take membership in SHG, with a motive ofbuilding confidence of younger generation forbetter performance in life and society.
10. Members should be encouraged to follow a practiceof saving money in their own name and to graduallyacquire assets including mortared properties.
11. Members should be inspired to take up incomegenerating enterprises to have own income forsustenance and for timely repayment of loan.
12. A few members still depend on money lenders forsatisfying their financial needs. NGOs with the cooperation from SHG members should jointly workin each locality for the elimination of money lendersfrom their locality.
13. Multiple memberships in groups should bediscouraged. The dangers of having more amountof debt burden from more than one SHG will createadverse effect in the long run.

48
14. Efforts should be there from the part of all memberswith a positive mindset to reach at higher levels ofempowerment in respect of social, political andeconomic spheres. NGOs should assume the roleof motivators towards the programme.
15. Awareness about the benefits and success of theSHG system should be created among poor womenso that they are also motivated to take membershipin SHGs and ultimately become the beneficiary ofgroup approach.
Micro finance as a strategy for empowering women inKerala has acquired considerable significance over thepast few years. SHG system offers benefits like provisionof hassle-free finance, awareness generation,knowledge dissemination and assistance forestablishing income generating activities. The need ofthe hour is to strengthen the system with all possiblesupport and assistance from all corners of the economy.Still more expectation rests on the system for furtheringthe development arena.
References
1. Soundarapandian, M. (2005). Micro finance for ruralEntrepreneurs, issues and strategies, Kurukshetra,54(11), p. 14.
2. Self Help Group (SHG) Bank Linkage, Status of MicroFinance in India, NABARD website, 2007-08.
3. State Focus paper, Kerala: NABARD, 2008-09.
4. State Level Bankers Committee (2008), Agenda andBackground Notes for SLBC, Kerala.
5. Hemalatha, Asokan.T.Dr, Entrepreneurial Prioritiesof women SHG members from Kerala- The NorthSouth Paradox, in Daniel Lazar, Natarajan.P, MalabikaDeo,(Ed) Micro F inance, EnablingEmpowerment,Vijay Nicole Imprints Pvt.Ltd.,Chennai,2010.
ANNEXURE
Table 1.1Authority that Gave Motivation to Start the Group
Region Motivating agencies Totals
Bank NGO Self
North 3(6) 45(90) 2(4) 50(100)
Central 2(4) 43(86) 5(10) 50(100)
South 0(0) 46(92) 4(8) 50(100)
Total 5(3.3) 134(89.3) 11(7.4) 150(100)
Source: Survey dataValues in parentheses denote percentages
Table 1.2
Scores of the Motivation to Start the Group
Self help and mutual help 85(56.67) 29(19.33) 21(14.00) 12(8.00) 3(2.00) 150
(100.00) 631
Good relation with neighbors 20(13.33) 67(44.67) 35(23.33) 21(14.00) 7(4.67) 150
(100.00) 522
Use of locally available resources 0(0.00) 3(2.00) 25(16.67) 35(23.33) 87(58.00) 150
(100.00) 244
Economic independence 19(12.67) 24(16.00) 40(26.67) 40(26.67) 27(18.00) 150
(100.00) 418
To develop saving habit 26(17.33) 27(18.00) 29(19.33) 42(28.00) 26(17.33) 150
(100.00) 435
Reason Rank
I II III IV VTotal
Weighted
Score
Source: Survey data Values in parentheses denote percentage

49
Table 1.4
Value of Assets held by the Group
Region Number Mean (Rs) SD F p-level
North 50 56777.19 28243.38 2.443086
Central 50 45084.17 26714.61
South 50 54078.34 28600.09
Total 150 53193.93 28244.7 Source: survey data
Table 1.6Comparison of Empowerment Scores between Group and Members
Number Mean SD F p-level
Group 150 55.70 5.60 19.9966 0.0000089
Member 600 52.24 10.02
Total 750 53.05 9.30
Source: Survey data
Table 1.5Group Participation in Social Development Programme
Region Village RoadRoad Awareness Anti-drug WomenCleaning Construction Seminar Campaign development
programmeNorth 49 43 50 20 41
(98) (86) (100) (40) (82)Central 27 7 25 13 19
(54) (14) (50) (26) (38)South 50 19 44 25 34
(100) (38) (88) (50) (68)Total 126 69 119 58 94
(84) (46) (79) (39) (63)
Source: Survey data (Values in parentheses denote percentages)
Table1.3
Annual Savings of the Group
Region Number Mean (Rs) SD F p-level
North 50 16735.35 11076.22 3.575082 0.03002
Central 50 11945.36 10843.08
South 50 12740.39 10823.9
Total 150 14304.36 11093.39 Source: survey data

50
Table 1.7Source of Loan of Non Members and
Members before and after becoming Member in SHG
No. % No. % No. %
Bank 74 30.8 214 35.7 160 26.7
Friends/ Relatives 26 10.8 82 13.7 12 2.0
Money lenders 40 16.7 239 39.8 9 1.5
No loan 100 41.7 65 10.8 0 0
Self help group - - - - 419 69.8
Total 240 100 600 100 600 100
Source Non memberBefore becoming a
memberAfter becoming a
member
Source: Survey data
Table 1.8Economic Empowerment of Respondents
North 19.47 1.93 15.21 2.07 265.83 0.0000
Central 19.95 1.76 15.75 2.15 286.74 0.0000
South 19.95 2.03 15.79 2.16 231.47 0.0000
Total 19.79 1.92 15.58 2.14 770.94 0.0000
RegionMember Non-Member
Mean SD Mean SDF P
Table 1.9Political Empowerment of Respondents
North 10.20 2.29 6.38 2.03 169.56 0.0000
Central 10.35 2.36 6.36 1.76 186.68 0.0000
South 10.61 2.51 6.14 1.42 225.74 0.0000
Total 10.39 2.39 6.29 1.75 580.22 0.0000
RegionMember Non-Member
Mean SD Mean SDF P
Source: Survey data
Table 1.10Social Empowerment of Respondents
North 71.17 9.82 46.99 8.82 366.82 0.0000
Central 72.20 10.21 50.83 6.89 296.47 0.0000
South 73.33 9.81 46.91 6.74 487.61 0.0000
Total 72.24 9.97 48.24 7.73 1120.27 0.0000
RegionMember Non-Member
Mean SD Mean SDF P
Source: Survey data

51
Table 1.11Measuring Overall Empowerment
North 100.84 12.09 68.57 11.33 91.62 18.81 421.4406 0.0000
Central 102.50 12.73 72.94 7.74 94.05 17.65 375.5187 0.0000
South 103.90 12.88 68.84 8.16 93.89 19.72 510.5345 0.0000
Total 102.42 12.61 70.12 9.39 93.19 18.76 1287.745 0.0000
RegionMember Non-Member
Mean SD Mean SDF P
Mean SD
Total
Source: Survey data
Table 1.12Entrepreneurial Competence
North 33.74 6.18 19.61 5.07 329.21 0.0000
Central 33.68 6.66 19.35 4.24 318.08 0.0000
South 36.21 6.33 18.69 2.71 570.03 0.0000
Total 34.54 6.49 19.22 4.13 1151.25 0.0000
RegionMember Non-Member
Mean SD Mean SDF P
Source: Survey data

52
INTRODUCTION: IWDPAs early in 1980s Tata group had launched a
dedicated Rural Development Society to address theneeds of rural community around its operation, steelwork, ore mines and quarries etc. Thus began thejourney of empowerment of rural and underprivilegedmasses through the Tata Steel Rural DevelopmentSociety. (TSRDS)
The company, through its dedicated agency, supportsand partners with government in programmes with theaim to induce socio-economic change and empowerthe society. It is ensured that knowledge, skills,education and healthcare are accessible to people whoreside in the vicinity of its operations.
Meanwhile, Government of India have launched theIntegrated Wastelands Development Programme(IWDP) throughout the country so as to improve theproductivity of these lands and there by improve theliving standards of the rural poor who own these lands.The IWDP is a 100% centrally sponsored scheme. Thedevelopment of wastelands is taken up on watershedbasis. Watershed is a geographical unit where rainfalling in the area drains through a common point. DRDAassigns project areas to Project implementing Agencieswhich is TSRDS in this case and this report shows how
Integrated Wasteland Development Programme,Rajnagar, Jharkhand:A Successful Initiative
AbstractAt present, approximately 68.35 million hectare area of the land is lying as wastelands in India. Out of theselands, approximately 50% lands are such non-forest lands, which can be made fertile again if treated properly.It was unprotected non-forestlands, which suffered the maximum degradation mainly due to the tremendousbiotic pressure on it. In the last 50 years it is India’s lush green village forests and woodlots have been deforestedto the maximum. It is precisely to restore this ecological imbalance by developing the degraded non-forestwastelands.
Integrated Wasteland Development Project, launched by Government has been implemented properly in blockRajnagar, distt. Saraikela & Kharsawan, Jharkhand; this could be easily realised after seeing the improvement inall the concerned villages; man-days have been increased leading towards increase in income which has improvedthe economic condition of the villagers. Villagers were having enough but partially cultivable land but now mostof their land has been converted into agricultural land which has supported villager’s socio-economic development.The SHGs formed under IWDP have helped the women a lot, due to these groups they learned to discuss socio-economic issues relevant at village level and had also developed the habit of saving money. In given circumstancesand challenging scenario, IWDP has really helped the villagers in improving their living standard.
* Dr. Ritesh Dwivedi
** Priyanka Singh
TSRDS has divided the work in four part i.e. NaturalResource Management, Land based activities, Non-landbased activities and Other community based activitiesin this paper we will analyse how IWDP has affectedthe villages.
The objective of the programme is to arrest rainwaterrunoff and conserve it in site where it falls. This wouldin turn lead to control of soil erosion which is usuallycaused by rainwater–run-off. Water and soilconservation also leads to improved green cover in theproject areas leading to improved productivity of land.Under this programme, Wastelands are sought to bedeveloped in an integrated manner based on villagemicro watershed plans. These plans are prepared aftertaking into consideration the land capability and siteconditions and in consultation with the local people inregard to their needs. The watershed projects areexecuted by the local people using low costtechnologies locally available.
Degraded land which can be brought under vegetativecover, with reasonable effort, and which is currentlyunder utilised and land which is deteriorating for lackof appropriate water and soil management or onaccount of natural causes. India shares 16% of the world
* Lecturer, Amity School of Rural Management, Sec-125, Noida** Relationship Manager, ivolunteer, Delhi

53
population, while its land is only 2% of the totalgeographical area of the world. Naturally, the pressureon the land is often beyond its carrying capacity.Therefore, the productive lands, especially thefarmlands in the India are in the constant process ofvarious degrees of degradation and are fast turning intowastelands.
Development of wastelands mainly in non-forest areasaimed at checking land degradation, putting suchwastelands of the country to sustainable use &increasing bio-mass availability especially that offuelwood , fodder , fruits, fiber & small timber.Government of India is taking up this colossal taskthrough IWDP; by revitalizing & reviving village levelinstitutions & enlisting people’s participation. It ispeople’s own programme which aims at giving themactual decision making powers in terms of projectimplementation & fund disbursal.
It is one programme which is making sincere effortstowards the empowerment of the people so that asense of collective responsibility can be evolved amongthem. The new guidelines for watershed developmentprovide a paradigm shift in the traditional approachwhere the role of the Government is changed from thatof governance to facilitation. The institutionalarrangements envisaged in the Guidelines can be seenas a true reflection of the Agenda 21 where thesustainability comes through the involvement of people& the local bodies.
The approach of watershed development in a holisticmanner automatically strikes a prudent balancebetween environmental concerns & developmentalaspirations. The efforts being made under theguidelines can be termed as sincere & honest as herethe survival of life itself is at stake with the watersheddevelopment rather than the quality of life itself ascompared to similar situations in the developedcountries. In fact, the effective community control hasbeen an integral part of the Indian social fabric whichwas fragmented by the colonial rule. This programmeis an effort towards its restoration & a small step in theachievement of this goal which might turn into a bigleap with the support from the people.
The programme does not focus solely on uncultivablewastelands because such lands are:• Too degraded to recoupe in isolation• Cost of treatment is very expensive and economical• Such lands are too remote from the village through
protection of vegetative measures and participationof local people is not possible
STUDYA study on IWDP has been done in Rajnagar Block whichcomes under Seraikela-Kharsawan district ofJharkhand, this block consist of 35 villages.
METHODOLOGYTo know how this project has affected the lives of ruralpeople of Rajnagar block it was essential to meet them,that is why 5 villages of this block was selected for datacollection. These are Bankhairbani, Sosomuli,Balrampur, Matkombera, and Batarbera, the firstreason behind selecting these villages is because thesewere easily accessible to me and the second reason isthat 3 out of these 5 villages had improved a lot sinceinception of this project and rest 2 villages had showna normal growth. 10 families from each village havebeen selected as sample through random samplingmethod. People were very friendly and they interactedfreely about their present and pre-project condition.
OBJECTIVES OF STUDYTo know how Integrated Wasteland Developmentprogramme helped in improving the socioeconomiccondition of the poor people and disadvantagedsections inhabiting the programme areas.
SARAIKELA-KHARSAWAN : (BLOCK - RAJNAGAR)
Here all collected data has been arranged in the formof Charts so that analysis can be done easily……
Community ProfileThe Chart 1 shows the caste ratio where only twovillages have Schedule Cast population.

54
Chart 1
Here we can clearly see that the three villagesBatarbera, Balrampur and Bankhairbani have 100%population of schedule tribes, and only two villageshave little population of Schedule Caste; there is noother community in nearby villages.
Family SizeHere in Chart -2 family size has been shown, which isdivided in three section 01-03 members, 04-06members and 07-above members, all villages havedifferent ratio in each section but most of thepopulation lie in the second section i.e. 04-06. In thesevillages all the family members live together till theirparents are alive and after the death of the parentsthey get separated. Second marriage is not entertainedin these areas.
Chart-2
EmploymentChart-3 shows the different occupation and theemployment generated in the last four years. Beforethe implementation of this programme theemployment condition was very bad, most of thepeople were involved in agriculture and because ofbarren land and less irrigation facility; it was also notthat fruitful, beside that they were facing seasonalunemployment also. But now the scenario haschanged, construction work is going on in all the villagesunder the IWDP component “Natural ResourceManagement”, which involves construction of ponds,check dams, land bunding and many more. People arestill involved in agricultural activities with better resultsbecause of improved irrigation facilities and conversionof many barren lands into agricultural lands.
Chart - 3
As it is visible in the chart-3 that most of the peopleare engaged in construction work but this does notmean that they are not engaged in agriculture,everyone in these villages have land and they allpractice agriculture no matter on large scale or onsmall. Construction of ponds had helped a lot, becauseof this lot of people got employment in that time periodwhen they remain job less. This all provided them awonderful opportunity to earn, besides this afterconstruction of these ponds the water problem of thesevillages had also solved, now many families growvegetable at the bank of the ponds; which not only fulfiltheir needs but also help them to earn. Other activitiesinvolve activities such as piggery, Goatry or being partof any SHG. Here people are very comfortable inkeeping pig or goat in their houses and it’s also an easysource of income, so many people adopt this idea.Besides this, the Land based activities which includetimber plantation, fruit plantation and pasturedevelopment, have also helped in employmentgeneration but the main motive of this activity is toutilise the barren lands.The Non land based activities include Pisciculture,Goatry and Piggery which were already practiced bylocals traditionally. But, they were lacking in propermanagement of these activities, TSRDS helped themto learn the new techniques regarding the differentaspects relating to feeding & fodder, shelter andvaccinations.In other community based activities TSRDS help thevillagers to form different groups with a commonobjective; this has motivated the villagers a lot. All thegroup members are very much aware about thedifferent works going on in the village either by TSRDS,Government or any other organisation and this isbecause of the SHG meetings; people of all groupsdiscuss all such issues during their weekly meetings.This makes them more knowledgeable, responsible andhelped them in developing their living standard.

55
Pie Chart-4
As we can see in the Employment Generation chartthat all the four activities had helped in generating newemployment opportunity, but the NRM hadcontributed the highest which has been clearlyindicated in the Pie chart-4.All the four components under Integrated WastelandDevelopment Programme have been implemented byTSRDS and these have provided a lot of livelihoodopportunities to the villagers.
Man days ProfileThe man-days has been increased in last four years,earlier people were engaged in work for 2-3 days aweek which now has been increased up to 4-5 days. Itis a big achievement (see in the Chart-5).
Chart -5
Here, it is very much clear that the highest percentageof man-days has increased in Bankhairbani which hasshown increase of 45%, Matkombera is the biggestvillage out of these five villages and it has shown anincrease of 30%. Rest 2 villages Balrampur and Sosomulihas shown increase of approximate 30% and 42%respectively. Batarbera has also performed better.
Increase in IncomeAll the activities which had been discussed earlier havehelped in employment generation which also resultsin increase in income. See the Chart-6.
Chart -6
Balrampur has improved a lot as this was the mostneglected village 4 years back so from that time it hasimproved a lot and its income has raised by 63.11%.Bankhairbani and Matkombera has also shown goodincrease which is more than 50%, but rest two villageSosomuli and Batarbera has shown an increase of46.27% and 45% respectively which is also not bad.
Chart-7
Table -1Batarbera Matkombera Balrampur Sosomuli Bankhairbani
Improved % 15.3 12.29 16.91 8.41 16.35
Chart -7 shows the comparison of agricultural lands atpresent and of four years back when the project wasstarted in all 5 villages. It shows that every village hasimproved its kitty of land.The best out of these villages is Balrampur (see table -1) whose agricultural land improved from 64.21% to81.12% i.e. 16.91%, Bankhairbani has shown animprovement of 16.35%, Batarbera has also shown animprovement of 15.3% and the rest two villages hasalso shown changes but not as per the top three villagesi.e. Matkombera by 12.29% and Sosomuli by 8.41%.All these improvement is because of different workunder different activities such as Land Bunding whichhelped in controlling soil erosion resulting in agriculturalland, Timber plantation has made use of many landswhich were unutilised; Pasture development has alsohelped in converting the barren land into agriculturalland.
56
Because of this project people got employment andthrough this they learn new skill on basis of which theycould easily grab work at any construction sites, manypeople who are involved in training programmes areinspiration for other villagers.ConclusionAfter going through all the aspects of this project,visiting different sites of the project, meeting differentpeople some of whom were also involved in this projectand beneficiaries, one can definitely say that projecthas been successful.Employment rate has improved a lot, despite very toughconditions where all the villagers were having land butthey were not able to utilised it because much of theland was not feasible for cultivation, besides that theywere not having enough money for buying seeds, theywere growing crops according to their needs only.This project is running since 2005-2006 that means ithas completed 4 years and 5th year is going on, in thisfive year the villages had been benefited in a lot of ways,now the life style of people had improved a lot. Becauseof this project much construction work is going onwhich has generated employment opportunity andpeople’s earning power has also increased a lot. TSRDShad suggested farmers to grow ‘Babai ghas’, a type ofgrass which is use to prepare rope, on other lands whichare not good for agriculture. Farmers can sell them inthe market.The SHGs have helped the women a lot, due to thesegroups they learned to discuss socio-economic issuesrelevant at village level and had also developed thehabit of saving money. These women were helping theirhusband in fields but their contribution was notrecognised. Earlier whatever they were earning, theyused to give it to their husband but now they depositthe money in their SHG accounts and whenever there’sany requirement of money they could contribute ontheir own which has automatically empowered theirstatus in the family. They are very happy with SHG, nowthey understand the power of unity.All in all TSRDSthrough this project IWDP has helped a lot indevelopment of these villages and now the livingstandard of the villagers is much better.Areas of improvement• NRM activities are providing higher the mandays and
in this way the land has also been treated better sothis activity should be encouraged more and more.
• The book keeping at (registers etc.) Self Help Grouplevel is not that appropriate, this taken care ofimmediately.
• BABAI GHASS (grass) plantation and marketingshould be promoted so that people can availmaximum earning due to the high demand of thisgrass.
• Vocational training programmes should be organisedto benefit every section of the society in this region.
The women have shown their keen interest inlearning new things; most of them had expressedtheir desire to get trained in using swing machine.
REFERENCES
• TSRDS Annual Report 2008-09, http://jamshedpur.nic.in/tsrdc.htm
• Kumar, Anil. 2005, Wasteland Management in India,Ashish Publishing
• Kumar, H. D. 2006, Water woes: conserving andmanaging our future lifeline, Daya Publishing House
• Ninan , K.N. (2002) “Watershed Developmentprograms in India: A Review” Paper Presented atthe 12th ISCO Conference, Beijing , 2002.
• Report on IWDP, http://angul.nic.in/iwdp.htm
• Development of wastelands and degraded lands,Tenth five year plan 2002-07, http://planningcommission.nic.in/plans/planrel/fiveyr/10th/volume2/v2_ch5_3.pdf
• Ministry of Rural Development, Department of LandResources and National Remote Sensing Agency,(2000) Wastelands Atlas of India.
• Mythili, G. Intensive agriculture and its Impact onLand Degradation http://coe.mse.ac.in/pdfs/coebreifs/Mythili.pdf
• Article on TSRDS Activities, http://198.170.85.29/Tata-Iron-and-Steel.htm
• Sehgal J. . And Abrol, I.P. (1994) Soil Degradation inIndia: Status and Impact, Oxford and IBH PublishingCo.
• Report of the Technical Committee on WatershedProgrammes in India, January 2006,www.watershed.nic.in site accessed on Report onEvaluation of integrated wasteland developmentproject, Bidar district, Karnataka, 2002, AFC Ltd.,http://rdpr.kar.nic.in/Evaluation/IWDP-Bidar.pdf

57
An Empirical Study on Occupational Stressin Academicians with special reference toBangalore city* Mrs Purnima Thampi V
** Dr. Lakshmi Jagannathan
AbstractDue to the competitive nature of the job environment today, most of the people in the world are spending
their time for job related work purposes and thus ignoring the stressors that are influencing their work .Jobstress poses a threat to the health of the workers and in turn to the health of the organization. The majorobjective of the study was to analyse the factors which contribute to the stress among academicians. The studyattempts to understand the relationship between occupational stress and certain personal variables like age,designation, gender etc. The sample consists of 150 academicians of various designations and disciplines in twoprominent educational institutions in Bangalore. But at the end the researchers have got only 133 questionnaires.Primary data was collected using a structured Likert scale questionnaire ranging from 1 (strongly disagree) to 5(strongly agree). Statistical tools like Factor Analysis, Correlation, Anova were applied. The results show thatthere were primarily seven factors which cause occupational stress in academicians. The seven factors identifiedwere role clarity and workplace relationships, employee development support, academic and research recognition,work home interface, workload acknowledgement, professional and home demands, remuneration and studentsupervision. This was found in accordance with earlier studies conducted by researchers. It was also found thatthere was a positive correlation between work load and occupational stress in academicians. It was found throughanova that there was no significant variation between certain personal variables like gender, education anddesignation with occupational stress.
Keywords: Stress, Occupation, Academicians, Organization, recognition.
INTRODUCTIONThe modern world where individuals are more
achievement oriented is also a world of stress. Todaystress is found everywhere like in one’s own family,business organizations or and other social or economicactivities. A child who is born till his death is exposedto various forms of stress either in personal orprofessional life. Thus today’s age can be called as the“Age of anxiety and stress”(Pestonjee 1999). Theconcept of stress was first introduced in the life sciencesby Hans Selye in 1936.It is a concept borrowed fromthe life sciences. The term stress has been derived fromthe latin word “Stringere”, stress was popularly used inthe seventeenth century to mean hardship, strain,adversity or affliction. In Psycho Physiology , stress refersto some stimulus resulting in a detectable strain thatcannot be accommodated by the organism and whichultimately results in impaired health or behavior.Mason (1975) reviewed literature on stress andconcluded that there was confusion and lack ofconsensus regarding its definition. The term stress hasbeen approached in four different ways. First , as thestimulus or external force acting on the organism,second as the interaction between an external forceand the resistance opposed to it as in biology and finally
as a comprehensive phenomenon encompassing allthe three. Lazarus, Cohen, Folkman (1980) has clarifiedthat stress is not only a response but also a function ofthe individual appraisal of the situation .People do notrespond directly to a stimulus but they respond to themeaning of the stimulus in relation to the perceptionof the environment. Any event can be stressful for aperson only when they are perceived to be threatening.Thus stress varies from one person to anotherdepending on situations. The stress felt by a person inone situation may not be stressful for another personin the same situation. Kets de Vries (1979) had notedeach individual needs a moderate amount of stress tobe alert and capable of functioning effectively in anorganization.
2 REVIEW OF LITERATURE
Stress is derived from desirable and undesirable events.Stress resulting from desirable events is called Eustress(good stress). Stress resulting from undersirable eventsis called Distress( bad stress).Stress results fromconfronting an opportunity, constraint or demand,when the expected outcome is important anduncertain (Robbins and Sanghi, 2006, p 542).
*Lecturer, Department of Management Studies, Dayananda Sagar College of Engineering, Shavige Malleshwara Hills, KumaraswamyLayout, Bangalore - 560078. ** Professor and Head of the Department, Department of Management Studies, Dayananda SagarCollege of Engineering, Shavige Malleshwara Hills Kumaraswamy Layout, Bangalore- 560078

58
It arises from a mismatch between an individual andhis/her environment , if there is an inability to copewith the constraints and demands encountered(Harrison 1976).Stress cannot be avoided (Pestonjee ,1999, p 15 – 34) as events influencing us are oftenbeyond our control , things do not work as plannedand unexpected changes takes place.Stress is a question that has beguiled many prominentresearchers of this era. The term itself is amorphousand sustains the difficulty in discerning its meaning.Definitions of stress range from metallurgical strain toone’s emotional wits end. Although convergence on acommon definition of stress is highly desirable, thescientific community has not been able to do so.Instead, the research literature reflects wide anddivergent opinions concerning stress. Stokes and Kite(2001) suggest that the term’s versatility (its range ofapplication), is its undoing as a useful scientific termor concept, and they are not alone in this assertion(Tepas & Price, 2001).stress can be viewed as, “…an agent, circumstance,situation, or variable that disturbs the ‘normal’functioning of the individual…stress [is also] seen asan effect—that is the disturbed state itself…thisbifurcation of meaning is arguably the mostfundamental source of the confusion surrounding thestress concept.” (p. 109). Stokes and Kite contend thatthere are no psychological stressors in any absolute,objective sense. Tepas and Price (2001) suggested thatstress is commonly connected to the followingconcepts: adaptation, anxiety, arousal, burnout, coping,exertion, exhaustion, exposure, fatigue, hardiness,mental load, repetitiveness, strain, stressor, andtension. Given the formidable breadth of the domainit is not difficult to see why stress as a construct hasbecome unwieldy for most researchers.Numerous studies found that job stress influences theemployees’ job satisfaction and their overallperformance in their work. Beehr and Newman(1978)had defined stress as a situation which will force aperson to deviate from normal functioning due to thechange (i.e. disrupt or enhance) in his/her psychologicaland/or physiological condition, such that the person isforced to deviate from normal functioning. From thedefinition that has been identified by researchers, wecan conclude that it is truly important for an individualto recognize the stresses that are faced by them in theircareer. Some demographic factors may influence theway academic staffs act in their workplace. Management role of an organization is one of theaspects that affect work-related stress among workers(Alexandros-Stamatios et. al., 2003).Workers in anorganization can face occupational stress through therole stress that the management gave. Role stressmeans anything about an organizational role thatproduces adverse consequences for the individual
(Kahn and Quinn, 1970). Management will have theirown role that stands as their related. Role related areconcerned with how individuals perceive theexpectations other have of them and includes roleambiguity and role conflict (Alexandros-Stamatios et.al., 2003).Family and work are inter-related and interdependentto the extent that experiences in one areaaffect the quality of life in the other (Sarantakos, 1996).Home-work interface can be known as the overlapbetween work and home; the two way relationshipinvolves the source of stress at work affecting homelife and vice versa affects of seafaring on home life,demands from work at home, no support from home,absent of stability in home life. It asks about whetherhome problems are brought to work and work has anegative impact on home life (Alexandros-StamatiosG.A et al., 2003). For example, it questions whetherthe workers have to take work home, or inability toforget about work when the individual is at home.Home-work interface is important for the workers toreduce the level of work-related stress. According toLasky (1995) demands associated with family andfinances can be a major source of ‘extra-organisational’stress that can complicate, or even precipitate, work-place stress. Russo & Vitaliano (1995) argued that theoccurrence of stressors in the workplace eitherimmediately following a period of chronic stress athome, or in conjunction with other major life stressors,is likely to have a marked impact on outcome.Several studies have highlighted the deleteriousconsequences of high workloads or workoverload. According to Wilkes et al. (1998) workoverloads and time constraints were significantcontributors to work stress among community nurses.Workload stress can be defined as reluctance to cometo work and a feeling of constant pressure (i.e. no effortis enough) accompanied by the general physiological,psychological, and behavioral stress symptoms (Divisionof Human Resource, 2000).Al-Aameri AS. (2003) has mentioned in his studies thatone of the six factors of occupational stress is pressureoriginating from workload. Alexandros-Stamatios G.A.et al. (2003) also argued that “factors intrinsic to thejob” means explore workload, variety of tasks and ratesof pay. In this study the various factors which causesjob stress in academic staffs (of various designationsranging from Head of the Departments, Professors andLecturers from various disciplines) of a well reputed andleading Educational Institute in Bangalore wasexamined.
3 OBJECTIVES• To identify the various factors which contribute to
occupational stress among academicians inBangalore.

59
• To find whether there is a relationship betweenoccupational stress and workload of academicians
• To identify the relationship between personalvariables like gender, age, designation, experienceon occupational stress
4 HYPOTHESES OF THE STUDY1 There is a significant variance between occupationalstress and demographic variables like gender, age,designation and experience among academicians inBangalore.2 There is a positive correlation between occupationalstress and work load
5. METHODOLOGYThe study required both primary and secondary data.The primary data was collected with the help of a surveyconducted in Bangalore. The main concentration wasto collect the required data from academicians fromtwo of the most prominent educational institutions inBangalore. Data for the study was obtained by using astructured questionnaire.The questionnaires were distributed to 150academicians of two prominent educational institutionsin Bangalore. But at the end the researcher has got only133 questionnaires out of the 150 given toacademicians. Academicians from various disciplinesranging from Engineering, Management, Science andMathematics and at various designation levels (Headof the departments, Professors and lecturers) wereincluded in the sample. The study was conducted overa period of three months. The secondary data forliterature review was collected from EBSCO database,Google website and other journal papers.
5.1 FORMULATION OF QUESTIONNAIREThe survey used a questionnaire which had 23statements and some demographic questions likegender, age, years of experience in teaching,designation, level of education and marital status.Theresponses were collected on a five point Likert scaleranging from 1(strongly disagree) to 5 (strongly agree).The factor analysis, correlation analysis and one wayANOVA were used as statistical tool for analysis.
5.2 TEST OF RELIABILITY (CRONBACH’s ALPHA)Cronbach’s á (alpha) is a statistic. It is commonly usedas a measure of the internal consistency or reliabilityof a psychometric test score for a sample of examinees.Cronbach’s alpha can be written as a function of thenumber of test items and the average inter-correlationamong the items. The formula for the standardizedCronbach’s alpha:
Here N is equal to the number of items, c-bar is theaverage inter-item covariance among the items and v-bar equals the average variance. A reliability test of the number of questions (23statements) using Cronbach’s alpha was computedusing the SPSS software. The result is as follows:
Reliability Statistics
Cronbach’s Alpha N of Items
.769 23
Table 1The alpha coefficient for the 23 items is 0.769,suggesting that the items have relatively high internalconsistency. A reliability coefficient of .70 or higher isconsidered” acceptable” in most social science researchsituations. Nunnaly (1978) has indicated 0.7 to be anacceptable reliability coefficient.
6 RESULTS OF ANALYSISIn this research work demographic variables such asgender, age, marital status, educational qualifications,experience was used.The number of female academicians were more innumber than male academicians. Therefore thequestionnaires were distributed among both gendersbut 71% females and 29% males returned the filled upquestionnaires.Results of demographic analysis is presented infollowing tables
Table 2 Demographic Variable - Gender
1 Gender Frequency Percentage (%)
Male 38 29Female 95 71
Table 3 Demographic Variable – Age
2 Age of Frequency Percentage (%)the respondents
21 - 30 51 3831 - 40 61 4641 -50 17 1351 - 60 4 361 or above 0 0
Table 4 Demographic Variable -Designation
4 Designation Frequency Percentage (%)
Lecturer 81 61Senior Lecturer 21 16Assistant professor 19 14Professor 7 5Director/Head of 5 4the departmentTotal 133 100

60
Table 5 Demographic Variable -Experience inteaching
3 Years of experience Frequency Percentage (%)in teaching
< 1 year 6 5 1 – 3 years 36 27 3 – 5 years 35 26 >5 years 56 42
6.1 Analysis for the Objective 1:The aim is to identify the various factors which affectthe job stress among academicians in the city ofBangalore.
FACTOR ANALYSISFactor analysis is a very useful method of reducing datacomplexity by reducing the number of variables beingstudied. Factor analysis reduces number of variablesinto fewer factors, which explains much of the originaldata. Principal component analysis was used to identify
the number of factors which can be extracted from thedata.Varimax rotation was used to get the percentage ofvariance for the 23 statements in the questionnaire.Eigenvalue of greater than 1 was identified and therelevant factors have been obtained accordingly in linewith the statements in the questionnaire. Furtheranalysis of the results has indicated that a total of 73.090% the variance (information from the original 23statements) was observed. As per Nunally (1978), thisvalue is acceptable for further analysis.A Rotated Component Matrix Table is generated andseven factors are derived. Factor loading above 0.50are considered as per factor analysis format. The derivedfactors are arranged based on the statements that havegone into each factor. The list of factors along with thesupporting statements is displayed in Table –The derived factors obtained using SPSS software areas follows
Factor Loading Item Variable
Factor 1:Role clarity and workplace
relationships
0.570 V5 Willingness to put in effort to help theorganization be successful
0.818 V16 Role in the department is well defined0.783 V17 Clarity on role expectations0.689 V22 Good support from supervisor and colleagues
0.513 V1 Excellent internal communication within theorganization
0.813 V3 Organizational support for pursuing highereducation
0.699 V4 Sent for training programs to improve teachingand research capabilities
0.654 V12 Gets feedback related to teaching anddepartmental responsibilities
0.743 V13 Teaching and research achievements areconsidered during promotions
0.765 V14 Work recognition0.643 V21 Organizational support for finding finances for
research
0.612 V6 Stress when handling new subjects0.709 V18 Personal priorities are compromised due to
professional work0.784 V19 Need to take work home to meet work
requirement0.650 V23 Job physically exhausting at the end of the day
0.607 V2 Acknowledgement for a job well done0.485 V9 Time to do quality research0.732 V10 Manageable work load0.646 V11 Belief that promotion procedures recognize the
variety of works that academicians perform
0.760 V7 Ability to cope with intellectual and technicaldemands of the job
0.702 V20 Ability to manage work and home life
0.717 V8 Reasonable number of students to teach andsupervise
0.694 V15 Adequate level of pay for work
Factor2:Employee development support
Factor 3 :Academic and Research
recognition
Factor 4:Work home interface
Factor 5:Work load
acknowledgement
Factor 6:Professional and home demands
Factor7Remuneration and student
supervision.

61
Table 6 The first step in interpreting the output is to look atall factors extracted and their eigen values and thecumulative percentage of variance. Thus from theabove table 6 factors have been extracted from 23factors.The seven derived factors are role clarity and work placerelationships, employee development, academic andresearch recognition, work home interface, workloadacknowledgement, Professional and home demands,Remuneration and student supervision.
6.2 Analysis of Objective 2:The aim is to analyze the impact of work load onoccupational stress in academicians.
6.2.1 CorrelationWhile the correlation could range between -1.0 to +1.0, we need to understand whether any correlation foundbetween two variables is significant or not i.e if it hasoccurred solely by chance or if there is a high probabilityof its existence. A significance of p=.05 is the generallyaccepted conventional level. This indicates that 95 timesout of 100 , we can be sure that there is a true orsignificant correlation between the two variables, andthere is only a 5% chance that the relationship doesnot truly exist. We would not know which variablecauses what , but we know that the two variables areassociated with each other. Thus the hypothesispostulates a significant positive (or negative)relationship between the two .The results are as followsin Table 7
Correlation between Occupational stress and work load.Correlations
WORK STRESSLOAD
WORK LOAD PEARSON CORRELATION 1 .230**
SIG. (2-TAILED) .000N 133 133
STRESS PEARSON CORRELATION .230** 1SIG. (2-TAILED) ..000N 133 133
Table 7From the table 7 we can say that there is a positivecorrelation of 0.230 between work load andoccupational stress which is significant at 0.01 level iethe probability of this not being true is 1% or less.Thatis over 99% of the time we would expect thiscorrelation to exist.Thus it can be inferred that as work load increases ,occupational stress also increases.
6.2.2 One way ANOVAOne – way ANOVA table is a statistical tool which helpsus to know the degree of variance between one factor
and other variables .It helps us to know how the mainfactor will get influenced by other variables. One wayANOVA is used to measure how demographic variableswill have an impact on particular variable.
Gender : If we take 0.90 as a level of significance it canbe seen that there is no significant variance betweengender and occupational stress because value of sig is0.369 which is more than 0.10.Education : There is no significant variance betweeneducation and occupational stress because the valueof sig is 0.670 which is more than 0.10 which meansthat irrespective of educational level job stress isuniform across academiciansDesignation : There is no significant variance betweendesignation and occupational stress because the valueof sig is 0.809 which is more than 0.10 which meansthat irrespective of designation levels job stress isuniform.
Table 8. One Way ANOVA showing the relationshipbetween demographic factors with occupational stress.
7 ConclusionThe researcher has found seven factors which affect
occupational stress among academicians like roleclarity and workplace relationships, employeedevelopment support, academic and researchrecognition, work home interface, workloadacknowledgement, Professional and home demands,Remuneration and student supervision. It is found thatamong the seven factors which have been identifiedas causing occupational stress in academicians, workhome interface has been identified as one of the factors
DemographicVariables
BetweenGroups 1.390 1 1.390 0.814 0.369
WithinGroups 223.248 131 1.709
Total 225.248 132
BetweenGroups 1.385 2 0.693 0.402 0.670
WithinGroups 222.863 130 1.722
Total 225.248 132
BetweenGroups 2.777 4 0.694 0.399 0.809
WithinGroups 222.471 128 1.738
Total 225.248 132
Gender
Education
Sum ofsquares df Mean
Square F Sig
Designation

62
which causes occupational stress among academiciansaccording to a study conducted by Alexandros –Stamatios, 2003.It was also found that as work loadincreases, Occupational stress also increases. This is inaccordance with earlier researches conducted by Wilkesetal in 1998 that work overloads and time constraintswere significant contributors to work stress amongcommunity nurses.Al Aameri has also mentioned in hisstudies that one of the six factors of occupational stressis pressure originating from workload. This is alsoidentified as one of the factors which causes stress inthe present study also. It is also found that certainpersonal variables like gender, education, designationhas no relation with occupational stress.
8 Limitations of the studyThe study was limited to only 133 samples of twoprominent educational institutions in Bangalore. Therewas some reluctancy among some academicians infiling the questionnaire. There was also some difficultyin getting the questionnaire filled from Head of thedepartments and Directors due to their busy schedule.
9 Scope for further researchThe study can be strengthened by increasing the samplesize as the data analysis results and findings may varysubstantially when the sample size is increased. Thestudy can be extended to teaching staffs in otheracademic Institutions within the city of Bangalore andoutside the city. More factors or variables can also beincluded in the questionnaire as many different aspectsof the working environment can cause stress. Potentialcorrelation between some of the independent variableslike organization culture, impact of technology,emotional demands of the work and unclear work rolesneed to be reported in a future study The study canalso be further extended to understand the jobsatisfaction level and job burnout among academicians.
References
1. Al-Aameri A.S., 2003. “Source of job stress fornurses in public hospitals”, Saudi Medicaljournal,24(11),pp.1183 -1187.
2. Alexandros-Stamatios G. A., Matilyn J.D., and CaryL.C., 2003. “Occupational Stress, Job satisfactionand health state in male and female junior hospitaldoctors in Greece”, Journal of Managerialpsychology, 18 (6), pp. 592 – 621.
3. Beehr, T.A., Walsh, J.T., & Taber, T.D. 1976.“Perceived situational moderators of therelationship between subjective role ambiguityand role strain”, Journal of Applied Psychology, 61,pp , 35 -40.
4. Beehr, Terry A. (1995), Psychological Stress in theWorkplace, London and New York.
5. Caplan, R.D., Cobb, S., French, J.R.P., Jr., Harrison,R.V., and Pinneau, S.R., 1975. “Job Demands andWorker Health”, HEW Publication No. (NIOSH), pp.75-160.
6. Cascio, W.F., 1995. “Wither industrial andorganizational psychology in a Changing world”?American Psychologist, 50, pp.928-939.
7. Chan, K.B., Lai, G., Ko, Y.C. & Boey K.W., 2000.“Work stress among six professional groups: theSingapore experience”, Social Science Medicine,50(10), pp.1415-1432.
8. Coleman J.C. 1976. Abnormal Psychology andModern Life (Indian reprint), Taraporewalla,Bombay.
9. Cooper, C., U. Rout and B. Faragher. 1989. “MentalHealth, Job Satisfaction, and Job Stress amongGeneral Practitioners”, B Medical Journal, 298,pp366-370.
10. Cooper, C.L., 1991. Stress in organizations. In M.Smith (Ed.). Analysing Organisational BehaviourLondon: MacMillan
11. Cordes, C.L., and Dougherty, T.W. 1993. “A reviewand integration of research on job burnout”Academy of Management Review, 18,pp.621-656.”
12. Cummins R.C. 1990. “Job stress and the bufferingeffort of supervisory support”, Group andOrganizational Studies, 15(1), pp.92-104.
13. Dyer, S., & Quine, L. 1998. “Predictors of jobsatisfaction and burnout among the direct carestaff of a community learning disability service”,Journal of Applied Research in IntellectualDisabilities, 11 (4), pp.320-332.
14. Dyer, S., & Quine, L. 1998. “The effects of jobdemands and control on employee attendance andsatisfaction”, Journal of Organisational Behaviour,12, pp.596-608.
15. Nilufar Ahsan , Zaini Abdullah, David Yong Gun Fie,Syed Shah Alam,2009.”A study of job stress on jobsatisfaction among University staff in Malayasia:Empirical study”, European journal of SocialSciences – Volume 8, Number1 (2009)
16 White, B. (1995), “The career development ofsuccessful women”, Women in ManagementReview, Vol. 10 No. 3, pp. 4-15.
17 White, B., Cox, C. and Cooper, C. (1992), Women’sCareer Development: A Study of High Flyers,Blackwell, Oxford.
18 Rajendra Nargundkar(2008),” Marketing Research–Text and cases”,Tata McGraw Hill, page No (246–284)

63
The Journal of Management Research, “PARIVARTAN” invites articles in the areas of MARKETING,FINANCE, HR, OPERATION AND SYSTEMS.
The Journal looks forward to dissemination of knowledge and experience through publication ofresearched articles for catering to the need of students, academicians, intelligentsia andpractitioners. It would not only act as torch-bearer to the ambitious research scholars, but providea platform form for discussion of management thoughts and practices guiding the CEOs, CFOs,and HRMs of tomorrow.
This Journal will provide a complete, reliable and freely-available source of information andessential reading for management students, and researchers on current developments in therespective fields.
Our aim is to publish rapidly articles posted by management thinkers, students and practitionerswithin 3-4 weeks of its submission, if accepted for publication by the Experts’ Committee. Thearticles in the following categories are invited: Full Research Articles, Research Reports, ResearchLetter, Review Articles, Mini-reviews and Meeting Reviews. All submitted articles will undergorigorous peer-review before publication.
We look forward to your support and valuable contribution for this new exciting venture. Thesubmissions should be double spaced. International referencing system i.e. HBS should be followedmeticulously.
The completed submissions would be electronically accepted through the [email protected] or [email protected] Acceptance would be intimated withinfour weeks from the date of review of papers by the “Review Committee”
The Editor
“Parivarthan”
Journal of Management Research
Oriental Institute of Management
Plot No. 149, Sector - 12, Vashi, Navi Mumbai.
CALL FOR PAPERS

64
One Year Two Years Three Years
Individual Rs 500 Rs 900 Rs 1250
Institutions Rs 750 Rs 1250 Rs 1500
Cheques / DD for subscription should be sent in favour of “Oriental Institute of Management” payable atVashi, Navi Mumbai. The subscription should be sent to-
THE EDITOR
“Parivarthan” Journal of Management Research
ORIENTAL INSTITUTE OF MANAGEMENT
Plot No 149, Sector 12, Vashi, Navi Mumbai - 400703.
I / We wish to subscribe/renew my subscription to “Parivarthan” Journal of Management
Research for 1st/ 2nd/ 3rd year. A bank draft / cheque bearing No______________________________
dated________________ for Rs. ________________ (_____________________________________)
drawn in favour of Oriental Institute of Management payables at Vashi, Navi Mumbai for ___________
year is enclosed.
Name : ___________________________________________________________________________
Organization ______________________________________________________________________
_________________________________________________________________________________
City _____________________________________ Pin ____________________________________
Country _________________________________ Phone _________________________________
Fax _____________________________________ Mobile ________________________________
E-Mail __________________________________
Date : Signature :
SUBSCRIPTION FORM
SUBSCRIPTION RATES