Pareto Analysislandstar.learnerhall.com/training/JOBAIDS/DMTechniques...The Techniques 1 Pareto...
21
The Techniques 1 Pareto Analysis In the early 1900s Vilfredo Pareto observed 20% of Italy‟s population controlled 80% of the wealth. This disproportionate relationship has since repeated itself in many situations. For example: 20% of time expended produces 80% of the results 80% of your phone calls go to 20% of the names on your list 20% of the streets handle 80% of the traffic We can use this Pareto effect as a decision-making tool to isolate the vital few items requiring attention from the trivial many. Pareto Analysis Step 1 List the issues, causes or options you have available. If the list is long, group like items together. Step 2 Apply a score to each group or individual item. The score will be based upon the obstacle you are trying to overcome. Step 3 Work on the item with the highest score first. The item with the highest score will provide you with the largest overall benefit.
Transcript of Pareto Analysislandstar.learnerhall.com/training/JOBAIDS/DMTechniques...The Techniques 1 Pareto...
The Techniques 1
Pareto Analysis
In the early 1900s Vilfredo Pareto observed 20% of Italy‟s population controlled 80% of the wealth. This disproportionate relationship has since repeated itself in many situations.
For example:
20% of time expended produces 80% of the results
80% of your phone calls go to 20% of the names on your list
20% of the streets handle 80% of the traffic
We can use this Pareto effect as a decision-making tool to isolate the vital few items requiring attention from the trivial many.
Pareto Analysis
Step 1 List the issues, causes or options you have available. If the list is long, group like items together.
Step 2 Apply a score to each group or individual item. The score will be based upon the obstacle you are trying to overcome.
Step 3 Work on the item with the highest score first. The item with the highest score will provide you with the largest overall benefit.
2 The Techniques
Pareto Analysis
Example:
A manager has noticed a decrease in customer satisfaction as the number of complaints regarding her call center has increased. She wants to find out what she can do to increase customer satisfaction. She reviews the complaint log and discovers:
1. Phones not answered until after third ring
2. Staff seems to lack focus, leading to frustration
3. Service calls require multiple visits due to lack of organization and missing parts
4. Ambiguity in service call arrival times
5. Staff does not appear competent
6. Sometimes it is determined at the conclusion of a service call the issue could have been handled over the telephone
Several of the items can be grouped together. The manager decides to group similar concerns together and totals the number of complaints per group.
Lack of staff training (#5, 6) 51 complaints
Too few staff (#1, 2, 4) 21 complaints
Poor organization and preparation (#3) 2 complaints
With this Pareto Analysis, the manager can see that the vast majority (69%) of the complaints can be solved by increasing staff training.

The Techniques 3
Paired Comparison Analysis
Paired Comparison Analysis aids in comparing apples with oranges. This tool can be utilized when multiple options need to be compared in the absence of objective data. This decision-making tool also sets priorities by determining the relative importance of each item.
Paired Comparison Analysis
Step 1 List the options you will compare and assign a letter to each one.
Step 2 On the worksheet, list each option as both a column and a row header.
Step 3 Cross out the cells in which an option is being compared to itself and duplication of comparisons exists.
Step 4 For each row, compare the row item with the column item. Decide which is more important and record that letter in the cell. Next, determine the importance of the difference between the two from 0-not important to 3-very important and record that number in the cell as well.
Step 5 Add the total of the values for each option. The item with the highest value is the most critical (optional-convert values to percentages of total score).

4 The Techniques
Paired Comparison Analysis
Example:
A company wants to expand their business. They have determined four possible solutions:
1. Overseas market
2. Home market
3. Customer service
4. Quality
A B C D
Overseas market
Home market
Customer service
Quality
A A, 2 C, 1 A, 1 Overseas market
B C, 1 B, 1 Home market
C C, 2 Customer service
D Quality
Importance of difference between
two options 0-not important 3-very important
Totals:
A=3 (37.5%)
B=1 (12.5%)
C=4 (50%)
D=0
From this Paired Comparison Analysis, the company should first focus their energy on improving the level of customer service they provide.

The Techniques 5
Paired Comparison Analysis
You are interested in learning more about the company and want to find a position that is the best fit for you. You have identified four skill-sets of interest to you.
The Paired Comparison Analysis table below will aid in your decision-making process.
1. For each row, compare the row item with the column item. Decide which is more important and record that letter in the cell.
2. Determine the importance of the difference between the two from 0-not important to 3-very important and record that number in the cell as well.
3. Add the total of the values for each skill.
4. The skill with the highest value is the most critical.
A B C D
Data entry Phone work Generating reports
Problem solving
A Data entry
B Phone work
C Generating reports
D Problem solving
Totals:
A=_____
B=_____
C=_____
D=_____
Employee Activity—Using Paired Comparison Analysis
6
Landstar Educational Advantage Program
Paired Comparison Analysis
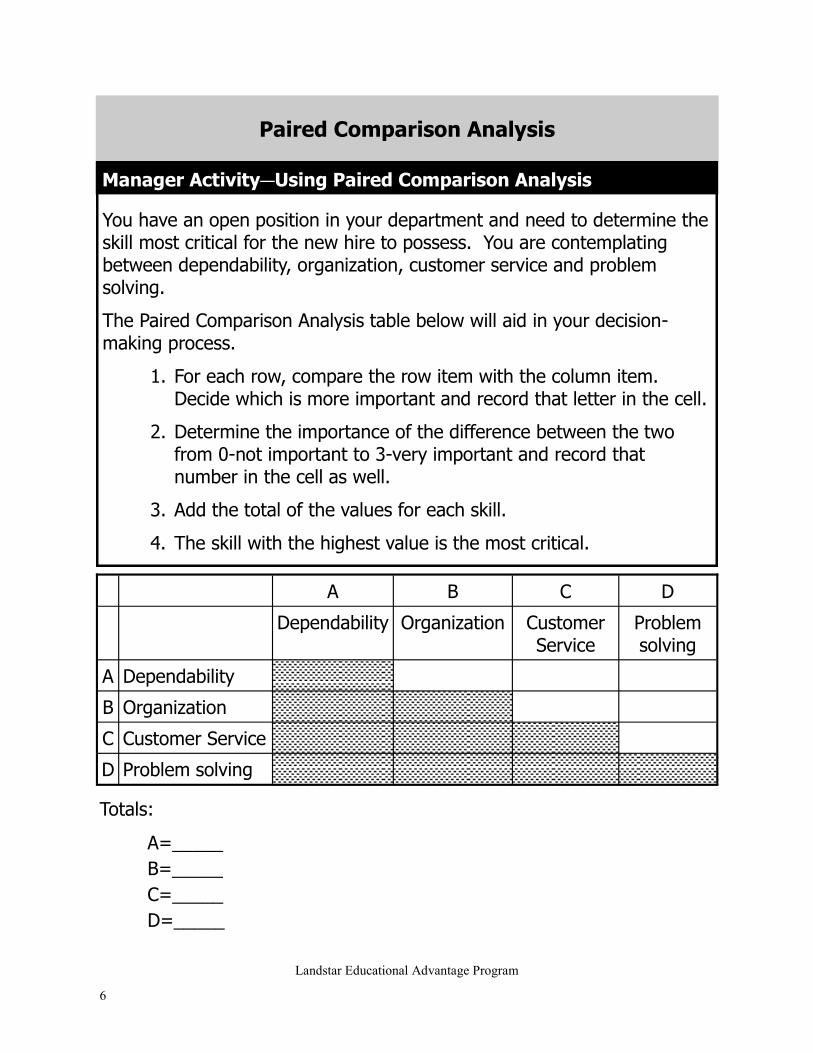
You have an open position in your department and need to determine the skill most critical for the new hire to possess. You are contemplating between dependability, organization, customer service and problem solving.
The Paired Comparison Analysis table below will aid in your decision-making process.
1. For each row, compare the row item with the column item. Decide which is more important and record that letter in the cell.
2. Determine the importance of the difference between the two from 0-not important to 3-very important and record that number in the cell as well.
3. Add the total of the values for each skill.
4. The skill with the highest value is the most critical.
A B C D
Dependability Organization Customer Service
Problem solving
A Dependability
B Organization
C Customer Service
D Problem solving
Totals:
A=_____
B=_____
C=_____
D=_____
Manager Activity—Using Paired Comparison Analysis
The Techniques 7
Grid Analysis
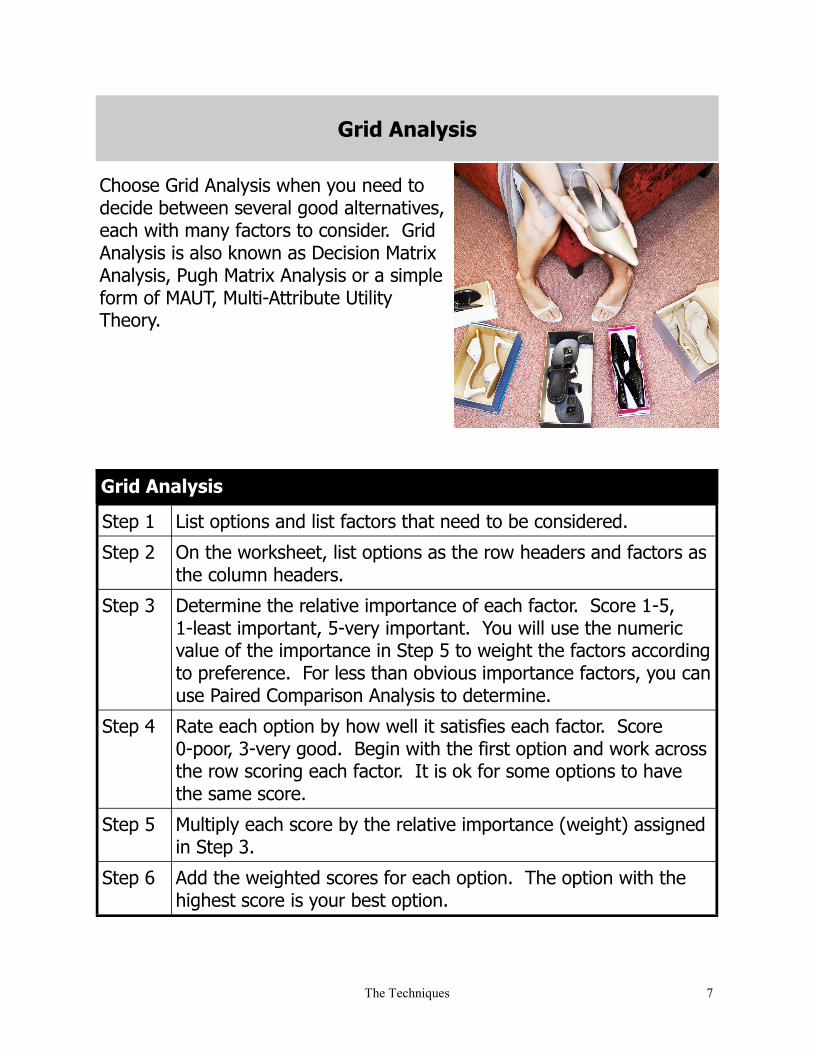
Choose Grid Analysis when you need to decide between several good alternatives, each with many factors to consider. Grid Analysis is also known as Decision Matrix Analysis, Pugh Matrix Analysis or a simple form of MAUT, Multi-Attribute Utility Theory.
Grid Analysis
Step 1 List options and list factors that need to be considered.
Step 2 On the worksheet, list options as the row headers and factors as the column headers.
Step 3 Determine the relative importance of each factor. Score 1-5, 1-least important, 5-very important. You will use the numeric value of the importance in Step 5 to weight the factors according to preference. For less than obvious importance factors, you can use Paired Comparison Analysis to determine.
Step 4 Rate each option by how well it satisfies each factor. Score 0-poor, 3-very good. Begin with the first option and work across the row scoring each factor. It is ok for some options to have the same score.
Step 5 Multiply each score by the relative importance (weight) assigned in Step 3.
Step 6 Add the weighted scores for each option. The option with the highest score is your best option.

8 The Techniques
Grid Analysis
Example:
Dan uses his vehicle for business travel. He is also learning to surf and wants to select a new vehicle that he can use for both business travel and trips to the beach with his board. Also, he has always loved convertible sports cars. He is having difficulty deciding on a new vehicle.
He is considering 4 options:
1. SUV/4x4, hard-topped vehicle
2. Comfortable sedan
3. Crossover vehicle
4. Sports car
FACTORS: Cost Board Storage Comfort Fun Look Total
WEIGHTED 1-5 (importance to you)
4 5 1 2 3 4
Sports car 1 (4) 0 (0) 0 (0) 1 (2) 3 (9) 3 (12) 27
SUV/4x4 0 (0) 3 (15) 2 (2) 2 (4) 1 (3) 1 (4) 28
Sedan 2 (8) 2 (10) 1 (1) 3 (6) 0 (0) 0 (0) 25
Crossover 2 (8) 3 (15) 3 (3) 3 (6) 0 (0) 1 (4) 36
Given the weighted results of the factors, Dan should purchase the crossover vehicle.
0=poor match/undesirable 3=very good match/desirable

The Techniques 9
Grid Analysis
FACTORS: Data entry
Phone work
Generating reports
Problem solving
Total
WEIGHTED 1-5 (importance to you)
Accounts Receivable ( ) ( ) ( ) ( )
BCO Services ( ) ( ) ( ) ( )
Imaging ( ) ( ) ( ) ( )
Employee Activity—Using Grid Analysis
Now that you‟ve researched several departments, it‟s time to select the best choice. You are considering Accounts Receivable, BCO Services, and Imaging.
The Grid Analysis table below will aid in your decision-making process.
1. For each skill, determine its relative importance (weight) to you on a scale on 1-5. For less than obvious importance factors, you can use Paired Comparison Analysis to determine.
2. Rate departments by how well it satisfies/uses each skill from 0-undesirable/no use of skill to 3-desirable/great use of skill. Begin with the first department and work across the row. It is okay for some departments to have the same score.
3. Multiply each „desirable‟ score by the relative importance score (weight) calculated in Step 1. Write the resulting number inside the parenthesis.
4. Add the weighted scores (the numbers inside the parenthesis) for each department. The one with the highest score is your best option.
10
Landstar Educational Advantage Program
Grid Analysis
FACTORS: Dependability Organization Customer Service
Problem solving
Total
WEIGHTED 1-5 (importance to you)
Mary ( ) ( ) ( ) ( )
Jane ( ) ( ) ( ) ( )
Tom ( ) ( ) ( ) ( )
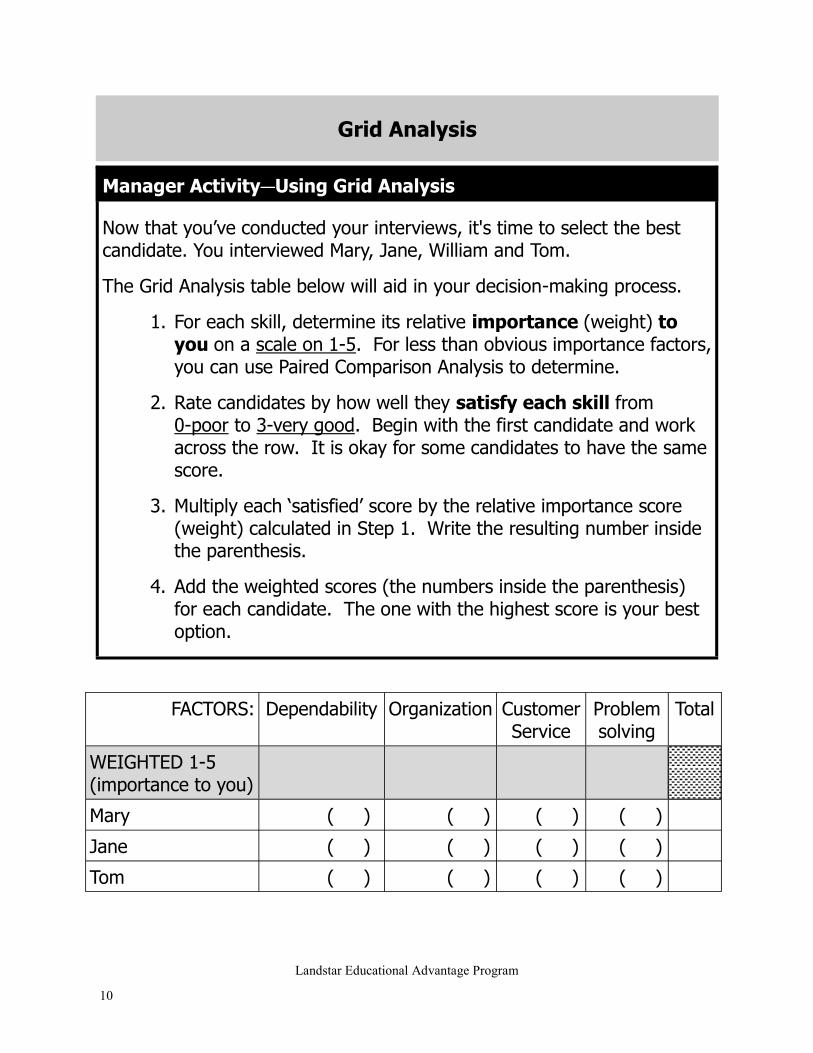
Manager Activity—Using Grid Analysis
Now that you‟ve conducted your interviews, it's time to select the best candidate. You interviewed Mary, Jane, William and Tom.
The Grid Analysis table below will aid in your decision-making process.
1. For each skill, determine its relative importance (weight) to you on a scale on 1-5. For less than obvious importance factors, you can use Paired Comparison Analysis to determine.
2. Rate candidates by how well they satisfy each skill from 0-poor to 3-very good. Begin with the first candidate and work across the row. It is okay for some candidates to have the same score.
3. Multiply each „satisfied‟ score by the relative importance score (weight) calculated in Step 1. Write the resulting number inside the parenthesis.
4. Add the weighted scores (the numbers inside the parenthesis) for each candidate. The one with the highest score is your best option.

The Techniques 11
Decision Trees
Decision Trees aid in decisions involving complex information and financial data. Decision Trees provide a balanced depiction of rewards and risk by associating the cost with each possible alternative.
Decision Tree
Creating the Decision Tree
Step 1 Draw a small square on the far left side of a large sheet of paper to represent the decision.
Step 2 From the box, draw out lines representing each possible solution. Be sure to keep space between the lines for the remaining steps.
Step 3 Consider the results of each line. If the result is uncertain, draw a circle. Draw lines to label the possible outcomes. If the result is another decision, draw a square. Write the new decision above the square. If you have arrived at a solution, leave the end of the line blank.
Step 4 Consider each square drawn in Step 3. Repeat Steps 2 and 3 for each square.
Step 5 Repeat Step 4 until all possible outcomes have been explored.

12 The Techniques
Decision Tree
Evaluating Decision Tree
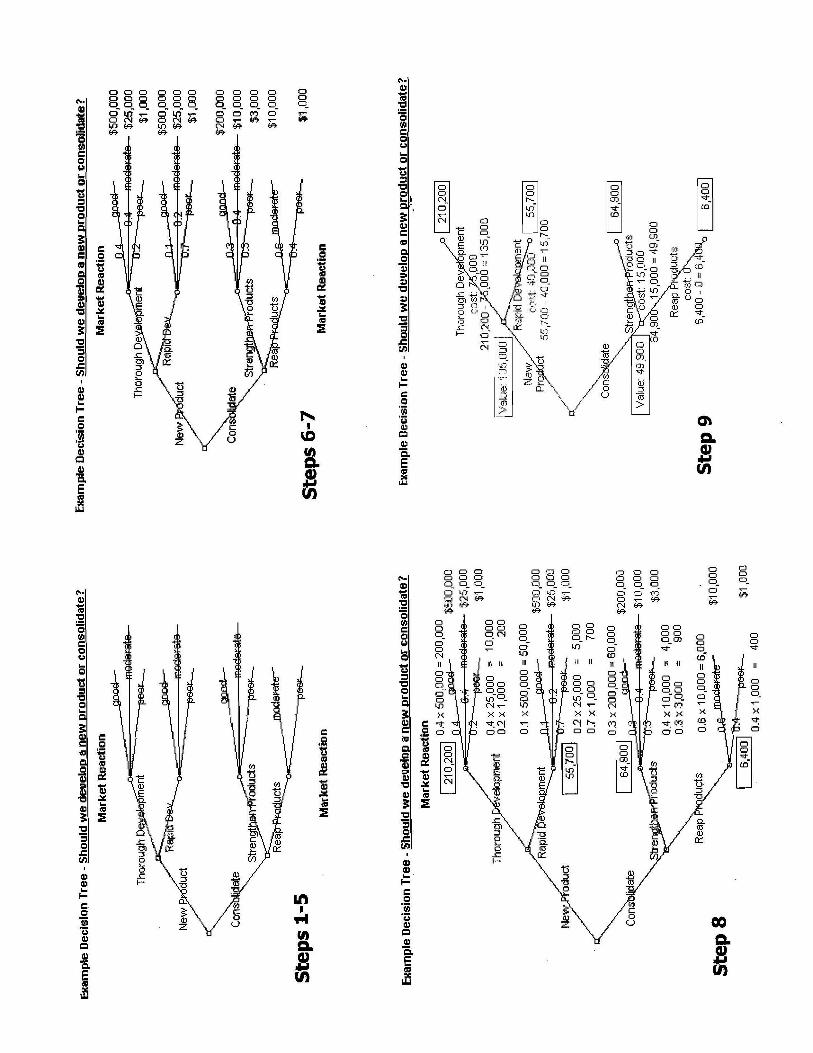
Step 6 Assign a cash value or score to each possible outcome.
Step 7 Review each circle (uncertainty points) and estimate the probability of each possible outcome (if using % should equal 100, if using fractions, should equal 1).
Calculating Decision Tree
Step 8 Begin on the right side of the tree, list calculations for each node (circle or square) in a box above the node. To calculate the possible outcomes (circles), multiply the dollar amount by the probability estimated in Step 7. The total for the node will be the total of these figures added together.
Step 9 List the cost of development/implementation of each node. Subtract this cost from the possible outcomes calculated in Step 8. The node with the greatest value will be the best option.
Decision Trees
Example:
Should we develop a new product or consolidate?
The Decision Tree for this question appears in stages on the next page.
The Techniques 13
Decision Trees
14 The Techniques
Force Field Analysis
Force Field Analysis examines the forces for and against a decision or change effort. The equilibrium, or present productivity level, can be altered if a change occurs in the driving or restraining forces. The driving forces are those which push a decision forward whereas restraining forces are those which create obstacles for the driving forces or decrease the driving forces.
Force Field Analysis
Step 1 On the worksheet, describe the decision point or proposed change in the center box.
Step 2 List all driving forces, or forces for the change in left column.
Step 3 List all restraining forces, or forces against the change in right column.
Step 4 Assign a score to each force from 1-weak to 5-strong.
Step 5 Add the scores. If the restraining forces outnumber the driving forces, the change may not be viable. If you‟ve already committed to proceeding with the change, now you can work on reducing the restraining forces or increasing the driving forces to make the change more viable.

The Techniques 15
Force Field Analysis
Example:
A director is contemplating if it is time to upgrade his factory with new manufacturing equipment.
The Force Field Analysis illustrates a greater force against the change. At this time, the director should decide to postpone the change.
1-5 1-5
Strength of force for/against change
1-weak 5-strong

16 The Techniques
Force Field Analysis
Forces FOR
change Score 1-5
Forces
AGAINST change
Score 1-5
Change proposal
Total
Total
Activity—Using Force Field Analysis
You are contemplating whether you should change a process. Select one of the following processes or create your own: create flex time (7-4, 9-6, etc. instead of 8-5); change lunch time to 30 minutes; begin electronic phone call log. A personal example might be to buy a new car.
The Force Field Analysis table below will aid in your decision making.
1. List all driving forces, or forces for the change in the left column.
2. List all restraining forces, or forces against the change in the right column.
3. Assign a score to each force from 1-weak to 5-strong to indicate the strength of the force for/against the change.
4. Add the scores. If the restraining forces outnumber the driving forces, the change may not be viable. If you have already committed to proceeding with the change, now you can work on reducing the restraining forces or increasing the driving forces to make the change more viable.
16
The Techniques 17
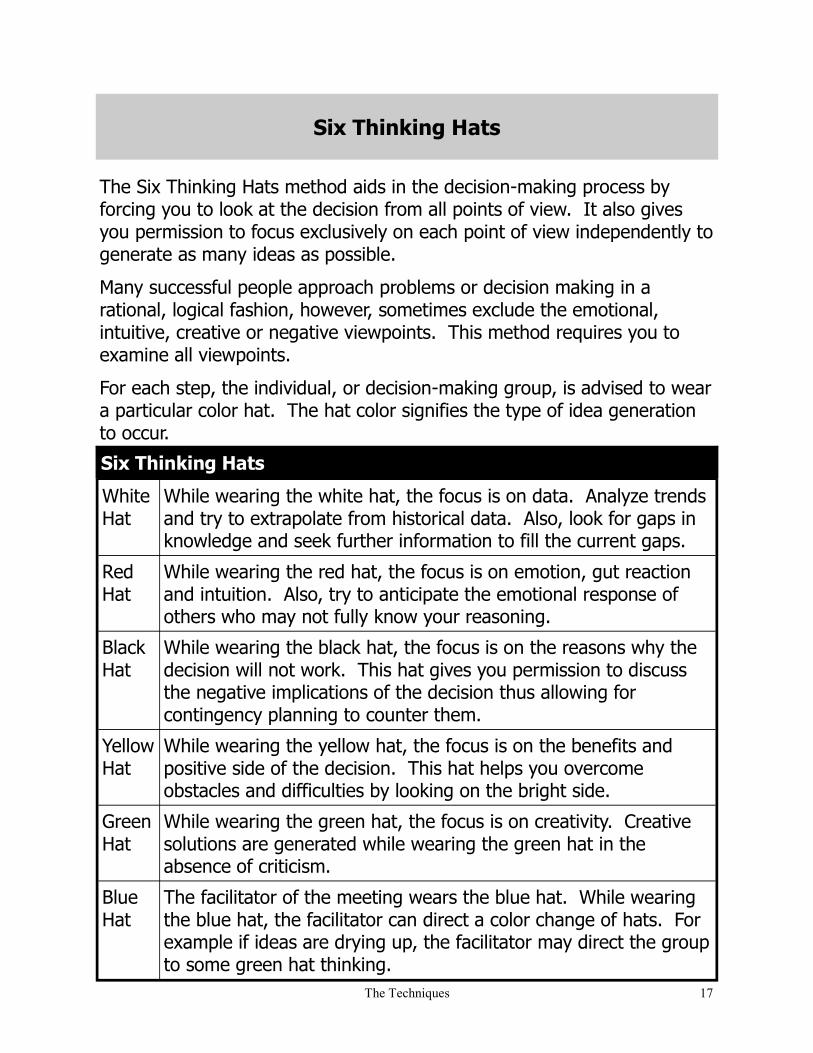
Six Thinking Hats
The Six Thinking Hats method aids in the decision-making process by forcing you to look at the decision from all points of view. It also gives you permission to focus exclusively on each point of view independently to generate as many ideas as possible.
Many successful people approach problems or decision making in a rational, logical fashion, however, sometimes exclude the emotional, intuitive, creative or negative viewpoints. This method requires you to examine all viewpoints.
For each step, the individual, or decision-making group, is advised to wear a particular color hat. The hat color signifies the type of idea generation to occur.
Six Thinking Hats
White Hat
While wearing the white hat, the focus is on data. Analyze trends and try to extrapolate from historical data. Also, look for gaps in knowledge and seek further information to fill the current gaps.
Red Hat
While wearing the red hat, the focus is on emotion, gut reaction and intuition. Also, try to anticipate the emotional response of others who may not fully know your reasoning.
Black Hat
While wearing the black hat, the focus is on the reasons why the decision will not work. This hat gives you permission to discuss the negative implications of the decision thus allowing for contingency planning to counter them.
Yellow Hat
While wearing the yellow hat, the focus is on the benefits and positive side of the decision. This hat helps you overcome obstacles and difficulties by looking on the bright side.
Green Hat
While wearing the green hat, the focus is on creativity. Creative solutions are generated while wearing the green hat in the absence of criticism.
Blue Hat
The facilitator of the meeting wears the blue hat. While wearing the blue hat, the facilitator can direct a color change of hats. For example if ideas are drying up, the facilitator may direct the group to some green hat thinking.
18 The Techniques
Six Thinking Hats
Example:
The Board of Directors is contemplating whether they should construct a new office building. The company is doing well and the current office space is becoming more crowded.
The Chair wears the Blue Hat to facilitate the meeting and guide the group to wear each color hat. The Chair also ensures the group stays focused on the designated color hat thinking without criticizing the contributions of others.
Looking at the situation with the White Hat, they analyze their data. They examine the trend in hiring. They anticipate that if the hiring trend continues, they may have to have employees share workstations on rotating shifts to create more space in the current building.
With Red Hat thinking, a few on the board are not pleased with the aesthetics of the proposed building. They wonder if quality employees will be attracted to a drab building.
Wearing the Black Hat, they wonder if the trend is reaching its peak. They worry that the economy is about to enter another downturn in which the staff will need to be reduced thus eliminating the need to construct a larger building.
Looking at the situation with the Yellow Hat, however, the trend will continue and the additional space will be needed.
Wearing the Green Hat they consider ways to make the building more attractive. They also consider alternatives, such as creating an evening shift.

The Techniques 19
Cost/Benefit Analysis
Cost/Benefit Analysis
Step 1 Using a common form of measurement, list the costs associated with the decision. When calculating the cost of labor, be sure to use the “fully burdened” labor rates, not just the employee‟s salary.
Step 2 Continuing with the common form of measurement, list the benefits associated with the decision.
Step 3 Subtract the figure from Step 1 from the figure from Step 2.
Step 4 The payback time or breakeven point is calculated by dividing the cost by the benefit.
Cost/Benefit Analysis will help you determine if the course of action you have chosen will be quantitatively beneficial to you. This method looks at the total benefits of a decision and the total costs to determine if the decision will be worthwhile for you. Cost/Benefit Analysis can vary from quite simplistic with just a running list of financial data to extremely complex with estimated costs of environmental impact and other intangibles.

20 The Techniques
Cost/Benefit Analysis
Example:
A sales director is deciding whether to implement a new computer-based contact management and sales processing system. Unfortunately, his team is not computer literate and they currently only have one computer. He knows a computer-based system would be more efficient however he is not sure if the cost outweighs the benefit.
Costs:
New computer equipment costs: 10 network-ready PCs with supporting software @ $2,450 each
1 server @ $3,500
3 printers @ $1,200 each
Cabling and installation @ $4,600
Sales support software @ $15,000
Training costs: Computer introduction-8 people @ $400 each
Keyboard skills-8 people @ $400 each
Sales support system-12 people @ $700 each
Other costs: Lost time: 40 man days @ $200/day Lost sales through disruption: estimate $20,000
Lost sales through inefficiency during first months: estimate
$20,000
Total cost: $114,000
Benefits: Tripling of mail slot capacity: estimate $40,000/yr
Ability to sustain telesales campaigns: estimate $20,000/yr
Improved efficiency/reliability of follow-up: estimate $50,000/yr
Improved customer service/retention: estimate $30,000/yr
Improved accuracy of customer information: estimate $10,000/yr
More ability to manage sales effort: $30,000/yr
Total benefit: $180,000/yr
Payback time: $114,000/$180,000 = 0.63 of a year = approx. 8 months 20

The Techniques 21
Intuitive Approach
Sometimes our gut reaction will reveal the decision we should make. This type of intuitive decision making stems from the right hemisphere of our brains. The techniques described previously possessed a more rational, logical approach stemming from the left hemisphere.
Activity—Intuition Experiment
Choose a problem that you have thought about recently. It may be a problem concerning other people in a group setting; it may be a question concerning career direction, job choice, or living arrangements. Sit in a comfortable position in a quiet place where you will not be disturbed. Relax for a few minutes by letting your mind wander and concentrate on your breathing. Imagine a picture of yourself once the problem has been solved. What will you be like? How will you be different? Fill in your picture with as much detail as you can, such as how you will be feeling, what you will be doing, saying, wearing, and so on. Your picture can be one snapshot or several frames, as in a movie.
Reflection:


![Crítica Ao 'O Capital' de Karl Marx - Prof. Vilfredo Pareto[1]](https://static.fdocuments.in/doc/165x107/55cf9134550346f57b8b7d4a/critica-ao-o-capital-de-karl-marx-prof-vilfredo-pareto1.jpg)