Parents Can Tell! Evidence on Classroom Quality ...
60
Parents Can Tell! Evidence on Classroom Quality Differences in German Primary Schools María Daniela Araujo P. and Johanna Sophie Quis Working Paper No. 172 August 2021 k* b 0 k B A M AMBERG CONOMIC ESEARCH ROUP B E R G Working Paper Series BERG Bamberg Economic Research Group Bamberg University Feldkirchenstraße 21 D-96052 Bamberg Telefax: (0951) 863 5547 Telephone: (0951) 863 2687 [email protected] http://www.uni-bamberg.de/vwl/forschung/berg/ ISBN 978-3-943153-93-4
Transcript of Parents Can Tell! Evidence on Classroom Quality ...
Parents Can Tell!
Evidence on Classroom Quality Differences
in German Primary Schools
María Daniela Araujo P. and Johanna Sophie Quis
Working Paper No. 172
August 2021
k*
b
0 k
BA
MAMBERG
CONOMIC
ESEARCH
ROUP
BE
RG
Working Paper SeriesBERG
Bamberg Economic Research Group Bamberg University Feldkirchenstraße 21 D-96052 Bamberg
Telefax: (0951) 863 5547 Telephone: (0951) 863 2687
[email protected] http://www.uni-bamberg.de/vwl/forschung/berg/
ISBN 978-3-943153-93-4
1
Parents Can Tell! Evidence on Classroom Quality Differences in German Primary Schools
María Daniela Araujo P.∗ University of Bamberg, Bamberg Graduate School of Social Science
Johanna Sophie Quis
University of Hannover, CHERH
The value-added to student achievement model has become a key tool for estimating the effects of individual teachers and their classrooms on students’ short-term academic success, and more importantly, on later-life outcomes. We use primary school data from the German National Educational Panel Study (NEPS) to estimate classroom effects on mathematical and language competence development, which are driven by teacher quality differences across classrooms. We estimate a value-added model with individual classroom fixed-, as well as random effects. Both model specifications apply empirical Bayes shrinkage to adjust the classroom effects’ estimates by their level of precision. Our results show substantial classroom effects and quality differences across the first grades of German primary school. One standard deviation increase in classroom effectiveness is associated with at least a 12 percent of a standard deviation increase in student mathematical competence scores, and at least 14 percent of a standard deviation increase in language competence scores. In addition, we find that none of the teacher characteristics typically used in teacher recruitment processes significantly explain the classroom quality differences. Interestingly, as parental assessment of teacher quality is the only indicator significantly associated with classroom effectiveness in language competence development, parents seem to be able to identify more effective language teachers.
JEL: I20, J45
Keywords: classroom effects, teacher effects, teacher value-added, Germany
1 INTRODUCTION
In the past 20 years, a growing body of economic literature on teacher and classroom effects
in the United States (US) has shown that high value-added teachers not only substantially
contribute to student learning, but also positively influence later-life outcomes such as college
∗ Corresponding address: University of Bamberg, Feldkirchenstr. 21, 96052 Bamberg, Germany. Phone: +49 (0)951/863-2603. E-mail: [email protected]. We would like to thank the Leibniz Institute for Educational Trajectories (LIfBi) for providing the data for this study. We also thank conference participants at the 5th International NEPS Conference, XXIX Meeting of the Economics of Education Association, and the Universities of Bamberg, Halle, Jena and Leipzig for helpful comments and discussions.
2
attendance and earnings (Hanushek and Rivkin, 2012; Jackson, Rockoff and Staiger, 2014;
Koedel, Mihaly and Rockoff, 2015; Strøm and Falch, 2020). It has also been found that easily
quantifiable teacher characteristics are weakly, or not at all associated with individual teacher
effects on student performance. This has led to the use of value-added measurements in
processes of teacher recruitment, evaluation and dismissal (Koedel, Mihaly and Rockoff, 2015;
Steinberg and Donaldson, 2016). Nonetheless, in the same period, there has been very little
research on teacher effectiveness and its educational or economic impact in Germany.
We address this gap and examine to what extent individual teachers impact the
mathematical and language competence development of their students in the first years of
primary school in Germany. For this purpose, we first build a short teacher panel with grade 1
and 2 data from the Starting Cohort 2 (SC2) of the German National Educational Panel Study
(NEPS). Then, for our estimation strategy, we show that there is no evidence for matching of
students to teachers based on ability in German primary schools. Subsequently, we estimate a
value-added to student competence development model using classroom fixed-, as well as
random effects, which are mainly driven by teacher quality differences across classrooms. Both
model specifications apply empirical Bayes shrinkage to adjust the classroom effects by their
level of precision. Our results show substantial individual classroom effects on math and
language competence development in the first grades of primary school. One standard
deviation increase in classroom quality is associated with at least 12 percent of a standard
deviation increase in student mathematical competence, and at least 14 percent of a standard
deviation increase in language competence, over a semester of instruction.
In addition, we examine the association between teacher characteristics and the estimated
classroom effects. We find that almost none of the teacher characteristics analyzed, including
gender, years of teaching experience, migration background, self-reported Abitur GPA, self-
reported First State Examination grade, whether the teacher has passed the Second State
Examination, teacher’s constructivist beliefs, or exhaustion levels, are significantly associated
with classroom quality, as measured by the individual classroom contribution to competence
development. Remarkably, parental assessment of teacher quality is the only indicator that
significantly explains the classroom effects on language competence.
This paper contributes to the literature in three ways. First, we present the first empirical
estimations of classroom effects on mathematical and language competence development in
primary school in Germany. Second, our results show that these classroom effects do not
correlate with characteristics typically used in teacher recruitment and tenure processes in
Germany, thus echoing previous findings in the US (Hanushek and Rivkin, 2012; Jackson,
3
Rockoff and Staiger, 2014; Koedel, Mihaly and Rockoff, 2015). Nonetheless, we find that, for
language competence development, parents seem to be able to identify more effective teachers
and their classrooms, adding to the new and growing evidence on the association between
parental and student evaluation and teacher quality (Araujo et al., 2016; Bacher-Hicks et al.,
2019). Third, our estimations add to the evidence showing the robustness of teacher and
classroom value-added estimates to different settings (Koedel, Mihaly and Rockoff, 2015;
Strøm and Falch, 2020).
The remainder of the paper proceeds as follows. In Section 2, we provide a background on
teacher and classroom effects’ research and the German Educational System. Section 3
discusses the data. Section 4 presents our value-added model and estimation strategy. In
Section 5, we present our results. Section 6 concludes.
2 BACKGROUND AND EVIDENCE
2.1 Teacher and Classroom Effects
In economics, the study of teacher effects, also referred to as teacher value-added, evaluates
the overall contribution of individual teachers to students’ human capital accumulation in a
specific time period (Hanushek and Rivkin, 2012; Jackson, Rockoff and Staiger, 2014; Koedel,
Mihaly and Rockoff, 2015). The teacher value-added research naturally evolved from the
education production function (EPF) literature, where, among other factors, teachers and their
characteristics are treated as inputs influencing students’ achievement, measured generally
through test scores. The value-added model specification differs from the regular EPF in the
inclusion of a lagged or baseline achievement measure, which is taken to be a sufficient statistic
for unobserved input histories, as well as the unobserved endowment of mental capacity (Todd
and Wolpin, 2003). The value-added specification of the EPF estimates individual teacher
effects via either fixed or random effects.
Most of the value-added literature stems from the US. Researchers have consistently found
substantial individual teacher contribution to student achievement, and significant variation
within this contribution (Rockoff, 2004; Nye, Konstantopoulos and Hedges, 2004; Rivkin,
Hanushek and Kain, 2005; Aaronson, Barrow and Sander, 2007; Kane and Staiger, 2008; Kane,
Rockoff and Staiger, 2008; Hanushek and Rivkin, 2010, 2012; Chetty, Friedman and Rockoff,
2014a, 2014b; Jackson, Rockoff and Staiger, 2014; Koedel, Mihaly and Rockoff, 2015).
4
Estimations of the distribution of teacher effectiveness or value-added1 in the US have
generated an average standard deviation of 0.17 for math, and of 0.13 for reading, expressed in
units of normalized student achievement (Hanushek and Rivkin, 2010). These estimates are
relatively large compared to other interventions in educational production, and consequently,
have provided evidence that teacher quality is an important determinant of short-term academic
success (Koedel, Mihaly and Rockoff, 2015). Moreover, it has been shown that high value-
added teachers positively affect later-life outcomes including college attendance, income2, and
teenage pregnancy (Chetty, Friedman and Rockoff, 2014b).
While a distribution in teacher effectiveness emerges from the value-added studies, the
mechanisms by which good teachers outperform poor teachers are less clear. Most studies have
shown that easily quantifiable teacher characteristics are consistently either weakly or not at
all associated with teacher value-added (Hanushek and Rivkin, 2012; Jackson, Rockoff and
Staiger, 2014; Strøm and Falch, 2020). In this context, the use of value-added estimations to
evaluate teachers and improve teacher workforce quality is appealing, and hence is growing
(Hanushek, 2011; Koedel, Mihaly and Rockoff, 2015; Steinberg and Donaldson, 2016). By
2014, about 80 percent of states implementing new teacher evaluation systems in the U.S. had
incorporated one or more measures of teacher performance based on student test scores, and
around 30 percent had implemented teacher value-added estimates (Steinberg and Donaldson,
2016).
Critics of value-added modeling have argued that resulting teacher effects' estimates may
be biased due to non-random assignment of students to teachers (Rothstein, 2009, 2010; Paufler
and Amrein-Beardsley, 2014; Guarino, Reckase and Wooldridge, 2015). Nonetheless, studies
that compare teacher value-added estimates obtained in quasi-experimental or experimental3
settings with those of non-experimental settings, have consistently found that teacher value-
added measures are unbiased predictors of teachers’ impacts on student achievement, and that
the scope for bias is quite small and statistically insignificant (Kane and Staiger, 2008; Kane et
al., 2013; Bacher-Hicks, Kane and Staiger, 2014; Chetty, Friedman and Rockoff, 2014a;
Bacher-Hicks et al., 2019). The inclusion of student baseline achievement measures seems to
1 Most estimates rely on within-school variations (Hanushek and Rivkin, 2010) and have focused on elementary and middle school grades because of the availability of standardized testing data (Jackson, Rockoff and Staiger, 2014). 2 Chetty, Friedman, and Rockoff (2014b) found that replacing a teacher whose value-added is in the bottom 5 percent of the distribution with an average teacher for one year, would increase the present value of students’ lifetime income by approximately $250,000 per classroom. 3 In experimental settings, students are randomly assigned to their teachers at the beginning of the school year.

5
be the key behind the unbiased estimation of teacher effects (Kane and Staiger, 2008; Chetty,
Friedman and Rockoff, 2014a).
Another central concern regarding teacher value-added estimations is their stability or real
persistence over time (Koedel, Mihaly and Rockoff, 2015; Bitler et al., 2019). Critics warn that
if teacher effect estimates are not stable over time, their contribution to teacher quality and
accountability policies should be limited. In this context, researchers have shown that
increasing teacher-level sample sizes (students per teacher) and using multiple years of
classroom data improves the predictive value of past teacher value-added over future value-
added4 (McCaffrey et al., 2009; Goldhaber and Hansen, 2013; Bitler et al., 2019). Moreover,
the literature currently discriminates between the persistent teacher effect, estimated with at
least two classrooms per teacher, and the teacher-classroom effect, also referred to as the
classroom effect, estimated with only one year of classroom data per teacher (Chetty, Friedman
and Rockoff, 2014a; Jackson, Rockoff and Staiger, 2014; Araujo et al., 2016). Thus, the
classroom effect includes not only differences in teacher effectiveness across classrooms, but
also random classroom shocks.5
2.2 Teacher and Classroom Effects in Germany
Research related to teacher and classroom effects in Germany is scarce. A major limitation
has been the relatively recent introduction of standardized competence tests, which are
comparable among federal states for specific grades in primary and secondary schools in
Germany.6 An additional problem has been the lack of publically available teacher panel data.
Jürges and Schneider (2007) attempt to estimate a first ranking of German teachers based
on their individual contributions to students’ reading performance in grade 4, using cross-
sectional data from PIRLS 2001.7 The authors calculate individual teacher random effects by
estimating a variance component model of an EPF that takes into account information on
4 Nonetheless, this improvement seems to be non-linear when including data from additional years, unless older data are properly down-weighted (Goldhaber and Hansen, 2013; Chetty, Friedman and Rockoff, 2014a). 5 Classroom shocks could include particularly disruptive students or events in the specific classroom during the school year or the days in which students were tested. 6 Starting in 2006, universal written comparison tests of math and language for students in grade 3 and grade 8 (VERA) were introduced in Germany, as a consequence of the comprehensive strategy for educational monitoring adopted by the Conference of the Ministers of Education and Cultural Affairs (Kultusministerkonferenz [KMK]) (KMK, 2015). In addition, in 2011, the National Educational Panel Study (NEPS) started operating as the first large-scale panel study on educational decisions and outcomes in Germany (Blossfeld, Roßbach and von Maurice, 2011). 7 The Progress in International Reading Literacy Study (PIRLS) 2001 tested the reading literacy of students aged 9 to 10 in 35 countries, including Germany. The study sample of Jürges and Schneider (2007) consisted of 4,964 students and 279 teachers.
6
student socio-economical background. In addition, they implement a Hausman-Taylor
estimator in order to account for possible endogeneity caused by potential non-random
assignment of teachers to classrooms and students. Subsequently, the authors present a quality
ranking of teachers that consists of teachers significantly above the average, those significantly
below the average, and those indistinguishable from the average. Finally, Jürges and Schneider
suggest that their model estimation of teacher quality could represent a first step in the
development of performance-based payment schemes in Germany. A serious weakness of their
study, however, is the lack of a student baseline test score, which is a fundamental measurement
for the teacher value-added model and the estimation of reliable teacher effects.8 In addition,
because the authors’ data had only one classroom per teacher, instead of a quality ranking of
teachers, their estimates actually correspond to a quality ranking of classrooms driven by
teacher contribution to student performance.
A small number of studies have investigated whether specific teacher characteristics can
explain between-classroom variation in student achievement gains using multilevel structural
equation models in the German school context (Baumert et al., 2010; Kunter et al., 2013). This
between-classroom variation can also be interpreted as a random estimate of classroom effects
measured in units of student achievement gains. Baumert et al. (2010) use a representative
sample of grade 10 classes from the COACTIV study9 to examine the influence of teachers’
content knowledge10 and pedagogical content knowledge11 on instructional quality and student
progress in math. For their estimation strategy, Baumert et al. implement a two-level structural
equation model where the variance in math achievement is decomposed into a within-
8 Jürges and Schneider (2007) argue that they can attribute learning progress to the individual teachers in their sample, because in German primary schools, students typically stay with the same teacher for up to 4 years. The class teacher teaches most or all subjects, and school choice is very limited. 9 The Cognitive Activating Instruction and Development of Students’ Mathematics Literacy (COACTIV) study was conducted in Germany between 2003 and 2004 as an extension to the Programme for International Student Assessment (PISA) 2003 of the Organization for Economic Co-operation and Development (OECD). It extended the original PISA cross-sectional design to a grade-base study comprising a one-year period from the end of grade 9 to the end of grade 10. Students from the study sample were administered achievement tests at the end of grade 9 and 10, as well as questionnaires assessing their cognitive ability, mathematics instruction and family background. The COACTIV study also applied tests of content and pedagogical content knowledge to the math teachers of the study sample. A total of 181 teachers, 194 classrooms and 4,353 students participated in the study (Baumert et al., 2010). 10 Teachers’ mathematical content knowledge was assessed with a paper-and-pencil test that covered conceptual topics that are compulsory from grade 5 to 10 (Baumert et al., 2010). 11 Teachers’ mathematical pedagogical content knowledge was assessed in three dimensions: first, the “tasks” dimension which assessed teachers’ ability to identify multiple solution paths; second, the “students” dimension which evaluated their ability to recognize students’ misconceptions, difficulties, and solution strategies in the context of classroom situations; and third, the “instruction” dimension which assessed teachers’ knowledge of different representations and explanations of standard mathematics problems within classroom situations (Baumert et al., 2010).
7
classroom or individual level component, and a between-classroom or classroom level
component. At the individual level, the model takes into account student baseline achievement
in math and reading (grade 9)12, as well as other cognitive and socioeconomic characteristics
as explanatory variables. Subsequently, the between-classroom variance is explained by
classroom track (academic or non-academic), and teacher mathematical content knowledge and
pedagogical content knowledge. Baumert et al. point out that controlling for academic track at
the classroom level is highly relevant because, even though teachers are centrally assigned to
schools by federal states, their allocation to school tracks is determined by their choice of
teacher training program.13 The authors’ results show that, once student individual
characteristics are taken into account, a maximum of 4.6 percent of the variance in math
achievement can be explained by differences at the classroom level. Moreover, they find a
significant and substantial positive effect of teacher content knowledge and pedagogical
content knowledge on the between-classroom variation in students’ math achievement gains,
with pedagogical knowledge having the greater predictive power for student progress.14
Kunter et al. (2013) complement the study of Baumert et al. (2010) by examining, in
addition to pedagogical content knowledge, the impact of teachers’ constructivist beliefs15,
enthusiasm for teaching16, and self-regulation17 on student mathematical learning in grade 10.
Their research also uses data from the COACTIV study and implements two-level structural
equation models, which include student baseline achievement in math (grade 9). Surprisingly,
the model does not take into account tracking into academic and non-academic secondary
schools and classrooms. Kunter et al.’s findings indicate that students whose teachers had better
pedagogical content knowledge, endorsed constructivist beliefs, and were enthusiastic about
teaching showed significantly higher achievement gains in mathematics. Thus, these
12 The authors acknowledge that by grade 10, students had already been allocated to academic and non-academic secondary tracks based on their performance and general ability in Germany. They therefore highlight the importance of introducing baseline achievement in the model to account for the sorting process. 13 In Germany, universities offer different teacher education programs that correspond to the tracking system implemented after grade 4 (Baumert et al., 2010; KMK, 2019). 14 Teacher pedagogical content knowledge alone explained around 39 percent of the between-classroom variation in achievement gains at the end of grade 10. 15 In the study, constructivist beliefs are described as conceptions that endorse the principals of active and constructive learning in the classroom. They contrast with the transmissive beliefs that tend to treat students as passive receivers of information. Constructivist beliefs were assessed using three subscales which measured the degree to which teachers understood mathematical knowledge as process, favored independent and insightful discursive learning, and thought it important to foster students’ mathematical independence (Kunter et al., 2013). 16 Enthusiasm for teaching is defined as enjoyment of teaching activities. It was measured with on a short scale of two items developed by the COACTIV study (Kunter et al., 2013). 17 Self-regulation is described as teachers’ ability to engage while simultaneously monitoring their behavior and copping with stressful situations. Self-regulatory style was measured using a procedure developed by Klusmann et al. (2008) based on eight subscales from the Occupational Stress and Coping Inventory (Kunter et al., 2013).
8
characteristics were positively associated with the between-classroom variation in student
achievement. Their analysis also shows that teachers’ self-regulation had no direct effect on
student outcomes. In addition, they find that teachers’ general cognitive ability, measured by
their self-reported grade point average (GPA) at the university entry qualification Abitur, was
unrelated to student achievement.
Enzi (2017) reports a first attempt to estimate the distribution and average value-added of
language and math teachers in German secondary schools. He uses three-year data of students
and their teachers from the Starting Cohort 3 (SC3) of the NEPS. The study sample is limited
to students that shared the same math or German language teacher in grades 5 and 6.18 In his
analysis, Enzi estimates a teacher value-added model where students’ language and math
competence scores in grade 7 are explained by two-year lagged student test scores (grade 5),
contemporaneous student and family background inputs and teacher fixed effects. Using the
teacher fixed effects’ estimates, he generates distributions of teacher quality for math and
language, and reports standard deviations of 0.134 and 0.155 respectively. Since competence
tests for grade 7 were administered by the NEPS in the first semester of the school year, the
teacher effects are attributed to teachers who taught math or language between grades 5 and 6.
This is a serious weakness in the study because students in grade 7 had already been exposed
to other math and language teachers for between two and five months (NEPS, 2019b). Thus,
the effects of grade 6 and grade 7 teachers are unfortunately confounded. Another problem in
the estimation is that it does not control for tracking of students into academic and non-
academic secondary classrooms.
In addition, Enzi stresses that his results are upper-bound estimates because he neither
applies Empirical Bayes shrinkage to adjust the teacher effect estimates by their level of
precision, nor takes into account classroom or peer effects, and only observes one teacher per
classroom. Given the absence of a shrinkage process, Enzi does not attempt to explain the
teacher value-added estimated with specific teacher characteristics and opts to introduce them
instead of the teacher fixed effects in his original model. As a result, he finds some evidence
that teachers’ self-reported Abitur GPA is associated with student competence gains in math,
but only at the 10 percent significance level. In his nonlinearity analysis, Enzi also suggests
that teachers’ First and Second State Examination grades might be associated with competence
gains in math for the best quartile of teachers, yet only at the 10 percent significance level.
18 The student sample consisted of 1,939 students for language and 2,329 students for math. The total teacher sample consisted of 211 language teachers and 197 math teachers (Enzi, 2017).
9
Nonetheless, these associations only hold when Abitur GPA and the First and Second State
Examination grades are introduced in three independent regression models. Any potential
effect disappears when all three grades are taken into account in the same model.
As shown, research on teacher and classroom effects in Germany has relied on cross-
sectional data or relatively small student panel samples, which has imposed limitations to its
development and potential contribution. In addition, the literature has mainly focused on the
lower secondary level, when tracking into different school types based on students’ cognitive
skills and families’ background has already taken place, with potential negative implications
for the estimates of teacher and classroom effects. Our research, on the one hand, partially
overcomes the data limitation by generating a rich short-panel of teachers and their students
between grades 1 and 2 from the NEPS SC2. On the other hand, our research contributes to the
existing literature by examining for the first time the distribution of classroom effects driven
by teacher quality in the first years of the German primary school system. These are pre-
tracking years, in which educational quality is particularly critical for the development of
children’s cognitive and non-cognitive skills, and consequentially later-life outcomes (Cunha,
Heckman and Schennach, 2010; Heckman, Pinto and Savelyev, 2013; Elango et al., 2016;
García et al., 2020). Finally, our research takes into account, for the first time, the effect of
institutional differences among federal states on the estimation of the classroom effects.
2.3 The German Educational System19
In Germany, the 16 federal states determine education policies. The Conference of the
Ministers of Education and Cultural Affairs (Kultusministerkonferenz [KMK]), a commission
of the relevant ministers from the federal states, sets the framework within which the federal
states then decide upon different policies. The following paragraphs give a broad explanation
of the system, but it should be noted that in some aspects the number of federal states diverge
from the description.
Full-time school attendance is compulsory for nine to ten years. Children normally start
school aged six. Following comprehensive primary schooling, which typically encompasses
four (but sometimes six) years, children are sorted into different tracks for secondary schooling.
This tracking process is based on an overall school assessment of children’s aptitudes,
accompanied by consultations with their parents. Historically there have been three tracks in
19 For a comprehensive explanation of most facets of the German Education System please refer to KMK (2019), the official publication used to develop this section.
10
all federal states: the lower vocational track, the Hauptschule, an intermediate vocational track,
the Realschule, and the academic track, the Gymnasium. In addition, most federal states have
some form of comprehensive schooling, where more than one type of school-leaving certificate
is offered. Only the Gymnasium and some comprehensive schools directly lead to the
university entry qualification, the Abitur. The Abitur GPA summarizes the students’ final
grades from the last four semesters of schooling and from the exit examinations.
Prospective teachers have to attend a teacher training at a university or college. Typically,
the course of studies already determines the school type at which the prospective teacher will
work.20 The federal states regulate the details of two stages of the teacher training, which
consist of theoretical education at the university (including periods of practical training), and
practical training in a school setting. The First State Examination, equivalent to Bachelor or
Master’s examinations, depending on the federal state,21 marks the end of the first stage of
teacher training. The examination thus covers theoretical knowledge in educational science,
subject knowledge, and pedagogics. After the First State Examination, prospective teachers
proceed to the preparatory service (Vorbereitungsdienst), where they continue to train in
teacher training institutes (Studienseminare) and simultaneously work increasingly
independently as teachers at schools. Subsequently, teachers become fully qualified upon
passing the Second State Examination.22
In a next step, young teachers apply for permanent employment in the public sector by
sending their application to either the Ministry of Education23, or the relevant school
supervisory authority in the federal state. Placement decisions are made centrally by the
relevant authority based on vacancies and on the applicant’s aptitude, qualifications and record
of achievements. Sometimes specific schools advertise positions. In this case, the school might
also be involved in the selection process, but the Ministry or school authority always hires the
teacher. The demand for teachers differs by subjects, school types and across the different
federal states. This implies no legal entitlement to a teacher position for qualified teachers.
Most federal states appoint teachers as civil servants on probation, followed by a lifelong civil
20 Primary school teachers attend training programs specialized in primary school, or primary and lower secondary school types. 21 Each federal state decides whether the teacher training programs are concluded with a state examination at the Bachelor level, or if they follow the graduated structure of higher education studies, where the Master’s degree replaces the First State Examination as a rule. 22 The Second State Examination usually consists of four parts: (i) a written paper relating to educational theory, pedagogic psychology, or didactics of a subject studied; (ii) a practical teaching examination or demonstration class; (iii) an examination of educational theory, legislation or school administration; and (iv) an examination of didactic and methodological issues in the subjects studied. 23 Full name: Ministry of Education and Cultural Affairs.

11
servant appointment after successful completion of the probation phase. Some federal states
also employ teachers as regular salaried employees.24 Berlin and Saxony only employ teachers,
and do not appoint them as civil servants.
Once appointed as a civil servant or employed, most federal states only allow a promotion
to a higher salary group if the teacher also takes on new responsibilities or a new position.
Changes to a different school within or across federal states are possible, but teachers need to
ask for permission from the relevant Ministry of Education or school supervisory authority and
the desired school needs to have a suitable vacant position. Therefore, teachers only have
limited scope to choose their schools.25
3 DATA
3.1 National Educational Panel Study (NEPS):
The NEPS is a large-scale panel study on educational decisions and outcomes in Germany
(Blossfeld, Roßbach and von Maurice, 2011). In order to depict all age groups without waiting
for an entire lifespan, the NEPS consists of six different starting cohorts from newborns to
adults, each a representative sample of the relevant cohort.
In our analyses, we rely on data from the Kindergarten SC226. The Kindergarten Cohort
initially consists of a target population of kindergarten children at age four, who are
longitudinally followed into primary school and beyond. The NEPS SC2 sample was drawn in
a multi-stage approach, where institutions were drawn in a first step and children in a second.
First, a nationally representative sample of German primary schools was chosen, which formed
the basis for the subsequent grade 1 survey (wave 3). Then, these elementary schools were
connected to all kindergartens from which first grade students typically came, and a random
sample of these linked institutions was drawn for the first kindergarten survey (wave 1).
Between the last kindergarten year and the first grade of primary school, there was substantial
panel attrition and subsequent student resampling. Aiming to achieve a sufficiently large and
24 This may be the case for substitute teachers, who are hired to cover for sickness or parental leave and thus are only hired temporarily. Some teachers also do not meet the requirements for becoming a civil servant, e.g. because they are not healthy enough. In this case, they can also be employed as salaried personnel. 25 However, since placement decisions are partially determined by teacher qualifications, exceptionally good teachers might have better chances to be placed in a school or region of their liking. 26 This paper uses data from the National Educational Panel Study (NEPS): Starting Cohort Kindergarten, doi:10.5157/NEPS:SC2:9.0.0. From 2008 to 2013, NEPS data was collected as part of the Framework Program for the Promotion of Empirical Educational Research funded by the German Federal Ministry of Education and Research (BMBF). As of 2014, NEPS has been carried out by the Leibniz Institute for Educational Trajectories (LIfBi) at the University of Bamberg in cooperation with a nationwide network.
12
representative sample, we refrain from using kindergarten data as a baseline, and instead focus
our analyses on measurements in grades 1 and 2 of primary school, which correspond to waves
3 and 4 of the Kindergarten SC2.
The NEPS data is well suited for our analyses because it contains children’s competence
measurements and survey information from the children, their parents, classrooms, teachers
and schools. Participating children completed tests in various competence domains: math,
grammar27 and science in grade 1, and math and early reading in grade 2. Based on these tests,
the NEPS provides weighted maximum likelihood estimates (WLE) as measures of children’s
competences for math, grammar and science, which are normally distributed and have been
standardized by grade to have a zero mean and a unit standard deviation.28 A raw measurement
of early reading competence29 in grade 2 is also provided. We standardized it to have a zero
mean and a unit standard deviation.
Math and early reading competences in grade 2 are the outcome variables of our value-
added estimates, and math, grammar and science competences in grade 1 are the baseline
measurements.30 The NEPS math competence tests in grade 1 and 2 were designed in such a
way that scores derived in different waves relate to the same scale and allow an accurate
competence measurement within each age group across grades; accordingly, tests are
comparable across grades.31 Early reading competence was not measured in grade 1. For that
reason, we use the grammar test as the closest measurement of children’s baseline language
competence. Competence tests were administered during the second semester of the 2012-2013
27 The grammar test corresponds to listening comprehension at sentence level for first grade children. 28 Weighted maximum likelihood estimation (WLE) is an application of the Item Response Theory, which delivers unbiased estimates of competence parameters. The NEPS’s WLE estimates are calculated following the procedure outlined by Warm (1989). The NEPS SC2 data provides uncorrected and corrected WLE estimates of math and science competence for grade 1, and of math competence for grade 2. Uncorrected WLE estimates of grammar competence for grade 1 are also provided. Corrected WLE estimates correspond to the uncorrected WLE estimates standardized by grade to have zero mean and a unit standard deviation. We normalize the uncorrected WLE estimates of grammar competence for grade 1 to obtain the corrected WLE estimates. Corrected and uncorrected WLE competence estimates have a Pearson correlation of 1.0 per grade, which thus means that they represent the same variable. NEPS recommends using uncorrected WLE estimates for longitudinal comparison of competence development between grades, and corrected WLE estimates for cross-sectional research questions (Schnittjer and Gerken, 2018). In our value-added regression analysis, nonetheless, the inclusion of corrected or uncorrected WLE estimates produce the same results. We opt to present results from corrected WLE estimates in order to facilitate interpretation and comparability with other studies. 29 Early reading competence was measured using the ELFE test (Lenhard and Schneider, 2006). NEPS provides a sum scoring of the test following the test authors’ recommendation. 30 Base on the findings of Chetty, Friedman and Rockoff (2014a), Lockwood and McCaffrey (2014) among others, we use multiple baseline tests scores in the same and other subjects to increase the precision of our estimates. 31 For technical details on the linking procedures of math competence see Fischer et al (2016), Schnittjer and Fischer (2018) and Schnittjer and Gerken (2018).
13
school year in grade 1, and during the first semester of the 2013-2014 school year in grade 2,
with a span of 6 to 9 months between tests for most of the students.
The NEPS survey data also provides information on child age, gender, migration
background and number of siblings, parent years of education32 and International Socio-
Economic Index of Occupational Status (ISEI).33 In our analysis, migration background is a
dummy variable that takes the value of one if at least one parent was not born in Germany. We
generate the variables parent years of education and ISEI as the highest value among parents
in the household.
In addition to the child and parental data, the NEPS provides rich information on
classrooms and teachers, which is crucial for identifying potential factors defining teacher
quality. The teacher characteristics included in our analysis are gender, years of teaching
experience, migration background, self-reported Abitur GPA, self-reported First and Second
State Examination grades, whether the teacher has passed the Second State Examination,
constructivist beliefs, exhaustion levels, and parental evaluation of teacher quality.
We calculate teacher years of experience as the time difference between the NEPS survey
year and the year of the Fist State Examination for each teacher.34 In our analysis, a teacher
has migration background if she gives a positive answer to this question and indicates that she
or at least one of her parents was not born in Germany. In addition, self-reported Abitur GPA
and First and Second State Examination grades are measured on a scale from 1.0 to 4.0, with
1.0 being the best possible grade, and 4.0 the minimum passing grade. We standardize these
self-reported grades to have zero mean, and one unit standard deviation with respect to the full
sample of teachers.
Following Kunter et al.’s (2013) findings, we build indicators of teacher constructivist
beliefs and teacher exhaustion (as opposed to enthusiasm for teaching). Our indicator of teacher
constructivist beliefs is based on four items35 available in the NEPS classroom survey of grade
32 Years of education are estimated by the NEPS as a function based on the Comparative Analysis of Social Mobility in Industrial Nations (CASMIN) (Zielonka and Pelz, 2015), which is an internationally comparable educational classification developed in Germany (König, Lüttinger and Müller, 1988; Lechert, Schroedter and Lüttinger, 2006). 33 The International Socio-Economic Index of Occupational Status (ISEI-08) is estimated from the International Standard Classification of Occupations (ISCO-08). 34 Alternatively, we estimated years of experience as the time between the panel survey year and teacher’s Abitur year plus three years of university instruction. Both measurements have a correlation of 0.968, with the first measurement being our preferred estimation. 35 Items corresponded to: (i) my role as a teacher is to make it easier for the students to investigate and explore things; (ii) students will learn best when they try to find solutions to problems independently; (iii) students should be given the possibility to reflect on solutions themselves before the teacher shows the approach to the solution; and (iv) thinking and reasoning processes are more important than specific content of the syllabus.
14
1 for this purpose, which are taken from the constructivist scale of the TALIS-2008 study
(Demmer and von Saldern, 2010; Organisation for Economic Co-Operation and Development
[OECD], 2010). Teachers indicated their level of agreement with all items on a 4-point Likert
scale. We enter the answers into an index, which is standardized to have zero mean and unit
standard deviation with respect to the full sample of teachers. In order to generate our indicator
of teacher exhaustion, we use a short scale of two items available in the NEPS classroom survey
of grade 2, which asked teachers whether they felt often exhausted at school and if their
workload was too heavy. Teachers indicated their level of agreement with the two items on a
5-point Likert scale, which we use to generate an index standardized to have zero mean and
unit standard deviation with respect to the full sample of teachers.
Finally, in the NEPS parent survey of grade 2, families were asked to indicate their level
of agreement on whether their school’s teachers tried to meet children’s needs using a 4-point
Likert scale. We use this information to generate a parental evaluation of teacher quality
indicator, following recent literature on whether parents can discriminate between good and
poor teachers (Araujo et al., 2016), and taking into account the growing international policy
efforts to incorporate parent perspectives into teacher quality assessments (Steinberg and
Donaldson, 2016; Fernández, LeChasseur and Donaldson, 2018). Our indicator corresponds to
the average classroom assessment of the parents for each teacher. We normalize it to have zero
mean and unit standard deviation with respect to the full sample of students.
At the classroom level, we have access to data on classroom size and proportion of female
students, based on information of the full classroom as opposed to the NEPS student sample.
In addition, we calculate the average ISEI of children in the classroom based on the sample of
parents who participated in the NEPS survey.
We include students in the analysis sample if we can link them to a classroom with a teacher
unique identifier. Additionally, we require children to be taught by the same teacher in grade 1
and grade 236, for there to be at least 5 students per teacher for the value-added analyses, and
no missing information on any of the variables used for value added estimations. We also
exclude children with special needs. This results in an analysis sample of 1,843 students and
251 teachers in the math sample, and 1,753 students and 240 teachers in the language sample.
36 We apply this restriction because the NEPS competence tests in grade 1 and grade 2 of the SC2, were not applied right at the beginning or the end of the respective school year, but in the middle of it. In this context, competence growth can only be attributed to teachers who had the same group of students in grades 1 and 2.
15
3.2 Descriptive Statistics
Descriptive statistics are provided in table 1 for students and in table 2 for teachers. In both
tables, Column (1) depicts descriptive statistics for the full NEPS SC2 sample of 4,564
children, whom we can link to their respective teacher and classroom data, and 680 teachers.37
Columns (2) and (6) show descriptive statistics for the dropout sample, for math and language
respectively. Likewise, Columns (3) and (7) present descriptive statistics for the math and
language analysis sample. Column (4) and (8) display the difference between the dropout and
the analysis samples, and the respective p-value from a t-test for equality, for math and
language respectively. Finally, columns (5) and (9) present the normalized difference as
suggested by Imbens and Wooldridge (2009).38
As indicated, table 1 depicts the descriptive statistics of students for the math and language
analysis samples. The variables always correspond to grade 2 unless otherwise stated. Children
in the analysis samples are roughly 7.5 years old, half are female, and a fifth have a migration
background. The average highest years of education among parents in the household is about
15 years, equivalent to a vocational training degree after completion of Abitur in the CASMIN
classification (Zielonka and Pelz, 2015). The mean highest ISEI among parents is around 61,
which corresponds to a medium-high level. Children in the analysis samples have on average
one sibling. While the t-tests show some differences between the analysis and the dropout
samples, the criterion for a substantial difference according to Imbens and Wooldridge (2009)
is not met by any of the variables in the math or language samples. It is, however, close to the
cutoff for the difference in grammar competence in grade 1, which implies a slightly better
qualified analysis sample.
Regarding the teacher descriptive statistics, table 2 provides the respective numbers for the
math and language analysis samples. More than 90 percent of the primary school teachers in
our analysis samples are female. While this number seems strikingly high at first sight, official
numbers confirm that roughly 90 percent of primary school teachers in Germany are female
(Statistisches Bundesamt, 2019). Teachers are on average 47 years old, they have around 22
years of experience and practically all of them have the Abitur. The average self-reported
37 This implies a lower number of observations for a number of variables due to missing data in the columns for the full sample and the dropout sample. The number of observations is stable over all variables in the student analysis sample, as we require information on all variables in the analyses for inclusion. 38 A t-test might imply a statistically significant difference between samples, because of sample size or variable scaling, even though the samples are not substantially different from each other (Imbens, 2015). The normalized difference frees the sample comparison from sample size and scale of the variables, by correcting the difference between samples by their respective standard deviation. Imbens and Wooldridge (2009) suggest a substantial difference between the samples if the normalized difference exceeds 0.25 or -.25.
16
Abitur GPA is around 2.4, equivalent to a good achievement in the German grading system.
Self-reported First and Second Examination Grades are on average around 2.0, which also
represents a good performance. Four out of five teachers in the samples have already passed
their Second State Examination or equivalent. About six percent of teachers have a migration
background in the math analysis sample, and seven percent in the language sample. The
average non-standardized constructivist beliefs index has a rather high value, with 3.38 points
out of 4 possible. On average, the non-standardized exhaustion index has a moderate value of
2.89 points out of 5 possible. Parental evaluation of teacher quality also is high, with an average
of 3.60 out of 4. Finally, the mean class size is around 22 students. Once again, even though
the t-tests show significant differences between the analysis and the dropout samples, the
criterion for a substantial difference according to normalized differences is not met by any of
the variables in math or language. Consequently, we can conclude that teachers in our math
and language analysis samples are not substantially different from teachers in the dropout
samples.
4 ESTIMATION STRATEGY
Our model is derived from the value-added specification of the regular EPF formalized by
Todd and Wolpin (2003), but rooted in the longstanding empirical education production
literature (Ben-Porath, 1967; Hanushek, 1971, 1979). We apply a lagged-score specification of
a value-added model, which places baseline test scores on the right-hand-side39. Subsequently,
given that we have one teacher per classroom, we estimate individual teacher-classroom effects
derived from the value-added specification using adjusted fixed effects, as well as random
effects.
4.1 Adjusted Fixed Effects
In our first estimation strategy, we implement a two-step or “average residuals” value-
added model (Koedel, Mihaly and Rockoff, 2015). Specifically, in a first step we estimate the
following equation using OLS:
39 Even though the lagged test score parameter may be poorly estimated in the regression, we can consistently estimate the teacher-classroom effects with a lagged-score specification under two conditions. First, past shocks to learning decay at the same rate as learning from family and school-related sources (common factor restriction), and, therefore, errors are serially uncorrelated (Guarino, Reckase and Wooldridge, 2015). Second, the baseline tests scores serve as a good proxy for unobservable individual characteristics (Guarino, Reckase and Wooldridge, 2015). Empirical evidence has shown that the lagged-score specification of the teacher value-added model is the most robust, and even performs better than the gain-score specification in the estimation of teacher effects (Guarino, Reckase and Wooldridge, 2015; Koedel, Mihaly and Rockoff, 2015).
17
𝑌𝑌𝑖𝑖𝑖𝑖𝑖𝑖𝑖𝑖 = 𝛼𝛼𝑜𝑜 + 𝑌𝑌𝑖𝑖𝑖𝑖𝑖𝑖𝑖𝑖−1𝛽𝛽1 + 𝑋𝑋𝑖𝑖𝑖𝑖𝑖𝑖𝑖𝑖𝛽𝛽2 + 𝐶𝐶𝑖𝑖𝑖𝑖𝑖𝑖𝛽𝛽3 + 𝑛𝑛𝑖𝑖𝑖𝑖𝑖𝑖𝑖𝑖
(1)
where 𝑌𝑌𝑖𝑖𝑖𝑖𝑖𝑖𝑖𝑖 is the test score in math or language competence for student i at school s with
teacher j in year t, 𝑌𝑌𝑖𝑖𝑖𝑖𝑖𝑖𝑖𝑖−1 is a vector of lagged competence test scores40, 𝑋𝑋𝑖𝑖𝑖𝑖𝑖𝑖𝑖𝑖 is a vector of
child characteristics (age, gender, migration background and time between tests) and family
background (parents’ years of schooling, ISEI and number of siblings), 𝐶𝐶𝑖𝑖𝑖𝑖𝑖𝑖𝑖𝑖 is a vector of
classroom characteristics (classroom size, proportion of female students, average parents’
ISEI), and 𝛼𝛼𝑜𝑜 is a federal state fixed effect. We introduce federal state fixed effects in our
model to capture specificities of the educational systems, and school quality at the state level,
since education is a competence of the federal states in Germany. Standard errors are cluster at
the student level41.
In equation (1), 𝑛𝑛𝑖𝑖𝑖𝑖𝑖𝑖𝑖𝑖 is a composed error term attributed to individual teacher effects and
classroom shocks, and unobserved school-level or student-level effects. In a second step, the
composed error term 𝑛𝑛𝑖𝑖𝑖𝑖𝑖𝑖𝑖𝑖 is averaged among the individual teacher-classroom fixed effects:
𝑛𝑛𝑖𝑖𝑖𝑖𝑖𝑖𝑖𝑖 = 𝜃𝜃𝑖𝑖𝑖𝑖𝑖𝑖 + 𝑒𝑒𝑖𝑖𝑖𝑖𝑖𝑖𝑖𝑖
(2)
The vector 𝜃𝜃 in equation (2) contains the individual classroom effects, which are mainly
driven by teacher quality differences across classrooms. The error term 𝑒𝑒𝑖𝑖𝑖𝑖𝑖𝑖𝑖𝑖 is composed of
the unobserved school-level or student-level effects, which are expected to be uncorrelated to
the classroom effect in German primary schools.
We acknowledge that in the presence of non-random assignment of students to teachers,
unobserved student characteristics might be correlated to the classroom effects, and
consequently, their estimations could be biased. In addition, a matching of teachers and schools
within states based on unobserved quality factors could also bias the estimations. However, we
argue that our value-added model specifications have the potential to lead to unbiased
estimators of classroom effects, mainly driven by teacher quality differences across classrooms,
because of the following reasons. First, matching of students to teachers is not prevalent in
primary schools in Germany. On the one hand, students are not subject to any tracking based
on their ability in the first four years of primary school, and most of them must attend the
40 The model always takes into account baseline competence test scores for math, grammar and science. 41 We rerun our analysis with standard errors clustered at the classroom level. Results do not change and are available upon request.
18
nearest public school to their homes42 (KMK, 2019). On the other hand, teachers are centrally
allocated to schools at the federal state level, based on the teaching subjects required at the
schools, as opposed to teacher or school preferences (Baumert et al., 2010; KMK, 2019).
Second, vast empirical evidence has shown that EPF models that take into account baseline
student performance have small and statistically insignificant scope for bias in the estimation
of teacher effects, even in the presence of non-random assignment of students to teachers (Kane
and Staiger, 2008; Kane et al., 2013; Bacher-Hicks, Kane and Staiger, 2014; Chetty, Friedman
and Rockoff, 2014a; Bacher-Hicks et al., 2019). In other words, lagged or baseline
performance empirically seems to be a sufficient statistic for unobserved student and family
histories, as well as unobserved endowment of mental capacity or ability. In addition, our
estimates take into account potential student peer effects because we control for classroom
average characteristics in equation (1).
As a final step, we implement a procedure known as Empirical Bayes (EB) shrinkage to
adjust our classroom effects’ estimates by their level of precision, which is commonly done in
research and policy applications (Koedel, Mihaly and Rockoff, 2015). The implementation of
EB shrinkage recognizes that value-added estimates of teachers matched to fewer students are
less precise because one or two students with unusually high or low achievement growth can
more heavily influence these estimates (Herrmann, Walsh and Isenberg, 2016). Accordingly,
the EB shrinkage procedure places less weight on imprecise initial value-added estimates
(fewer students) and greater weight on more precise ones.43
We follow Herrmann, Walsh and Isenberg (2016) in the implementation of the EB
shrinkage procedure outlined by Morris (1983)44, according to which the classroom’s adjusted
fixed effect can be written as follows:
𝜃𝜃�𝑖𝑖𝐸𝐸𝐸𝐸 ≈ �𝜎𝜎�2
𝜎𝜎�2+𝜎𝜎𝚥𝚥�2� 𝜃𝜃�𝑖𝑖
(3)
42 According to the German Conference of the Ministers of Education and Cultural Affairs (2019), in order to complete general compulsory schooling, pupils generally must attend the local primary school. The exceptions to this rule are the states of Nordrhein-Westfalen and Schleswig-Holstein, where parents are free to enroll their child in a primary school other than that nearest their home. In Berlin, enrolment in a primary school other than the that nearest to the home may take place subject to place availability. 43 If class size were constant across teachers and time, the EB estimates would be identical to the original classroom effects estimates produced by our model specification (Guarino, Reckase and Wooldridge, 2015). 44 We apply the Stata program developed by the Mathematica Policy Research Educator Impact Laboratory, version 1.00 -25Feb2016.
19
Where 𝜃𝜃�𝑖𝑖𝐸𝐸𝐸𝐸 is the classrom’s EB estimate, 𝜃𝜃�𝑖𝑖 is the pre-shrinkage classroom point estimate
for teacher j from the value-added regression model, 𝜎𝜎𝚥𝚥�2 is the heteroskedasticity-robust
variance estimate of 𝜃𝜃�𝑖𝑖 , and 𝜎𝜎� is an estimate of the standard deviation of the classroom effects,
which is purged of sampling error and constant for all classrooms.
Subsequently, we attempt to explain the classroom adjusted fixed effect (FE) using our rich
vector of teacher observable characteristics 𝜏𝜏𝑖𝑖 (gender, experience, migration background,
Abitur GPA, First State Examination grade, passed Second State Examination, constructivist
beliefs, exhaustion and parental evaluation) as explanatory variables in the following OLS
regression:
𝜃𝜃�𝑖𝑖𝐸𝐸𝐸𝐸 = 𝛽𝛽0 + 𝜏𝜏𝑖𝑖𝛽𝛽1
(4)
Under this scenario, the shrinkage procedure is particularly valuable because it reduces
attenuation bias (Koedel, Mihaly and Rockoff, 2015).
4.2 Random effects
The classrooms’ EB estimates can also be directly obtained from a value-added multilevel
model, where classroom effects are estimated as random intercepts (Ballou, Sanders and
Wright, 2004; Rabe-Hesketh and Skrondal, 2012; Guarino, Reckase and Wooldridge, 2015).
We model equation (1) as a two-level variance-component model:
𝑌𝑌𝑖𝑖𝑖𝑖𝑖𝑖𝑖𝑖 = 𝛼𝛼𝑜𝑜 + 𝑌𝑌𝑖𝑖𝑖𝑖𝑖𝑖𝑖𝑖−1𝛽𝛽1 + 𝑋𝑋𝑖𝑖𝑖𝑖𝑖𝑖𝑖𝑖𝛽𝛽2 + 𝐶𝐶𝑖𝑖𝑖𝑖𝑖𝑖𝑖𝑖𝛽𝛽3 + 𝜁𝜁𝑖𝑖𝑖𝑖𝑖𝑖 + 𝜖𝜖𝑖𝑖𝑖𝑖𝑖𝑖𝑖𝑖,
(5)
where 𝜁𝜁𝑖𝑖𝑖𝑖𝑖𝑖, and 𝜖𝜖𝑖𝑖𝑖𝑖𝑖𝑖𝑖𝑖 are the error components assumed to have zero mean and to be
mutually uncorrelated, so that their variances add up to the total variance. Specifically, 𝜁𝜁𝑖𝑖𝑖𝑖𝑖𝑖 is
a random intercept for teacher-classroom j at school s, and 𝜖𝜖𝑖𝑖𝑖𝑖𝑖𝑖𝑖𝑖 is an idiosyncratic component
for student i. The level-2 variance 𝜎𝜎𝑖𝑖2 of the random intercept 𝜁𝜁𝑖𝑖𝑖𝑖𝑖𝑖 is the between-classroom
variance, and the level-1 variance 𝜎𝜎𝑖𝑖2 of the residuals 𝜖𝜖𝑖𝑖𝑖𝑖𝑖𝑖𝑖𝑖 can be interpreted as the between-
student, within-classroom variance.
We implement a maximum likelihood estimation to identify equation (5). Then, we apply
EB prediction to estimate the random intercepts 𝜁𝜁𝑖𝑖𝑖𝑖𝑖𝑖 for individual classrooms, in other words,
the classroom effects:

20
𝜁𝜁𝑖𝑖𝐸𝐸𝐸𝐸 = �𝜎𝜎�𝑖𝑖2
𝜎𝜎�02+ 𝜎𝜎𝚥𝚥�2 + 𝜎𝜎�𝑖𝑖2 𝑛𝑛𝑖𝑖�
� 𝜁𝜁𝑖𝑖
(6)
In this process, the EB prediction is shrunk toward zero (the mean of the prior). As
mentioned earlier, shrinkage is desirable in our application because it only affects clusters
(classrooms) that provide little information, and it effectively reduces their influence,
borrowing strength from other classrooms (Rabe-Hesketh and Skrondal, 2012).
Once we have calculated the individual classroom random effects (RE), we implement a
simple OLS regression to explain it with our vector of teacher observable characteristics, 𝜏𝜏𝑖𝑖:
𝜁𝜁𝑖𝑖𝐸𝐸𝐸𝐸 = 𝛽𝛽0 + 𝜏𝜏𝑖𝑖𝛽𝛽1.
(7)
5 RESULTS
5.1 Random Assignment of Students to Teachers
We claim that our model specifications have the potential to lead to unbiased estimators of
classroom effects, which are mainly driven by teacher quality differences across classrooms,
because random assignment of students to teachers is prevalent in the first four years of primary
school in Germany. In this section, we present evidence that shows no systematic matching of
students to teachers within schools in our data.
In order to check for non-random assignment within schools, we regress individual teacher
observable characteristics on our vector of student and family characteristics in grades 1 and 2.
Our goal is to assess whether these covariates can systematically explain teachers’ observable
characteristics, including gender, experience, Abitur GPA, First and Second State Examination
grades, whether she passed the Second State Examination, and the indicator of constructivist
beliefs45. We use all observations and information available for first and second graders in the
NEPS SC2 data. In addition, all regressions include school fixed effects.
Table 3 presents the regression results for children and their teachers’ characteristics in
grade 1. From the F-test of the joint significance of our vector of child and family
characteristics, we observe that they cannot significantly explain teachers’ observable
45 We exclusively include teacher characteristics observable before the beginning of the first school year (pre-treatment characteristics). Therefore, teacher exhaustion and parental evaluation are not taken into account.
21
characteristics, excepting only whether the teacher passed the Second State Examination.
Teachers who passed the Second State Examination are more likely to be assigned to students
with migration background, who are older, and who belong to families with higher ISEI.
Nevertheless, the point estimates for the last two characteristics are close to zero, with
migration background being the only relevant association. Children with a migration
background might be expected to face greater academic challenges and, therefore, be more
likely to be assigned to fully certified teachers.
Table 4 shows our random assignment test for the panel children in grade 2. We add
competence scores in math, grammar and science from grade 1 in the vector of individual
student characteristics. Remarkably, we find no significant association of baseline test scores
with any of the teacher observable characteristics, which means that decisions on the
assignment of students to teachers for grade 2 within schools are indeed not based on student
ability. This is quite important for our study because in the following regression analyses, we
use the subsample of students assigned to the same teacher in grades 1 and 2. Moreover, once
again we observe that other student and family characteristics are not systematically correlated
with teachers’ observable characteristics, again with the only exception of whether the teacher
passed the Second State Examination.
Our findings from this section confirm that, within schools, children in the first years of
primary school in Germany are neither systematically matched to their teachers based on their
ability, nor are they matched on other socio-economic characteristics other than migration
background.
5.2 The Distribution of Classroom Effects
In table 5 we report the results of the first step specifications of our value-added model to
student math competence in grade 2 of primary school, estimated with classroom FE and RE.
Column (1) presents results of the OLS regression described in equation (1). In column (2), we
add the individual classroom FE to the original specification to assess changes in the explained
variance of student math competence due to their inclusion. The adjusted R2 increases from
0.485 to 0.525, which means that adding classroom FE into the model increases the explained
variance by about four percentage points. The classroom FE are also jointly significant
according to an F-test. Column (4) displays the results of our two-level variance-component
model according to equation (5), and column (3) contains the results of an analogous model
where the classroom random intercept is omitted. We observe that the inclusion of classroom
RE in column (4) is statistically significant and also accounts for around four percentage points

22
of the unexplained level-1 variance in column (3). Thus, the between-classroom variation is
about four percent, which is very close to the variation found by Baumert et al. (2010). In
addition, from the results displayed in columns (1), (2), (3) and (4), we can conclude that, aside
from the classroom FE or RE, the variables that have more explanatory power for student math
competence are baseline math, science and grammar competence scores, time between tests
(months), gender, and to some extent, parents’ ISEI. It is also remarkable that the point
estimates of the covariates in the FE and RE specifications are very similar.
In table 6 we present the first step results of our classroom value-added to student language
competence, estimated with classroom FE and RE. From the adjusted R2 reported in columns
(1) and (2), we observe that the inclusion of classroom FE increases the explained variance of
the model by around six percentage points. Likewise, column (4) shows that around five
percentage points of the unexplained variance of our RE specification in column (3) can be
attributed to the classroom random intercept. In addition, the regression outputs in columns (1),
(2), (3) and (4) indicate that the variables significantly and consistently associated with student
language competence are prior grammar and math competence scores, time between tests
(months), gender, migration background, and parents’ years of education. Once again, it is
remarkable that the point estimates of the covariates in the FE and RE specifications are very
similar.
In table 7, we present the distribution of the classroom effects on student math competence
estimated as adjusted classroom FE following equations (1), (2) and (3), and as classroom RE
according to equations (5) and (6). The classroom effects can also be interpreted as indicators
of classroom quality in terms of the individual classroom contribution to student competence
development. Individual teacher effects, as explained earlier, mainly drive our classroom
effects’ estimates. Column (1) reports the standard deviations of the distributions of classroom
effects estimated with adjusted FE and RE after controlling only for federal state effects, lagged
competence scores and time between tests in equations (1) and (5), respectively. The adjusted
FE specification shows that one standard deviation change in classroom quality is associated
with a 0.119 standard deviation higher student math competence score. The RE specification
estimates a slightly higher standard deviation of 0.122. In Column (5), we present our
estimations after controlling for a full set of child characteristics, family socio-economical
background, classroom size, and additional classroom averages. Results remain practically the
same, with one standard deviation change in classroom quality associated with a 0.120 standard
deviation higher student math competence score in the classroom adjusted FE specification,
and with a 0.124 standard deviation higher score in the classroom RE specification. The
23
estimated distributions of classroom effects on math competence are also presented in figure
1. Notably, the adjusted FE and RE distributions practically overlap.
We present our estimates of the distribution of the classroom effects on language
competence in table 8, following the same structure of table 7. The standard deviation of the
classroom quality distribution estimated with the adjusted FE specification ranges from 0.149
in Column (1) to 0.142 in Column (5), when a full set to controls are introduced in equation
(1). The standard deviation of the classroom quality distribution estimated with RE is virtually
the same. It decreases from 0.148 in Column (1) to 0.140 in Column (5), when a full set of
controls are taken into account in equation (5). Accordingly, we can conclude that a one
standard deviation increase in classroom quality is associated with about a 0.140 standard
deviation higher student language competence score. Figure 2 displays the distributions of the
classroom adjusted FE and RE on reading competence.
Interestingly, our classroom adjusted FE and RE’s estimates are practically the same, and
do not change with the inclusion of additional controls once we have taken into account lagged
competence scores and time between tests. This aligns with previous research in the US, which
has found that controlling for lagged test scores is key to obtaining unbiased value-added
estimates, since most of the sorting of students to teachers relevant for future achievement is
captured by them (Chetty, Friedman and Rockoff, 2014a). In addition, our estimates are
comparable in size to classroom effects estimated for primary school in the US. With respect
to the distributions of classroom value-added obtained by Chetty, Friedman and Rockoff
(2014a), our standard deviations are smaller for math (0.166 SD) and greater for language
(0.117 SD). Thus, in terms of student competence development, the quality differences among
teachers and their classrooms in Germany are smaller for math and larger for language.
Our estimates of the adjusted classroom FE and RE can be also used to build quality
rankings of classrooms based on their individual contribution to competence development. We
present classroom rankings of predicted value-added to student math competence derived from
their individual adjusted FE and RE in figure 3. We also display rankings of classroom
predicted value-added to student language competence derived from the adjusted FE and the
RE estimations in figure 4. Even though the individual classroom contributions are nosily
predicted because of our small student sample size, it is clear that some classrooms, and
primarily their teachers, significantly outperform or underperform compared to the average
classroom’s contribution to learning.
In addition, it is relevant that our classroom effect estimations assume that one teacher is
responsible for teaching all main subjects in the classroom, because the NEPS SC2 data
24
provides information on classroom teachers for the primary school grades, as opposed to
subject teachers46. Indeed, having classroom teachers in primary school is common practice in
Germany, and consistent with teaching careers at the primary school level (KMK, 2019). In
this context, we also estimate the correlation between the math and language classroom effects
for the adjusted FE and RE specifications. We find a positive correlation of 0.208 for the
adjusted FE specification and of 0.205 for the RE specification47, which suggests that higher
math value-added classrooms also tend to be higher language value-added classrooms. In
addition, as a robustness check, we rerun our analysis for subsamples of teachers who explicitly
declared they were responsible for math and/or language instruction in grade 2 in the NEPS
SC2 data. Results are very similar and presented in Appendix A.
5.3 Explaining Classroom Effects with Observable Teacher Characteristics
In this subsection, we report regression results of the association between the estimated
classroom effects on student competence scores and observed teacher characteristics, according
to equation (4) for the adjusted FE specification and equation (7) for the RE specification.
Our value-added estimations are based on all classrooms linked to teacher unique
identifiers, regardless of whether a teacher has answered specific questions on her
characteristics in the NEPS surveys. Accordingly, from the original math sample of 251
teachers, and language sample of 240 teachers, we have full information on the characteristics
of 147 and 141 teachers, respectively. Thus, the reduction in the teacher-classroom sample size
could pose a concern of sample selectivity and representability of the results. In order to test
whether there is an association between teacher willingness to disclose professional
information and our classroom effects’ estimations, we calculate an index based on the number
of questions answered by each teacher. Then, we calculate its correlation with our adjusted
classroom FE and RE estimations. We found correlations virtually equal to zero for both
estimations in math and language.48 Therefore, we conclude that our reduced sample is not
positively or negatively selected with respect to teacher quality.
Table 9 presents results for math and reading competence. Column (1) shows the
association of teacher characteristics with the classroom effects on math competence
development estimated with adjusted FE and column (2) with RE. As reported by previous
46 NEPS SC2 classroom data is not divided into math and language classrooms as it is done in NEPS SC3 for grade 5 and up. 47 These results are based on classrooms for which we are able to estimate both math and language effects. The sample size decreases to 234 classrooms. 48 Results available upon request.
25
research, our rich set of teacher covariates explain very little of the variance of the classroom
effects on math competence, just about five percent in both model specifications. Moreover,
we identify no significant correlation.49
Columns (3) and (4) of table 9 present the association of teacher observables with
classroom effects on language competence development estimated as classroom adjusted FE
and RE, respectively. For language competence, the observable teacher characteristics explain
about 10 percent of the variance in the classroom effects in both specifications. Surprisingly,
only average parental evaluation of teacher quality is significantly associated with classroom
effects on language competence at the 5 percent significance level. One standard deviation
increase in the average parental evaluation is associated with a 0.026 standard deviation higher
student language competence score in the adjusted FE specification, and with a 0.025 standard
deviation higher score in the RE specification. This association aligns with previous
experimental value-added research conducted in primary schools (Araujo et al., 2016). In
addition, we find marginal associations with Abitur GPA and the First State Examination grade
in both specifications at the 10 percent significance level.50
5.4 Heterogeneity by Teacher Gender
In our analysis samples, more than 90 percent of teachers are female. Given that we
probably have a highly selective group of male teachers, we replicate our entire analysis
exclusively for the female sample.
Mirroring the structure of table 7, in table 10 we report the distribution of classroom quality,
or effects on student math competence estimated as adjusted FE and RE for the teacher female
sample. The adjusted FE specification produces a standard deviation of 0.107 in the classroom
effects distribution, which does not change when a full set of controls are introduced in Column
49 Alternatively, we investigate the association between teacher characteristics and student math competence development by directly introducing these observables into equation (1) and estimating an OLS regression with clustered standard errors at the classroom level. We find a negative correlation with teacher female gender, which is significant only at the 10 percent level. All the other teacher characteristics remain uncorrelated with math competence development. We argue that the indirect associations with the classroom effects are more robust, because the number of students per teacher might influence the statistical significance of the direct associations estimated with OLS. Results available upon request. 50 We also estimated the direct association between teacher characteristics and student language competence development in equation (1) using an OLS regression with clustered standard errors at the classroom level. We find a stronger association with average parental evaluation of teacher quality, which is significant at the 1 percent level. The associations with Abitur GPA and the First State Examination grade have the same direction, but only Abitur is significant at the 10 percent level. A positive association with the constructivist beliefs index becomes significant, but only at the 10 percent level. We argue that the indirect associations with the classroom effects are more robust, since the number of students per teacher might influence the statistical significance of the direct associations estimated with OLS. Results available upon request.
26
(5). The standard deviation estimated with RE is exactly the same, but slightly increases from
0.107 in Column (1) to 0.108 in Column (5). Thus, we observe that the variance of the
classroom quality distribution is smaller for the teacher female sample. One standard deviation
increase in classroom quality is associated with at least a 0.107 standard deviation higher
student math competence score.
Table 11 presents the distribution of classroom effects on student language competence,
following the same structure as table 7. Once again, we find that the variance of the classroom
quality distribution is smaller for the female sample. The standard deviations of both the
classroom adjusted FE, and the RE specifications, range from 0.134 in Column (1) to 0.128 in
Column (5), when a full set of controls are introduced. Accordingly, we observe that one
standard deviation increase in classroom quality is associated with at least a 0.128 standard
deviation higher student language competence score.
We also look at the association between classroom effects on student math and language
competence scores and observed teacher characteristics in the female teacher sample. Results
are reported in table 12 using the same structure as table 9. Similar to the findings in the full
teacher sample, column (1) and column (2) show that there is no significant association
between any of the individual teacher characteristics and the classroom effects on math
competence, estimated either as adjusted FE or as RE for the female sample 51. Likewise,
parental evaluation of teacher quality is the only teacher characteristic significantly and
positively associated with classroom value-added to language competence in grade 2, estimated
as adjusted FE in column (3), or as RE in column (4) for the female sample. The size of the
association is virtually the same as that of the full teacher sample, a 0.024 standard deviation
higher language competence score in both specifications. Moreover, the previous marginal
associations with Abitur GPA or First State Examination grade become insignificant, which
suggest that they were probably driven by the male sample.52
51 We find the same results in our alternative specification, which directly introduces teacher characteristics into equation (1) and estimates their association with student math competence development using an OLS regression with standard errors clustered at the classroom level. Results available upon request. 52 When estimating the direct association between teacher characteristics and student language competence development in equation (1) using an OLS regression with standard errors clustered at the classroom level, we also find a significant association with average parental evaluation of teacher quality at the 1 percent level. No other teacher characteristic is significantly correlated to language competence development. Results available upon request.
27
5.5 Parental Behavioral Response
Our results show that German primary school parents give higher evaluation scores to
teachers who exhibit higher classroom effects on language competence development; in other
words, our results suggest that parents can identify better teachers for language competence
development. In the value-added model framework, simultaneous parental behavioral
responses to augment or offset the effect of being assigned to a better or worst teacher are
included in the classroom effect estimations, as stressed by Todd and Wolpin (2003).
Accordingly, in this section, we analyze these parental responses.
The NEPS SC2 survey asked parents how much time they spend helping their children with
their homework and other school exercises in a typical school week, and whether their children
have received private tutoring in grade 2. Using the student language sample,53 we analyze the
association of these measures of parental behavioral response with the individual parental
evaluation of teacher quality in grade 2.54About 94 percent of the parents in the student
language sample provided detailed answers on time spent helping with homework in hours and
minutes. In addition, virtually all parents provided information on whether their children had
private tutoring; nonetheless, only around a three percent gave an affirmative answer.
Table 13 reports regression results for parental time spent helping with homework, in
column (1) accounting only for federal state fixed effects as control, and in column (2)
including a full set of child, family, and classroom controls including child lagged competence
test scores. We find that higher parental perception of teacher quality is associated with less
time spent helping with homework; however, these associations are statistically insignificant.
Columns (3) and (4) present regression results for whether the child had private tutoring as a
dependent variable, respectively without and with a full set of controls. Results show negative
and significant associations with parental perception of teacher quality. A child is about eight
percent less likely to receive private tutoring if the parental evaluation of teacher quality
corresponds to the highest possible category, as displayed in column (4). Nonetheless, as
mentioned, a very small and probably highly selective percentage of children receive private
tutoring in our sample. Finally, columns (5) and (6) display regression results on whether the
53 We also run our analysis using the math student sample and the results (available upon request) are virtually the same. 54 As indicated in section 3, this indicator comes from parents’ assessment on whether school teachers tried to meet children’s needs on a 4-point Likert scale. The Likert scale has the following categories: 1. Does not apply, 2. Does rather not apply, 3. Does rather apply and 4. Does apply. Due to a small number of observations in categories 1. and 2., we combine them into one category “Does not/rather not apply”.

28
child had private tutoring specifically in the subject of German language,55 respectively without
and with a full set of controls. Once again, we observe that the higher the parental evaluation
of teacher quality, the lower the probability of receiving private language tutoring for a child,
about seven percent significantly lower for the highest evaluation of teacher quality. However,
the percentage of children expose to private language tutoring is even smaller, at about one
percent of the student language sample.
Our results suggest, on the one hand, that parents do not generally respond to a perceived
higher teacher quality by spending significantly less time helping their children with their
homework. On the other hand, parents seem to decrease their investment in private tutoring
when teacher quality is perceived as higher, but this seems to affect a highly selective sample
of students.
6 CONCLUSION
In this paper, we have provided the first estimations of substantial classroom quality
differences on competence development in German primary schools. One standard deviation
increase in classroom quality is associated with at least 12 percent of a standard deviation
increase in student mathematical competence score, and at least 14 percent of a standard
deviation increase in language competence score. These classroom effects are driven by
unbiased teacher quality differences across classrooms, since our estimations take into account
student baseline competence scores and peer effects, and there is no systematic matching of
students to teachers based on ability and other socio-economic factors in the German primary
school.
We have managed to build a short panel of teachers and their students that covers math and
language competence development between grades 1 and 2 using data from the SC2 of the
NEPS. However, we observe only one classroom per teacher, and therefore, have not been able
to estimate persistent teacher effects. Nonetheless, based on previous empirical research on
classroom and teacher effects conducted in primary schools (Chetty, Friedman and Rockoff,
2014a; Araujo et al., 2016), we are confident that persistent teacher effects are at most one to
two percentage points smaller than our classroom effects’ estimates.
Our research has also confirmed that easily quantifiable teacher characteristics explain very
little of the variance of the classroom effects on math and language competence in the German
55Among the topics covered in language private tutoring are: reading and understanding texts, speaking and oral comprehension, spelling and writing,
29
primary school. Moreover, we have found no association between our estimates of classroom
quality and most of the teacher characteristics analyzed, including gender, years of teaching
experience, migration background, self-reported Abitur GPA, self-reported First State
Examination grade, whether the teacher has passed the Second State Examination,
constructivist beliefs and exhaustion levels. Remarkably, our indicator of parental evaluation
of teacher quality is the only covariate that is significantly and positively associated with our
estimates of classroom effects on language competence development. This result suggests that
parents can identify effective teachers in the first years of primary school. In addition, we find
that a selective group of parents exhibits behavioral responses to differences in perceived
teacher and classroom quality.
In the last 20 years, research in the U.S and around the world has consistently found that
teacher value-added is an educationally and economically meaningful measure. This study is
the first step toward the estimation of persistent teacher effects and their determinants in
German primary schools. The implementation of a national panel study of teachers is urgently
needed for the development of future research and policy applications.
We conclude with some policy recommendations. Our research suggests that policy makers
should consider teacher and classroom value-added measures as powerful tools for evaluating
and improving teacher workforce quality in Germany, given that the observable characteristics
typically used in teacher recruitment processes explain very little of the variance in teacher
effectiveness. Quality rankings of teachers and their classrooms, based on their individual
contribution to competence development, could be used to incentivize top performers, or to
identify and dismiss teachers who are permanently at the bottom of the quality distribution.
Moreover, we present evidence that the inclusion of parent perspectives in teacher quality
assessments is meaningful and worth of consideration in primary schools.
30
REFERENCES
Aaronson, D., Barrow, L. and Sander, W. (2007) “Teachers and student achievement in the Chicago public high schools,” Journal of Labor Economics, 25(1), pp. 95–135. doi: 10.1086/508733.
Araujo, M. C., Carneiro, P., Cruz-Aguayo, Y. and Schady, N. (2016) “Teacher Quality and Learning Outcomes in Kindergarten,” The Quarterly Journal of Economics, 131(3), pp. 1415–1453. doi: 10.1093/qje/qjw016.
Bacher-Hicks, A., Chin, M. J., Kane, T. J. and Staiger, D. O. (2019) “An experimental evaluation of three teacher quality measures: Value-added, classroom observations, and student surveys,” Economics of Education Review, 73, p. 101919. doi: 10.1016/j.econedurev.2019.101919.
Bacher-Hicks, A., Kane, T. and Staiger, D. O. (2014) Validating Teacher Effect Estimates Using Changes in Teacher Assignments in Los Angeles, NBER Working Paper Series. 20657. Cambridge, MA. doi: 10.3386/w20657.
Ballou, D., Sanders, W. and Wright, P. (2004) “Controlling for Student Background in Value-Added Assessment of Teachers,” Journal of Educational and Behavioral Statistics, 29(1), pp. 37–65. doi: 10.3102/10769986029001037.
Baumert, J., Kunter, M., Blum, W., Brunner, M., Voss, T., Jordan, A., Klusmann, U., Krauss, S., Neubrand, M. and Tsai, Y.-M. (2010) “Teachers’ Mathematical Knowledge, Cognitive Activation in the Classroom, and Student Progress,” American Educational Research Journal, 47(1), pp. 133–180. doi: 10.3102/0002831209345157.
Ben-Porath, Y. (1967) “The Production of Human Capital and the Life Cycle of Earnings,” Journal of Political Economy, 75(4), pp. 352–365. Available at: https://www.jstor.org/stable/1828596 (Accessed: May 24, 2021).
Bitler, M., Corcoran, S., Domina, T. and Penner, E. (2019) Teacher Effects on Student Achievement and Height: A Cautionary Tale, NBER Working Paper Series. 26480. Cambridge, MA. doi: 10.3386/w26480.
Blossfeld, H.-P., Roßbach, H.-G. and von Maurice, J. (2011) “Education as a lifelong process: the German National Educational Panel Study (NEPS),” Zeitschrift für Erziehungswissenschaft, 14(Special Issue).
Chetty, R., Friedman, J. N. and Rockoff, J. E. (2014a) “Measuring the Impacts of Teachers I: Evaluating Bias in Teacher Value-Added Estimates,” American Economic Review, 104(9), pp. 2593–2632. doi: 10.1257/aer.104.9.2593.
Chetty, R., Friedman, J. N. and Rockoff, J. E. (2014b) “Measuring the impacts of teachers II: Teacher value-added and student outcomes in adulthood,” American Economic Review, 104(9), pp. 2633–2679. doi: 10.1257/aer.104.9.2633.
Cunha, F., Heckman, J. J. and Schennach, S. M. (2010) “Estimating the Technology of Cognitive and Noncognitive Skill Formation,” Econometrica, 78(3), pp. 883–931. doi: 10.3982/ECTA6551.
31
Demmer, M. and von Saldern, M. (2010) „Helden des Alltags“ Erste Ergebnisse der Schulleitungs- und Lehrkräftebefragung (TALIS) in Deutschland. First. Edited by M. Demmer and M. von Saldern. Münster: Waxmann.
Elango, S., García, J. L., Heckman, J. J. and Hojman, A. (2016) “Early Childhood Education,” in Moffitt, R. A. (ed.) Economics of Means-Tested Transfer Programs in the United States. University of Chicago Press, pp. 235–297. doi: 10.7208/chicago/9780226392523.001.0001.
Enzi, B. (2017) Microeconometric Analyses of Cognitive Achievement Production, ifo Beiträge zur Wirtschaftsforschung. No. 75. München: ifo Institut - Leibniz-Institut für Wirtschaftsforschung an der Universität München. Available at: https://www.econstor.eu/handle/10419/172967 (Accessed: June 27, 2019).
Fernández, E., LeChasseur, K. and Donaldson, M. L. (2018) “Responses to including parents in teacher evaluation policy: A critical policy analysis,” Journal of Education Policy, 33(3), pp. 398–413. doi: 10.1080/02680939.2017.1370135.
Fischer, L., Rohm, T., Gnambs, T. and Carstensen, C. H. (2016) Linking the Data of the Competence Tests, NEPS Survey Papers. 1. Bamberg. doi: 10.5157/NEPS:SP01:1.0.
García, J. L., Heckman, J. J., Leaf, D. E. and Prados, M. J. (2020) “Quantifying the Life-Cycle Benefits of an Influential Early-Childhood Program,” Journal of Political Economy, 128(7), pp. 2502–2541. doi: 10.1086/705718.
Goldhaber, D. and Hansen, M. (2013) “Is it Just a Bad Class? Assessing the Long-term Stability of Estimated Teacher Performance,” Economica, 80(319), pp. 589–612. doi: 10.1111/ecca.12002.
Guarino, C. M., Reckase, M. D. and Wooldridge, J. M. (2015) “Can value-added measures of teacher performance be trusted?,” Education Finance and Policy, 10(1), pp. 117–156. doi: 10.1162/EDFP_a_00153.
Hanushek, E. A. (1971) “Teacher Characteristics and Gains in Student Achievement: Estimation Using Micro Data,” The American Economic Review, 61, pp. 280–288. doi: 10.2307/1817003.
Hanushek, E. A. (1979) “Conceptual and Empirical Issues in the Estimation of Educational Production Functions,” The Journal of Human Resources, 14(3), pp. 351–388. Available at: http://www.jstor.org/stable/145575.
Hanushek, E. A. (2011) “The economic value of higher teacher quality,” Economics of Education Review, 30(3), pp. 466–479. doi: 10.1016/j.econedurev.2010.12.006.
Hanushek, E. A. and Rivkin, S. G. (2010) “Generalizations about using value-added measures of teacher quality,” in American Economic Review: Papers & Proceedings, pp. 267–271. doi: 10.1257/aer.100.2.267.
Hanushek, E. A. and Rivkin, S. G. (2012) “The Distribution of Teacher Quality and Implications for Policy,” Annual Review of Economics, 4(1), pp. 131–157. doi: 10.1146/annurev-economics-080511-111001.
32
Heckman, J. J., Pinto, R. and Savelyev, P. (2013) “Understanding the Mechanisms Through Which an Influential Early Childhood Program Boosted Adult Outcomes,” The American Economic Review, 103(6), pp. 2052–2086. doi: 10.1257/aer.103.6.2052.
Herrmann, M., Walsh, E. and Isenberg, E. (2016) “Shrinkage of Value-Added Estimates and Characteristics of Students with Hard-to-Predict Achievement Levels,” Statistics and Public Policy, 3(1), pp. 1–10. doi: 10.1080/2330443X.2016.1182878.
Imbens, G. W. (2015) “Matching methods in practice: Three examples,” Journal of Human Resources, 50(2), pp. 373–419. doi: 10.3368/jhr.50.2.373.
Imbens, G. W. and Wooldridge, J. M. (2009) “Recent developments in the econometrics of program evaluation,” Journal of Economic Literature, 47(1), pp. 5–86. doi: 10.1257/jel.47.1.5.
Jackson, C. K., Rockoff, J. E. and Staiger, D. O. (2014) “Teacher Effects and Teacher-Related Policies,” Annual Review of Economics, 6, pp. 801–25. doi: 10.1146/annurev-economics-080213-040845.
Jürges, H. and Schneider, K. (2007) “Fair ranking of teachers,” Empirical Economics, 32, pp. 411–431. doi: 10.1007/s00181-006-0112-3.
Kane, T. J., Mccaffrey, D. F., Miller, T. and Staiger, D. O. (2013) Have We Identified Effective Teachers? Validating Measures of Effective Teaching Using Random Assignment, MET Project Reseach Paper. Bill & Melinda Gates Foundation. Available at: https://usprogram.gatesfoundation.org/-/media/dataimport/resources/pdf/2016/12/met-validating-using-random-assignment-research-paper.pdf (Accessed: April 1, 2020).
Kane, T. J., Rockoff, J. E. and Staiger, D. O. (2008) “What does certification tell us about teacher effectiveness? Evidence from New York City,” Economics of Education Review, 27, pp. 615–631. doi: 10.1016/j.econedurev.2007.05.005.
Kane, T. J. and Staiger, D. O. (2008) Estimating Teacher Impacts on Student Achievement: An Experimental Evaluation, NBER Working Paper Series. 14607. Cambridge, MA. doi: 10.3386/w14607.
Klusmann, U., Kunter, M., Trautwein, U., Lüdtke, O. and Baumert, J. (2008) “Teachers’ Occupational Well-Being and Quality of Instruction: The Important Role of Self-Regulatory Patterns,” Journal of Educational Psychology, 100(3), pp. 702–715. doi: 10.1037/0022-0663.100.3.702.
Koedel, C., Mihaly, K. and Rockoff, J. E. (2015) “Value-added modeling: A review,” Economics of Education Review, 47, pp. 180–195. doi: 10.1016/J.ECONEDUREV.2015.01.006.
Konferenz der Kultusminister der Länder in der Bundesrepublik Deutschland (KMK) (2019) The Education System in the Federal Republic of Germany 2017/2018. Edited by T. Eckhardt. Bonn: Sekretariat der Ständigen Konferenz der Kultusminister der Länder in der Bundesrepublik Deutschland (KMK). Available at: https://www.kmk.org/fileadmin/Dateien/pdf/Eurydice/Bildungswesen-engl-pdfs/dossier_en_ebook.pdf (Accessed: February 28, 2021).
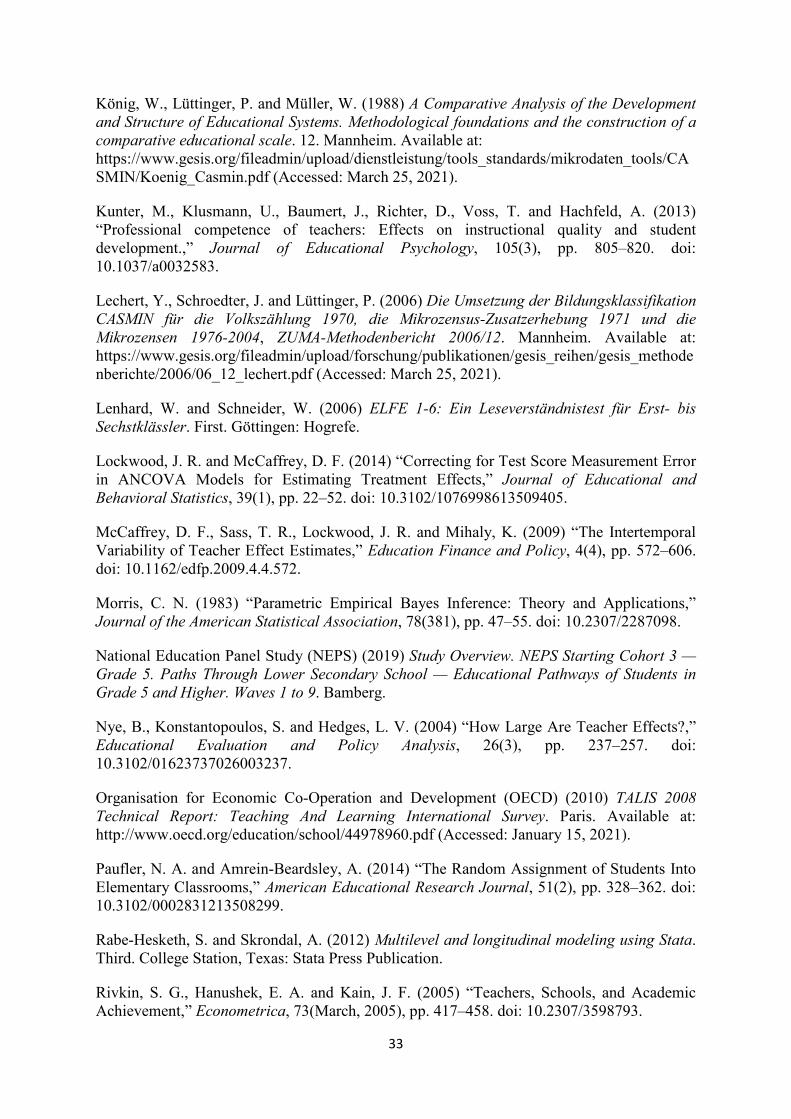
33
König, W., Lüttinger, P. and Müller, W. (1988) A Comparative Analysis of the Development and Structure of Educational Systems. Methodological foundations and the construction of a comparative educational scale. 12. Mannheim. Available at: https://www.gesis.org/fileadmin/upload/dienstleistung/tools_standards/mikrodaten_tools/CASMIN/Koenig_Casmin.pdf (Accessed: March 25, 2021).
Kunter, M., Klusmann, U., Baumert, J., Richter, D., Voss, T. and Hachfeld, A. (2013) “Professional competence of teachers: Effects on instructional quality and student development.,” Journal of Educational Psychology, 105(3), pp. 805–820. doi: 10.1037/a0032583.
Lechert, Y., Schroedter, J. and Lüttinger, P. (2006) Die Umsetzung der Bildungsklassifikation CASMIN für die Volkszählung 1970, die Mikrozensus-Zusatzerhebung 1971 und die Mikrozensen 1976-2004, ZUMA-Methodenbericht 2006/12. Mannheim. Available at: https://www.gesis.org/fileadmin/upload/forschung/publikationen/gesis_reihen/gesis_methodenberichte/2006/06_12_lechert.pdf (Accessed: March 25, 2021).
Lenhard, W. and Schneider, W. (2006) ELFE 1-6: Ein Leseverständnistest für Erst- bis Sechstklässler. First. Göttingen: Hogrefe.
Lockwood, J. R. and McCaffrey, D. F. (2014) “Correcting for Test Score Measurement Error in ANCOVA Models for Estimating Treatment Effects,” Journal of Educational and Behavioral Statistics, 39(1), pp. 22–52. doi: 10.3102/1076998613509405.
McCaffrey, D. F., Sass, T. R., Lockwood, J. R. and Mihaly, K. (2009) “The Intertemporal Variability of Teacher Effect Estimates,” Education Finance and Policy, 4(4), pp. 572–606. doi: 10.1162/edfp.2009.4.4.572.
Morris, C. N. (1983) “Parametric Empirical Bayes Inference: Theory and Applications,” Journal of the American Statistical Association, 78(381), pp. 47–55. doi: 10.2307/2287098.
National Education Panel Study (NEPS) (2019) Study Overview. NEPS Starting Cohort 3 — Grade 5. Paths Through Lower Secondary School — Educational Pathways of Students in Grade 5 and Higher. Waves 1 to 9. Bamberg.
Nye, B., Konstantopoulos, S. and Hedges, L. V. (2004) “How Large Are Teacher Effects?,” Educational Evaluation and Policy Analysis, 26(3), pp. 237–257. doi: 10.3102/01623737026003237.
Organisation for Economic Co-Operation and Development (OECD) (2010) TALIS 2008 Technical Report: Teaching And Learning International Survey. Paris. Available at: http://www.oecd.org/education/school/44978960.pdf (Accessed: January 15, 2021).
Paufler, N. A. and Amrein-Beardsley, A. (2014) “The Random Assignment of Students Into Elementary Classrooms,” American Educational Research Journal, 51(2), pp. 328–362. doi: 10.3102/0002831213508299.
Rabe-Hesketh, S. and Skrondal, A. (2012) Multilevel and longitudinal modeling using Stata. Third. College Station, Texas: Stata Press Publication.
Rivkin, S. G., Hanushek, E. A. and Kain, J. F. (2005) “Teachers, Schools, and Academic Achievement,” Econometrica, 73(March, 2005), pp. 417–458. doi: 10.2307/3598793.

34
Rockoff, J. E. (2004) “The Impact of Individual Teachers on Student Achievement: Evidence from Panel Data,” The American Economic Review, 94(2), pp. 247–252. doi: 10.1257/0002828041302244.
Rothstein, J. (2009) “Student Sorting and Bias in Value-Added Estimation: Selection on Observables and Unobservables,” Education Finance and Policy, 4(4), pp. 537–571. doi: 10.1162/edfp.2009.4.4.537.
Rothstein, J. (2010) “Teacher Quality in Educational Production: Tracking, Decay, and Student Achievement,” The Quarterly Journal of Economics, 125(1), pp. 175–214. doi: 10.1162/qjec.2010.125.1.175.
Schnittjer, I. and Fischer, L. (2018) “NEPS Technical Report for Mathematics: Scaling Results of Starting Cohort 2 for Grade 1,” NEPS Survey Papers. doi: 10.5157/NEPS:SP46:1.0.
Schnittjer, I. and Gerken, A.-L. (2018) NEPS Technical Report for Mathematics: Scaling Results of Starting Cohort 2 for Grade 2, NEPS Survey Papers. 47. Bamberg. doi: 10.5157/NEPS:SP47:1.0.
Statistisches Bundesamt (2019) “Bildung,” in Statistisches Jahrbuch 2019. Statistisches Bundesamt, p. 95. Available at: https://www.destatis.de/DE/Themen/Querschnitt/Jahrbuch/jb-bildung.pdf?__blob=publicationFile.
Steinberg, M. P. and Donaldson, M. L. (2016) “The new educational accountability: Understanding the landscape of teacher evaluation in the post-NCLB era,” Education Finance and Policy, 11(3), pp. 340–359. doi: 10.1162/EDFP_a_00186.
Strøm, B. and Falch, T. (2020) “The role of teacher quality in education production,” in Bradley, S. and Green, C. (eds.) The Economics of Education: A Comprehensive Overview. Second. Elsevier, pp. 307–319. doi: 10.1016/b978-0-12-815391-8.00022-7.
Todd, P. E. and Wolpin, K. I. (2003) “On the Specification and Estimation of the Production Function for Cognitive Achievement,” The Economic Journal, 113(485), pp. F3–F33. doi: 10.1111/1468-0297.00097.
Warm, T. A. (1989) “Weighted likelihood estimation of ability in item response theory,” Psychometrika, 54(3), pp. 427–450. doi: 10.1007/BF02294627.
Zielonka, M. and Pelz, S. (2015) NEPS Technical Report: Implementation of the ISCED-97, CASMIN and Years of Education Classification Schemes in SUF Starting Cohort 2. Bamberg. Available at: https://www.neps-data.de/Portals/0/NEPS/Datenzentrum/Forschungsdaten/SC2/3-0-0/TR_Derived_Educational_Variables_SC2.pdf (Accessed: March 25, 2021).
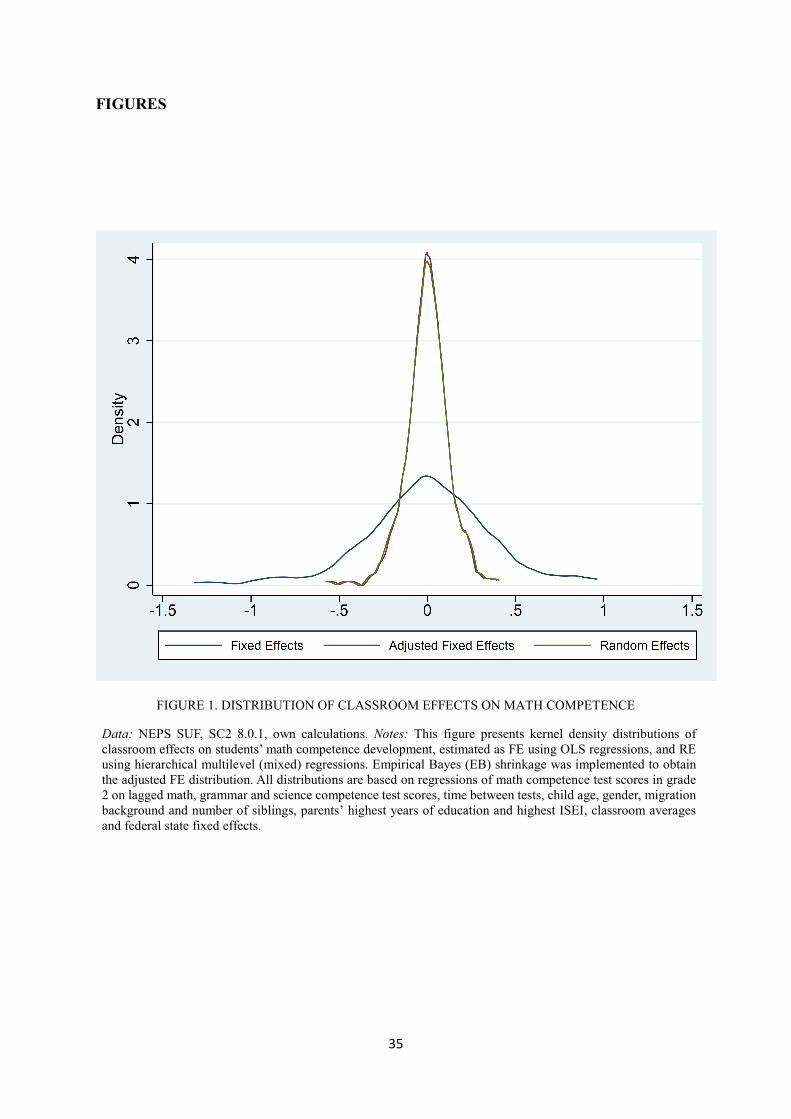
35
FIGURES
FIGURE 1. DISTRIBUTION OF CLASSROOM EFFECTS ON MATH COMPETENCE
Data: NEPS SUF, SC2 8.0.1, own calculations. Notes: This figure presents kernel density distributions of classroom effects on students’ math competence development, estimated as FE using OLS regressions, and RE using hierarchical multilevel (mixed) regressions. Empirical Bayes (EB) shrinkage was implemented to obtain the adjusted FE distribution. All distributions are based on regressions of math competence test scores in grade 2 on lagged math, grammar and science competence test scores, time between tests, child age, gender, migration background and number of siblings, parents’ highest years of education and highest ISEI, classroom averages and federal state fixed effects.
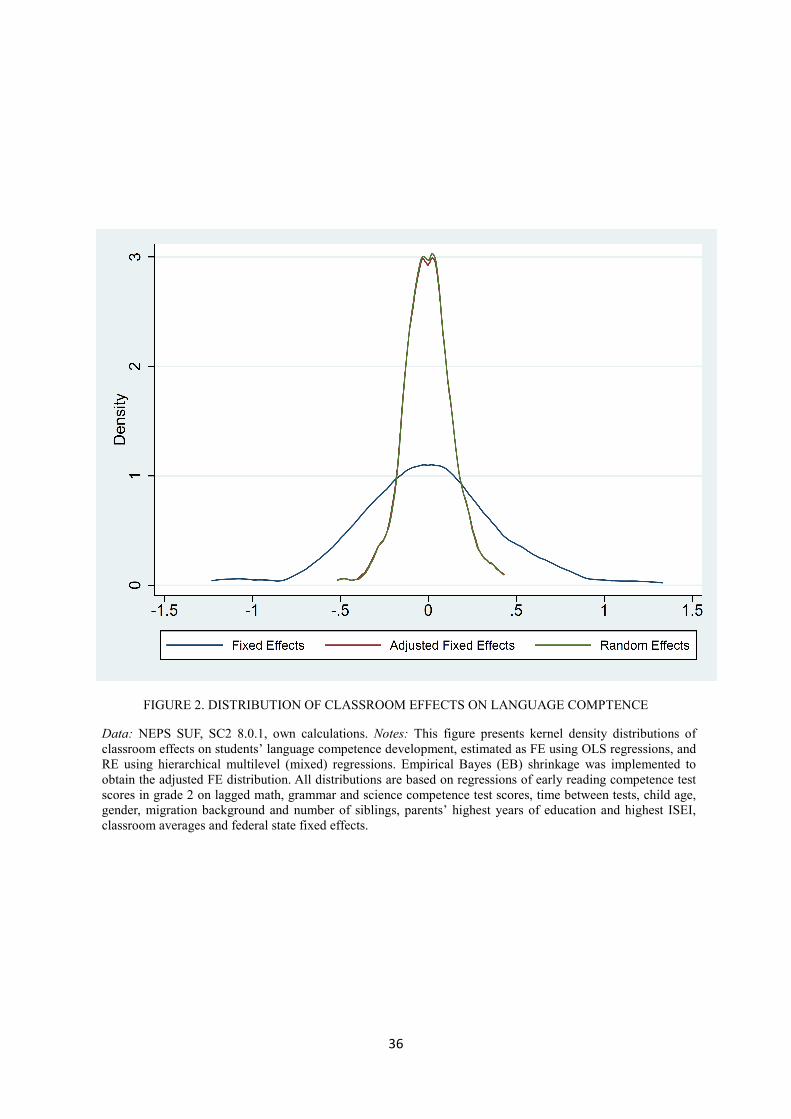
36
FIGURE 2. DISTRIBUTION OF CLASSROOM EFFECTS ON LANGUAGE COMPTENCE
Data: NEPS SUF, SC2 8.0.1, own calculations. Notes: This figure presents kernel density distributions of classroom effects on students’ language competence development, estimated as FE using OLS regressions, and RE using hierarchical multilevel (mixed) regressions. Empirical Bayes (EB) shrinkage was implemented to obtain the adjusted FE distribution. All distributions are based on regressions of early reading competence test scores in grade 2 on lagged math, grammar and science competence test scores, time between tests, child age, gender, migration background and number of siblings, parents’ highest years of education and highest ISEI, classroom averages and federal state fixed effects.
37
FIGURE 3. CLASSROOM RANKING BY EFFECTS ON MATH (ADJUSTED FIXED AND RANDOM EFFECTS)
Data: NEPS SUF, SC2 8.0.1, own calculations. Notes: This figure presents classroom rankings of predicted individual effects on students’ math competence development, estimated as FE using OLS regressions, and RE using hierarchical multilevel (mixed) regressions. Empirical Bayes (EB) shrinkage was implemented to obtain the adjusted FE. All distributions are based on regressions of math competence test scores in grade 2 on lagged math, grammar and science competence test scores, time between tests, child age, gender, migration background and number of siblings, parents’ highest years of education and highest ISEI, classroom averages and federal state fixed effects.
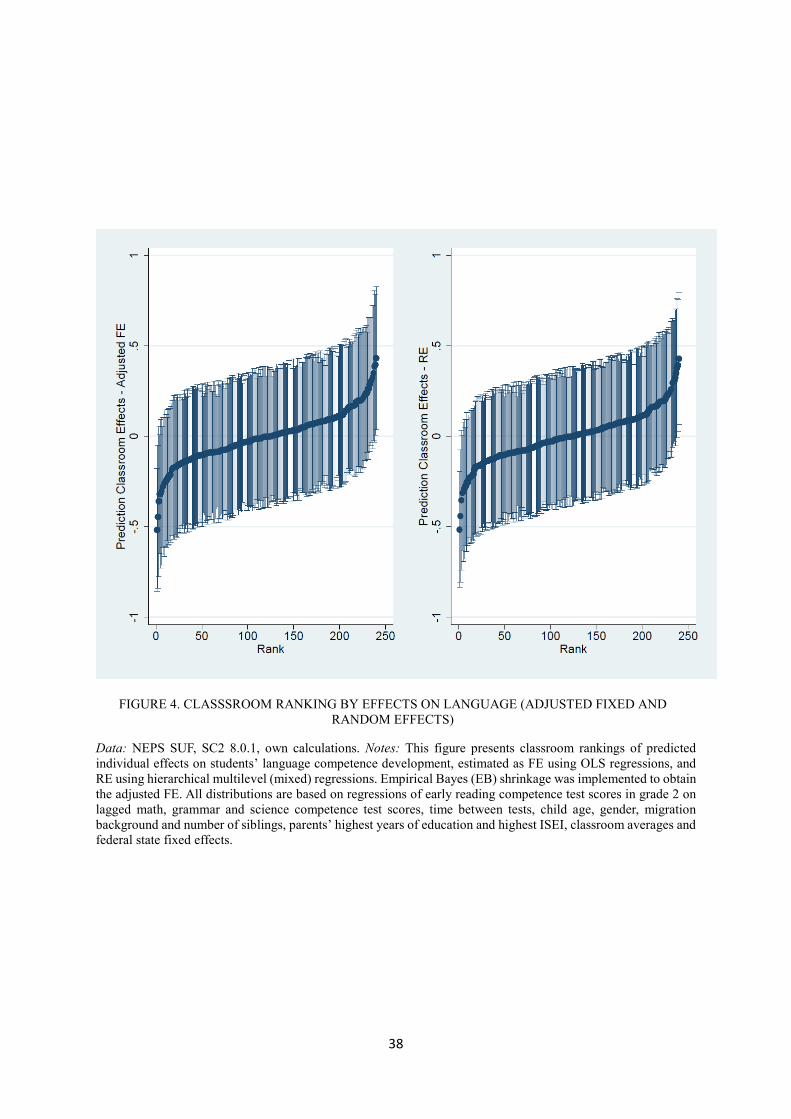
38
FIGURE 4. CLASSSROOM RANKING BY EFFECTS ON LANGUAGE (ADJUSTED FIXED AND RANDOM EFFECTS)
Data: NEPS SUF, SC2 8.0.1, own calculations. Notes: This figure presents classroom rankings of predicted individual effects on students’ language competence development, estimated as FE using OLS regressions, and RE using hierarchical multilevel (mixed) regressions. Empirical Bayes (EB) shrinkage was implemented to obtain the adjusted FE. All distributions are based on regressions of early reading competence test scores in grade 2 on lagged math, grammar and science competence test scores, time between tests, child age, gender, migration background and number of siblings, parents’ highest years of education and highest ISEI, classroom averages and federal state fixed effects.
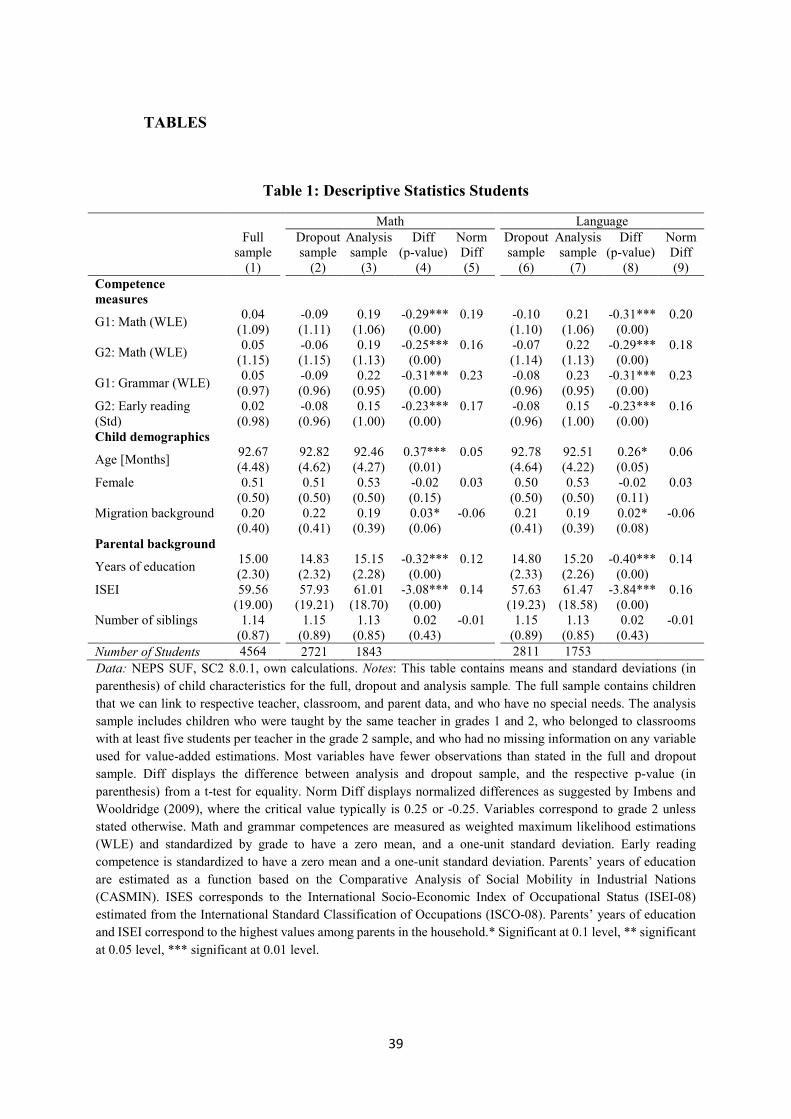
39
TABLES
Table 1: Descriptive Statistics Students
Math Language Full
sample (1)
Dropout sample
(2)
Analysis sample
(3)
Diff (p-value)
(4)
Norm Diff (5)
Dropout sample
(6)
Analysis sample
(7)
Diff (p-value)
(8)
Norm Diff (9)
Competence measures
G1: Math (WLE) 0.04 -0.09 0.19 -0.29*** 0.19 -0.10 0.21 -0.31*** 0.20 (1.09) (1.11) (1.06) (0.00) (1.10) (1.06) (0.00)
G2: Math (WLE) 0.05 -0.06 0.19 -0.25*** 0.16 -0.07 0.22 -0.29*** 0.18 (1.15) (1.15) (1.13) (0.00) (1.14) (1.13) (0.00)
G1: Grammar (WLE) 0.05 -0.09 0.22 -0.31*** 0.23 -0.08 0.23 -0.31*** 0.23 (0.97) (0.96) (0.95) (0.00) (0.96) (0.95) (0.00)
G2: Early reading (Std)
0.02 -0.08 0.15 -0.23*** 0.17 -0.08 0.15 -0.23*** 0.16 (0.98) (0.96) (1.00) (0.00) (0.96) (1.00) (0.00)
Child demographics
Age [Months] 92.67 92.82 92.46 0.37*** 0.05 92.78 92.51 0.26* 0.06 (4.48) (4.62) (4.27) (0.01) (4.64) (4.22) (0.05)
Female 0.51 0.51 0.53 -0.02 0.03 0.50 0.53 -0.02 0.03 (0.50) (0.50) (0.50) (0.15) (0.50) (0.50) (0.11) Migration background 0.20 0.22 0.19 0.03* -0.06 0.21 0.19 0.02* -0.06 (0.40) (0.41) (0.39) (0.06) (0.41) (0.39) (0.08) Parental background
Years of education 15.00 14.83 15.15 -0.32*** 0.12 14.80 15.20 -0.40*** 0.14 (2.30) (2.32) (2.28) (0.00) (2.33) (2.26) (0.00)
ISEI 59.56 57.93 61.01 -3.08*** 0.14 57.63 61.47 -3.84*** 0.16 (19.00) (19.21) (18.70) (0.00) (19.23) (18.58) (0.00) Number of siblings 1.14 1.15 1.13 0.02 -0.01 1.15 1.13 0.02 -0.01 (0.87) (0.89) (0.85) (0.43) (0.89) (0.85) (0.43) Number of Students 4564 2721 1843 2811 1753 Data: NEPS SUF, SC2 8.0.1, own calculations. Notes: This table contains means and standard deviations (in parenthesis) of child characteristics for the full, dropout and analysis sample. The full sample contains children that we can link to respective teacher, classroom, and parent data, and who have no special needs. The analysis sample includes children who were taught by the same teacher in grades 1 and 2, who belonged to classrooms with at least five students per teacher in the grade 2 sample, and who had no missing information on any variable used for value-added estimations. Most variables have fewer observations than stated in the full and dropout sample. Diff displays the difference between analysis and dropout sample, and the respective p-value (in parenthesis) from a t-test for equality. Norm Diff displays normalized differences as suggested by Imbens and Wooldridge (2009), where the critical value typically is 0.25 or -0.25. Variables correspond to grade 2 unless stated otherwise. Math and grammar competences are measured as weighted maximum likelihood estimations (WLE) and standardized by grade to have a zero mean, and a one-unit standard deviation. Early reading competence is standardized to have a zero mean and a one-unit standard deviation. Parents’ years of education are estimated as a function based on the Comparative Analysis of Social Mobility in Industrial Nations (CASMIN). ISES corresponds to the International Socio-Economic Index of Occupational Status (ISEI-08) estimated from the International Standard Classification of Occupations (ISCO-08). Parents’ years of education and ISEI correspond to the highest values among parents in the household.* Significant at 0.1 level, ** significant at 0.05 level, *** significant at 0.01 level.

40
Table 2: Descriptive Statistics Teachers
Math Language Full
sample (1)
Dropout sample
(2)
Analysis sample
(3)
Difference (p-value)
(4)
Norm Diff (5)
Dropout sample
(6)
Analysis sample
(7)
Difference (p-value)
(8)
Norm Diff (9)
Teacher
Gender 0.93 0.94 0.93 0.01*** -0.05 0.94 0.93 0.02*** -0.05 (0.25) (0.24) (0.26) (0.00) (0.24) (0.26) (0.00) Age 46.02 45.38 47.09 -1.15*** 0.10 45.56 46.85 -1.26*** 0.08 (10.73) (10.85) (10.47) (0.00) (10.91) (10.39) (0.00) Experience 20.38 19.53 21.77 -0.85*** 0.08 19.76 21.45 -0.88*** 0.05 (11.50) (11.59) (11.23) (0.00) (11.69) (11.10) (0.00) Has Abitur 0.94 0.93 0.94 -0.02*** 0.02 0.93 0.95 -0.01 0.02 (0.24) (0.25) (0.23) (0.00) (0.25) (0.23) (0.11) Abitur GPA 2.46 2.48 2.41 0.06*** -0.09 2.48 2.40 0.08*** -0.11 (0.52) (0.53) (0.49) (0.00) (0.53) (0.50) (0.00) FSE grade 1.99 1.99 1.98 0.01 -0.02 2.00 1.96 0.05*** -0.08 (0.47) (0.49) (0.42) (0.59) (0.49) (0.43) (0.00) Passed SEE 0.84 0.87 0.80 0.03*** -0.08 0.87 0.80 0.05*** -0.08 (0.36) (0.34) (0.40) (0.00) (0.34) (0.40) (0.00) SEE grade 1.93 1.93 1.93 0.01 -0.02 1.95 1.90 0.07*** -0.08 (0.57) (0.59) (0.55) (0.36) (0.59) (0.54) (0.00) Migration background 0.05 0.04 0.06 -0.03*** 0.10 0.04 0.07 -0.04*** 0.11 (0.22) (0.20) (0.25) (0.00) (0.20) (0.25) (0.00) Constructivist beliefs 3.38 3.38 3.38 -0.00 -0.02 3.38 3.38 0.00 -0.01 (0.39) (0.39) (0.39) (0.59) (0.39) (0.38) (0.63) Exhaustion 2.99 3.05 2.89 0.10*** -0.10 3.05 2.89 0.15*** -0.10 (1.04) (1.00) (1.11) (0.00) (1.00) (1.11) (0.00) Parental evaluation 3.59 3.59 3.60 -0.03 0.04 3.58 3.61 -0.04** 0.05 (0.36) (0.41) (0.26) (0.19) (0.41) (0.26) (0.03) Class size 21.92 21.70 22.27 -0.67*** 0.18 21.76 22.20 -0.81*** 0.16 (3.42) (3.33) (3.55) (0.00) (3.34) (3.55) (0.00) Number of Teachers 680 429 251 440 240
Data: NEPS SUF, SC2 8.0.1, own calculations. Notes: This table contains means and standard deviations (in parenthesis) of teacher characteristics of the full sample, the dropout, and analysis samples for math and language. The full sample contains all teachers with an individual identification number who can be linked to a classroom. The analysis sample comprises teachers who taught the same group of children in grades 1 and 2, who had at least five students in the grade 2 sample, and whose students had no missing information on any variable used for the value-added estimations. Most variables have fewer observations than stated in the full, dropout, and analysis sample. Diff displays the difference between analysis and dropout sample, and the respective p-value (in parenthesis) from a t-test for equality. Norm Diff displays normalized differences as suggested by Imbens and Wooldridge (2009), where the critical value typically is 0.25 or -0.25. Self-reported Abitur GPA, First State Examination (FSE) and Second State Examination (SSE) grades have a scale that ranges from 1.0 to 4.0, with 1.0 being the best possible grade and 4.0 the minimum passing grade. The constructivist beliefs’ index and the parental evaluation indicator are on a scale ranging from 1 to 4, with 4 being the highest possible score. The exhaustion index is on a scale from 1 to 5, with 5 being the highest possible score. * Significant at 0.1 level, ** significant at 0.05 level, *** significant at 0.01 level.
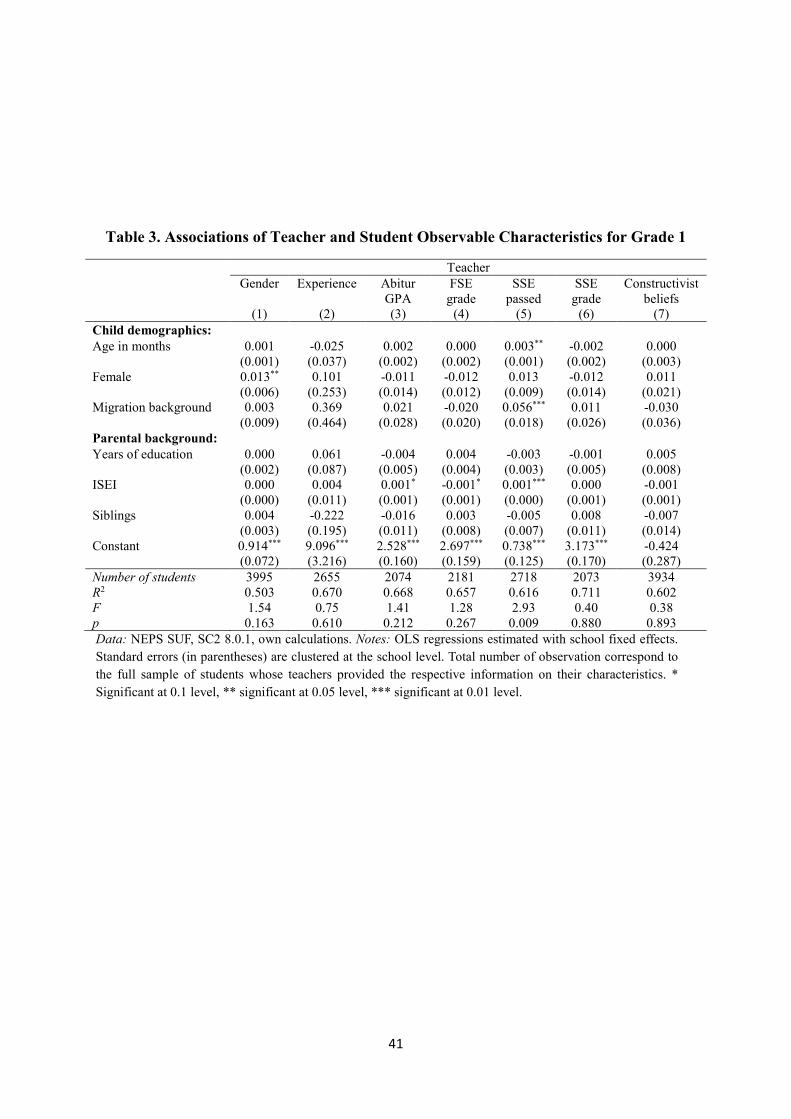
41
Table 3. Associations of Teacher and Student Observable Characteristics for Grade 1
Teacher Gender Experience Abitur
GPA FSE
grade SSE
passed SSE
grade Constructivist
beliefs (1) (2) (3) (4) (5) (6) (7) Child demographics: Age in months 0.001
(0.001) -0.025 (0.037)
0.002 (0.002)
0.000 (0.002)
0.003** (0.001)
-0.002 (0.002)
0.000 (0.003)
Female 0.013** (0.006)
0.101 (0.253)
-0.011 (0.014)
-0.012 (0.012)
0.013 (0.009)
-0.012 (0.014)
0.011 (0.021)
Migration background 0.003 (0.009)
0.369 (0.464)
0.021 (0.028)
-0.020 (0.020)
0.056*** (0.018)
0.011 (0.026)
-0.030 (0.036)
Parental background: Years of education 0.000
(0.002) 0.061
(0.087) -0.004 (0.005)
0.004 (0.004)
-0.003 (0.003)
-0.001 (0.005)
0.005 (0.008)
ISEI 0.000 (0.000)
0.004 (0.011)
0.001* (0.001)
-0.001* (0.001)
0.001*** (0.000)
0.000 (0.001)
-0.001 (0.001)
Siblings 0.004 (0.003)
-0.222 (0.195)
-0.016 (0.011)
0.003 (0.008)
-0.005 (0.007)
0.008 (0.011)
-0.007 (0.014)
Constant 0.914*** (0.072)
9.096*** (3.216)
2.528*** (0.160)
2.697*** (0.159)
0.738*** (0.125)
3.173*** (0.170)
-0.424 (0.287)
Number of students 3995 2655 2074 2181 2718 2073 3934 R2 0.503 0.670 0.668 0.657 0.616 0.711 0.602 F 1.54 0.75 1.41 1.28 2.93 0.40 0.38 p 0.163 0.610 0.212 0.267 0.009 0.880 0.893 Data: NEPS SUF, SC2 8.0.1, own calculations. Notes: OLS regressions estimated with school fixed effects. Standard errors (in parentheses) are clustered at the school level. Total number of observation correspond to the full sample of students whose teachers provided the respective information on their characteristics. * Significant at 0.1 level, ** significant at 0.05 level, *** significant at 0.01 level.
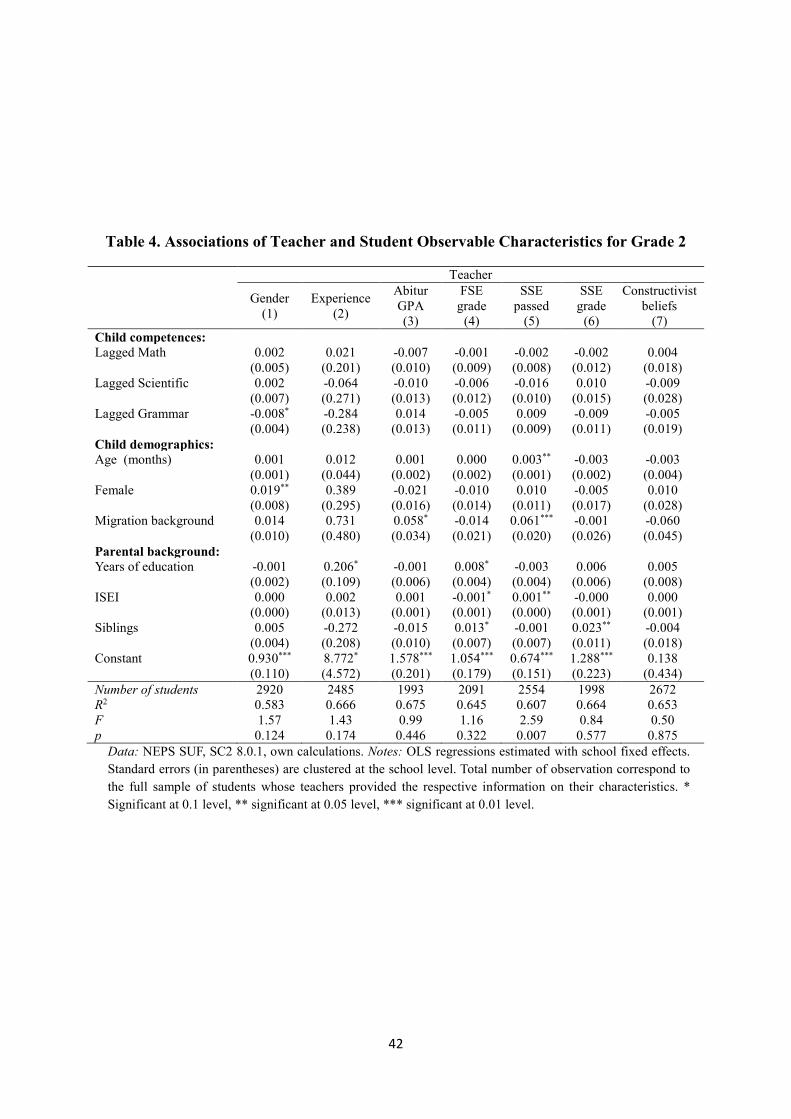
42
Table 4. Associations of Teacher and Student Observable Characteristics for Grade 2
Teacher Gender
(1) Experience
(2)
Abitur GPA (3)
FSE grade
(4)
SSE passed
(5)
SSE grade
(6)
Constructivist beliefs
(7) Child competences: Lagged Math 0.002
(0.005) 0.021
(0.201) -0.007 (0.010)
-0.001 (0.009)
-0.002 (0.008)
-0.002 (0.012)
0.004 (0.018)
Lagged Scientific 0.002 (0.007)
-0.064 (0.271)
-0.010 (0.013)
-0.006 (0.012)
-0.016 (0.010)
0.010 (0.015)
-0.009 (0.028)
Lagged Grammar -0.008* (0.004)
-0.284 (0.238)
0.014 (0.013)
-0.005 (0.011)
0.009 (0.009)
-0.009 (0.011)
-0.005 (0.019)
Child demographics: Age (months) 0.001
(0.001) 0.012
(0.044) 0.001
(0.002) 0.000
(0.002) 0.003** (0.001)
-0.003 (0.002)
-0.003 (0.004)
Female 0.019** (0.008)
0.389 (0.295)
-0.021 (0.016)
-0.010 (0.014)
0.010 (0.011)
-0.005 (0.017)
0.010 (0.028)
Migration background 0.014 (0.010)
0.731 (0.480)
0.058* (0.034)
-0.014 (0.021)
0.061*** (0.020)
-0.001 (0.026)
-0.060 (0.045)
Parental background: Years of education -0.001
(0.002) 0.206* (0.109)
-0.001 (0.006)
0.008* (0.004)
-0.003 (0.004)
0.006 (0.006)
0.005 (0.008)
ISEI 0.000 (0.000)
0.002 (0.013)
0.001 (0.001)
-0.001* (0.001)
0.001** (0.000)
-0.000 (0.001)
0.000 (0.001)
Siblings 0.005 (0.004)
-0.272 (0.208)
-0.015 (0.010)
0.013* (0.007)
-0.001 (0.007)
0.023** (0.011)
-0.004 (0.018)
Constant 0.930*** (0.110)
8.772* (4.572)
1.578*** (0.201)
1.054*** (0.179)
0.674*** (0.151)
1.288*** (0.223)
0.138 (0.434)
Number of students 2920 2485 1993 2091 2554 1998 2672 R2 0.583 0.666 0.675 0.645 0.607 0.664 0.653 F 1.57 1.43 0.99 1.16 2.59 0.84 0.50 p 0.124 0.174 0.446 0.322 0.007 0.577 0.875
Data: NEPS SUF, SC2 8.0.1, own calculations. Notes: OLS regressions estimated with school fixed effects. Standard errors (in parentheses) are clustered at the school level. Total number of observation correspond to the full sample of students whose teachers provided the respective information on their characteristics. * Significant at 0.1 level, ** significant at 0.05 level, *** significant at 0.01 level.

43
Table 5. Value-Added to Math Competence with and without Classroom Effects
OLS (Fixed Effects)
HML (Rando Effects)
(1) (2) (3) (4) Child competences: Lagged Math 0.520***
(0.025) 0.497*** (0.026)
0.520*** (0.023)
0.513*** (0.023)
Lagged Scientific 0.195*** (0.032)
0.265*** (0.034)
0.195*** (0.031)
0.216*** (0.031)
Lagged Grammar 0.160*** (0.028)
0.143*** (0.029)
0.160*** (0.025)
0.155*** (0.025)
Child demographics: Age 0.003
(0.005) 0.001
(0.005) 0.003
(0.005) 0.002
(0.005)
Female -0.209*** (0.039)
-0.206*** (0.040)
-0.209*** (0.039)
-0.208*** (0.038)
Migration background 0.062 (0.047)
0.105** (0.052)
0.062 (0.050)
0.071 (0.051)
Time between tests 0.111*** (0.013)
0.044 (0.174)
0.111*** (0.013)
0.109*** (0.015)
Parental background: Years of education 0.007
(0.012) 0.018
(0.012) 0.007
(0.012) 0.010
(0.012)
ISEI 0.003** (0.001)
0.002 (0.001)
0.003** (0.001)
0.003** (0.001)
Siblings -0.024 (0.022)
-0.016 (0.022)
-0.024 (0.022)
-0.023 (0.022)
Classroom: Class size -0.002
(0.006) -0.117 (0.146)
-0.002 (0.006)
-0.003 (0.007)
Female proportion -0.000 (0.002)
0.038 (0.054)
-0.000 (0.002)
-0.001 (0.002)
Average ISEI 0.000 (0.002)
-0.027 (0.065)
0.000 (0.002)
-0.000 (0.003)
Constant -1.159** (0.541)
1.548 (3.661)
-1.159** (0.533)
-1.094** (0.556)
var(Classroom)
0.044*** (0.012)
var(Residual)
0.645*** (0.021)
0.601*** (0.021)
Federal State Effect YES YES YES YES Classroom Effect NO YES NO YE Number of students 1843 1843 1843 1843 Number of teachers/classrooms 251 251 251 251 R2 0.493 0.592 Adjusted R2 0.485 0.525 Data: NEPS SUF, SC2 8.0.1, own calculations. Notes: Columns (1) and (2) report coefficients from OLS regressions estimated without and with classroom effects, respectively. Columns (3) and (4) report coefficients from a hierarchical multilevel (mixed) model without and with classroom random effects, respectively. Standard errors (in parentheses) are clustered at the student level in the OLS regressions. *Significant at 0.1 level, ** significant at 0.05 level, *** significant at 0.01 level.
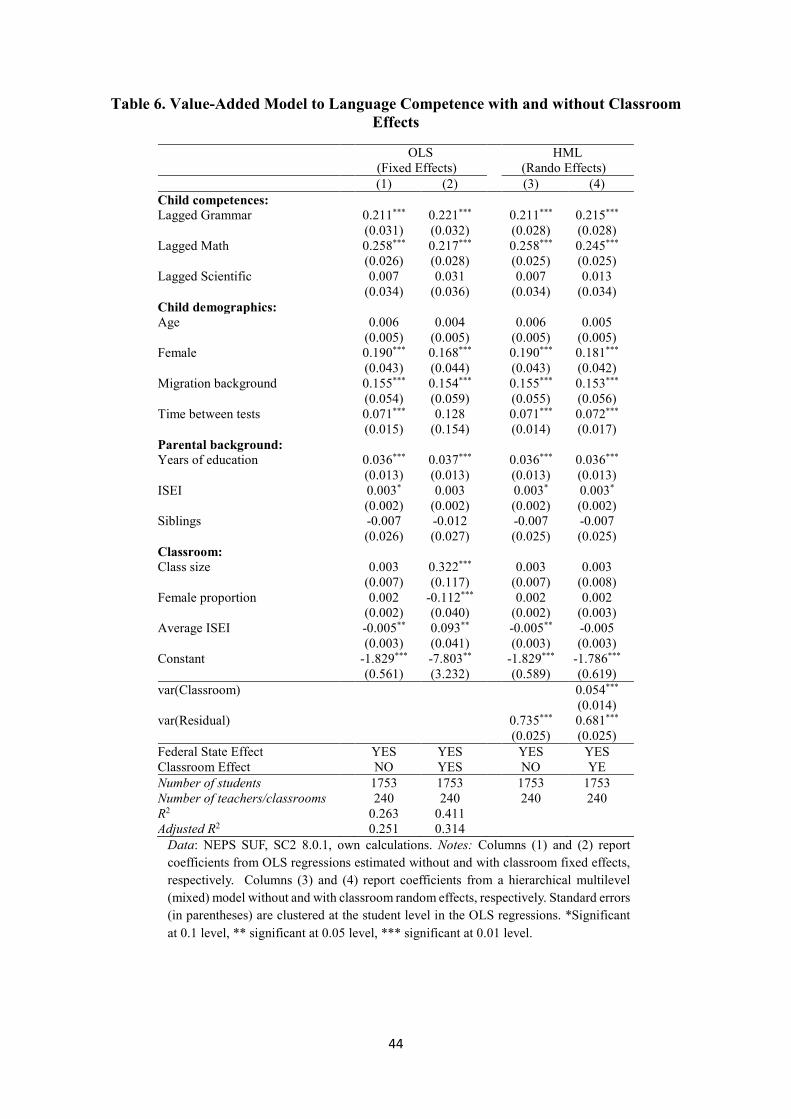
44
Table 6. Value-Added Model to Language Competence with and without Classroom Effects
OLS (Fixed Effects)
HML (Rando Effects)
(1) (2) (3) (4) Child competences: Lagged Grammar 0.211***
(0.031) 0.221*** (0.032)
0.211*** (0.028)
0.215*** (0.028)
Lagged Math 0.258*** (0.026)
0.217*** (0.028)
0.258*** (0.025)
0.245*** (0.025)
Lagged Scientific 0.007 (0.034)
0.031 (0.036)
0.007 (0.034)
0.013 (0.034)
Child demographics: Age 0.006
(0.005) 0.004
(0.005) 0.006
(0.005) 0.005
(0.005) Female 0.190***
(0.043) 0.168*** (0.044)
0.190*** (0.043)
0.181*** (0.042)
Migration background 0.155*** (0.054)
0.154*** (0.059)
0.155*** (0.055)
0.153*** (0.056)
Time between tests 0.071*** (0.015)
0.128 (0.154)
0.071*** (0.014)
0.072*** (0.017)
Parental background: Years of education 0.036***
(0.013) 0.037*** (0.013)
0.036*** (0.013)
0.036*** (0.013)
ISEI 0.003* (0.002)
0.003 (0.002)
0.003* (0.002)
0.003* (0.002)
Siblings -0.007 (0.026)
-0.012 (0.027)
-0.007 (0.025)
-0.007 (0.025)
Classroom: Class size 0.003
(0.007) 0.322*** (0.117)
0.003 (0.007)
0.003 (0.008)
Female proportion 0.002 (0.002)
-0.112*** (0.040)
0.002 (0.002)
0.002 (0.003)
Average ISEI -0.005** (0.003)
0.093** (0.041)
-0.005** (0.003)
-0.005 (0.003)
Constant -1.829*** (0.561)
-7.803** (3.232)
-1.829*** (0.589)
-1.786*** (0.619)
var(Classroom)
0.054*** (0.014)
var(Residual)
0.735*** (0.025)
0.681*** (0.025)
Federal State Effect YES YES YES YES Classroom Effect NO YES NO YE Number of students 1753 1753 1753 1753 Number of teachers/classrooms 240 240 240 240 R2 0.263 0.411 Adjusted R2 0.251 0.314
Data: NEPS SUF, SC2 8.0.1, own calculations. Notes: Columns (1) and (2) report coefficients from OLS regressions estimated without and with classroom fixed effects, respectively. Columns (3) and (4) report coefficients from a hierarchical multilevel (mixed) model without and with classroom random effects, respectively. Standard errors (in parentheses) are clustered at the student level in the OLS regressions. *Significant at 0.1 level, ** significant at 0.05 level, *** significant at 0.01 level.
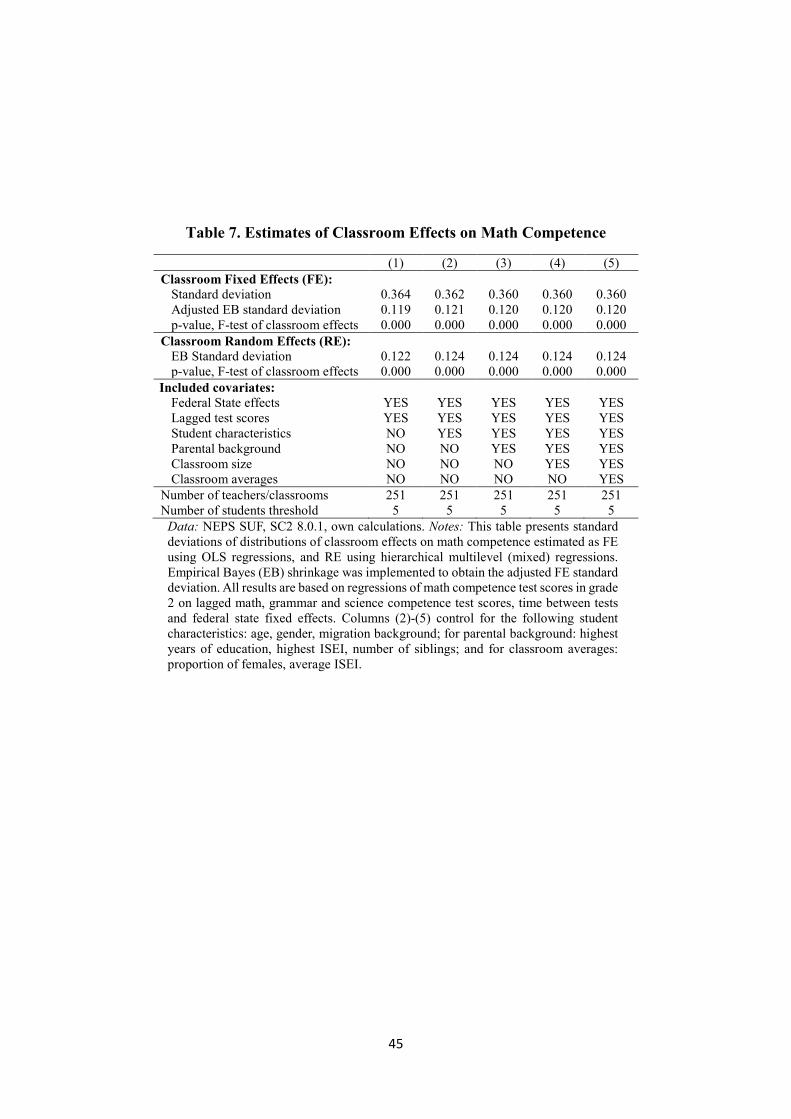
45
Table 7. Estimates of Classroom Effects on Math Competence
(1) (2) (3) (4) (5) Classroom Fixed Effects (FE):
Standard deviation 0.364 0.362 0.360 0.360 0.360 Adjusted EB standard deviation 0.119 0.121 0.120 0.120 0.120 p-value, F-test of classroom effects 0.000 0.000 0.000 0.000 0.000
Classroom Random Effects (RE): EB Standard deviation 0.122 0.124 0.124 0.124 0.124 p-value, F-test of classroom effects 0.000 0.000 0.000 0.000 0.000
Included covariates: Federal State effects YES YES YES YES YES Lagged test scores YES YES YES YES YES Student characteristics NO YES YES YES YES Parental background NO NO YES YES YES Classroom size NO NO NO YES YES Classroom averages NO NO NO NO YES
Number of teachers/classrooms 251 251 251 251 251 Number of students threshold 5 5 5 5 5
Data: NEPS SUF, SC2 8.0.1, own calculations. Notes: This table presents standard deviations of distributions of classroom effects on math competence estimated as FE using OLS regressions, and RE using hierarchical multilevel (mixed) regressions. Empirical Bayes (EB) shrinkage was implemented to obtain the adjusted FE standard deviation. All results are based on regressions of math competence test scores in grade 2 on lagged math, grammar and science competence test scores, time between tests and federal state fixed effects. Columns (2)-(5) control for the following student characteristics: age, gender, migration background; for parental background: highest years of education, highest ISEI, number of siblings; and for classroom averages: proportion of females, average ISEI.

46
Table 8. Estimates of Classroom Effects on Language Competence
(1) (2) (3) (4) (5) Classroom Fixed Effects (FE):
Standard deviation 0.403 0.398 0.397 0.397 0.396 Adjusted EB standard deviation 0.149 0.142 0.146 0.145 0.142 p-value, F-test of classroom effects 0.000 0.000 0.000 0.000 0.000
Classroom Random Effects (FE): EB Standard deviation 0.148 0.141 0.145 0.145 0.140 p-value, F-test of classroom effects 0.000 0.000 0.000 0.000 0.000
Included covariates: Federal State effects YES YES YES YES YES Lagged test scores YES YES YES YES YES Student characteristics NO YES YES YES YES Family background NO NO YES YES YES Classroom size NO NO NO YES YES Classroom averages NO NO NO NO YES
Number of teachers/classrooms 240 240 240 240 240 Number of students threshold 5 5 5 5 5
Data: NEPS SUF, SC2 8.0.1, own calculations. Notes: This table presents standard deviations of distributions of classroom effects on language competence estimated as FE using OLS regressions, and RE using hierarchical multilevel (mixed) regressions. Empirical Bayes (EB) shrinkage was implemented to obtain the adjusted FE standard deviation. All results are based on regressions of early reading competence test scores in grade 2 on lagged math, grammar and science competence test scores, time between tests and federal state fixed effects. Columns (2)-(5) control for the following student characteristics: age, gender, migration background; for parental background: highest years of education, highest ISEI, number of siblings; and for classroom averages: proportion of females, average ISEI.
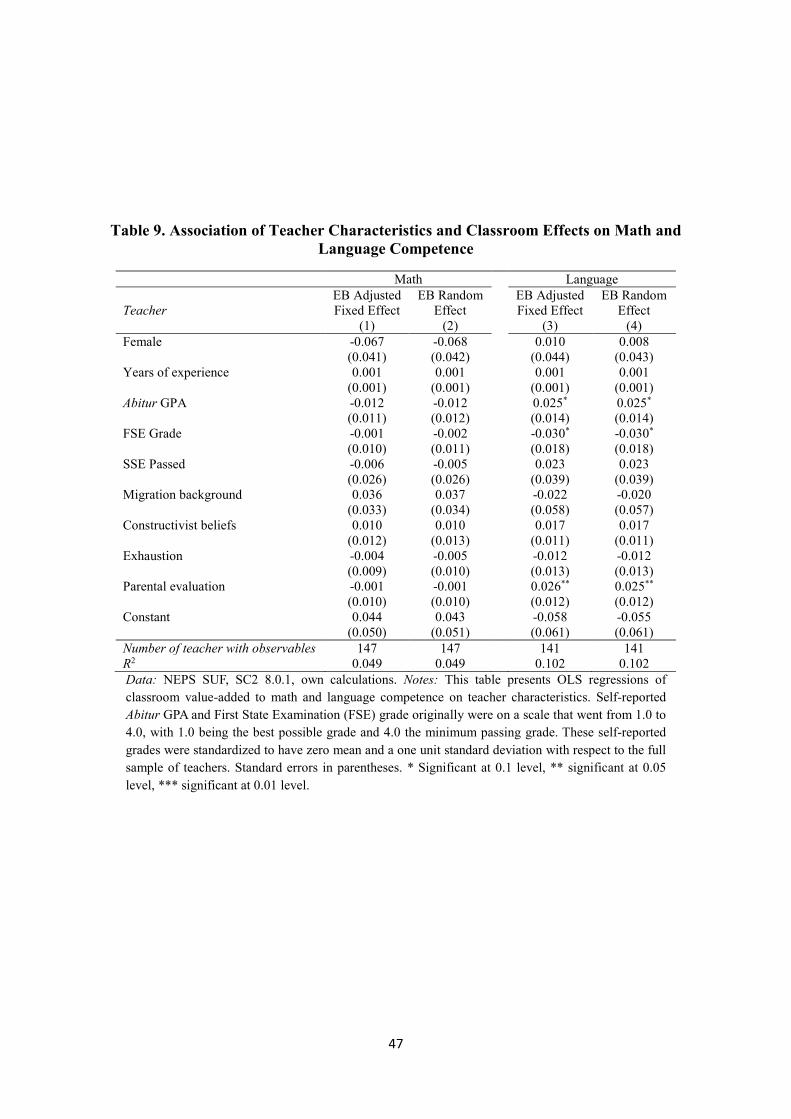
47
Table 9. Association of Teacher Characteristics and Classroom Effects on Math and Language Competence
Math Language Teacher
EB Adjusted Fixed Effect
(1)
EB Random Effect
(2)
EB Adjusted Fixed Effect
(3)
EB Random Effect
(4) Female -0.067
(0.041) -0.068 (0.042)
0.010 (0.044)
0.008 (0.043)
Years of experience 0.001 (0.001)
0.001 (0.001)
0.001 (0.001)
0.001 (0.001)
Abitur GPA -0.012 (0.011)
-0.012 (0.012)
0.025* (0.014)
0.025* (0.014)
FSE Grade -0.001 (0.010)
-0.002 (0.011)
-0.030* (0.018)
-0.030* (0.018)
SSE Passed -0.006 (0.026)
-0.005 (0.026)
0.023 (0.039)
0.023 (0.039)
Migration background 0.036 (0.033)
0.037 (0.034)
-0.022 (0.058)
-0.020 (0.057)
Constructivist beliefs 0.010 (0.012)
0.010 (0.013)
0.017 (0.011)
0.017 (0.011)
Exhaustion -0.004 (0.009)
-0.005 (0.010)
-0.012 (0.013)
-0.012 (0.013)
Parental evaluation -0.001 (0.010)
-0.001 (0.010)
0.026** (0.012)
0.025** (0.012)
Constant 0.044 (0.050)
0.043 (0.051)
-0.058 (0.061)
-0.055 (0.061)
Number of teacher with observables 147 147 141 141 R2 0.049 0.049 0.102 0.102 Data: NEPS SUF, SC2 8.0.1, own calculations. Notes: This table presents OLS regressions of classroom value-added to math and language competence on teacher characteristics. Self-reported Abitur GPA and First State Examination (FSE) grade originally were on a scale that went from 1.0 to 4.0, with 1.0 being the best possible grade and 4.0 the minimum passing grade. These self-reported grades were standardized to have zero mean and a one unit standard deviation with respect to the full sample of teachers. Standard errors in parentheses. * Significant at 0.1 level, ** significant at 0.05 level, *** significant at 0.01 level.
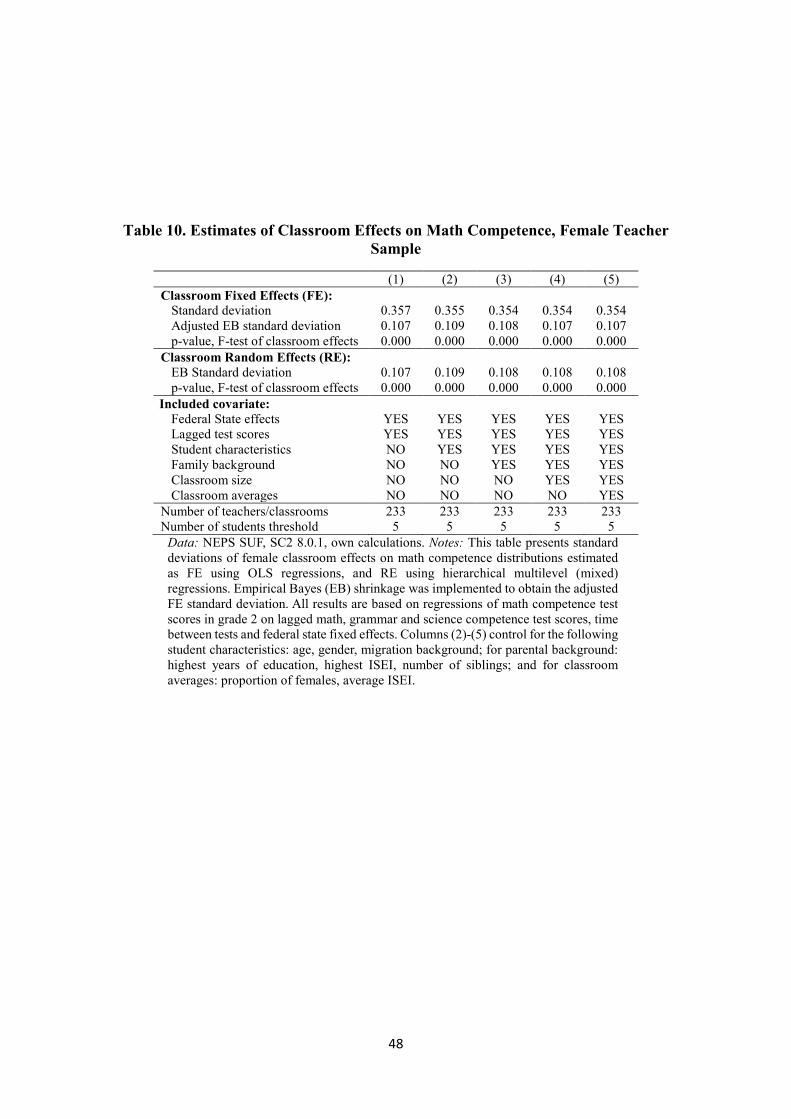
48
Table 10. Estimates of Classroom Effects on Math Competence, Female Teacher Sample
(1) (2) (3) (4) (5) Classroom Fixed Effects (FE):
Standard deviation 0.357 0.355 0.354 0.354 0.354 Adjusted EB standard deviation 0.107 0.109 0.108 0.107 0.107 p-value, F-test of classroom effects 0.000 0.000 0.000 0.000 0.000
Classroom Random Effects (RE): EB Standard deviation 0.107 0.109 0.108 0.108 0.108 p-value, F-test of classroom effects 0.000 0.000 0.000 0.000 0.000
Included covariate: Federal State effects YES YES YES YES YES Lagged test scores YES YES YES YES YES Student characteristics NO YES YES YES YES Family background NO NO YES YES YES Classroom size NO NO NO YES YES Classroom averages NO NO NO NO YES
Number of teachers/classrooms 233 233 233 233 233 Number of students threshold 5 5 5 5 5
Data: NEPS SUF, SC2 8.0.1, own calculations. Notes: This table presents standard deviations of female classroom effects on math competence distributions estimated as FE using OLS regressions, and RE using hierarchical multilevel (mixed) regressions. Empirical Bayes (EB) shrinkage was implemented to obtain the adjusted FE standard deviation. All results are based on regressions of math competence test scores in grade 2 on lagged math, grammar and science competence test scores, time between tests and federal state fixed effects. Columns (2)-(5) control for the following student characteristics: age, gender, migration background; for parental background: highest years of education, highest ISEI, number of siblings; and for classroom averages: proportion of females, average ISEI.

49
Table 11. Estimates of Classroom Effects on Language Competence, Female Teacher Sample
(1) (2) (3) (4) (5) Classroom Fixed Effects (FE):
Standard deviation 0.393 0.389 0.387 0.387 0.385 Adjusted EB standard deviation 0.134 0.129 0.132 0.132 0.128 p-value, F-test of classroom effects 0.000 0.000 0.000 0.000 0.000
Classroom Random Effects (RE): EB Standard deviation 0.134 0.128 0.132 0.132 0.128 p-value, F-test of classroom effects 0.000 0.000 0.000 0.000 0.000
Included covariate: Federal State effects YES YES YES YES YES Lagged test scores YES YES YES YES YES Student characteristics NO YES YES YES YES Family background NO NO YES YES YES Classroom size NO NO NO YES YES Classroom averages NO NO NO NO YES
Number of teachers/classrooms 223 223 223 223 223 Number of students threshold 5 5 5 5 5
Data: NEPS SUF, SC2 8.0.1, own calculations. Notes: This table presents standard deviations of female classroom effects on language competence distributions estimated as FE using OLS regressions, and RE using hierarchical multilevel (mixed) regressions. Empirical Bayes (EB) shrinkage was implemented to obtain the adjusted FE standard deviation. All results are based on regressions of early reading competence test scores in grade 2 on lagged math, grammar and science competence test scores, time between tests and federal state fixed effects. Columns (2)-(5) control for the following student characteristics: age, gender, migration background; for parental background: highest years of education, highest ISEI, number of siblings; and for classroom averages: proportion of females, average ISEI.

50
Table 12. Association of Teacher Characteristics and Classroom Effects on Math and Language Competence, Female Teacher Sample
Math Language Teacher
EB Adjusted Fixed Effect
(1)
EB Random Effect
(2)
EB Adjusted Fixed Effect
(3)
EB Random Effect
(4) Years of experience 0.001
(0.001) 0.001
(0.001) 0.001
(0.001) 0.001
(0.001) Abitur GPA -0.012
(0.010) -0.012 (0.011)
0.015 (0.013)
0.014 (0.013)
FSE Grade -0.003 (0.010)
-0.003 (0.010)
-0.027 (0.018)
-0.027 (0.018)
SSE Passed -0.014 (0.024)
-0.014 (0.024)
0.033 (0.039)
0.033 (0.039)
Migration background 0.039 (0.032)
0.039 (0.032)
-0.019 (0.053)
-0.018 (0.053)
Constructivist beliefs 0.007 (0.011)
0.007 (0.012)
0.015 (0.011)
0.015 (0.011)
Exhaustion -0.007 (0.009)
-0.007 (0.009)
-0.008 (0.013)
-0.008 (0.013)
Parental evaluation -0.001 (0.009)
-0.001 (0.009)
0.024** (0.011)
0.024** (0.011)
Constant -0.018 (0.029)
-0.019 (0.030)
-0.062 (0.044)
-0.059 (0.044)
Number of teacher with observables 135 135 129 129 R2 0.046 0.046 0.097 0.096 Data: NEPS SUF, SC2 8.0.1, own calculations. Notes: This table presents OLS regressions of female classroom value-added to math and language competence on teacher characteristics. Self-reported Abitur GPA and First State Examination (FSE) grades originally were on scale from 1.0 to 4.0, with 1.0 being the best possible grade and 4.0 the minimum passing grade. These self-reported grades were standardized to have zero mean and a one-unit standard deviation with respect to the full sample of teachers. Standard errors in parentheses. * Significant at 0.1 level, ** significant at 0.05 level, *** significant at 0.01 level.

51
Table 13. Parental Evaluation of Teacher Quality and Behavioral Responses
Time Helping with Homework (h)
Private Tutoring
Private Tutoring (German)
(1) (2) (3) (4) (5) (6) Teacher meets child's needs: Does rather apply -0.369
(0.308) -0.181 (0.294)
-0.083** (0.036)
-0.076** (0.035)
-0.064** (0.031)
-0.061** (0.031)
Does apply -0.221 (0.299)
-0.086 (0.283)
-0.089** (0.035)
-0.082** (0.035)
-0.073* (0.031)
-0.071** (0.031)
Included covariates: Federal State effects YES YES YES YES YES YES Lagged test scores NO YES NO YES NO YES Student characteristics NO YES NO YES NO YES Family background NO YES NO YES NO YES Classroom size NO YES NO YES NO YES Classroom averages NO YES NO YES NO YES N 1652 1652 1752 1752 1752 1752 R2 0.015 0.049 0.026 0.052 0.037 0.049 Data: NEPS SUF, SC2 8.0.1, own calculations. Notes: Column (1) and (2) results are based on OLS regressions of parental time spent helping with children’s homework in a typical school week (hours) on parental evaluation of teacher quality measured on a 3-point Likert scale (base category: “Does not/rather not apply”) in grade 2. Column (3) and (4) results are based on OLS regressions of whether the child receives private tutoring on parental evaluation of teacher quality in grade 2. Column (5) and 6) results are based on OLS regressions of whether the child receives private tutoring for language (German) on parental evaluation of teacher quality in grade 2. Columns (2), (4), and (6) control for the following student characteristics: lagged math, language and science competence, age, gender, migration background, parental background, highest years of education, highest ISEI, number of siblings, classroom averages, proportion of females, average ISEI. Standard errors (in parentheses) clustered at the individual level. Total number of observations corresponds to valid parental answers to the dependent variables in the language student sample. * Significant at 0.1 level, ** significant at 0.05 level, *** significant at 0.01 level.

52
APPENDIX
A. Robustness Check
The NEPS SC2 data provides information on classroom teachers for the primary school
grades assuming that one teacher is responsible for teaching all main subjects in the classroom,
which is common practice in the German school system and consistent with teaching careers
at the primary school level (KMK, 2019). Nonetheless, after a closer look at the classroom
questionnaires, we found a subsample of teachers who explicitly declared to be responsible for
math and/or language instruction in grade 2. Under this scenario, our math sample is reduced
to 1,326 students and 182 teachers, and our language sample to 1,542 students and 211 teachers.
We rerun our analysis for these subsamples of teachers and present the estimations of the
classroom effects on student math competence in table A1, and on language competence in
table A2, following the structure of table 7.
Results in table A1 show that we obtain practically the same adjusted FE and RE
distributions of classroom quality or effects on student math competence, compared to the
original sample. Our preferred model specification, which includes a full set of control
variables in column (5), shows that a one standard deviation increase in classroom quality is
associated with a 0.124 standard deviation higher student math competence score when
estimated with adjusted FE, and with a 0.129 standard deviation when estimated with RE. By
contrast, we find slightly smaller standard deviations in the distributions of classroom effects
on student language competence, displayed in table A2. Our preferred estimations of the
classroom adjusted FE and RE distributions presented in column (5) correspond to 0.124 and
0.123 standard deviations respectively, which are about two percentage points smaller than
those found in the original sample.
Table A3 show the association between our vector of teacher characteristics and the
estimated classroom effects on student math and language competences, following the same
structure of table 9. It should be noted that the number of observations with full information is
thus reduced to 107 math teachers and 130 language teachers, which implies higher selectivity
in the sample. Columns (1) and (2) show a consistent negative association between classroom
value-added to math competence and being a female teacher, which is statically significant at
the five percent significance level for the adjusted FE and RE specifications. Moreover, there
is also a negative association with Abitur GPA at the 5 percent significance level for the
adjusted FE estimation and at the 10 percent for the RE, which actually means that higher math
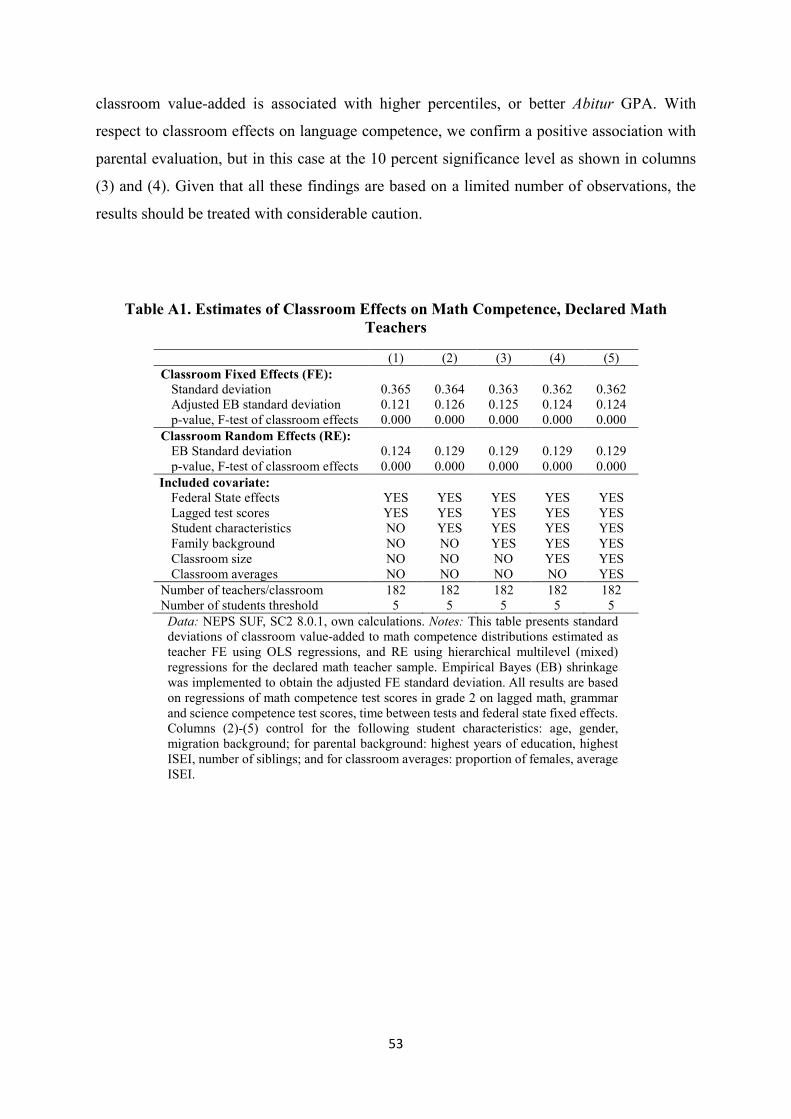
53
classroom value-added is associated with higher percentiles, or better Abitur GPA. With
respect to classroom effects on language competence, we confirm a positive association with
parental evaluation, but in this case at the 10 percent significance level as shown in columns
(3) and (4). Given that all these findings are based on a limited number of observations, the
results should be treated with considerable caution.
Table A1. Estimates of Classroom Effects on Math Competence, Declared Math Teachers
(1) (2) (3) (4) (5) Classroom Fixed Effects (FE):
Standard deviation 0.365 0.364 0.363 0.362 0.362 Adjusted EB standard deviation 0.121 0.126 0.125 0.124 0.124 p-value, F-test of classroom effects 0.000 0.000 0.000 0.000 0.000
Classroom Random Effects (RE): EB Standard deviation 0.124 0.129 0.129 0.129 0.129 p-value, F-test of classroom effects 0.000 0.000 0.000 0.000 0.000
Included covariate: Federal State effects YES YES YES YES YES Lagged test scores YES YES YES YES YES Student characteristics NO YES YES YES YES Family background NO NO YES YES YES Classroom size NO NO NO YES YES Classroom averages NO NO NO NO YES
Number of teachers/classroom 182 182 182 182 182 Number of students threshold 5 5 5 5 5
Data: NEPS SUF, SC2 8.0.1, own calculations. Notes: This table presents standard deviations of classroom value-added to math competence distributions estimated as teacher FE using OLS regressions, and RE using hierarchical multilevel (mixed) regressions for the declared math teacher sample. Empirical Bayes (EB) shrinkage was implemented to obtain the adjusted FE standard deviation. All results are based on regressions of math competence test scores in grade 2 on lagged math, grammar and science competence test scores, time between tests and federal state fixed effects. Columns (2)-(5) control for the following student characteristics: age, gender, migration background; for parental background: highest years of education, highest ISEI, number of siblings; and for classroom averages: proportion of females, average ISEI.

54
Table A2. Estimates of Classroom Effects on Language Competence, Declared Language Teachers
(1) (2) (3) (4) (5) Classroom Fixed Effects (FE):
Standard deviation 0.391 0.386 0.387 0.387 0.384 Adjusted EB standard deviation 0.131 0.124 0.130 0.129 0.124 p-value, F-test of classroom effects 0.000 0.000 0.000 0.000 0.000
Classroom Random Effects (RE): EB Standard deviation 0.131 0.124 0.131 0.130 0.123 p-value, F-test of classroom effects 0.000 0.000 0.000 0.000 0.000
Included covariate: Federal State effects YES YES YES YES YES Lagged test scores YES YES YES YES YES Student characteristics NO YES YES YES YES Family background NO NO YES YES YES Classroom size NO NO NO YES YES Classroom averages NO NO NO NO YES
Number of teachers/classrooms 211 211 211 211 211 Number of students threshold 5 5 5 5 5
Data: NEPS SUF, SC2 8.0.1, own calculations. Notes: This table presents standard deviations of classroom value-added to math competence distributions estimated as teacher FE using OLS regressions, and RE using hierarchical multilevel (mixed) regressions for the declared language teacher sample. Empirical Bayes (EB) shrinkage was implemented to obtain the adjusted FE standard deviation. All results are based on regressions of math competence test scores in grade 2 on lagged math, grammar and science competence test scores, time between tests and federal state fixed effects. Columns (2)-(5) control for the following student characteristics: age, gender, migration background; for parental background: highest years of education, highest ISEI, number of siblings; and for classroom averages: proportion of females, average ISEI.
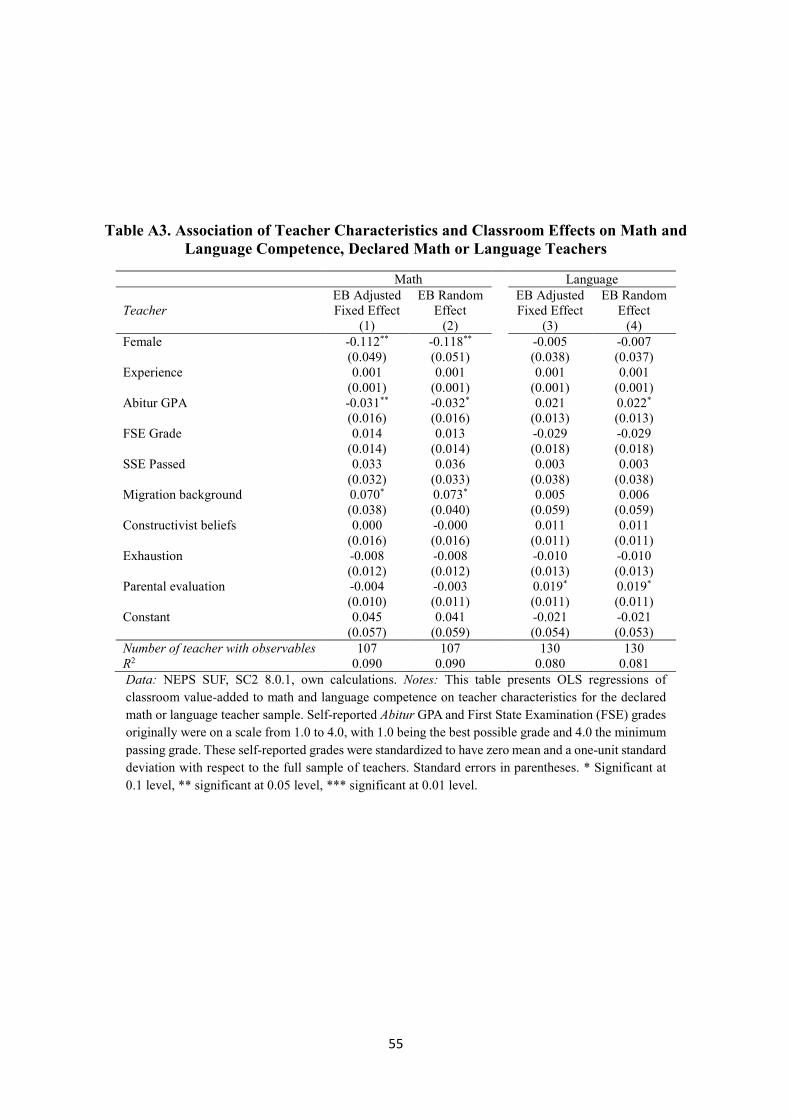
55
Table A3. Association of Teacher Characteristics and Classroom Effects on Math and Language Competence, Declared Math or Language Teachers
Math Language Teacher
EB Adjusted Fixed Effect
(1)
EB Random Effect
(2)
EB Adjusted Fixed Effect
(3)
EB Random Effect
(4) Female -0.112**
(0.049) -0.118** (0.051)
-0.005 (0.038)
-0.007 (0.037)
Experience 0.001 (0.001)
0.001 (0.001)
0.001 (0.001)
0.001 (0.001)
Abitur GPA -0.031** (0.016)
-0.032* (0.016)
0.021 (0.013)
0.022* (0.013)
FSE Grade 0.014 (0.014)
0.013 (0.014)
-0.029 (0.018)
-0.029 (0.018)
SSE Passed 0.033 (0.032)
0.036 (0.033)
0.003 (0.038)
0.003 (0.038)
Migration background 0.070* (0.038)
0.073* (0.040)
0.005 (0.059)
0.006 (0.059)
Constructivist beliefs 0.000 (0.016)
-0.000 (0.016)
0.011 (0.011)
0.011 (0.011)
Exhaustion -0.008 (0.012)
-0.008 (0.012)
-0.010 (0.013)
-0.010 (0.013)
Parental evaluation -0.004 (0.010)
-0.003 (0.011)
0.019* (0.011)
0.019* (0.011)
Constant 0.045 (0.057)
0.041 (0.059)
-0.021 (0.054)
-0.021 (0.053)
Number of teacher with observables 107 107 130 130 R2 0.090 0.090 0.080 0.081 Data: NEPS SUF, SC2 8.0.1, own calculations. Notes: This table presents OLS regressions of classroom value-added to math and language competence on teacher characteristics for the declared math or language teacher sample. Self-reported Abitur GPA and First State Examination (FSE) grades originally were on a scale from 1.0 to 4.0, with 1.0 being the best possible grade and 4.0 the minimum passing grade. These self-reported grades were standardized to have zero mean and a one-unit standard deviation with respect to the full sample of teachers. Standard errors in parentheses. * Significant at 0.1 level, ** significant at 0.05 level, *** significant at 0.01 level.


BERG Working Paper Series (most recent publications)
140 Johanna Sophie Quis, Anika Bela and Guido Heineck, Preschoolers’ self-regulation, skill differentials, and early educational outcomes, December 2018
141 Tomasz Makarewicz, Traders, forecasters and financial instability: A model of individu-al learning of anchor-and-adjustment heuristics, January 2019
142 Carolin Martin, Noemi Schmitt and Frank Westerhoff, Housing markets, expectation formation and interest rates, January 2019
143 Marc P. Saur, Markus G. Schlatterer and Stefanie Y. Schmitt, Horizontal product dif-ferentiation with limited attentive consumers, January 2019
144 Tim Hagenhoff and Joep Lustenhouwer, The Rationality Bias, February 2019
145 Philipp Mundt and Ilfan Oh, Asymmetric competition, risk, and return distribution, Feb-ruary 2019
146 Ilfan Oh, Autonomy of Profit Rate Distribution and Its Dynamics from Firm Size Measures: A Statistical Equilibrium Approach, February 2019
147 Philipp Mundt, Simone Alfarano and Mishael Milakovic, Exploiting ergodicity in fore-casts of corporate profitability, March 2019
148 Christian R. Proaño and Benjamin Lojak, Animal Spirits, Risk Premia and Monetary Policy at the Zero Lower Bound, March 2019
149 Christian R. Proaño, Juan Carlos Peña and Thomas Saalfeld, Inequality, Macroeconom-ic Performance and Political Polarization: An Empirical Analysis, March 2019
150 Maria Daniela Araujo P., Measuring the Effect of Competitive Teacher Recruitment on Student Achievement: Evidence from Ecuador, April 2019
151 Noemi Schmitt and Frank Westerhoff, Trend followers, contrarians and fundamental-ists: explaining the dynamics of financial markets, May 2019
152 Yoshiyuki Arata and Philipp Mundt, Topology and formation of production input inter-linkages: evidence from Japanese microdata, June 2019
153 Benjamin Lojak, Tomasz Makarewicz and Christian R. Proaño, Low Interest Rates, Bank’s Search-for-Yield Behavior and Financial Portfolio Management, October 2019
154 Christoph March, The Behavioral Economics of Artificial Intelligence: Lessons from Experiments with Computer Players, November 2019
155 Christoph March and Marco Sahm, The Perks of Being in the Smaller Team: Incentives in Overlapping Contests, December 2019
156 Carolin Martin, Noemi Schmitt and Frank Westerhoff, Heterogeneous expectations, housing bubbles and tax policy, February 2020
157 Christian R. Proaño, Juan Carlos Peña and Thomas Saalfeld, Inequality, Macroeconom-ic Performance and Political Polarization: A Panel Analysis of 20 Advanced Democra-cies, June 2020
158 Naira Kotb and Christian R. Proaño, Capital-Constrained Loan Creation, Stock Markets and Monetary Policy in a Behavioral New Keynesian Model, July 2020
159 Stefanie Y. Schmitt and Markus G. Schlatterer, Poverty and Limited Attention, July 2020
160 Noemi Schmitt, Ivonne Schwartz and Frank Westerhoff, Heterogeneous speculators and stock market dynamics: a simple agent-based computational model, July 2020
161 Christian R. Proaño and Benjamin Lojak, Monetary Policy with a State-Dependent In-flation Target in a Behavioral Two-Country Monetary Union Model, August 2020
162 Philipp Mundt, Simone Alfarano and Mishael Milakovic, Survival and the ergodicity of corporate profitability, October 2020
163 Tim Hagenhoff and Joep Lustenhouwer, The role of stickiness, extrapolation and past consensus forecasts in macroeconomic expectations, October 2020
164 Andrea Gurgone and Giulia Iori, Macroprudential capital buffers in heterogeneous banking networks: Insights from an ABM with liquidity crises, October 2020
165 María Daniela Araujo P., Guido Heineck and Yyannú Cruz-Aguayo, Does Test-Based Teacher Recruitment Work in the Developing World? Experimental Evidence from Ec-uador, November 2020
166 Jan Schulz and Mishael Milaković, How Wealthy Are the Rich?, December 2020
167 Nadja Bömmel and Guido Heineck, Revisiting the Causal Effect of Education on Politi-cal Participation and Interest, December 2020
168 Joep Lustenhouwer, Tomasz Makarewicz, Juan Carlos Peña and Christian R. Proaño, Are Some People More Equal than Others? Experimental Evidence on Group Identity and Income Inequality, February 2021
169 Sarah Mignot, Fabio Tramontana and Frank Westerhoff, Speculative asset price dy-namics and wealth taxes, April 2021
170 Philipp Mundt, Uwe Cantner, Hiroyasu Inoue, Ivan Savin and Simone Vannuccini, Market Selection in Global Value Chains, April 2021
171 Zahra Kamal, Gender Separation and Academic Achievement in Higher Education; Evi-dence from a Natural Experiment in Iran, June 2021
172 María Daniela Araujo P. and Johanna Sophie Quis, Parents Can Tell! Evidence on Classroom Quality Differences in German Primary Schools, August 2021