PARENTAL EDUCATION AND TIME INVESTMENTS IN … · PARENTAL EDUCATION AND TIME INVESTMENTS ......
45
1 PARENTAL EDUCATION AND TIME INVESTMENTS IN CHILDREN Cristina Borra 1 Almudena Sevilla 2 1 Department of Economics University of Seville (Spain) 2 School of Business Management Queen Mary University of London (UK) 13 th , January 2014
Transcript of PARENTAL EDUCATION AND TIME INVESTMENTS IN … · PARENTAL EDUCATION AND TIME INVESTMENTS ......

1
PARENTAL EDUCATION AND TIME INVESTMENTS IN CHILDREN
Cristina Borra1 Almudena Sevilla2
1Department of Economics University of Seville (Spain)
2School of Business Management
Queen Mary University of London (UK)
13th, January 2014
2
OBJECTIVES I: Trends in the Education Gradient
Parental time investments for college educated parents higher than for non-college educated parents:
1- Have these differences been increasing (as in the US) or decreasing over the last five decades in the UK?
2- How do these trends compare to other countries in the industrialized world?

3
OBJECTIVES II: College competition explanation
3- Is Ramey and Ramey’s (2010) competition for college admissions hypothesis for the US also plausible in the UK?
§ The arrival of the children of the baby-boom cohort to college age generates excess demand for college slots, especially at elite universities
=> college educated parents: forced to increase their time investments in their children

4
WHY DO WE CARE? Crucial from a child development perspective and policies
aimed at inequality
§ Are children from college-educated parents increasingly receiving more parental time?
=> If yes, then growing inequality in children’s (time and money) resources
5
CONTRIBUTIONS
§ Document trends in the education gradient in the UK, adding a cross-country perspective: § Previous analysis of trends in North America and United Kingdom
(Chasalani 2007, Ramey and Ramey 2010, Sullivan 2010)
§ Test the competition for college admissions explanation in the UK: § Ramey and Ramey (2010) focused on the US and compared the
results to those of Canada. The higher education system in the UK is closer to that of the US in being a national market and showing a hierarchy of universities
6
DATA : MTUS
§ Multinational Time Use Study (MTUS): an ex post harmonized cross-time, cross-national comparative time use database, constructed from national random-sampled time-diary
§ Main sample: mothers and fathers aged 18 to 64 who are neither retired nor students, having a child 18 years old or younger in the household
§ UK: 1975,1983, 1987, 1995, 2000, 2005

Time Start
Time Finish
Primary Activity
7:00 7:15 wash face …
7:30 7:45 get dress
… 10:00 10:15 Work
7
DATA: MTUS

VARIABLES OF INTEREST
§ Parental time investments in children: Primary activity reported as caring for his or her child/children (minutes in a 24 hour time period)
§ Coded AV11 in MTUS
§ College educated: If the respondent reports to have some college or more (ISCED level 5 or above)
8
PART I
The Education Gradient Over Time
9
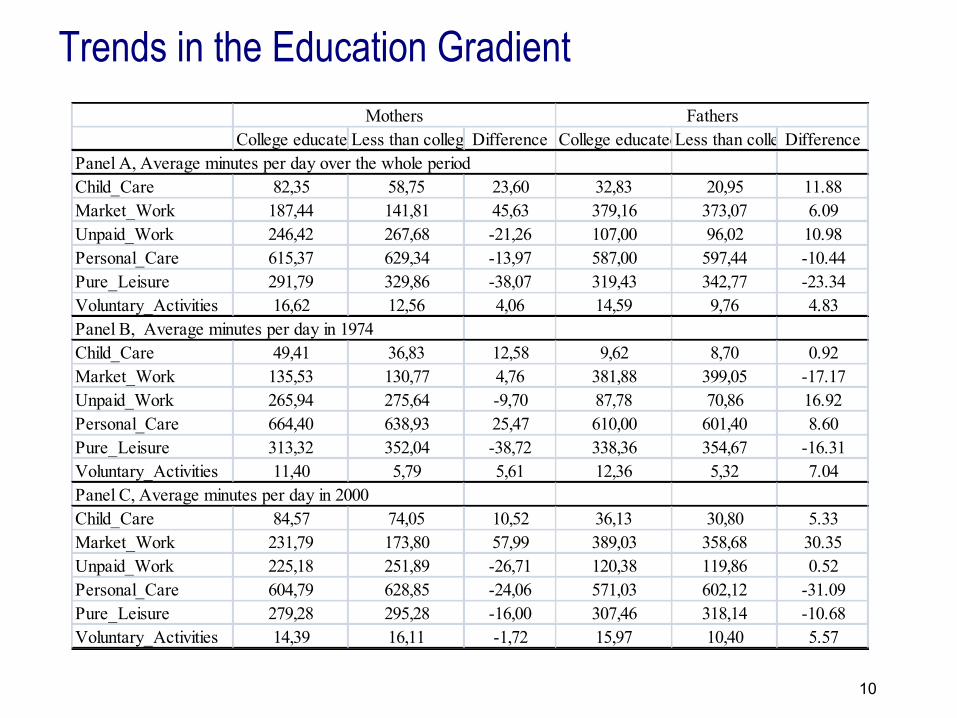
Trends in the Education Gradient
10
College educatedLess than collegeDifference College educatedLess than collegeDifferencePanel A, Average minutes per day over the whole periodChild_Care 82,35 58,75 23,60 32,83 20,95 11.88Market_Work 187,44 141,81 45,63 379,16 373,07 6.09Unpaid_Work 246,42 267,68 -21,26 107,00 96,02 10.98Personal_Care 615,37 629,34 -13,97 587,00 597,44 -10.44Pure_Leisure 291,79 329,86 -38,07 319,43 342,77 -23.34Voluntary_Activities 16,62 12,56 4,06 14,59 9,76 4.83Panel B, Average minutes per day in 1974Child_Care 49,41 36,83 12,58 9,62 8,70 0.92Market_Work 135,53 130,77 4,76 381,88 399,05 -17.17Unpaid_Work 265,94 275,64 -9,70 87,78 70,86 16.92Personal_Care 664,40 638,93 25,47 610,00 601,40 8.60Pure_Leisure 313,32 352,04 -38,72 338,36 354,67 -16.31Voluntary_Activities 11,40 5,79 5,61 12,36 5,32 7.04Panel C, Average minutes per day in 2000Child_Care 84,57 74,05 10,52 36,13 30,80 5.33Market_Work 231,79 173,80 57,99 389,03 358,68 30.35Unpaid_Work 225,18 251,89 -26,71 120,38 119,86 0.52Personal_Care 604,79 628,85 -24,06 571,03 602,12 -31.09Pure_Leisure 279,28 295,28 -16,00 307,46 318,14 -10.68Voluntary_Activities 14,39 16,11 -1,72 15,97 10,40 5.57
Mothers Fathers

11
Trends in Parental Time Investments
§ Parental time investments increased
§ College educated parents spend more time with their children than non-college educated parents
§ Differentials in parental time investments by college and non-college educated parents increased only for fathers
12
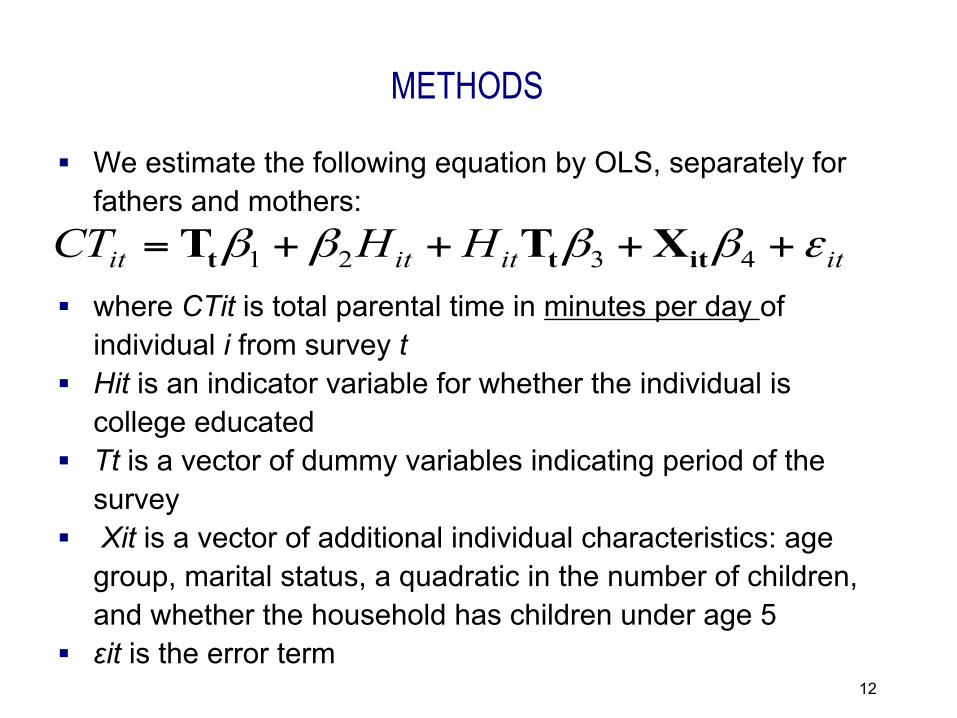
METHODS
§ We estimate the following equation by OLS, separately for fathers and mothers:
§ where CTit is total parental time in minutes per day of individual i from survey t
§ Hit is an indicator variable for whether the individual is college educated
§ Tt is a vector of dummy variables indicating period of the survey
§ Xit is a vector of additional individual characteristics: age group, marital status, a quadratic in the number of children, and whether the household has children under age 5
§ εit is the error term
itititit HHCT εββββ ++++= 4321 ittt XTT
13
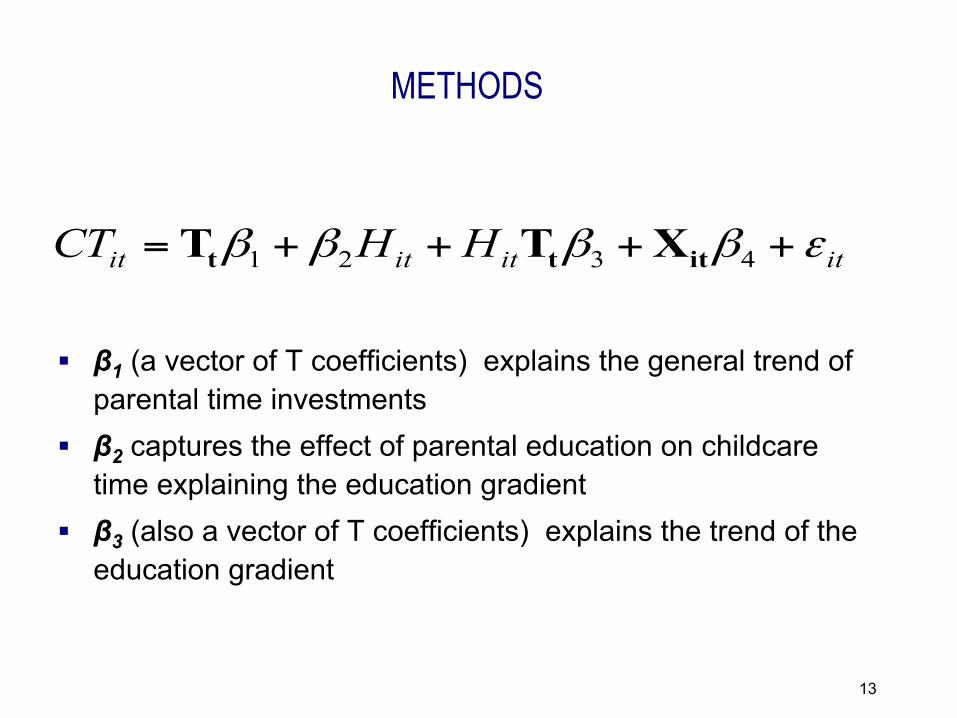
METHODS
§ β1 (a vector of T coefficients) explains the general trend of parental time investments
§ β2 captures the effect of parental education on childcare time explaining the education gradient
§ β3 (also a vector of T coefficients) explains the trend of the education gradient
itititit HHCT εββββ ++++= 4321 ittt XTT
14
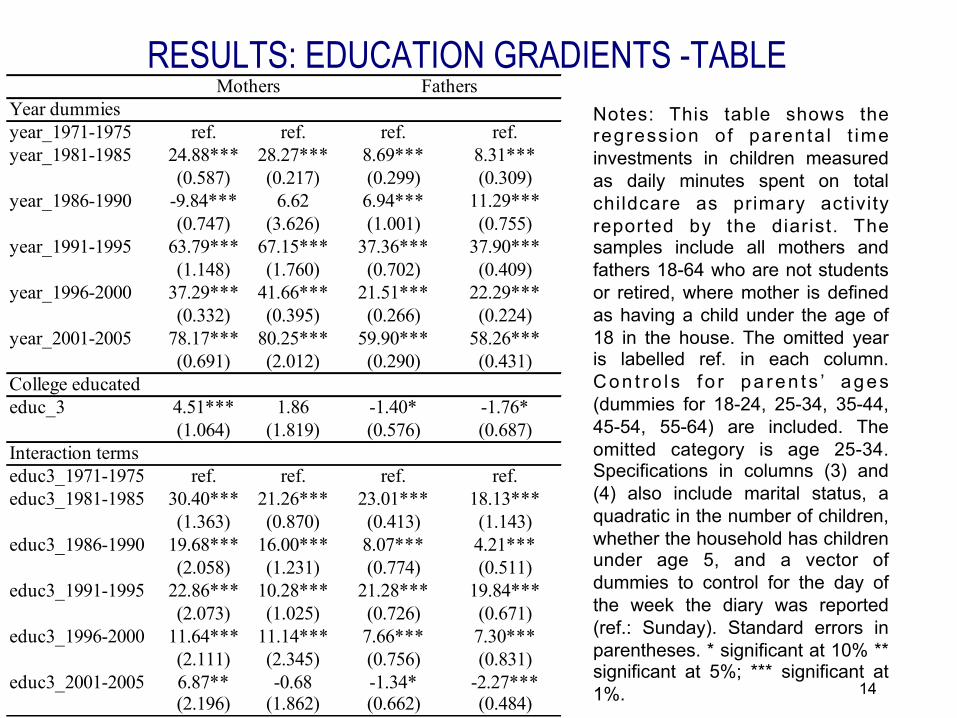
RESULTS: EDUCATION GRADIENTS -TABLE Notes: This table shows the regress ion of parenta l t ime investments in children measured as daily minutes spent on total childcare as primary activity reported by the diarist. The samples include all mothers and fathers 18-64 who are not students or retired, where mother is defined as having a child under the age of 18 in the house. The omitted year is labelled ref. in each column. Con t ro l s f o r pa ren ts ’ ages (dummies for 18-24, 25-34, 35-44, 45-54, 55-64) are included. The omitted category is age 25-34. Specifications in columns (3) and (4) also include marital status, a quadratic in the number of children, whether the household has children under age 5, and a vector of dummies to control for the day of the week the diary was reported (ref.: Sunday). Standard errors in parentheses. * significant at 10% ** significant at 5%; *** significant at 1%.
Year dummiesyear_1971-1975 ref. ref. ref. ref.year_1981-1985 24.88*** 28.27*** 8.69*** 8.31***
(0.587) (0.217) (0.299) (0.309)year_1986-1990 -9.84*** 6.62 6.94*** 11.29***
(0.747) (3.626) (1.001) (0.755)year_1991-1995 63.79*** 67.15*** 37.36*** 37.90***
(1.148) (1.760) (0.702) (0.409)year_1996-2000 37.29*** 41.66*** 21.51*** 22.29***
(0.332) (0.395) (0.266) (0.224)year_2001-2005 78.17*** 80.25*** 59.90*** 58.26***
(0.691) (2.012) (0.290) (0.431)College educatededuc_3 4.51*** 1.86 -1.40* -1.76*
(1.064) (1.819) (0.576) (0.687)Interaction termseduc3_1971-1975 ref. ref. ref. ref.educ3_1981-1985 30.40*** 21.26*** 23.01*** 18.13***
(1.363) (0.870) (0.413) (1.143)educ3_1986-1990 19.68*** 16.00*** 8.07*** 4.21***
(2.058) (1.231) (0.774) (0.511)educ3_1991-1995 22.86*** 10.28*** 21.28*** 19.84***
(2.073) (1.025) (0.726) (0.671)educ3_1996-2000 11.64*** 11.14*** 7.66*** 7.30***
(2.111) (2.345) (0.756) (0.831)educ3_2001-2005 6.87** -0.68 -1.34* -2.27***
(2.196) (1.862) (0.662) (0.484)
Mothers Fathers
15
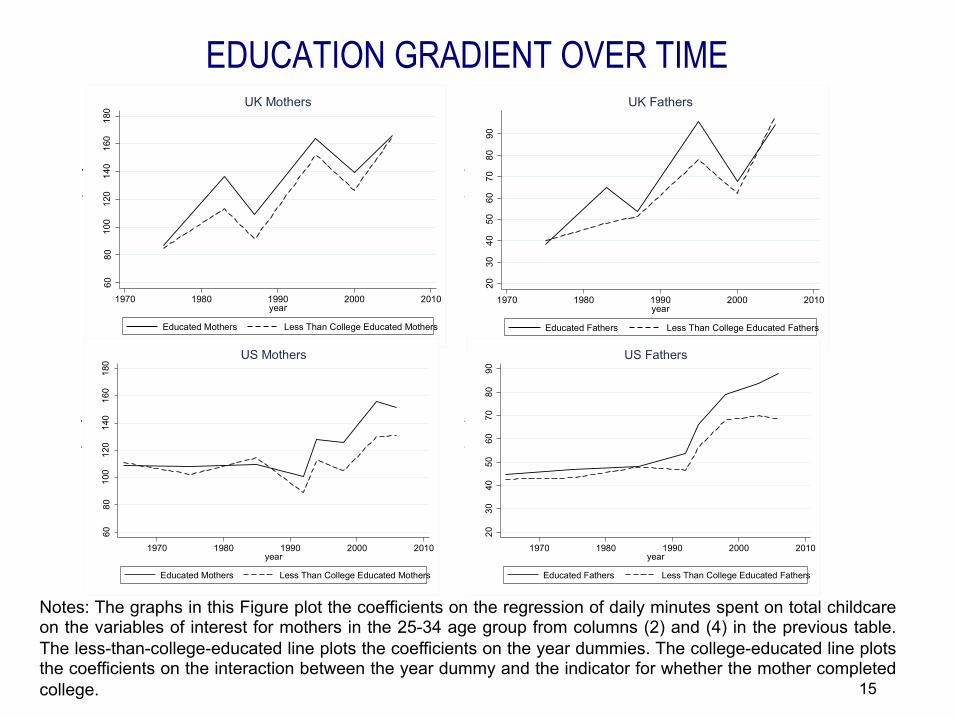
EDUCATION GRADIENT OVER TIME 60
8010
012
014
016
018
0
Min
utes
per
day
1970 1980 1990 2000 2010year
Educated Mothers Less Than College Educated Mothers
UK Mothers
2030
4050
6070
8090
Min
utes
per
day
1970 1980 1990 2000 2010year
Educated Fathers Less Than College Educated Fathers
UK Fathers
Notes: The graphs in this Figure plot the coefficients on the regression of daily minutes spent on total childcare on the variables of interest for mothers in the 25-34 age group from columns (2) and (4) in the previous table. The less-than-college-educated line plots the coefficients on the year dummies. The college-educated line plots the coefficients on the interaction between the year dummy and the indicator for whether the mother completed college.
6080
100
120
140
160
180
Min
utes
per
day
1970 1980 1990 2000 2010year
Educated Mothers Less Than College Educated Mothers
US Mothers
2030
4050
6070
8090
Min
utes
per
day
1970 1980 1990 2000 2010year
Educated Fathers Less Than College Educated Fathers
US Fathers
16
FINDINGS I
§ Parental time investments: increased 80 min./day for mothers (from 60 mins/day in the 70s) and 60 min./day for fathers (from 20 mins/day in the 70s)
§ Education gradient: Positive over the period, except in 2005 § 15 mins/day for mothers § 8 mins/day for fathers
§ Differentials in parental time investments by college and non-college educated parents increased (25 min./day) until 1983 and decrease (15 min.) thereafter
17
FINDINGS II
§ In 2000, college educated mothers devoted about 11 more minutes per day and college educated fathers, 7 more minutes, approximately 10% more time than less than college educated parents:
§ According to Villena-Roldán and Ríos-Aguilar(2012) for the US: a 10% increase in maternal time investments would increase language aptitude tests by 40% of a standard deviation
§ 1 hour more per week (8.57 more minutes per day) increases test scores around 40 per cent of a standard deviation, which translates roughly into about five positions in a class of 30 children for the average child

18
(1) (2) (3) (4) (5) (6) (7) (8) (9) (10) (11) (12)
Australia Canada Finland France Germany Italy Netherlands Norway Spain Sweden UK US
B. College educated educ_3 28.15*** 4.97*** 18.94** 22.57*** -2.82 17.08* 2.46*** 21.17*** 5.68 27.54* 1.86 5.42***
(2.259) (0.707) (2.373) (0.182) (1.485) (1.356) (0.392) (1.378) (3.465) (3.144) (1.819) (0.513)
C. Interaction terms educ3_1965-1970
-41.98***
-4.64***
(0.796)
(0.977)
educ3_1971-1975 ref. ref.
ref.
ref. ref.
educ3_1976-1980
9.91***
(0.237)
educ3_1981-1985
-2.18
19.30*** ref.
21.26*** -10.00***
(1.469)
(0.340)
(0.870) (0.378)
educ3_1986-1990 -8.14*** -1.89 -3.27
ref. 23.48*** -16.12***
16.00*** 6.29***
(0.845) (0.934) (3.562)
(0.324) (1.163)
(1.231) (0.333)
educ3_1991-1995 -0.59 3.31***
ref.
17.61***
ref. ref. 10.28*** 9.35***
(2.061) (0.540)
(0.436)
(1.025) (0.567)
educ3_1996-2000 -15.01** 1.16 -3.29 -17.02***
6.71*** -9.39*** 8.65**
11.14*** 14.92***
(2.777) (0.871) (3.122) (0.276)
(0.649) (0.545) (1.664)
(2.345) (0.823)
educ3_2001-2005
1.10 -1.30 9.27***
1.26 -2.89 -0.68 20.12***
(0.932) (1.080) (0.344)
(3.537) (0.940) (1.862) (0.305)
educ3_2006-2010
3.01
14.99*** (2.476) (0.310)
Notes: This table shows the regression of parental time investments in children measured as daily minutes spent on total childcare as primary activity reported by the diarist. The samples include all mothers 18-64 who are not students or retired, where mother is defined as having a child under the age of 18 in the house. The omitted year is labelled ref. in each column. Controls for parents’ ages (dummies for 18-24, 25-34, 35-44, 45-54, 55-64) are included. The omitted category is age 25-34. This specification also includes marital status, a quadratic in the number of children, whether the household has children under age 5, and a vector of dummies to control for the day of the week the diary was reported (ref.: Sunday).Standard errors in parentheses. * significant at 10% ** significant at 5%; *** significant at 1%.
COMPARISON ACROSS COUNTRIES: MOTHERS
19
Notes: This table shows the regression of parental time investments in children measured as daily minutes spent on total childcare as primary activity reported by the diarist. The samples include all mothers 18-64 who are not students or retired, where mother is defined as having a child under the age of 18 in the house. The omitted year is labelled ref. in each column. Controls for parents’ ages (dummies for 18-24, 25-34, 35-44, 45-54, 55-64) are included. The omitted category is age 25-34. This specification also includes marital status, a quadratic in the number of children, whether the household has children under age 5, and a vector of dummies to control for the day of the week the diary was reported (ref.: Sunday).Standard errors in parentheses. * significant at 10% ** significant at 5%; *** significant at 1%.
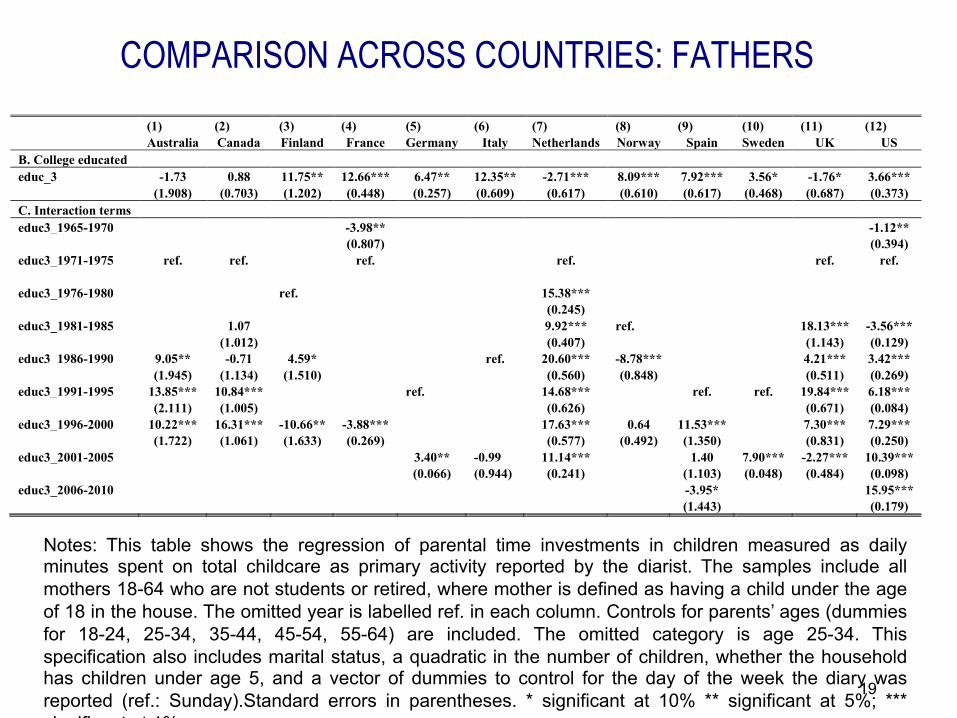
(1) (2) (3) (4) (5) (6) (7) (8) (9) (10) (11) (12) Australia Canada Finland France Germany Italy Netherlands Norway Spain Sweden UK US B. College educated educ_3 -1.73 0.88 11.75** 12.66*** 6.47** 12.35** -2.71*** 8.09*** 7.92*** 3.56* -1.76* 3.66***
(1.908) (0.703) (1.202) (0.448) (0.257) (0.609) (0.617) (0.610) (0.617) (0.468) (0.687) (0.373)
C. Interaction terms educ3_1965-1970
-3.98**
-1.12**
(0.807)
(0.394)
educ3_1971-1975 ref. ref.
ref.
ref.
ref. ref.
educ3_1976-1980
ref.
15.38***
(0.245)
educ3_1981-1985
1.07
9.92*** ref.
18.13*** -3.56***
(1.012)
(0.407)
(1.143) (0.129)
educ3_1986-1990 9.05** -0.71 4.59*
ref. 20.60*** -8.78***
4.21*** 3.42***
(1.945) (1.134) (1.510)
(0.560) (0.848)
(0.511) (0.269)
educ3_1991-1995 13.85*** 10.84***
ref.
14.68***
ref. ref. 19.84*** 6.18***
(2.111) (1.005)
(0.626)
(0.671) (0.084)
educ3_1996-2000 10.22*** 16.31*** -10.66** -3.88***
17.63*** 0.64 11.53***
7.30*** 7.29***
(1.722) (1.061) (1.633) (0.269)
(0.577) (0.492) (1.350)
(0.831) (0.250)
educ3_2001-2005
3.40** -0.99 11.14***
1.40 7.90*** -2.27*** 10.39***
(0.066) (0.944) (0.241)
(1.103) (0.048) (0.484) (0.098)
educ3_2006-2010
-3.95*
15.95*** (1.443) (0.179)
COMPARISON ACROSS COUNTRIES: FATHERS
20
FINDINGS I: TRENDS IN PARENTAL TIME INVESTMENTS
§ Parental time investments increased 17 min./day (from a range between 50 to 120 min./day in the 70s)
§ Consistent with previous literature (we add more countries and a longer time-span)
§ general increase in time devoted to children (Gershuny 2000; Gauthier et al. 2004)
§ exceptionality of Sweden’s reduction (Klevmarken and Stafford 1999).
FINDINGS II: EDUCATION GRADIENT
§ Towards the end of the period of analysis most countries show a positive education gradient § Except in the UK and mothers in Germany
§ With respect to non-college educated parents: § College-educated mothers devote between 5 more minutes
per day (Canada and France), and 20-25 more minutes per day (Sweden, US). § Non-college educated mothers: 140 min./day
§ College-educated fathers devote about 10 more minutes in most countries (US 18, UK 5) § Non-college educated fathers: 70 min./day
21
FINDINGS II: EDUCATION GRADIENT
§ Previous literature: results consistent in sign and in magnitude with: § Sayer et al. (2004), for parents in Canada, Germany, Italy, and
Norway § Craig (2006) for parents in Australia § Guryan et al. (2008) for mothers in Canada, Italy, France,
Netherlands, Norway, United Kigdom; United States
22

§ No regularity regarding trends in education gradients § Mothers:
§ Increases: Netherlands and the US § Decreases: Australia, France, Norway § Constant: Canada, Finland, Germany, Italy, Spain, Sweden,
the UK. § Range: -17 min in France, +15 min in the US
§ Fathers: § Increases: Australia, Canada, Germany, the Netherlands,
Sweden, the US § Decreases: Finland, France, Spain, the UK. § Constant: Italy, Norway § Range: -11 min in Finland, + 16 min in Canada and the US.
23
FINDINGS III: TRENDS IN EDUCATION GRADIENT

§ Previous literature (just for North America and the United Kingdom): § Agreement with Chalasani (2007), Ramey and Ramey (2010),
and Sullivan (2011) for the US § Agreement with Sullivan (2011) for fathers in the UK
24
FINDINGS II: TRENDS IN EDUCATION GRADIENTS (cont.)

PART II
Testing the Competition for College Admissions Hypothesis
25
COLLEGE COMPETITION EXPLANATION
26
§ For the US, Ramey and Ramey (2010): increased competition for college admissions by the children of the baby boom
§ Returns to investment in children from college-educated parents may be higher § children of college-educated parents have greater potential § educated parents are more productive at childcare
=> different trends in parental time investments (incentive to invest in an elite university has grown for college educated parents)
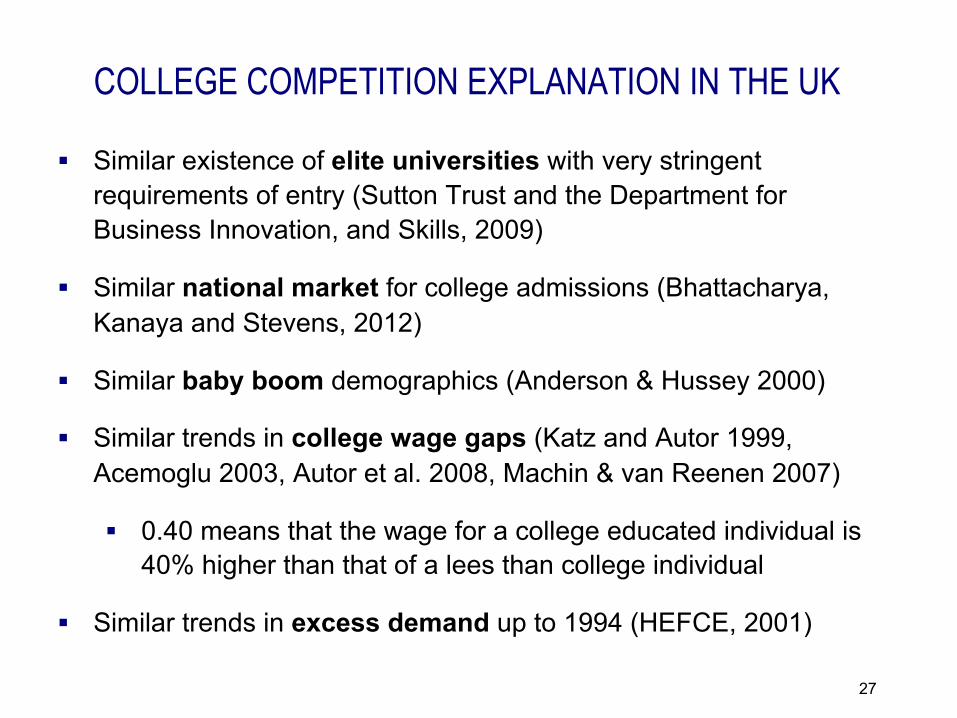
COLLEGE COMPETITION EXPLANATION IN THE UK
27
§ Similar existence of elite universities with very stringent requirements of entry (Sutton Trust and the Department for Business Innovation, and Skills, 2009)
§ Similar national market for college admissions (Bhattacharya, Kanaya and Stevens, 2012)
§ Similar baby boom demographics (Anderson & Hussey 2000)
§ Similar trends in college wage gaps (Katz and Autor 1999, Acemoglu 2003, Autor et al. 2008, Machin & van Reenen 2007)
§ 0.40 means that the wage for a college educated individual is 40% higher than that of a lees than college individual
§ Similar trends in excess demand up to 1994 (HEFCE, 2001)

INCREASING COLLEGE COMPETITION IN THE UK
28
§ The college wage premium .3
.4.5
.6.7
Col
lege
wag
e ga
p
1980 1985 1990 1995 2000 2005year
UK US
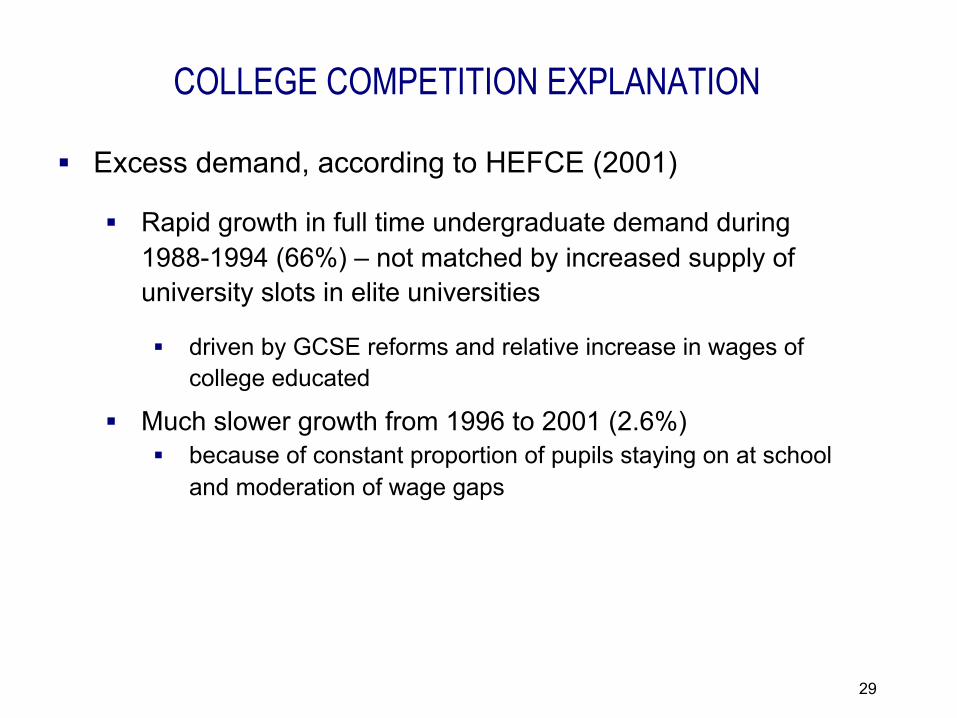
COLLEGE COMPETITION EXPLANATION
29
§ Excess demand, according to HEFCE (2001)
§ Rapid growth in full time undergraduate demand during 1988-1994 (66%) – not matched by increased supply of university slots in elite universities
§ driven by GCSE reforms and relative increase in wages of college educated
§ Much slower growth from 1996 to 2001 (2.6%) § because of constant proportion of pupils staying on at school
and moderation of wage gaps

COLLEGE COMPETITION EXPLANATION
30
§ Compare trends in college competition to:
§ Trends in education gradient of mothers and fathers
§ Trends in education gradient of mother and fathers of families with no child under 5
§ Trends in education gradient of mother and fathers by type of child care activity
§ Trends in older children’s time in academic and extra-curricular activities (time spent in school and other classes) § Data: MTUS Children diaries, aged 10 to 17

COLLEGE WAGE GAPS AND EDUCATION GRADIENTS
31
§ Relationship of college wage gaps and education gradients over time for the UK and the US
19831987
1995
2000
2005
1985
19921994
1998
2003
-10
010
2030
Edu
catio
n gr
adie
nt-m
inut
es p
er d
ay
.3 .4 .5 .6 .7college_gap
UK Mothers Fitted values-UKUS Mothers Fitted values-US
Mothers
1983
1987
1995
2000
2005
1985
1992
19941998
2003
-50
510
1520
Edu
catio
n gr
adie
nt-m
inut
es p
er d
ay
.3 .4 .5 .6 .7college_gap
UK Fathers Fitted values-UKUS Fathers Fitted values-US
Fathers

COLLEGE WAGE GAPS AND EDUCATION GRADIENTS: FAMILIES WITH NO CHILD UNDER 5.
32
§ Relationship of college wage gaps and education gradients of families with older children over time for the UK and the US: matching evidence for fathers in the UK.
1983
1987
1995
2000
20051985
1992
19941998
2003
010
2030
Edu
catio
n gr
adie
nt-m
inut
es p
er d
ay
.3 .4 .5 .6 .7college_gap
UK Mothers Fitted values-UKUS Mothers Fitted values-US
Mothers
1983
1987
1995
2000
20051985
1992
1994
19982003
-10
-50
510
15
Edu
catio
n gr
adie
nt-m
inut
es p
er d
ay
.3 .4 .5 .6 .7college_gap
UK Fathers Fitted values-UKUS Fathers Fitted values-US
Fathers

FURTHER ANALYSIS: BY CATEGORIES OF CHILDCARE
33
Basic Educational Recreational Travel Basic Educational Recreational TravelA. Year dummiesyear_1981-1985 ref. ref. ref. ref. ref. ref. ref. ref.year_1986-1990 -10.22*** -0.53 -5.64*** -2.07*** 1.23 -0.35*** 2.20** 0.58*
(0.664) (0.204) (0.303) (0.196) (0.962) (0.033) (0.393) (0.158)year_1991-1995
year_1996-2000 8.42*** 1.86*** 7.84*** -1.46*** 8.57*** 0.62*** 5.99*** 0.09(0.341) (0.020) (0.048) (0.061) (0.485) (0.045) (0.099) (0.085)
year_2001-2005
B. College educatededuc_3 17.59*** 0.76*** 2.20** -0.15* 5.19** 0.44*** 7.62*** 1.48***
(0.417) (0.004) (0.268) (0.051) (0.945) (0.039) (0.190) (0.097)C. Interaction termseduc3_1981-1985 ref. ref. ref. ref. ref. ref. ref. ref.educ3_1986-1990 -4.48*** -0.11 0.20 0.96*** -4.45** -0.12 -6.90*** -1.37**
(0.320) (0.168) (0.450) (0.020) (0.516) (0.076) (0.208) (0.183)educ3_1991-1995
educ3_1996-2000 -14.80*** 1.84*** 1.64** 1.58*** -1.91 0.35* -6.88*** -1.03**(0.686) (0.027) (0.378) (0.089) (1.191) (0.084) (0.231) (0.174)
educ3_2001-2005
Mothers Fathers
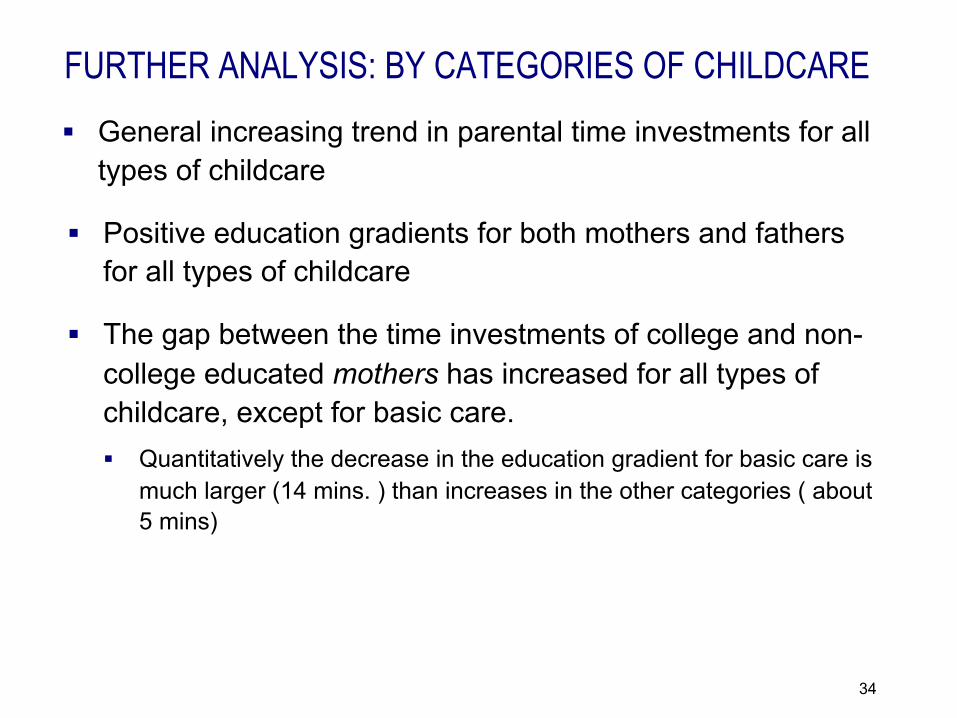
FURTHER ANALYSIS: BY CATEGORIES OF CHILDCARE
34
§ General increasing trend in parental time investments for all types of childcare
§ Positive education gradients for both mothers and fathers for all types of childcare
§ The gap between the time investments of college and non-college educated mothers has increased for all types of childcare, except for basic care. § Quantitatively the decrease in the education gradient for basic care is
much larger (14 mins. ) than increases in the other categories ( about 5 mins)

FURTHER ANALYSIS: BY CATEGORIES OF CHILDCARE
35
§ The gap between the time investments of college and non-college educated fathers has decreased for all types of childcare, except for educational care § Quantitatively the decrease in the education gradient for recreational
care of about 7 mins is relatively large
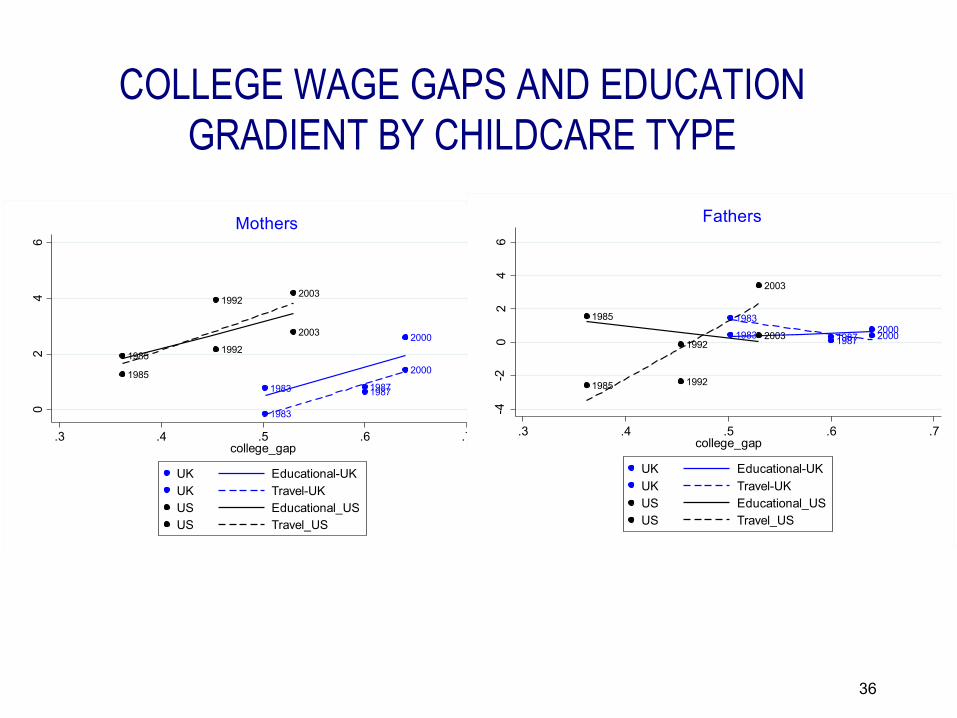
COLLEGE WAGE GAPS AND EDUCATION GRADIENT BY CHILDCARE TYPE
36
1983 1987
2000
1983
1987
20001985
1992
2003
1985 1992
2003
02
46
Edu
catio
n gr
adie
nt-m
inut
es p
er d
ay
.3 .4 .5 .6 .7college_gap
UK Educational-UKUK Travel-UKUS Educational_USUS Travel_US
Mothers
1983 19872000
1983
1987 2000
1985
19922003
1985 1992
2003
-4-2
02
46
Edu
catio
n gr
adie
nt-m
inut
es p
er d
ay.3 .4 .5 .6 .7
college_gap
UK Educational-UKUK Travel-UKUS Educational_USUS Travel_US
Fathers
COLLEGE WAGE GAPS AND EDUCATION GRADIENTS: CHILDREN’S TIME USE
37
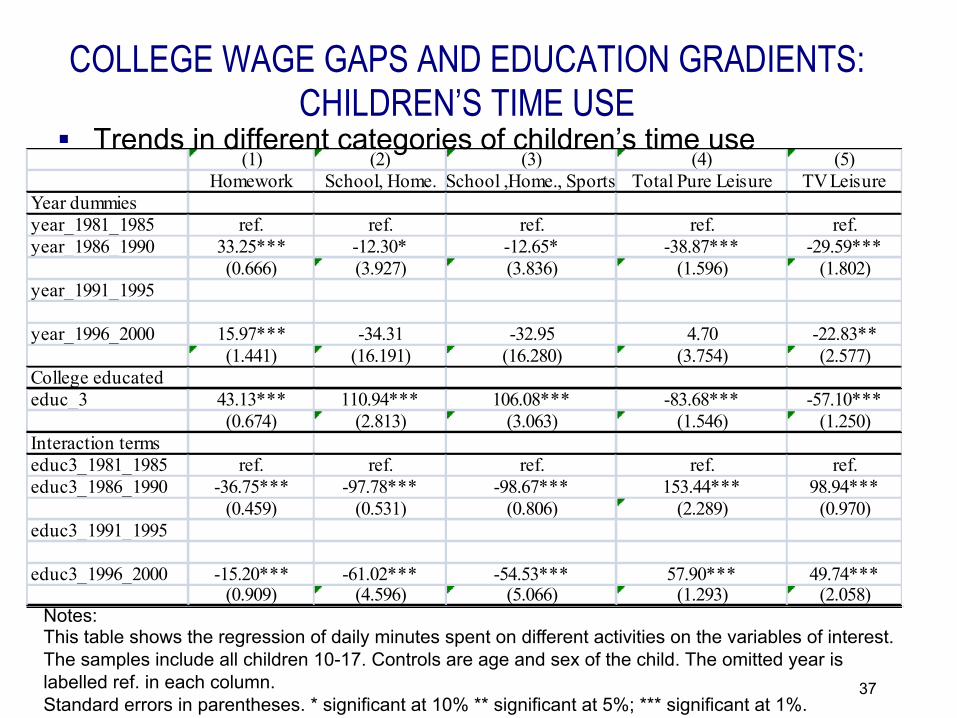
§ Trends in different categories of children’s time use
Notes: This table shows the regression of daily minutes spent on different activities on the variables of interest. The samples include all children 10-17. Controls are age and sex of the child. The omitted year is labelled ref. in each column. Standard errors in parentheses. * significant at 10% ** significant at 5%; *** significant at 1%.
(1) (2) (3) (4) (5)Homework School, Home. School ,Home., Sports Total Pure Leisure TV Leisure
Year dummiesyear_1981_1985 ref. ref. ref. ref. ref.year_1986_1990 33.25*** -12.30* -12.65* -38.87*** -29.59***
(0.666) (3.927) (3.836) (1.596) (1.802)year_1991_1995
year_1996_2000 15.97*** -34.31 -32.95 4.70 -22.83**(1.441) (16.191) (16.280) (3.754) (2.577)
College educatededuc_3 43.13*** 110.94*** 106.08*** -83.68*** -57.10***
(0.674) (2.813) (3.063) (1.546) (1.250)Interaction termseduc3_1981_1985 ref. ref. ref. ref. ref.educ3_1986_1990 -36.75*** -97.78*** -98.67*** 153.44*** 98.94***
(0.459) (0.531) (0.806) (2.289) (0.970)educ3_1991_1995
educ3_1996_2000 -15.20*** -61.02*** -54.53*** 57.90*** 49.74***(0.909) (4.596) (5.066) (1.293) (2.058)

CHILDREN’S TIME USE
38
§ General increasing trend in children’s time devoted to study and homework together with a decrease in time devoted to TV viewing.
§ As expected, positive education gradients in Homework and study, School and other classes and homework and School and other classes, Homework, active Sports participation
§ The gap between the time investments of children of the college and non-college educated mothers has decreased for Homework, School, and Active sports. § Despite this decreasing trend, there remains a 30 min per day gap in
Study and homework and a 50 min per day gap in School and other classes, Homework, and in School and other classes, Homework and Active Sports in 2000.
CHILDREN’S TIME USE
39
§ The gap between the time investments of children of the college and non-college educated mothers has also decreased for Total Leisure and TV viewing. § Despite this decreasing trend, children of the college educated still
devote 7 less minutes per day to watch TV and 25 less minutes to total leisure than children of the less than college educated in 2000.

COLLEGE WAGE GAPS AND EDUCATION GRADIENT FROM CHILDREN’S TIME USE
40
§ Relationship of college wage gaps and education gradients of children’s time spent in School and other classes and Pure leisure activities: matching evidence only for the US
1983
1987
2000
1985
2003
-50
050
100
150
Edu
catio
n gr
adie
nt-m
inut
es p
er d
ay
.3 .4 .5 .6 .7college_gap
UK Children Fitted values-UKUS Children Fitted values-US
Children's Time Spent in School and Other Classes
1983
1987
20001985
2003
-100
-50
050
100
Edu
catio
n gr
adie
nt-m
inut
es p
er d
ay
.3 .4 .5 .6 .7college_gap
UK Children Fitted values-UKUS Children Fitted values-US
Children's Leisure Time

COLLEGE WAGE GAPS AND EDUCATION GRADIENT FROM CHILDREN’S TIME USE
41
§ Relationship of college wage gaps and education gradients of children’s time spent studying and doing homework: matching evidence only for the US
1983
1987
2000
1985 2003
1020
3040
50
Edu
catio
n gr
adie
nt-m
inut
es p
er d
ay
.3 .4 .5 .6 .7college_gap
UK Children Fitted values-UKUS Children Fitted values-US
Children's Time Spent in Study and Homework

COLLEGE WAGE GAPS AND EDUCATION GRADIENTS
42
§ Relationship of college wage gaps and education gradients over time for all countries (may UK be an outlier?)
CanadaCanada
CanadaCanada
Netherlands
Netherlands
Netherlands
Netherlands
Norway
Norway
Norway
UK
UK
UK
UK
UK
US
USUS
US
US
FinlandFinlandAustralia
Australia
Australia
Germany Germany
Spain
Spain
-10
010
2030
Edu
catio
n gr
adie
nt-m
inut
es p
er d
ay
.2 .3 .4 .5 .6college_gap
Country Fitted line
Mothers
CanadaCanada
Canada
Canada
Netherlands
Netherlands
Netherlands
Netherlands
Norway
Norway
Norway
UK
UK
UK
UK
UK
US
US
USUS
US
Finland
Finland
Australia
Australia
AustraliaGermany
Germany
Spain
Spain
-50
510
1520
Edu
catio
n gr
adie
nt-m
inut
es p
er d
ay
.2 .3 .4 .5 .6college_gap
Country Fitted line
Fathers
CONCLUSION I
TRENDS IN EDUCATION GRADIENT
43
§ We document increases in parental time investments and a positive education gradient in most countries
§ Unlike in the US, differences in parental time investments by college and non-college educated parents were similar at the beginning and end in the UK
§ Trends in education gradient not uniform across countries, and vary for fathers and mothers within a given country
CONCLUSION II
EXPLANATIONS FOR TRENDS IN EDUCATION
GRADIENT
44
§ For the United States Ramey and Ramey’s (2010) explanation of increased college competition is further supported (from children’s diaries)
§ In the UK, college educated parents now spend relatively more time in educational activities and childcare-related travel than in the 70s. However, children of college educated parents do not spend relatively more time studying or attending other classes now than in the past
CONCLUSION III
EXPLANATIONS FOR TRENDS IN EDUCATION GRADIENT
45
§ Relationship between changes in college-wage gap and parental time investments across countries is weak
§ Other explanations based on safety concerns and parenting attitudes do not seem to adequately explain parental trends in education gradients in the UK (or elsewhere)