Parent material influence on soil distribution and genesis ... Shaw Catena parent material... ·...
18
Parent material influence on soil distribution and genesis in a Paleudult and Kandiudult complex, southeastern USA J.N. Shaw a, * , L.T. West b , D.D. Bosch c , C.C. Truman c , D.S. Leigh d a Department of Agronomy and Soils, Auburn University, 202 Funchess Hall, Auburn, AL 36849, USA b Department of Crop and Soils, University of Georgia, 3111 Miller Plant Science Building, Athens, GA 30602, USA c USDA-SE Watershed Laboratory, P.O. Box 946, Tifton, GA 31794, USA d Department of Geography, University of Georgia, Athens, GA 30602, USA Received 12 March 2002; received in revised form 27 August 2003; accepted 16 October 2003 Abstract Parent materials greatly influence soil development and the distribution of soils on the southeastern US Coastal Plain. We examined the physical, chemical, and mineralogical properties of 11 pedons in a 1-ha plot on the Upper Coastal Plain of Georgia, USA. Uniformity of parent materials was assessed by sand grain size characteristics. The soils have sandy epipedons of variable thickness and argillic horizons of variable texture. Six of the pedons also have kandic horizons. They are classified (US Soil Taxonomy) in Psammentic, Grossarenic, Arenic, and Typic subgroups of Paleudults and Kandiudults. Loamy pedons possess argillic horizons with two distinct increases in clay and greater differences between eluvial and illuvial horizons than sandy pedons. The upper boundary of the argillic horizon is approximately parallel to the present geomorphic surface, suggesting that it is associated with the contemporary surface. Discontinuities, identified by changes in sand grain size ratios and plots of the third (skewness) and fourth (kurtosis) moments of sand grain distribution, roughly correspond to the bottom of the solum. Our data suggest that there are both eolian and fluvial components in the solum, whereas subjacent horizons are completely derived from fluvial deposits. Sandier pedons have greater gibbsite/kaolinite ratios, possibly because greater permeability has enhanced leaching and Si loss. Our data suggest parent materials largely control soil distribution over this plot. D 2003 Elsevier B.V. All rights reserved. Keywords: Ultisols; Fluvial sediments; Eolian sediments; Argillic horizons 0341-8162/$ - see front matter D 2003 Elsevier B.V. All rights reserved. doi:10.1016/j.catena.2003.10.016 * Corresponding author. Fax: +1-334-844-3945. E-mail address: [email protected] (J.N. Shaw). www.elsevier.com/locate/catena Catena 57 (2004) 157 – 174
Transcript of Parent material influence on soil distribution and genesis ... Shaw Catena parent material... ·...

www.elsevier.com/locate/catena
Catena 57 (2004) 157–174
Parent material influence on soil distribution and
genesis in a Paleudult and Kandiudult complex,
southeastern USA
J.N. Shawa,*, L.T. Westb, D.D. Boschc, C.C. Trumanc, D.S. Leighd
aDepartment of Agronomy and Soils, Auburn University, 202 Funchess Hall, Auburn, AL 36849, USAbDepartment of Crop and Soils, University of Georgia, 3111 Miller Plant Science Building,
Athens, GA 30602, USAcUSDA-SE Watershed Laboratory, P.O. Box 946, Tifton, GA 31794, USA
dDepartment of Geography, University of Georgia, Athens, GA 30602, USA
Received 12 March 2002; received in revised form 27 August 2003; accepted 16 October 2003
Abstract
Parent materials greatly influence soil development and the distribution of soils on the
southeastern US Coastal Plain. We examined the physical, chemical, and mineralogical properties of
11 pedons in a 1-ha plot on the Upper Coastal Plain of Georgia, USA. Uniformity of parent materials
was assessed by sand grain size characteristics. The soils have sandy epipedons of variable thickness
and argillic horizons of variable texture. Six of the pedons also have kandic horizons. They are
classified (US Soil Taxonomy) in Psammentic, Grossarenic, Arenic, and Typic subgroups of
Paleudults and Kandiudults. Loamy pedons possess argillic horizons with two distinct increases in
clay and greater differences between eluvial and illuvial horizons than sandy pedons. The upper
boundary of the argillic horizon is approximately parallel to the present geomorphic surface,
suggesting that it is associated with the contemporary surface. Discontinuities, identified by changes
in sand grain size ratios and plots of the third (skewness) and fourth (kurtosis) moments of sand grain
distribution, roughly correspond to the bottom of the solum. Our data suggest that there are both
eolian and fluvial components in the solum, whereas subjacent horizons are completely derived from
fluvial deposits. Sandier pedons have greater gibbsite/kaolinite ratios, possibly because greater
permeability has enhanced leaching and Si loss. Our data suggest parent materials largely control soil
distribution over this plot.
D 2003 Elsevier B.V. All rights reserved.
Keywords: Ultisols; Fluvial sediments; Eolian sediments; Argillic horizons
0341-8162/$ - see front matter D 2003 Elsevier B.V. All rights reserved.
doi:10.1016/j.catena.2003.10.016
* Corresponding author. Fax: +1-334-844-3945.
E-mail address: [email protected] (J.N. Shaw).

J.N. Shaw et al. / Catena 57 (2004) 157–174158
1. Introduction
Further understanding of soil-forming factors is necessary to develop models predicting
soil distribution. Recently developed expert systems (e.g., Zhu et al., 1997) that integrate
several data layers (e.g., geology maps) to map soil would be facilitated by improved
understanding of the relationships between parent materials and soil patterns. However, the
scale of observation and other factors often make these relationships difficult to evaluate.
Pedological investigations in the eastern and southeastern US Coastal Plain have
evaluated parent material effects on soil genesis (Gamble and Daniels, 1974), the
relationship between age of the geomorphic surface and soil morphology (Daniels et
al., 1970; Markewich et al., 1986), and the influence of eolian additions (loess) on soil type
(Rebertus, 1998). Although fluvio-marine parent materials in the southeastern US greatly
influence soil properties, few studies have evaluated the effects of short-range variation in
these parent materials.
Portions of Georgia are ideal for investigating large-scale soil/parent material relation-
ships because of the heterogeneity of parent materials. Pleistocene fluvial terraces are
associated with present-day river valleys, and eolian processes have influenced the
landscape. Asmussen (1971) suggested that these deposits were influenced by the pre-
Quaternary drainage network and the direction of prevailing winds. Fluvial sediments tend
to possess all grain sizes depending on source areas, energy, and gradients of flow; channel
deposits are generally coarser than overbank sediments (Davis, 1992). In soils developed
from fluvial parent materials, horizons rich in clay could be:
1) derived from overbank sediments (inherited from the parent material)
2) formed by mineral weathering and clay formation or translocation from overlying
horizons, or
3) formed by some combination of both processes.
Eolian additions have also been recognized in some soils of the southeastern Coastal
Plain. Markewich and Markewich (1994) reported Pleistocene dune sands on the leeward
(east and northeast) side of major streams in the Coastal Plain of Georgia, and also
recognized minor dunes along smaller streams. They also reported sands of mixed eolian
and fluvial origin in soils farther leeward of the dunes. In contrast, Leigh (1998) suggested
that surficial sands previously suspected as eolian at five sites in the Upper Coastal Plain of
South Carolina were predominantly fluvial. In areas without distinctive dune morphology,
the distinction between eolian and fluvial sands in epipedons has been based on their size,
shape, and sorting characteristics (Friedman, 1961, 1979; Green, 1974; Mazzulo and
Ehrlich, 1983; Bui et al., 1989; Leigh, 1998). However, eolian and fluvial sands often have
overlapping grain size distributions (Friedman, 1979; Mazzulo and Ehrlich, 1983; Bui et al.,
1989), and particle shape can be modified by weathering (Green, 1974).
One technique for differentiating eolian from fluvial deposits in near-surface sandy
horizons has been to express the sand grain size distributions on a u scale (u =� log2D;
D = grain diameter, in millimeters) and to evaluate the arithmetic moments of the size
distribution, including the mean, standard deviation (S.D.; sorting), skewness, and kurtosis
(Friedman, 1961; Leigh, 1998). Both fluvial and eolian sands tend to be positively skewed,

J.N. Shaw et al. / Catena 57 (2004) 157–174 159
which complicates their separation, but separates them from beach sands. However,
because of differences in transportation mechanisms, fluvial sands tend to be coarser and
less well sorted than eolian sands (Friedman, 1979; Bui et al., 1989).
In this paper, we attempt to assess parent material origins and their influence on soil
properties in profiles affected by both fluvial and eolian processes in the Upper Coastal
Plain of Georgia. We chose a site with a relatively high degree of short-range soil
variability. The specific objective was to evaluate pedogenic and lithogenic influences on
the Paleudults and Kandiudults occurring on the site.
2. Materials and methods
The study site is in the southern portion of the Fall Line Hills region near Plains, GA
(31j59V0–45UN; 84j24V0–30UW). The surface sediments are believed to be mostly
Pleistocene fluvial deposits on a narrow terrace bounded on the west by the third order
Ty Ty Creek, and on the east by a first-order tributary (Fig. 1). The terrace narrows from
Fig. 1. Location of study site in Georgia, USA. Inset shows plot location.

J.N. Shaw et al. / Catena 57 (2004) 157–174160
north to south (where Ty Ty Creek and the tributary join), with an interstream width of
approximately 1 km near the study zone. The surface slopes to the south at approximately
3 m km� 1 on the summit.
A 1-ha plot was established containing soils exhibiting the full range of characteristics
for this landscape (Bosch and West, 1998). In the plot, sediments were sampled from eight
borings to a depth of 10 m (A–H), and from three pits (NW, SE, and NE) at the corners of
the plot (Fig. 2). Elevations were measured at the borings and several locations around the
plot. Pedons NW and SE were analyzed most intensively as they exhibited large differ-
ences in soil properties. Pedons were described, sampled by horizon, and classified
according to standard techniques (Schoeneberger et al., 1998). A transect was established
inside the plot from the NW to the SE corner (Fig. 2), and at 5-m intervals, the soils were
sampled at depths of 0.25, 0.50, 1.4, and 2 m (Bosch and West, 1998).
Bulk samples were air-dried and weighed, and coarse fragments were removed by
crushing the samples and dry sieving through a 2-mm sieve. Particle size distribution
(PSD) was determined on all plot and transect samples by the pipette method after removal
of organic matter with H2O2 (surface horizons) and dispersion with sodium hexameta-
phosphate (Kilmer and Alexander, 1949). Sand grains were separated into standard size
fractions (1–2, 0.5–1, 0.25–0.5, 0.1–0.25, and 0.05–0.1 mm) by sieving. Fine clay
( < 0.2 Am) was measured for selected pedons (SE, NW, A, and H) by centrifugation and
pipetting (Jackson, 1975). Basic cations were extracted with 1 M NH4OAC (pH 7) using
an autoextractor (Soil Survey Investigations Staff, 1996, p. 203–206), and measured by
atomic absorption spectroscopy (AAS). Cation exchange capacity (CEC) of selected
Fig. 2. Plot topography, location of sampling sites, soil classification, and the location of the transect inside the
plot. Contour lines are at 0.5-m intervals. *Denotes cation exchange capacity not measured.

J.N. Shaw et al. / Catena 57 (2004) 157–174 161
pedons was measured by the 1 M NH4OAC (pH 7) method, and NH4 was measured
colorimetrically (Soil Survey Investigations Staff, 1996, p. 203–206). Aluminum was
extracted with 1 M KCl using an autoextractor, and was measured by AAS (Soil Survey
Investigations Staff, 1996, p. 259–263). Fe was extracted with acid ammonium oxalate
(Feo) to measure poorly crystalline forms of free Fe, and with dithionite–citrate–
bicarbonate (Fed) for crystalline Fe oxides (Jackson et al., 1986). The extracted Fe was
quantified by AAS.
Sand grain size (0.05–2 mm) was measured on horizons from the NW and SE pedons
using image analysis techniques. A video camera was mounted on a petrographic
microscope, and grains were placed on a photographic gray card to optimize contrast.
Sand grains were separated on the gray card to ensure that no particles were touching.
Video images were captured and digitized to determine area, and equivalent grain
diameters were calculated from the measured areas. Grain diameters were expressed on
a A scale, and the size distribution moments (mean, standard deviation, skewness, and
kurtosis) were calculated as follows:
mean ¼ 1
n
Xxj ð1Þ
S:D: ¼
ffiffiffiffiffiffiffiffiffiffiffiffiffiffiffiffiffiffiffiffiffiffiffiffiffiffiffiffiffiffiffiffiffinP
x2 � ðP
xÞ2
nðn� 1Þ
sð2Þ
skewness ¼ n
ðn� 1Þðn� 2ÞX xj � xavg
s
� �3
ð3Þ
kurtosis ¼ nðnþ 1Þðn� 1Þðn� 2Þðn� 3Þ
X xj � xavg
s
� �4� �
� 3ðn� 1Þ2
ðn� 2Þðn� 3Þ ð4Þ
where n = number of observations, xj = observation, xavg =mean for all observations, and
s = standard deviation. The coefficient of variation (CV) was calculated as s/xavg.
Soil samples were fractionated by size following organic matter and Fe removal using
standard techniques (Jackson, 1975). Gibbsite and kaolinite were determined in Mg-
saturated clay fractions by differential scanning calorimetry (DSC). The temperature was
increased from 100 to 600 jC at a constant rate of 10 jC min� 1, with an empty Al pan as a
reference. These analyses were conducted in an N atmosphere to minimize oxidation.
Kaolinite and gibbsite quantities were determined by integrating endotherms and com-
parison with endotherms for samples of known composition (Tan et al., 1986). Clay
samples were oriented on glass slides using the method of Drever (1973) and examined by
X-ray diffraction (XRD) after the following treatments: Mg saturation, glycerol solvation,
and 25 jC; K saturation and 25, 300, and 550 jC (Whittig and Allardice, 1986). Sand
fractions were pulverized in a ball mill grinder, and randomly oriented powders were
examined by XRD. All XRD analyses utilized Cu-Ka radiation and a graphite mono-
chrometer with a h compensating slit; scan speeds were 2j2h min� 1. Hydroxy-interlay-
ered vermiculite (HIV) quantities were estimated by the techniques of Karathanasis and

Table 1
Selected soil properties for six representative pedons on the sitea
Horizon Depth
(cm)
Color Sand
(%)
Silt
(%)
Clay
(%)
Feo/Fed ratio
per 100 g
of clay
CEC
(cmolc kg� 1)
ECEC
clay
(cmolc kg� 1)
VC
sand
(%)
NW: loamy, kaolinitic, thermic Grossarenic Kandiudult
Ap 0–12 7.5YR 4/4 90.6 6.0 3.4 5.02 54.6 31.8 3.6
A/E 12–26 7.5YR 4/4 90.8 6.7 2.5 5.21 57.5 16.4 4.7
E1 26–75 2.5YR 4/8 89.7 6.3 4.1 2.22 21.7 6.4 4.7
E2 75–109 2.5YR 4/8 89.3 6.4 4.4 – 19.2 – 5.1
E3 109–138 2.5YR 4/8 88.3 5.9 5.8 1.46 15.4 11.7 3.7
Bt1 138–191 2.5YR 4/8 81.0 3.8 15.2 0.44 14.1 7.4 5.3
Bt2 191–246 2.5YR 4/8 82.8 3.1 14.1 0.62 7.9 6.7 5.4
BC 246–300 2.5YR 4/8 87.9 2.4 9.7 0.72 8.3 3.9 7.1
CB 300–366 2.5YR 3/6 89.2 3.0 7.8 0.72 9.1 6.6 3.8
C1 366–434 10R 4/8 92.4 1.2 6.4 1.27 9.2 6.3 2.6
C2 434–466 10R 4/8 89.3 5.1 5.6 1.49 9.8 11.6 6.3
SE: coarse– loamy, kaolinitic, thermic Typic Kandiudult
Ap 0–21 7.5YR 4/6 84.9 12.4 2.7 2.90 83.9 29.3 2.0
Bt1 21–52 2.5YR 4/6 77.1 11.3 11.6 0.22 17.3 7.0 1.0
Bt2 52–92 2.5YR 4/6 75.9 10.9 13.2 0.17 16.3 6.7 2.0
Bt3 92–126 10R 4/6 75.3 8.4 16.3 0.16 15.4 8.2 2.6
Bt4 126–164 10R 4/6 66.1 5.8 28.1 0.24 11.1 6.7 3.6
Bt5 164–250 10R 4/6 68.0 4.9 27.1 0.21 9.8 3.8 2.5
BC1 250–293 2.5YR 3/6 67.4 4.7 27.9 0.17 9.5 4.1 2.9
BC2 293–340 2.5YR 4/6 75.1 3.4 21.5 0.17 8.4 5.0 6.4
BC3 340–393 2.5YR 4/8 83.4 1.9 14.7 0.39 10.3 7.2 5.3
CB1 393–445 5YR 5/8 96.2 1.6 2.2 1.95 13.6 14.1 5.4
A: sandy, siliceous, subactive, thermic Psammentic Paleudult
Ap 0–38 10YR 3/3 90.6 6.9 2.5 4.54 – – 7.3
E 38–123 2.5YR 3/6 89.7 5.8 4.5 1.01 – – 7.4
Bt 123–260 10R 4/6 84.5 3.4 12.1 0.19 8.7 7.2 8.1
BC1 260–370 10R 4/6 84.6 8.7 6.7 0.13 7.8 4.8 2.7
BC2 370–420 2.5YR 4/6b 88.6 2.3 9.1 0.20 – – 6.8
BC3 420–510 2.5YR 4/6b 94.6 2.2 3.2 0.61 – – 2.1
C1 510–720 2.5Y 6/8b 97.3 0.5 2.3 0.00 – – 6.7
F: sandy, siliceous, subactive, thermic Psammentic Paleudult
Ap 0–25 10YR 3/3 89.8 7.6 2.6 4.80 – – 2.9
E1 25–62 2.5YR 4/8 88.9 6.5 4.6 1.57 – – 2.3
E2 62–126 5YR 4/6 89.6 6.1 4.3 2.10 – – 3.9
Bt1 126–176 2.5YR 4/6 84.9 3.7 11.4 0.73 10.0 4.3 3.2
Bt2 176–240 2.5YR 4/6 89.4 2.8 7.8 0.90 6.5 6.9 5.6
BC1 240–305 10R 4/6 90.1 0.0 9.9 0.47 6.4 6.3 1.9
BC2 305–349 2.5YR 4/6 87.4 2.0 10.6 0.49 – – 3.2
BC3 349–392 2.5YR 4/8 88.1 6.4 5.5 0.51 – – 5.1
C1 392–422 2.5YR 4/8 96.3 0.9 2.8 0.00 – – 13.2
C2 422–507 2.5YR 4/6 93.5 1.1 5.4 – – – 4.9
G: loamy, kaolinitic, thermic Grossarenic Kandiudult
Ap 0–33 10YR 3/3 83.3 12.5 4.2 2.31 – – 0.6
J.N. Shaw et al. / Catena 57 (2004) 157–174162

Horizon Depth
(cm)
Color Sand
(%)
Silt
(%)
Clay
(%)
Feo/Fed ratio
per 100 g
of clay
CEC
(cmolc kg� 1)
ECEC
clay
(cmolc kg� 1)
VC
sand
(%)
E 33–105 2.5YR 4/8 86.2 7.3 6.5 0.97 – – 2.9
Bt1 105–205 10R 4/6 74.2 4.4 21.4 0.26 8.4 5.4 4.6
Bt2 205–228 10R 4/8 64.2 4.9 30.9 0.15 4.6 2.2 3.2
Bt3 228–285 10R 4/8 75.5 3.0 21.5 0.20 6.6 3.5 3.2
BC1 285–382 10R 4/8 86.5 1.0 12.5 0.27 – – 4.7
BC2 382–447 2.5YR 4/6 83.1 1.7 15.2 0.21 – – 4.8
C1 447–502 10R 4/8 I 89.0 1.8 9.2 0.05 – – 3.5
C2 502–580 10R 4/8 I 75.6 7.2 17.2 – – – 2.2
H: sandy, kaolinitic, thermic Grossarenic Kandiudult
Ap 0–35 10YR 3/3 84.1 12.5 3.4 3.46 – – 3.0
Bt1 35–100 2.5YR 3/6 80.9 10.5 8.6 0.83 – – 3.6
Bt2 100–185 10YR 4/6 69.5 5.9 24.6 0.26 9.5 8.2 4.0
Bt3 185–260 10R 4/6 59.2 4.7 36.1 0.12 5.6 3.2 6.7
Bt4 260–300 10R 4/6 79.7 1.2 19.1 0.21 4.7 2.4 3.2
BC1 300–420 10R 4/8 95.8 0.5 3.7 0.80 – – 5.9
BC2 420–510 10R 4/8 86.8 2.0 11.2 0.49 – – 7.0
BC3 510–570 5YR 4/6 I 81.9 5.8 12.3 0.13 – – 5.7
C1 570–690 2.5Y 8/1 I 10.8 29.3 59.9 0.10 – – 1.2
a Fe0/Fed = oxalate-extractable Fe/dithionite–citrate–bicarbonate-extractable Fe per 100 g of clay; CEC= ca-
tion exchange capacity; ECEC= effective cation exchange capacity; very coarse (VC) sand (1–2 mm) is on a
clay-free basis.b Colors and/or textures stratified.
Table 1 (continued)
J.N. Shaw et al. / Catena 57 (2004) 157–174 163
Hajek (1982), using the ratios of HIV and quartz XRD peaks to an internal kaolinite
standard (d-spacings of 1.40 nm for HIV, 0.72 nm for kaolinite, and 0.425 nm for quartz).
Oriented clods from the NW and SE pedons were air-dried and impregnated with
thermal epoxy resin. Thin sections were made by standard techniques (Murphy, 1986).
3. Results and discussion
3.1. Soil distribution
All soils examined had sandy eluvial horizons of varying thickness overlying argillic
horizons, and six of the 11 profiles possessed kandic horizons (Table 1 and Fig. 2). The
five Paleudult pedons had subsurface diagnostic horizons too sandy for recognition of a
kandic horizon. The soils examined are of two general types. The first consists of sandy A
and E horizons overlying a loamy sand or light sandy loam argillic horizon. The argillic
horizons in these soils contain < 25% clay throughout and are referred to as sandy argillic
horizons. The second type also consists of sandy eluvial horizons overlying loamy sand or
sandy loam argillic horizons, but has a second clay increase to sandy clay loam with >25%
clay; they are referred to as loamy argillic horizons, even though this nomenclature does
not coincide with textural definitions in soil taxonomy. All pedons are in kaolinitic or

Fig. 3. Changes in clay concentration with depth for the NW and SE pedons.
Fig. 4. Clay-free sand size distributions in the horizon below the abrupt clay increase in pedons SE, G, and H.
J.N. Shaw et al. / Catena 57 (2004) 157–174164

J.N. Shaw et al. / Catena 57 (2004) 157–174 165
siliceous families, and are taxonomically separated (Fig. 2) by the texture of the subsurface
diagnostic horizon and the thickness of sandy eluvial horizons. The southerly slope and
the generally decreasing thickness of the sandy eluvial horizons at the southeastern end of
the plot suggest that slight erosion has occurred.
3.2. Parent material differences between pedons
The pedons possessing >25% clay in part of the argillic horizon (SE, G, and H) are
generally located toward the SE portion of the plot (Table 1, Fig. 2). In these pedons,
horizons with sandy clay loam texture occur either in the upper part of the argillic horizon,
or within the argillic horizon coincident with a second increase in clay (Bt4, Bt1, and Bt2,
for SE, G, and H, respectively) (Table 1, Fig. 3). The depth to the sandy clay loam texture
is 1.00–1.26 m below the soil surface, and the upper surface of this clay increase is
generally flat (elevations of 129.1, 129.2, and 129.2 m for the SE, G, and H sites,
respectively). This does not exactly reflect the ground surface topography (130.4, 130.3,
and 130.2 for SE, G, and H, respectively), which might be expected of contemporary
pedogenic features. The sand size distributions (on a clay-free basis) of horizons with
sandy clay loam texture in the SE, G, and H pedons are similar (Fig. 4), suggesting that
they are lithologically related. From this evidence, we suggest that the relatively large
increases in clay within the argillic horizons are either depositional features, or result from
clay illuviation related to a past geomorphic surface.
The upper boundary of the argillic horizon in all pedons generally slopes to the south
(Fig. 5), and is approximately parallel to the present-day surface. A layer consisting
Fig. 5. The elevation of the upper boundary of the argillic horizon in the plot. Contour lines are at 0.2-m intervals.

J.N. Shaw et al. / Catena 57 (2004) 157–174166
dominantly of medium and fine sand occurs at 129.5-m (F 0.03 m) elevation in pedons
E, F, G, and H, and a layer of predominantly medium sand is present in A, B, and D at
128.2 (F 0.07 m). The similar elevation of these two layers suggests that they are
relatively continuous horizontal layers. The fact that the upper boundary of the argillic
Fig. 6. (a) The clay concentration at two depths (140 and 200 cm) and (b) the ratio of coarse sand (0.5–1 mm) to
very fine sand (0.05–0.1 mm) at 50 and 200 cm depths along the plot transect proceeding from NW to SE.

J.N. Shaw et al. / Catena 57 (2004) 157–174 167
horizon is generally parallel to the ground surface suggests that formation of the argillic
horizon is associated with the contemporary geomorphic surface.
The argillic horizon increases in clay content from northwest to southeast along the
transect within the plot. At both 140 and 200 cm depths, the clay content increases fairly
abruptly from northwest to southeast at 100–120 m along the transect (Fig. 6a).
Differences in either weatherable minerals or clay illuviation could account for these
lateral differences in clay, but it is unlikely that they would occur so abruptly. Sand
fractions (0.05–2.0 mm) taken from the C horizons are almost entirely composed of
quartz (data not shown), as also noted in similar landscapes of the North Carolina
Coastal Plain by Gamble and Daniels (1974). Assuming similar amounts of weatherable
minerals in these pedons, the differences in clay content probably result from differences
in the parent material. Variations in the coarse sand (0.5–1 mm)/very fine sand (0.05–
0.1 mm) ratio across the plot (Fig. 6b) also indicate lateral heterogeneity of parent
materials.
Fine clay ( < 0.2 Am)/coarse clay (0.2–2.0 Am) ratios, often diagnostic for evaluating
illuvial clay (Cabrera-Martinez et al., 1989), do not indicate differences in amounts of
illuvial clay between the loamy and sandy argillic horizons (data not shown). They also do
not vary with depth within the argillic horizon for the loamy pedons that exhibit two
distinct increases in clay. Clay bridges observed in Bt horizons in the field were also
identified in thin sections (Fig. 7a and b), but were not abundant. Some illuvial clay
features may have been destroyed over time. Alternatively, the lack of better illuvial clay
expression may be evidence that differences in the amount of clay in the argillic horizon
result from parent material differences, rather than differences in weathering and
translocation of colloidal silicates.
Fig. 7. Photomicrographs of thin sections from (a) the Bt1 horizon of profile SE under plane polarized light; and
(b) the Bt1 horizon of profile NW under plane-polarized light; b= clay bridging. Bar = 1 mm.

Fig. 8. (a) Plots of skewness vs. the CV, and (b) kurtosis vs. the CVof sand grain size distributions for horizons
from the SE and NW pedons. The dashed lines mainly separate A, A/E, E. and Bt horizons (left) from BC, CB
and C horizons (right).
J.N. Shaw et al. / Catena 57 (2004) 157–174168

3.3. Parent material differences within pedons
The plot of skewness vs. the coefficient of variation (CV) of the sand grain size
distribution for horizons of the NW and SE pedons (Fig. 8a) suggest that differences in the
mode of parent material deposition exist within pedons. There seems to be a group (lower
left on the plot) corresponding to most horizons of the NW (Ap, A/E, E, and Bt horizons)
and SE (Ap, Bt, and BC horizons) pedons, and another group (upper right on plot)
corresponding to subjacent horizons (transitional to C and C horizons). Most horizons in
the sola of both pedons are less positively skewed and better sorted than C horizons. The
plot of kurtosis vs. the CVof the sand grain size distribution from the same horizons (Fig.
8b) suggests a similar break corresponding to the bottom of the solum, although other
interpretations are also possible.
The plots illustrate that differences in sand grain distributions are mostly related to
CV and, consequently, to sorting characteristics. The lower CVs of the grain size
distributions exhibited by most of the horizons within the sola indicate slightly better
sorting in the upper portions of the profiles. In addition, the lower horizons tend to
exhibit more positive skewness values. Friedman (1961, 1979) proposed that most river
and eolian sands are positively skewed because of preferential transport of finer particles
in the suspended load. The increased skewness with depth suggests that the lower
horizons have a greater fluvial or eolian component than the near-surface horizons.Me-
dium sand/fine sand ratios in the NW and SE profiles increase at 2–4 m depth in the
lower Bt and BC horizons (Fig. 9). These depths are similar to the breaks in the
groupings shown on the skewness and kurtosis plots (e.g., the Bt2/BC boundary for
J.N. Shaw et al. / Catena 57 (2004) 157–174 169
Fig. 9. Vertical distribution of medium sand (0.25–0.5 mm)/fine sand (0.1–0.25 mm) ratios for the NW and SE
profiles.

J.N. Shaw et al. / Catena 57 (2004) 157–174170
NW; the BC1/BC2 boundary for SE). These data suggest the presence of two parent
materials in these pedons, the discontinuity between them occurring close to the bottom
of the solum. As reported by Gamble et al. (1969) and Leigh (1998), we did not find
evidence for a discontinuity between the eluvial and illuvial horizons. In addition, the
medium sand/fine sand ratio is not the same from pedon to pedon, again indicating
lateral variability of parent materials in this landscape.
3.4. Possible eolian influence
Separations based on graphical presentations of moments have been developed for
eolian and fluvial sediments (Friedman, 1979; Leigh, 1998). The empirical differences
indicate that eolian sediments are finer (higher mean) and better sorted (lower standard
deviation) than fluvial sediments. Fig. 10 shows the mean and standard deviation values
for the NW and SE samples and the breaks between fluvial and eolian deposits proposed
by Friedman (1979) and Leigh (1998). Horizons on the left side of the graph contain the
relatively coarser and less well sorted sand grains, which we suggest were deposited by
fluvial mechanisms, whereas horizons on the right side of the graph are composed of
sand that we suggest is eolian because it is better sorted and finer. The solid line roughly
corresponds with the breaks between the solum (eolian) and underlying BC and C
(fluvial) horizons. In the region, eolian dunes occur predominantly on the eastern side of
rivers (Markewich and Markewich, 1994), suggesting that the source area for these
Fig. 10. Standard deviation of u vs. the mean u sand grain size from the NW and SE pedons. Dashed lines are
those of Leigh (1998) and Friedman (1979) for the boundaries between fluvial and eolian sands. The solid line
roughly corresponds with the breaks between the solum and underlying BC and C horizons.

J.N. Shaw et al. / Catena 57 (2004) 157–174 171
eolian sands was associated with Ty Ty Creek. However, the location of possible source
areas for eolian contributions is beyond the scope of this paper; it was considered by
Daniels (1969).
Fig. 10 suggests that upper horizons of the profiles have an eolian component,
whereas the lower horizons are fluvially derived. However, the solum possesses some
sand, which is coarser than expected for completely eolian derived materials, as its first
percentile (u1) is >1 mm (Leigh, 1998). Upper horizons in most of the pedons have
>2% very coarse sand (1–2 mm diameter) in the solum (Table 1), and this precludes a
completely eolian origin. In addition, the high clay content of the SE solum does not fit
a completely eolian origin. In a similar landscape, Leigh (1998) deduced that the
surficial sands at five of six sites on terraces and interfluves in the Sand Hills of South
Carolina were of fluvial origin. Because of the presence of buried Native American
artifacts, Leigh (1998) originally proposed that the artifacts had been buried by eolian
sediment. However, he later concluded that these sites had been subjected to bioturba-
tion resulting in burial of the artifacts. Similarly, it is possible that eolian additions to
these soils have been mixed with a fluvial matrix, thus giving mixtures of both eolian
and fluvial sediment in the upper horizons. Bioturbation could result in complete mixing
of much of the upper portions of a soil. Alternatively, these sediments may have been
mixed by shallow fluvial reworking after eolian deposition, which would also yield
sediment of mixed characteristics.
3.5. Weathering trends
Subaerial exposure and subsequent weathering of primary minerals in humid, warm
environments often lead to the formation of kaolinite, HIV, Fe oxides, and gibbsite in the
clay fraction (Karathanasis et al., 1983). Reddish hues (10 R, 2.5 YR) throughout the sola
of the profiles indicate a relatively weathered and highly oxidized status (Table 1). For all
subsoils examined, XRD analyses show that kaolinite, gibbsite, and HIV are the dominant
minerals in the clay ( < 2 Am) fraction.
We attempted to assess differences in weathering or pedogenesis between the pedons by
examining (1) extractable Fe forms, (2) HIV quantities, and (3) gibbsite/kaolinite ratios in
the clay fraction. The rationale was that the greater is the degree of weathering, the more
pedogenic is the formation of gibbsite at the expense of kaolinite (enhanced Si loss).
Although gibbsite can form rapidly in environments with a large portion of weatherable
minerals (Norfleet and Smith, 1989), we interpret higher gibbsite/kaolinite ratios in this
environment to indicate enhanced Si loss and advanced weathering.
Ratios of Feo/Fed (expressed on a 100-g-of-clay basis) do not vary much between the
soils (Table 1). The HIV quantities generally decrease with depth, but are approximately
the same in the NW and SE pedons (Fig. 11a). The ratio of gibbsite/kaolinite generally
decreases with depth (Fig. 11b), and the soils with loamy argillic horizons (SE, H, and
G) tend to have lower gibbsite/kaolinite ratios than the soils with sandy argillic horizons
(NW, B and F), suggesting a greater degree of Si leaching in the sandy soils. This
implies increased weathering. Consequently, these results suggest that soils with loamier
argillic horizons are less weathered than the sandier soils. The effective saturated
hydraulic conductivity (weighted mean for the entire solum down to the CB horizons)
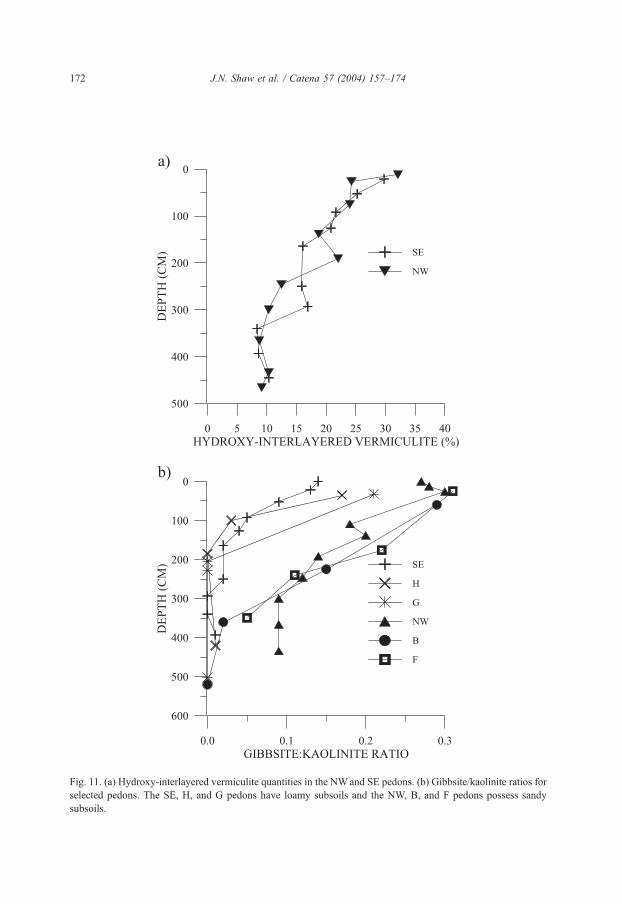
Fig. 11. (a) Hydroxy-interlayered vermiculite quantities in the NWand SE pedons. (b) Gibbsite/kaolinite ratios for
selected pedons. The SE, H, and G pedons have loamy subsoils and the NW, B, and F pedons possess sandy
subsoils.
J.N. Shaw et al. / Catena 57 (2004) 157–174172

J.N. Shaw et al. / Catena 57 (2004) 157–174 173
measured with the borehole technique (Amoozegar, 1989) for the sandy NW pedon is
almost five times greater (35.2 cm h� 1) than that of the loamy SE pedon (7.5 cm h� 1).
This would cause more intensive leaching and increased loss of Si for these sandier
pedons.
4. Conclusions
Differences in soil properties across this plot are related to differences in the parent
materials, which seem to control the amount of clay present in argillic horizons. Two
parent materials are present in the profiles, and the lower boundary of the argillic horizon
corresponds approximately with the discontinuity. There is probably an eolian component
in the upper portion of the profile, most likely derived from wind erosion of sands along
Ty Ty Creek. In similar soils of the region (other Arenic and Grossarenic soils), horizontal
discontinuities have rarely been identified (Gamble et al., 1969; Leigh, 1998), and we
were surprised to find the discontinuities. However, discontinuities are not evident
between eluvial and illuvial horizons, but are located deeper in the illuvial portion of
the solum.
As suggested by Gamble and Daniels (1974) for the North Carolina Coastal Plain,
parent material is a major determinant of soil properties. They speculated that ultisols with
strongly weathered mineralogical suites are the only soils that could form in the parent
materials present in the Upper and Middle Coastal Plain of the southeastern USA. We
agree with this and also suggest that parent materials control soil formation to a finer scale
in these settings, in particular dictating subsoil clay quantities that determine soil family
placement in US Soil Taxonomy. Although terrain attributes are similar (geomorphic
component, slope, and aspect), large differences in soils and accessory properties (water-
holding capacity, nutrient retention, and rooting depth) result from parent material
variation across these landscapes.
References
Amoozegar, A., 1989. A compact constant-head permeameter for measuring saturated hydraulic conductivity of
the vadose zone. Soil Sci. Soc. Am. J. 53, 1356–1361.
Asmussen, L.E., 1971. Hydrologic effects of Quaternary sediments above the marine terraces in the Georgia
coastal plain. Southeast. Geol. 12, 189–201.
Bosch, D.D., West, L.T., 1998. Hydraulic conductivity variability for two sandy soils. Soil Sci. Soc. Am. J. 62,
90–98.
Bui, E.N., Mazzullo, J.M, Wilding, L.P., 1989. Using quartz grain size and shape analysis to distinguish
between eolian and fluvial deposits in the Dallal Bosso of Niger (West Africa). Earth Surf. Processes Landf.
14, 157–166.
Cabrera-Martinez, F., Harris, W.G., Carlisle, V.W., Collins, M.E., 1989. Evidence for clay translocation in coastal
plain soils with sandy/loamy boundaries. Soil Sci. Soc. Am. J. 53, 1108–1114.
Daniels, R.B., 1969. Eolian sands associated with Coastal Plain River Valleys—some problems in their age and
source. Southeast. Geol. 11, 97–110.
Daniels, R.B., Gamble, E.E., Cady, J.G., 1970. Some relations among coastal plain soils and geomorphic surfaces
in North Carolina. Soil Sci. Soc. Am. Proc. 34, 648–653.

J.N. Shaw et al. / Catena 57 (2004) 157–174174
Davis, R.A., 1992. Depositional Systems: An Introduction to Sedimentology and Stratigraphy. Prentice Hall,
New Jersey.
Drever, J.I., 1973. The preparation of oriented clay mineral specimens for X-ray diffraction analysis by a filter
membrane peel technique. Am. Mineral. 58, 553–554.
Friedman, G.M., 1961. Distinction between dune, beach, and river sands from their textural characteristics.
J. Sediment. Petrol. 31, 514–529.
Friedman, G.M., 1979. Differences in size distributions of populations of particles among sands of various
origins. Sedimentology 26, 3–32.
Gamble, E.E., Daniels, R.B., 1974. Parent material of upper and middle coastal plain soils in North Carolina. Soil
Sci. Soc. Am. Proc. 38, 633–637.
Gamble, E.E., Daniels, R.B., McCracken, R.J., 1969. A2 horizons of coastal plain soils: pedogenic or geologic
origin. Southeast. Geol. 11, 137–152.
Green, P., 1974. Recognition of sedimentary characteristics in soils by size–shape analysis. Geoderma 11,
181–193.
Jackson, M.L., 1975. Soil Chemical Analysis—Advanced Course. M.L. Jackson, Madison, WI.
Jackson, M.L., Lim, C.H., Zelazny, L.W., 1986. Oxides, hydroxides, and aluminosilicates. In: Klute, A. (Ed.),
Methods of Soil Analysis: Part 1. Physical and Mineralogical Methods, 2nd ed. AgronomyMonograph, vol. 9.
ASA and SSSA, Madison, WI, pp. 113–119.
Karathanasis, A.D., Hajek, B.F., 1982. Revised methods for quantitative determination of minerals in soil clays.
Soil Sci. Soc. Am. J. 46, 419–425.
Karathanasis, A.D., Adams, F., Hajek, B.F., 1983. Stability relationships in kaolinite, gibbsite, and Al-hydroxy
interlayered vermiculite soil systems. Soil Sci. Soc. Am. J. 47, 1247–1251.
Kilmer, V.J., Alexander, L.T., 1949. Methods of making mechanical analysis of soils. Soil Sci. 68, 15–24.
Leigh, D.S., 1998. Evaluating artifact burial by eolian versus bioturbation processes, South Carolina Sandhills,
USA. Geoarchaeology 13, 309–330.
Markewich, H.W., Markewich, W., 1994. An overview of Pleistocene and Holocene inland dunes in Georgia and
the Carolinas—morphology, distribution, age, and paleoclimate. USGS Tech. Bull., 2069.
Markewich, H.W., Pavich, M.J., Mausbach, R.L., Hall, R.G., Hearn, P.P., 1986. Age relations between soils and
geology in the coastal plain of Maryland and Virginia. USGS Tech. Bull., 1589-A.
Mazzulo, J.M., Ehrlich, R., 1983. Grain-shape variation in the St. Peter sandstone: a record of eolian and fluvial
sedimentation of an early Paleozoic cratonic sheet sand. J. Sediment. Petrol. 53, 105–119.
Murphy, C.P., 1986. Thin Section Preparation of Soils and Sediments. AB Academic Publishers, Berkhamsted,
Herts, UK.
Norfleet, M.L., Smith, B.R., 1989. Weathering and mineralogical classification of selected soils in the Blue Ridge
Mountains of South Carolina. Soil Sci. Soc. Am. J. 53, 1771–1778.
Rebertus, R.A., 1998. Loessial soils of Delaware: taxonomy and map-unit assessment. Soil Sci. Soc. Am. J. 62,
412–422.
Schoeneberger, P.J., Wysocki, D.A., Benham, E.C., Broderson, W.D., 1998. Field book for describing and
sampling soils. Natural Resources Conservation Service, USDA National Soil Survey Center, Lincoln, NE.
Soil Survey Investigations Staff, 1996. Soil survey laboratory methods manual. Soil Survey Investigations
Report, vol. 42. USDA-SCS, National Soil Survey Center, Lincoln, NE.
Tan, K.H., Hajek, B.F., Barshad, I., 1986. Thermal analysis techniques. In: Klute, A. (Ed.), Methods of Soil
Analysis: Part 1. Physical and Mineralogical Methods, 2nd ed. Agronomy Monograph, vol. 9. ASA and
SSSA, Madison, WI, pp. 151–183.
Whittig, L.D., Allardice, W.R., 1986. X-ray diffraction techniques. In: Klute, A. (Ed.), Methods of Soil Anal-
ysis: Part I. Physical and Mineralogical Methods, 2nd ed. Agronomy, vol. 9. ASA and SSSA, Madison, WI,
pp. 336–341.
Zhu, A.X., Band, L., Vertessy, R., Dutton, B., 1997. Derivation of soil properties using a Soil Land Inference
Model (SoLIM). Soil Sci. Soc. Am. J. 61, 523–533.