
Parapet Research Group, Princeton University EE Vice-Versa Talk #2 Apr 29, 2005 Phase Analysis on...
42
Parapet Research Group, Princeton University EE Vice-Versa Talk #2 Apr 29, 2005 Phase Analysis on Real Systems Canturk ISCI Margaret MARTONOSI
-
Upload
wilfrid-king -
Category
Documents
-
view
214 -
download
0
Transcript of Parapet Research Group, Princeton University EE Vice-Versa Talk #2 Apr 29, 2005 Phase Analysis on...

Parapet Research Group, Princeton University EE
Vice-Versa Talk #2
Apr 29, 2005
Phase Analysis on Real Systems
Canturk ISCI
Margaret MARTONOSI

Canturk Isci - Margaret Martonosi3
Phase Analysis – Challenges on Real-Systems
Previously… Runtime processor power monitoring and estimation
Power Phase Behavior of programs (Power Vectors)
Canturk Isci - Margaret Martonosi4
Phase Analysis – Challenges on Real-Systems
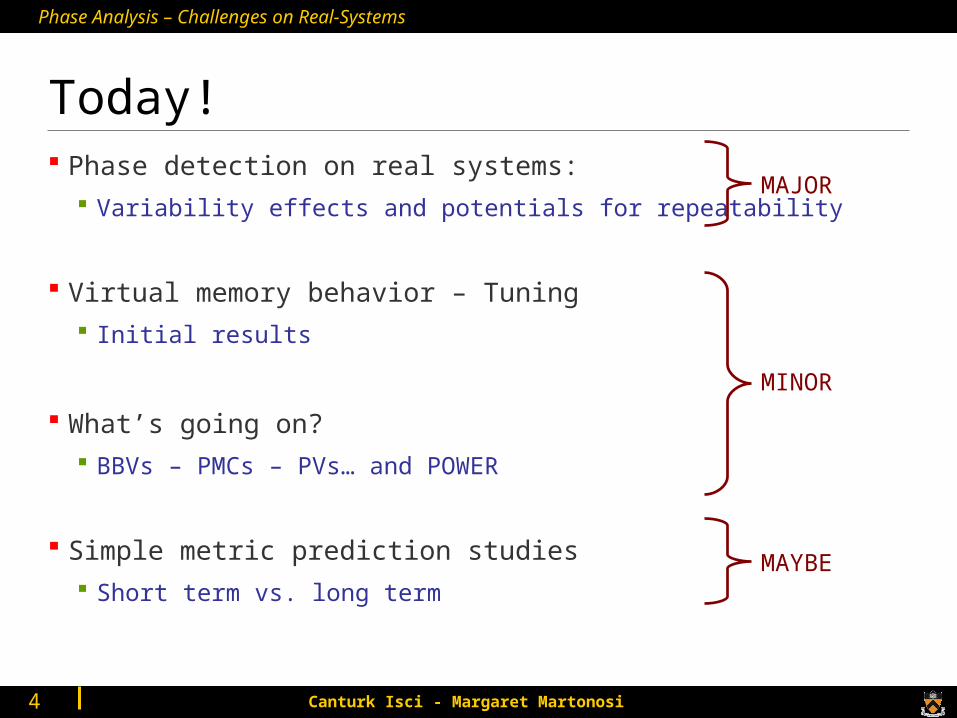
Today! Phase detection on real systems:
Variability effects and potentials for repeatability
Virtual memory behavior – Tuning Initial results
What’s going on? BBVs – PMCs – PVs… and POWER
Simple metric prediction studies Short term vs. long term
MAJOR
MINOR
MAYBE
Canturk Isci - Margaret Martonosi5
Phase Analysis – Challenges on Real-Systems
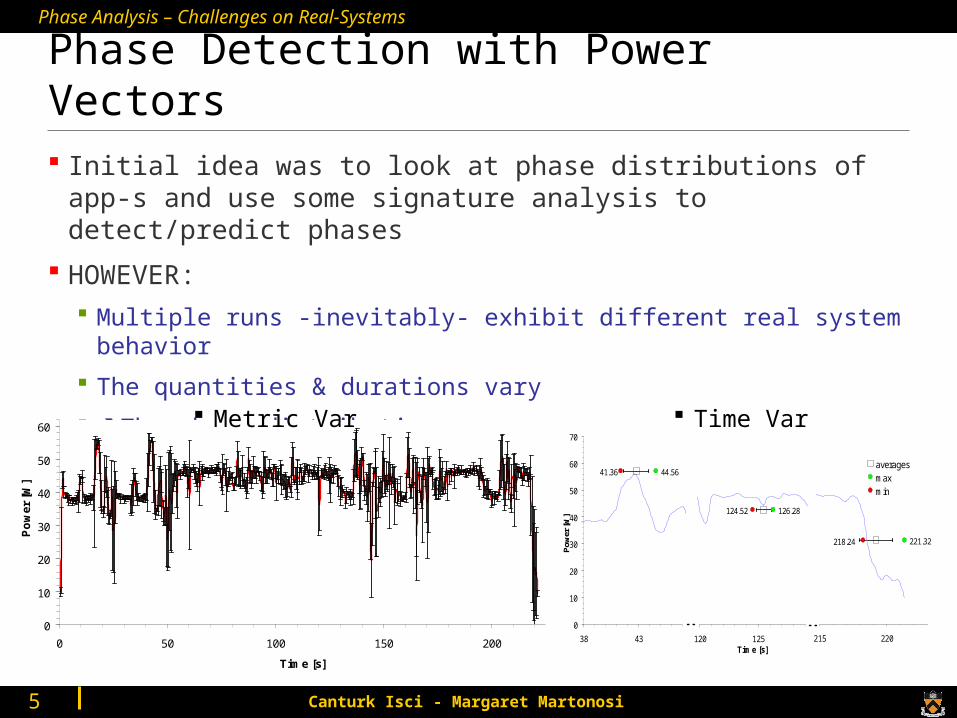
Phase Detection with Power Vectors Initial idea was to look at phase distributions of app-s and use
some signature analysis to detect/predict phases
HOWEVER: Multiple runs -inevitably- exhibit different real system behavior
The quantities & durations vary
The phase distributions vary
0
10
20
30
40
50
60
70
0 50 100 150 200
Time [s]
Po
wer
[W
]
221.32218.24
215 220
averagesmax min
44.5641.36
0
10
20
30
40
50
60
70
38 43
Pow
er [W
] 126.28124.52
120 125Time [s]
Metric Var Time Var
Canturk Isci - Margaret Martonosi6
Phase Analysis – Challenges on Real-Systems
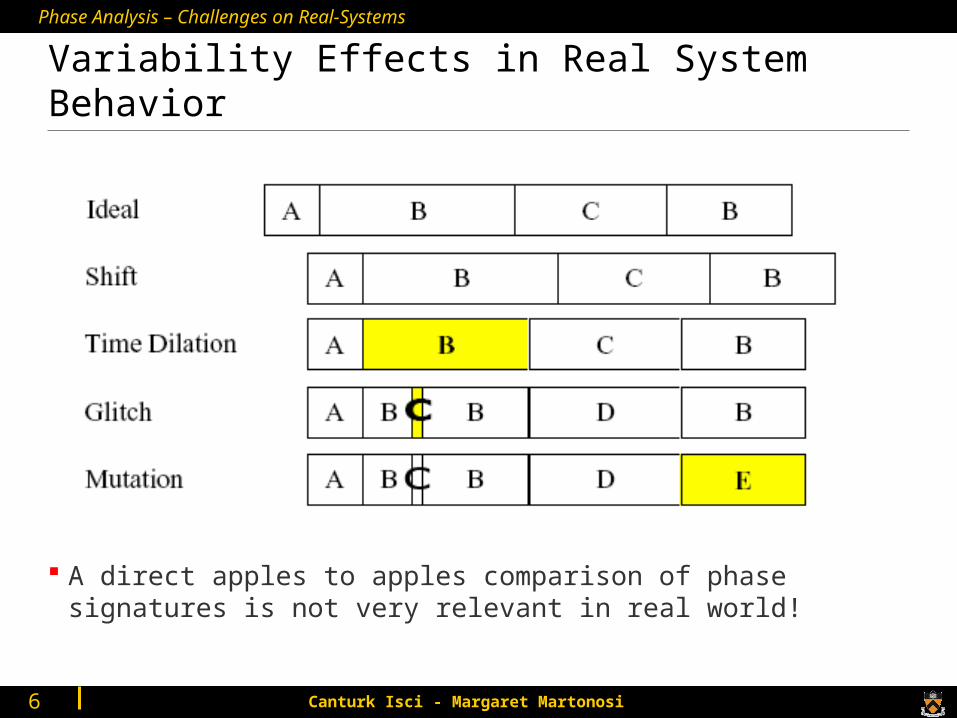
Variability Effects in Real System Behavior
A direct apples to apples comparison of phase signatures is not very relevant in real world!

Canturk Isci - Margaret Martonosi9
Phase Analysis – Challenges on Real-Systems
How do Phase Distributions Compare?Ex: 2 runs of gcc

Canturk Isci - Margaret Martonosi10
Phase Analysis – Challenges on Real-Systems
We Got Ourselves a Problem: How do we extract this recurrent behavior information?
Speech/Humming recognition: Stored libraries, signal stats
Pitch tracking
Image/Biomedical: Image warping
Registration/Mutual information
Architects: Simple to apply online
Implementable w/o massive state & combinationals

Canturk Isci - Margaret Martonosi11
Phase Analysis – Challenges on Real-Systems
Interesting Observation with Transitions Trying to detect
application from behavior
Upper Case: Hit!
Lower Case: False alarm?
Tracking phase transitions rather than phase sequences proves to be more useful in detecting recurrent behavior*
0
0.1
0.2
0.3
0.4
0.5
0.6
-15 -10 -5 0 5 10 15
Correlation Coefficient for Phase Distribution InformationCorrelation Coefficient for Phase Change (Transition) Information
-0.1
0
0.1
0.2
0.3
0.4
0.5
0.6
-15 -10 -5 0 5 10 15sample shift
Gcc1-Gcc2
Gcc-Equake

Canturk Isci - Margaret Martonosi12
Phase Analysis – Challenges on Real-Systems
Our Transition-Guided Detection FrameworkBenchmark run #1
Sample PMCs to form 12D vectors
Benchmark run #2
Vector stream #1
Identify Transitions
Vector stream #2
Tinit #1
Apply glitch/gradient filtering
Tinit #2
Tgg #1 Tgg #2
Apply near-neighbor blurring
TggN #1
Match ⇒ Peak at best alignmentMismatch ⇒ No observable peak
Apply cross correlation
Canturk Isci - Margaret Martonosi13
Phase Analysis – Challenges on Real-Systems
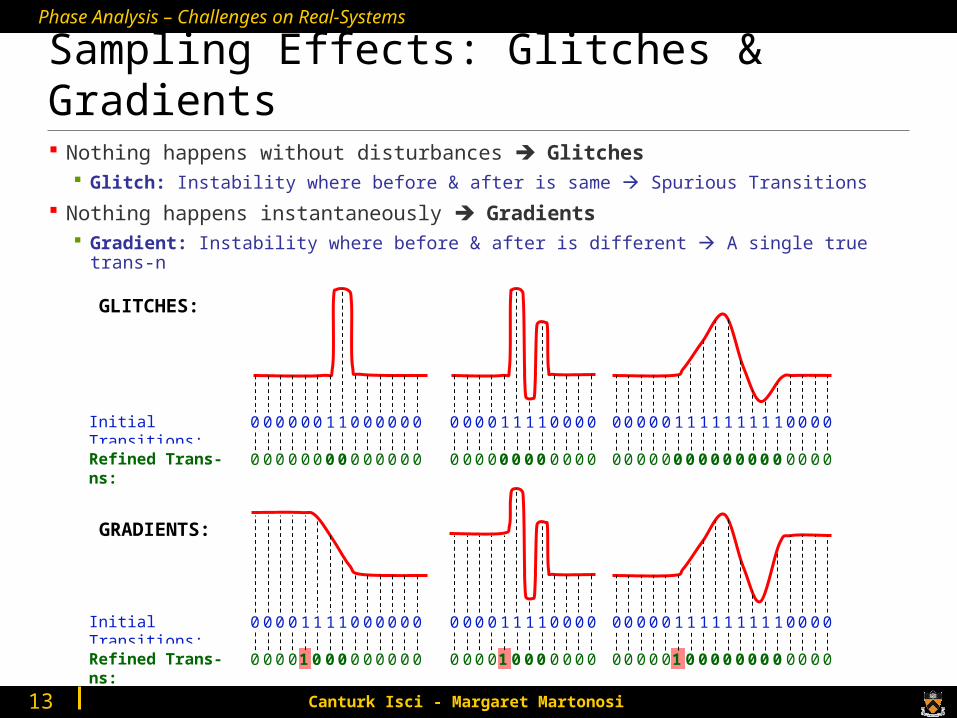
Sampling Effects: Glitches & Gradients Nothing happens without disturbances Glitches
Glitch: Instability where before & after is same Spurious Transitions
Nothing happens instantaneously Gradients Gradient: Instability where before & after is different A single true trans-n
Initial Transitions:
GLITCHES:
0 00 0 00 110 000 00 0 00 0 11 110 000 00 000 11 111 111 10000
Refined Trans-ns: 0 00 0 00000 000 00 0 00 000000 000 00 0000000000000000
Initial Transitions:
GRADIENTS:
0 00 0 11 110 000 00 0 00 0 11 110 000 00 000 11 111 111 10000
Refined Trans-ns: 0 00 010000 000 00 0 00 010000 000 00 0001000000000000

Canturk Isci - Margaret Martonosi14
Phase Analysis – Challenges on Real-Systems
Glitch/Gradient Filtering Very simple: no consecutive transitions
Leads to large reductions in transition count
We call these “Refined Transitions (Tgg)”
16.28 20.68 25.08 29.48 33.88 38.28 42.68 47.08 51.48 55.88 60.28 64.68Time [s]
Po
we
r [W
]
5
15
25
35
45
55
65Glitches Gradients Power Transitions

Canturk Isci - Margaret Martonosi16
Phase Analysis – Challenges on Real-Systems
Time Shifts We have binary information We can do cheaper than
shifted correlation coeff-s Using Cross-Correlations show equally useful results Easily implementable
Ex: Matching and Mismatch cases, and “The Peak”
Gcc1-Gcc2 Gcc-Equake

Canturk Isci - Margaret Martonosi17
Phase Analysis – Challenges on Real-Systems
Observation: Dilations exist as small jitters (few samples)
Proposed Solution: “Near-Neighbor Blurring” Blur edges slightly Consider transitions as distributions around
their actual locations
Tolerance: Spread of this distribution, [t-x, t+x] samples
Ex: Matching improvement with tolerance=4:
Time Dilations
0 0 1 0 0 0 0 0 0 1 0 0 1 0 0 0 0 0 0 0 0 0 0
0 1 0 0 0 0 0 0 0 1 0 0 0 0 1 0 0 0 0 1 0 0 0
.6 .8 1 .8 .6 .4 .4 .6 .8 1 .8 .8 1 .8 .6 .4 .2 0 0 0 0 0 0
0 1 0 0 0 0 0 0 0 1 0 0 0 0 1 0 0 0 0 1 0 0 0
run1
run2
run1
run2
Mism
atch!
Match!

Canturk Isci - Margaret Martonosi18
Phase Analysis – Challenges on Real-Systems
Our Transition-Guided Detection FrameworkBenchmark run #1
Sample PMCs to form 12D vectors
Benchmark run #2
Vector stream #1
Identify Transitions
Vector stream #2
Tinit #1
Apply glitch/gradient filtering
Tinit #2
Tgg #1 Tgg #2
Apply near-neighbor blurring
TggN #1
Match ⇒ Peak at best alignmentMismatch ⇒ No observable peak
Apply cross correlation

Canturk Isci - Margaret Martonosi19
Phase Analysis – Challenges on Real-Systems
Results How do we quantify the strength of the peak?
Matching Score:
Detection Results: (green: highest match; red: highest mismatch)bzip2 equake gap gcc gzip mcf vortex convert lame
bzip2 0.44 0.05 0.07 0.05 0.15 0.18 0.08 0.09 0.15equake 0.15 0.39 0.28 0.06 0.26 0.25 0.09 0.04 0.08gap 0.20 0.22 0.79 0.07 0.10 0.33 0.04 0.05 0.12gcc 0.05 0.04 0.05 0.19 0.03 0.05 0.16 0.04 0.12gzip 0.10 0.10 0.19 0.05 1.08 0.16 0.10 0.03 0.07mcf 0.18 0.18 0.23 0.04 0.16 6.14 0.17 0.08 0.08vortex 0.23 0.10 0.12 0.01 0.11 0.08 1.93 0.03 0.05convert 0.21 0.17 0.26 0.06 0.14 0.25 0.09 0.22 0.13lame 0.12 0.11 0.12 0.04 0.13 0.20 0.06 0.02 0.21
BESTTOLERANCE
1 2 1 3 1 0 1 7 2
Canturk Isci - Margaret Martonosi20
Phase Analysis – Challenges on Real-Systems
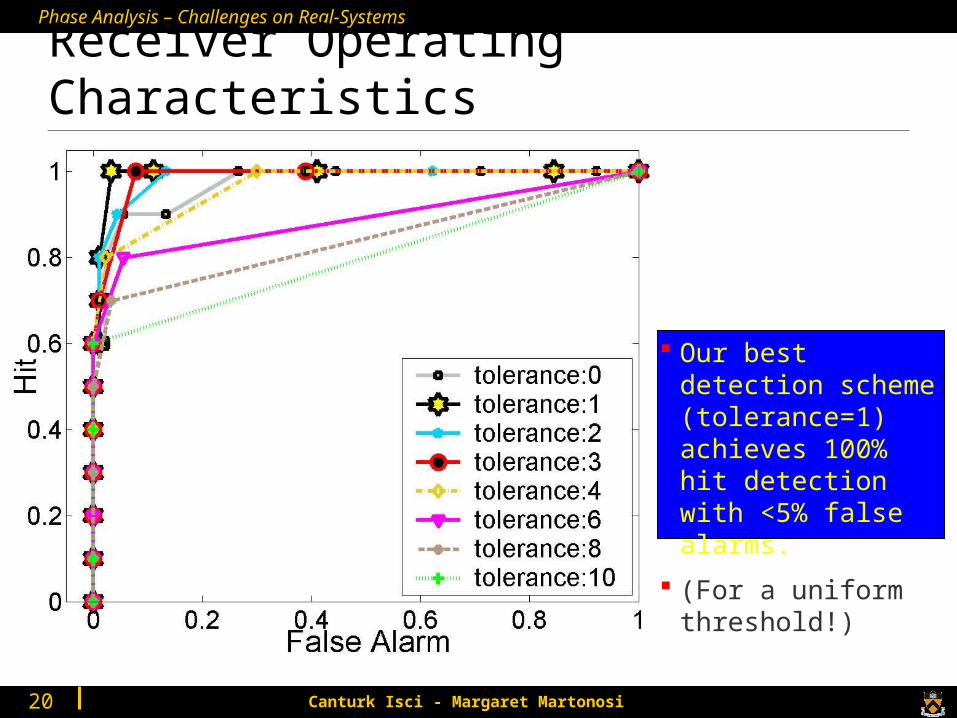
Receiver Operating Characteristics
Our best detection scheme (tolerance=1) achieves 100% hit detection with <5% false alarms.
(For a uniform threshold!)
Canturk Isci - Margaret Martonosi21
Phase Analysis – Challenges on Real-Systems
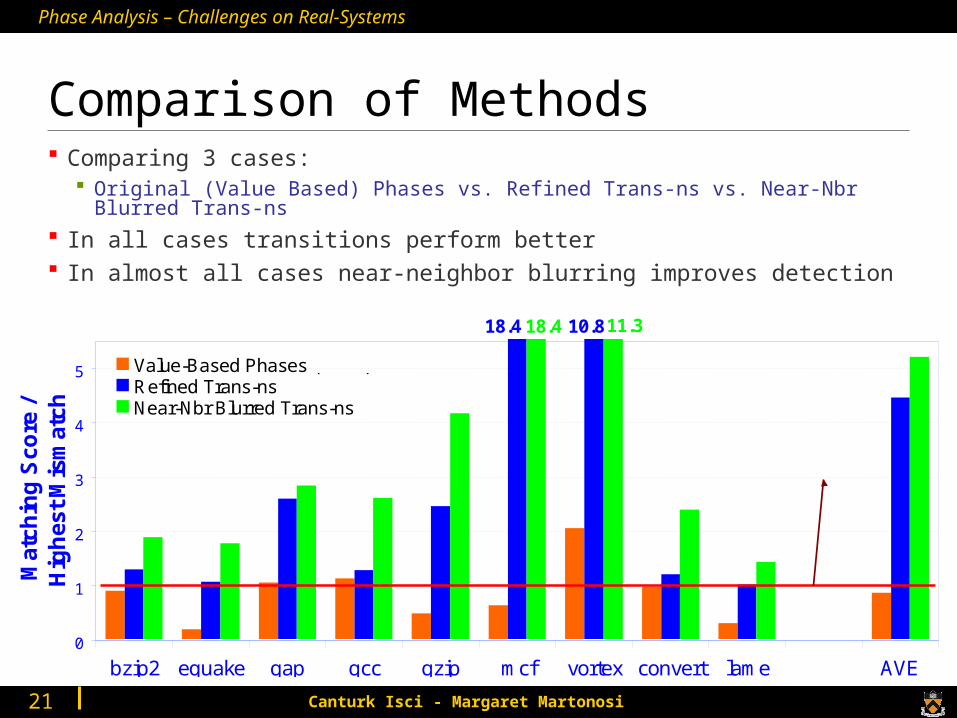
Comparison of Methods Comparing 3 cases:
Original (Value Based) Phases vs. Refined Trans-ns vs. Near-Nbr Blurred Trans-ns
In all cases transitions perform better In almost all cases near-neighbor blurring improves detection
10.818.4 18.4 11.3
0
1
2
3
4
5
bzip2 equake gap gcc gzip mcf vortex convert lame AVE
Mat
chin
g S
core
/ H
igh
est
Mis
mat
ch
Value-Based Phases Refined Trans-nsNear-Nbr Blurred Trans-ns
Break-evenvalue
(VBPs)(Tgg)
(TggN)

Canturk Isci - Margaret Martonosi22
Phase Analysis – Challenges on Real-Systems
Conclusions
Phase-recurrent behavior detection on real systems has interesting problems resulting from system induced variability
Looking at phase transition information in part improves detection capabilities
Supporting methods such as Glitch/Gradient Filtering and Near-Neighbor Blurring improve detectability of transition signatures

Canturk Isci - Margaret Martonosi23
Phase Analysis – Challenges on Real-Systems
Today! Phase detection on real systems:
Variability effects and potentials for repeatability
Virtual memory behavior – Tuning Initial results
What’s going on? BBVs – PMCs – PVs… and POWER
Simple metric prediction studies Short term vs. long term

Canturk Isci - Margaret Martonosi24
Phase Analysis – Challenges on Real-Systems
Workload Phases Memory Behavior? Few of the Inspirations:
Redhat Magazine Issue #1 [Dec 2004] Dynamically Tracking Page Miss Ratio Curve [ASPLOS 2005] Gokul Kandiraju [PhD Thesis 2004]
Can we track phase behavior from PMCs and VM related stats to dynamically manage memory behavior? Less page locality fetch less contiguous pages at once Recurring reference with high reuse distance launder less
aggressively
Targets Exec time & Energy
Indicator Action Effect
James Donald -

Canturk Isci - Margaret Martonosi25
Phase Analysis – Challenges on Real-Systems
Platform P4, No SMT, 256K Mem, Linux 2.4.7-10
SPEC2K is designed to fit in 256K Choose High Memory Benchmarks + Multiprogramming
Multiprogramming combinations of these leads to lots of thrashing
Benchmark Real exec. Time [s] Unused Mem [MB] MAX Power [W]AVE Power [W] Total Energy [J]gzip_source 63.3 3.1 58.6 47.5 3257.4gap_ref 215.7 3.2 58.1 50.8 11049.2bzip2_source 140.5 4.1 54.1 46.6 6418.3wupwise_ref 334.7 10.8 52.5 48.6 15947.4swim_in 723.5 3.1 47.4 42.0 30527.7applu_in 699.3 13.9 48.7 44.8 31420.1apsi_ref 1062.6 3.1 49.3 42.5 45235.3NONE - ~200 ~11 ~9 -
0
1000
2000
3000
4000
5000
6000
7000
8000
gzip_gap gap_wupwise gap_bzip2 wupwise_applu wupwise_swim applu_apsi
Sw
ap
Ba
nd
wid
th [
KB
/s]
Swap Out Rate(KB/s)Swap In Rate(KB/s)

Canturk Isci - Margaret Martonosi27
Phase Analysis – Challenges on Real-Systems
Action Effect Non-intrusive tuning possibilities:
Kswapd:tries_base
Max # of pages swapout daemon tries to free at once
Kswapd:swap_cluster
# of pages swapout daemon writes at once
Page-cluster:
Log2(# of contiguous pages) kernel reads at once at a page fault
Intrusive tuning possibilities: Page scanning period (Overhead if tasks fit in Mem)
Page age counters (reuse vs. pollution)
Inactive-Clean Percentage (balance I/O and Mem demand)
Task memory allocation (Workload dependent Mem demand)
Indicator Action Effect
James Donald -

Canturk Isci - Margaret Martonosi28
Phase Analysis – Challenges on Real-Systems
Non-intrusive Results
Gzip: gzip + gzip + gzip
Gap: gap + gzip
Bzip2: bzip2 + bzip2
Tries_base and swap_cluster have no visible effect
Page-cluster shows ~7% improvement wrt default
James Donald -
Tuning the kswapd:tries_base Parameter
00:00.0
01:00.0
02:00.0
03:00.0
04:00.0
05:00.0
06:00.0
07:00.0
08:00.0
09:00.0
64 128 256 384 512 768 1024
tries_base (pages)
Ru
nti
me
gzip
gap
bzip2
Tuning the kswapd:swap_cluster
00:00.0
01:00.0
02:00.0
03:00.0
04:00.0
05:00.0
06:00.0
07:00.0
08:00.0
09:00.0
2 4 6 8 12 16 32
swap_cluster (pages)
Ru
nti
me
gzip
gap
bzip2
Tuning the page-cluster Parameter
00:00.0
01:00.0
02:00.0
03:00.0
04:00.005:00.0
06:00.0
07:00.0
08:00.0
09:00.0
1 2 3 4 5 6 7 8
page-cluster (exponent)
Ru
nti
me
gzip
gap
bzip2

Canturk Isci - Margaret Martonosi29
Phase Analysis – Challenges on Real-Systems
Conclusions and Todos Multiprogramming involving thrashing has a lot of potential for
improvement for performance/power
Experimented cases don’t show promising actions
Intrusive actions may be more useful leading to effective actions as well as better (per task) tracking
NEXT STEPS: Looking into mm for potential dynamic tunings
Defining indicators tracking relevant behavior
Page miss ratio / Swap rates / Bus Utilization
Q: Is There any Potential?
James Donald -
Canturk Isci - Margaret Martonosi30
Phase Analysis – Challenges on Real-Systems
Tomorrow! Phase detection on real systems:
Variability effects and potentials for repeatability
Virtual memory behavior – Tuning Initial results
What’s going on? BBVs – PMCs – PVs… and POWER
Simple metric prediction studies Short term vs. long term

Canturk Isci - Margaret Martonosi31
Phase Analysis – Challenges on Real-Systems
Comparing Phase Methods for Power
All lead to different interesting characterizations
How do these compare in terms of power representation? Is there a dominant method or does a (hierarchical)
combination work better? We specifically look at BBVs & PMC-Power Vectors
Similarity Based On:
Metrics(IPC, EPI, etc)
Hardware Performance
Vectors
BBVs, Working
SetsProcedures Branches
Sampling Quanta:
Code/Time/Energy intervals
From Performance Monitoring Counters
From Sampled PC Traces
Canturk Isci - Margaret Martonosi32
Phase Analysis – Challenges on Real-Systems
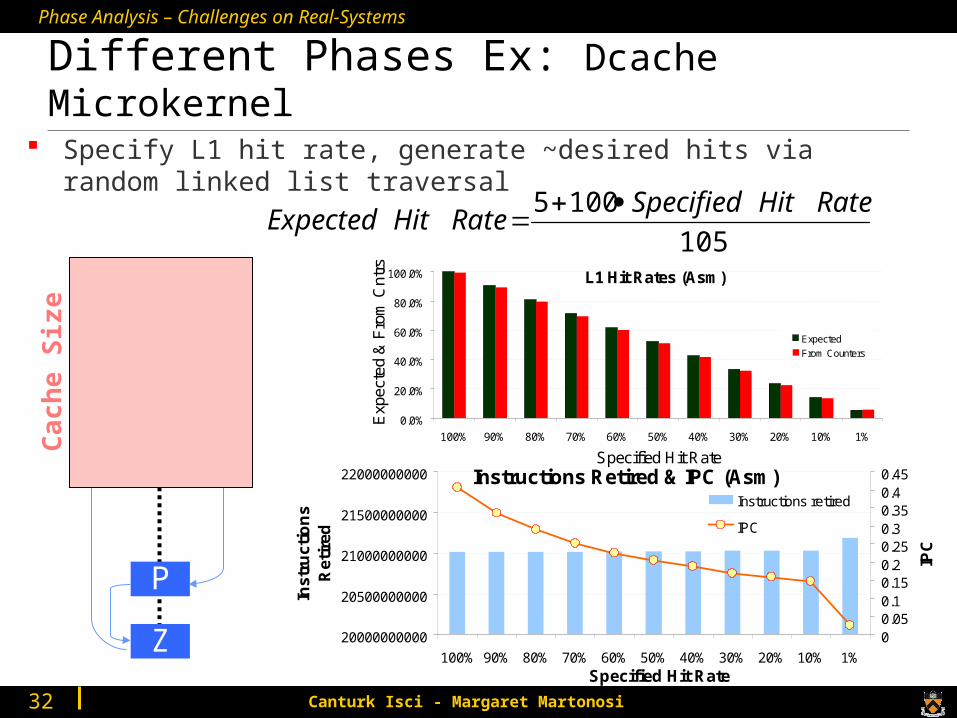
L1 Hit Rates (Asm)
0.0%
20.0%
40.0%
60.0%
80.0%
100.0%
100% 90% 80% 70% 60% 50% 40% 30% 20% 10% 1%
Specified Hit Rate
Exp
ecte
d &
Fro
m C
ntrs
Expected
From Counters
Different Phases Ex: Dcache Microkernel Specify L1 hit rate, generate ~desired hits via random linked
list traversal
105
1005 RateHitSpecifiedRateHitExpected
A
C
M
P
Z
Cach
e S
ize
Instructions Retired & IPC (Asm)
20000000000
20500000000
21000000000
21500000000
22000000000
100% 90% 80% 70% 60% 50% 40% 30% 20% 10% 1%Specified Hit Rate
Inst
ruct
ion
s R
etir
ed
00.050.10.150.20.250.30.350.40.45
IPC
Instructions retired
IPC

Canturk Isci - Margaret Martonosi33
Phase Analysis – Challenges on Real-Systems
Dcache Performance Traces
Each hit rate range is obvious Trends NOT identical across metrics:
Linear L1 misses vs. Nonlinear IPC
FOR A SINGLE METRIC: How you capture phases depends on metric and chosen threshold
Performance Metrics
0
0.1
0.2
0.3
0.4
0.5
0.6
0.7
0.8
0.9
1
0 200000 400000 600000 800000 1000000 1200000
Time [ms]
L1 M
iss R
ate
0
0.05
0.1
0.15
0.2
0.25
0.3
0.35
0.4
0.45
0.5
IPC
L1 Miss Rate IPC
Canturk Isci - Margaret Martonosi34
Phase Analysis – Challenges on Real-Systems
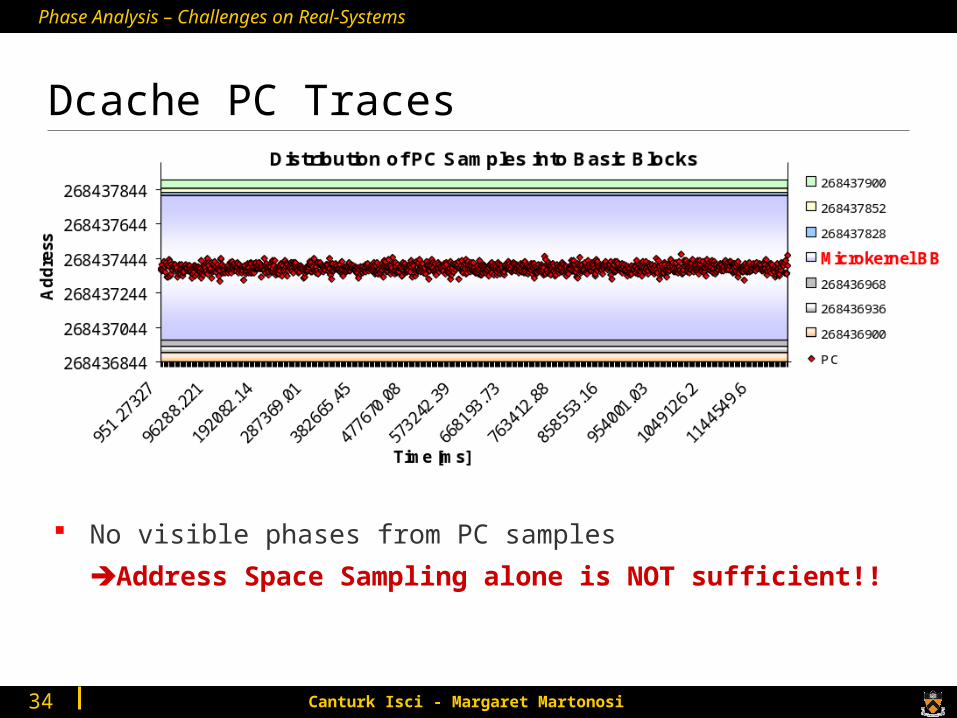
Dcache PC Traces
No visible phases from PC samples
Address Space Sampling alone is NOT sufficient!!

Canturk Isci - Margaret Martonosi35
Phase Analysis – Challenges on Real-Systems
Experiment Setup PIN kit 1795 3 level Trace instrumentation
~Every user trace: Conditional inlined trace count Every 50-200K Trace call: Sample EIP Every 5-20M Trace call:
Generate BBV & Collect PMCs & Read PWR history Constraint: Instrumentation should not overwhelm Power variations!!
BBV Generation: Sample BBL heads hash into 32 dimensions (based on Jenkins)
PMC Reading: Single rotation subset Sample via ‘popen’s due to platform conflicts
Power Reading: Read from serial device buffer No polling possible disable device at major instrumentation & exhaust
buffer
Canturk Isci - Margaret Martonosi36
Phase Analysis – Challenges on Real-Systems
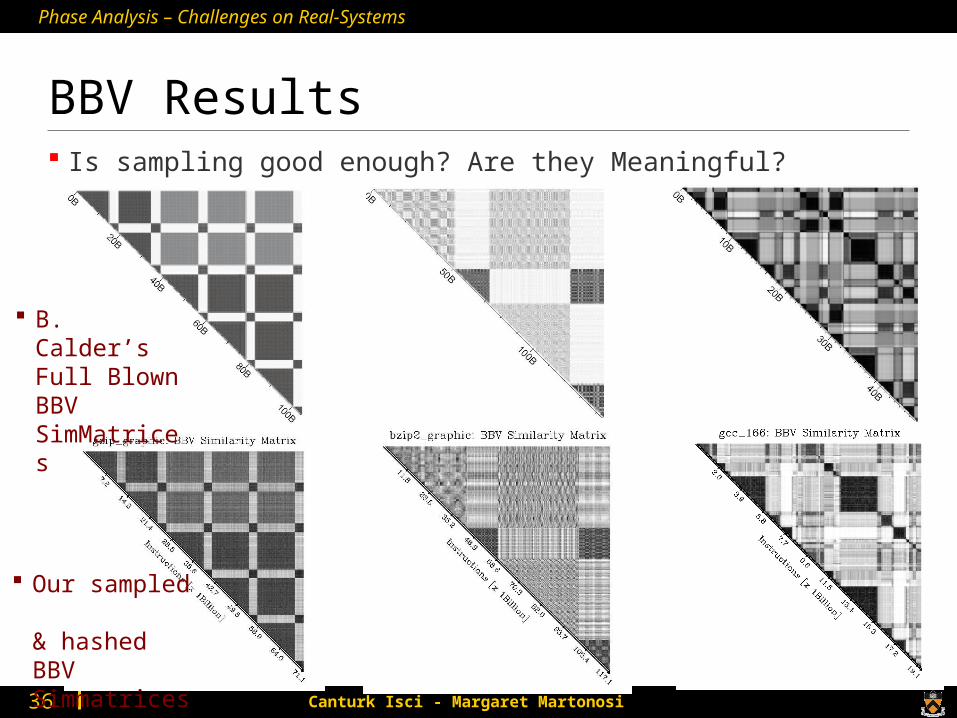
BBV Results Is sampling good enough? Are they Meaningful?
B. Calder’s Full Blown BBV SimMatrices
Our sampled & hashed BBV Simmatrices

Canturk Isci - Margaret Martonosi37
Phase Analysis – Challenges on Real-Systems
Power Results Do we still have the hook on power variability?
0
10
20
30
40
50
60
0 100 200 300 400
Po
wer
[W
]
0
10
20
30
40
50
60
319 369 419 469 519
time (s)
Po
wer
[W
]
Native From PIN
Native From PIN

Canturk Isci - Margaret Martonosi38
Phase Analysis – Challenges on Real-Systems
Currently… Still need to verify benchmarks for power and validity
Constructing power vectors with the reduced set
Applying symmetric phase analyses to BBVs and PMCs
Power representation of phases wrt measurements
90-10 Prediction with regression trees
Canturk Isci - Margaret Martonosi39
Phase Analysis – Challenges on Real-Systems
Today! Phase detection on real systems:
Variability effects and potentials for repeatability
Virtual memory behavior – Tuning Initial results
What’s going on? BBVs – PMCs – PVs… and POWER
Simple metric prediction studies Short term vs. long term
Canturk Isci - Margaret Martonosi40
Phase Analysis – Challenges on Real-Systems
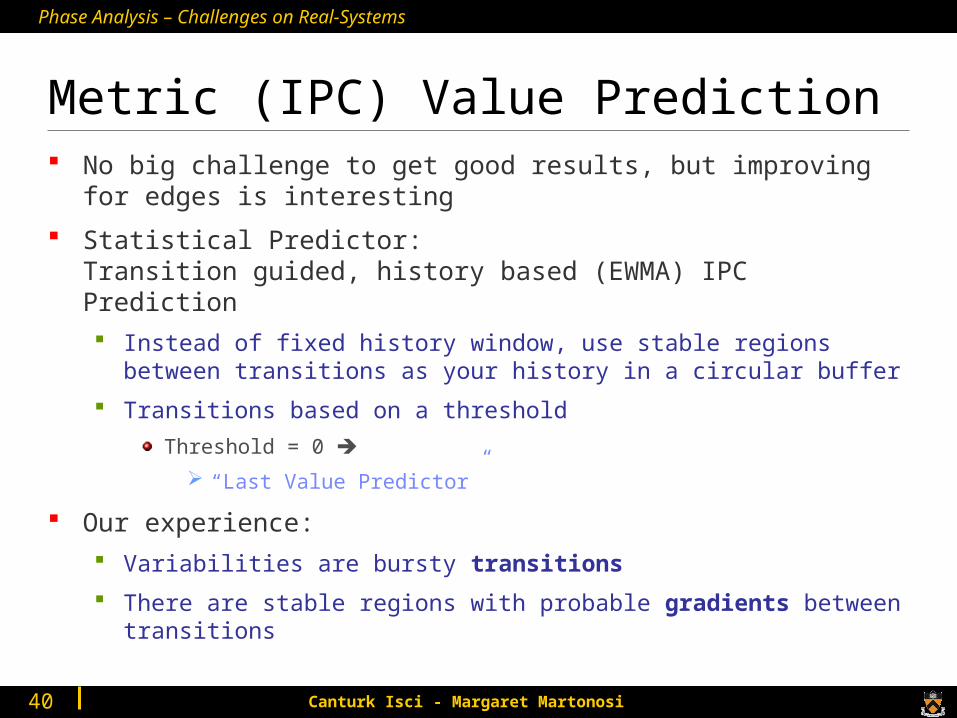
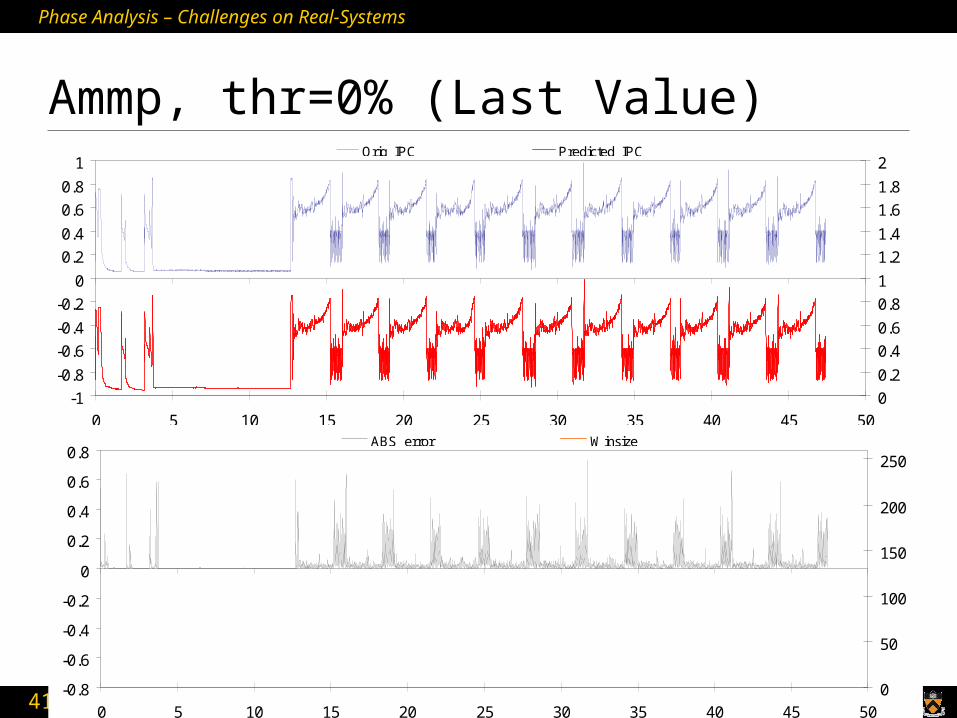
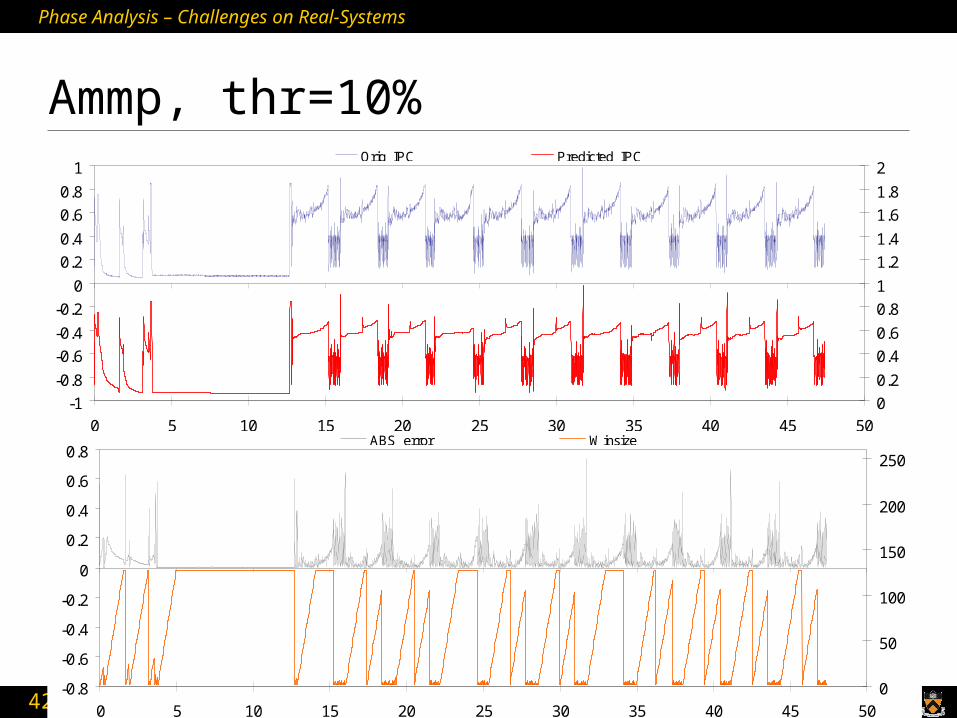
Metric (IPC) Value Prediction No big challenge to get good results, but improving for edges
is interesting
Statistical Predictor:Transition guided, history based (EWMA) IPC Prediction Instead of fixed history window, use stable regions between
transitions as your history in a circular buffer
Transitions based on a threshold
Threshold = 0 “Last Value Predictor”
Our experience: Variabilities are bursty transitions
There are stable regions with probable gradients between transitions
Canturk Isci - Margaret Martonosi41
Phase Analysis – Challenges on Real-Systems
Ammp, thr=0% (Last Value)
-0.8
-0.6
-0.4
-0.2
0
0.2
0.4
0.6
0.8
0
50
100
150
200
250
0 5 10 15 20 25 30 35 40 45 50
ABS_error Winsize
-1
-0.8
-0.6
-0.4
-0.2
0
0.2
0.4
0.6
0.8
1
0
0.2
0.4
0.6
0.8
1
1.2
1.4
1.6
1.8
2
0 5 10 15 20 25 30 35 40 45 50
Orig_IPC Predicted_IPC
Canturk Isci - Margaret Martonosi42
Phase Analysis – Challenges on Real-Systems
-1
-0.8
-0.6
-0.4
-0.2
0
0.2
0.4
0.6
0.8
1
0
0.2
0.4
0.6
0.8
1
1.2
1.4
1.6
1.8
2
0 5 10 15 20 25 30 35 40 45 50
Orig_IPC Predicted_IPC
-0.8
-0.6
-0.4
-0.2
0
0.2
0.4
0.6
0.8
0
50
100
150
200
250
0 5 10 15 20 25 30 35 40 45 50
ABS_error Winsize
Ammp, thr=10%

Canturk Isci - Margaret Martonosi43
Phase Analysis – Challenges on Real-Systems
Using Stability Considerations (8) in IPC Pred-ns
-1
-0.8
-0.6
-0.4
-0.2
0
0.2
0.4
0.6
0.8
1
0
0.1
0.2
0.3
0.4
0.5
0.6
0.7
0.8
0 5 10 15 20 25 30 35 40 45 50Time [s]
Orig_IPC Predicted_IPC ABS_error
-1
-0.8
-0.6
-0.4
-0.2
0
0.2
0.4
0.6
0.8
1
0
0.1
0.2
0.3
0.4
0.5
0.6
0.7
0.8
0 5 10 15 20 25 30 35 40 45 50Time [s]

Canturk Isci - Margaret Martonosi44
Phase Analysis – Challenges on Real-Systems
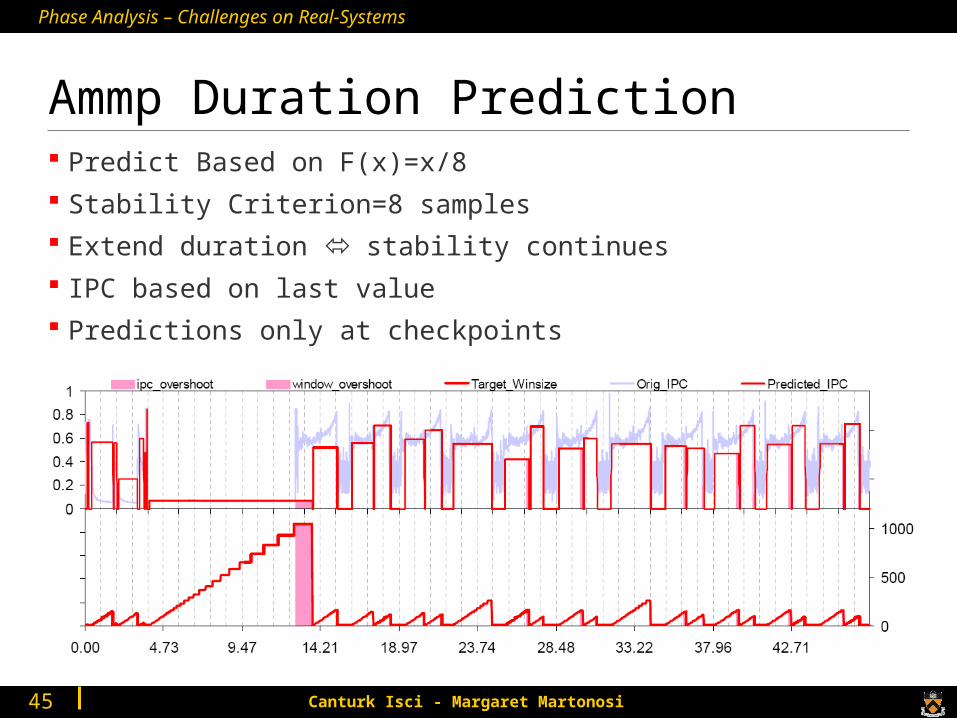
Predicting Durations X=f(x) approach:
F(x) = x, x/2, x/8, … Initial Stability requirement: 2,8,…
Table based? Idea was:
At each transition: predict once for duration based on history: Log(prev_duration) = key val-s [0,1,2,3,4,5]
History: |5|3|5|3|5| 3 |1|3|5|1|3| 5
- need to filter bursts somehow- Partial matchings??
NOT EXPLORED!!
Canturk Isci - Margaret Martonosi45
Phase Analysis – Challenges on Real-Systems
Ammp Duration Prediction Predict Based on F(x)=x/8 Stability Criterion=8 samples Extend duration stability continues IPC based on last value Predictions only at checkpoints
Canturk Isci - Margaret Martonosi46
Phase Analysis – Challenges on Real-Systems
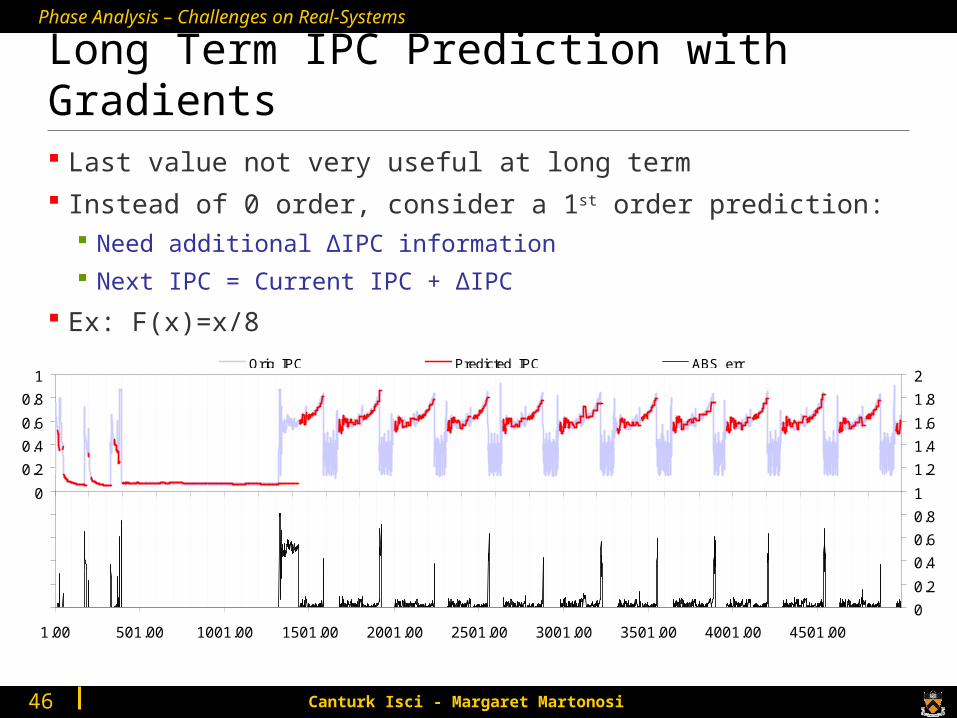
Long Term IPC Prediction with Gradients Last value not very useful at long term Instead of 0 order, consider a 1st order prediction:
Need additional ΔIPC information Next IPC = Current IPC + ΔIPC
Ex: F(x)=x/8
-1
-0.8
-0.6
-0.4
-0.2
0
0.2
0.4
0.6
0.8
1
0
0.2
0.4
0.6
0.8
1
1.2
1.4
1.6
1.8
2
1.00 501.00 1001.00 1501.00 2001.00 2501.00 3001.00 3501.00 4001.00 4501.00
Orig_IPC Predicted_IPC ABS_err
Canturk Isci - Margaret Martonosi47
Phase Analysis – Challenges on Real-Systems
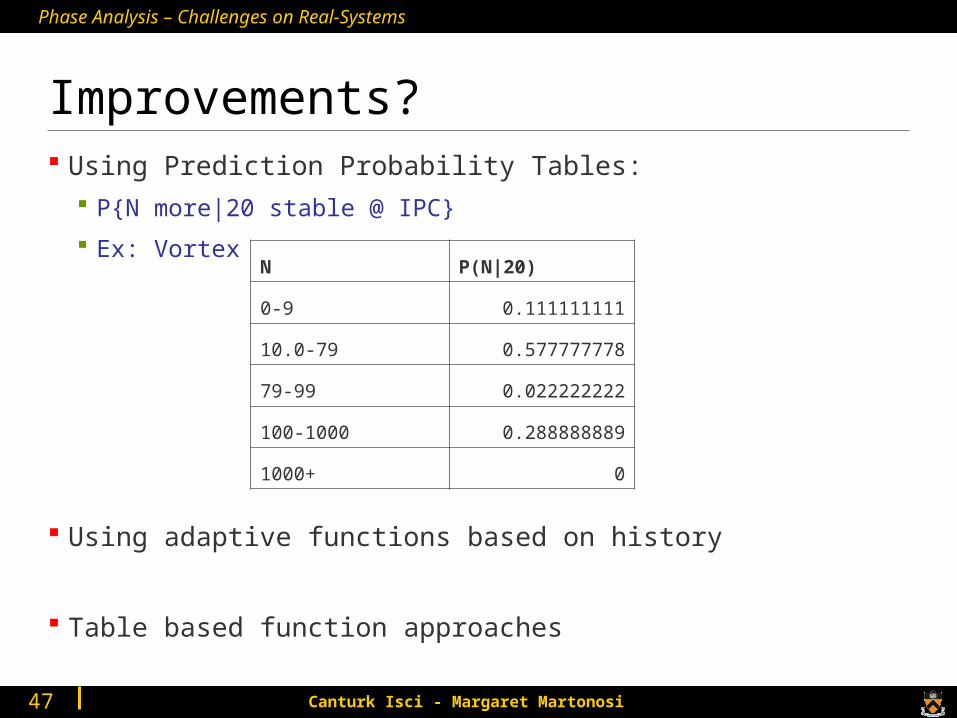
Improvements? Using Prediction Probability Tables:
P{N more|20 stable @ IPC}
Ex: Vortex
Using adaptive functions based on history
Table based function approaches
N P(N|20)
0-9 0.111111111
10.0-79 0.577777778
79-99 0.022222222
100-1000 0.288888889
1000+ 0