Parametric versus nonparametrics: two alternative … · This article compares parametric and non...
9
437 J. Rojo (ed.), Selected Works of E. L. Lehmann, Selected Works in Probability and Statistics, DOI 10.1007/978-1-4614-1412-4_38, © Springer Science+Business Media, LLC 2012 Journal of Nonparametric Statistics Vol. 21 , No.4, May 2009, 397-405 C\ Taylor&Francis Parametric versus nonparametrics: two alternative methodologies Erich L. Lehmann* Department of Statistics, University of California, Berkeley, CA 94720, USA (Received 17 July 2008; final version received 8 October 2008) This article compares parametric and non parametric approaches to statistical inference. It considers their advantages and disadvantages, and their areas of applicability. Although there is no clear comprehensive conclusion, the article finds that in simple problems in which Wilcoxon type tests and estimators apply, they may be recommended as the methods of choice. Keywords: Wilcoxon t and F tests; least squares; robustness; adaptation 1. Introduction The comparison of parametric and nonparametric approaches is a huge subject, and here, the author considers only how it applies to the unpaired comparison of two treatments. However, very similar results apply to paired comparisons, some analysis of variance problems, regression and independence. The standard model for the comparison of two treatments assumes that N = m + n subjects are drawn at random from some population of subjects and that, of these, m are assigned to treatment A (for example, control) and n to treatment B (for example, a new treatment). The control responses X 1, •• . , Xm are assumed to be i.i.d. according to a distribution F, and the treatment responses Y1, • •• , Yn according to G. The hypothesis to be tested is H : G = F, no treatment effect. A general class of alternatives specifies that the Y s are stochastically larger than the X s. A special case is the shift model G(y) = F(y- D.) , D. > 0 This model seems rather special, but is much more general than the usual normal model and will be assumed throughout this paper. *Email: shaffer @stat.berkely.edu ISSN 1048-5252 print/ISSN 1029-0311 online © 2009 Taylor & Francis DOl: 10.1080/ 10485250902842727 http: // www.informaworld.com
Transcript of Parametric versus nonparametrics: two alternative … · This article compares parametric and non...
437J. Rojo (ed.), Selected Works of E. L. Lehmann, Selected Works in Probability and Statistics, DOI 10.1007/978-1-4614-1412-4_38, © Springer Science+Business Media, LLC 2012
Journal of Nonparametric Statistics Vol. 21 , No.4, May 2009, 397-405
C\ Taylor&Francis ~ Ta~or&Franos Group
Parametric versus nonparametrics: two alternative methodologies
Erich L. Lehmann*
Department of Statistics, University of California, Berkeley, CA 94720, USA
(Received 17 July 2008; final version received 8 October 2008)
This article compares parametric and non parametric approaches to statistical inference. It considers their advantages and disadvantages, and their areas of applicability. Although there is no clear comprehensive conclusion, the article finds that in simple problems in which Wilcoxon type tests and estimators apply, they may be recommended as the methods of choice.
Keywords : Wilcoxon t and F tests; least squares; robustness ; adaptation
1. Introduction
The comparison of parametric and nonparametric approaches is a huge subject, and here, the author considers only how it applies to the unpaired comparison of two treatments. However, very similar results apply to paired comparisons, some analysis of variance problems, regression and independence.
The standard model for the comparison of two treatments assumes that N = m + n subjects are drawn at random from some population of subjects and that, of these, m are assigned to treatment A (for example, control) and n to treatment B (for example, a new treatment) .
The control responses X 1, •• . , Xm are assumed to be i.i.d. according to a distribution F, and the treatment responses Y1, • •• , Yn according to G. The hypothesis to be tested is
H : G = F, no treatment effect.
A general class of alternatives specifies that the Y s are stochastically larger than the X s. A special case is the shift model
G(y) = F(y- D.) , D. > 0
This model seems rather special, but is much more general than the usual normal model and will be assumed throughout this paper.
*Email: shaffer @stat.berkely.edu
ISSN 1048-5252 print/ISSN 1029-0311 online © 2009 Taylor & Francis DOl: 10.1080/ 10485250902842727 http: //www.informaworld.com

438
E.L. Lehmann
2. Four tests
The two approaches, parametric and nonparametric, will be compared in terms of the following four tests:
(i) The classical t-test : This test rejects when t > tcr, where t denotes the two-sample t-statistic and tcr is the upper a-critical value of the t-distribution with m + n - 2 degrees of freedom.
(ii) The Permutation t-test (t*) : Given them + n responses
(ZI, · · ·, ZN) = (XI, · · ·, Xm; Yl , · · · , Yn) ,
the statistic t can take on e) equally likely values corresponding to the possible assignments
of the zs to xs and ys . If a = K I(~) , the (t*)-test rejects H for the K largest of these values.
The other two tests are rank tests. The N observations are ranked from 1 (the smallest) to N (the largest). Let S1, ... , Sn denote the ranks of the Y s.
(i) The Wilcoxon test (W) [1]: This test rejects when
S1 + ... + Sn >C.
(ii) The Normal Scores test (NS) [2]: This test rejects when
where
is the expected value of the Sth smallest of N independent N (0, 1) variables.
3. Validity of the tests
(i) The t-test is exactly valid only under the additional assumption that the common null distribution F of the X s and Y s is normal 1. It was this dependence on the assumption of normality that first aroused interest in permutation and rank tests.
(i i )-(i v) The otherthree tests, and in fact all permutation and rank tests, are valid if X 1, .. • , Xm ; Y1 , • •• , Yn are i.i .d. according to any continuous distribution F.
From this point of view, the t -test is at a disadvantage, while there is no difference between the other three. The Wilcoxon test became popular (particularly in the social sciences) because of its independence from the normality assumption and its simplicity. However, there was a concern that the test would be very inefficient because it replaced the original values by their ranks, thereby di scarding a lot of information.
4. Asymptotic relative efficiency
To assess the extent of this loss of efficiency, Pitman in 194 7 and 1948, in courses at Chapel Hill and Columbia, introduced the concept of asymptotic relative efficiency (ARE). His approach was first published by Noether in 1950, who also extended it in 1955 [3,4].

439
Journal of Nonparametric Statistics
Definition of ARE Let n 1, n2 be the numbers of observations required by two tests to achieve the same results (i.e., same level and power). Then
ARE= e1.2 =lim(:~) as n 1, n2 --+ oo.
In our applications, the test statistics are asymptotically normal, and the ARE is inversely proportional to the ratio of the asymptotic variances.
5. ARE of t• to t
Assuming that one is dealing with two independent samples, the asymptotic normality of t is obvious; that oft* was first proved by Wald and Wolfowitz [5], and under more general conditions by Noether [6]. Hoeffding [7,8] and Hajek [9,IO]. It follows from that work that
e,. ,r (F) = I for essentially all F.
In fact, the two tests reject when respectively
t > ta and t > r;, where r; is random, and
Thus, except for small n 1, n2, there is a very little difference between the tests.
6. ARE of Wilcoxon and normal scores to t
Pitman obtained a general formula for ew,1 (F) in the shift model and calculated it for the normal case. He found that
3 ew,t(N) =- = 0.955.
rr
This was very surprising since it showed that W is nearly as powerful as t in the situations for which t was designed and in which it is optimal.
Pitman's formula was
ew. 1(F) = I2a 2 (/ f 2 r, where a 2 is the variance ofF and f is density. From this, the ARE can be calculated for special cases, for example
F Logistic Double exponential Uniform Exponential
1.097 1.5 1.0 3.0
Furthermore, it is easily seen that ew,1 (F) can be oo. On the other hand, it was shown by Hodges and Lehmann [II] that for all F
ew,r (F) ~ 0.864.
Thus Wilcoxon can be infinitely more efficient than t but never much less efficient.

440
E.L. Lehmann
Hodges and Lehmann conjectured that the situation was even more favorable for the NS relative to the t-test, namely that
eNs,r(F) ~ 1 for all F,
with equality holding only when F is normal. This was proved by Chernoff and Savage [12], and by Gastwirth and Wolff [13].
7. ARE of Wilcoxon to normal scores
With Wilcoxon and NS, both being serious competitors oft, it is of interest to me to compare these two tests directly. Such a comparison was provided by Hodges and Lehmann [14]. The following are some values of ew,Ns(F):
Uniform Normal Logistic Double exponential Cauchy
0 0.955 1.05 1.18 1.41
A sharp upper bound is 6/rr = 1.91. The general conclusion is N S tends to be better for short-tailed distributions, and W for long
tailed ones. Some theoretical support for this conclusion is provided by Van Zwet [15].
8. Estimation
Comparisons have so far been made in terms of the power of the tests and have proved surprisingly favorable to the rank tests. However, the t-test also has an advantage. It is closely related to the associated point and interval estimates; Wilcoxon and NS are just tests. However, a similar development is possible for rank-based methods in the shift model G(y) = F(y- ~).
By the Neyman theory, tests, for ~ can be converted into confidence sets for ~. These are simply the set of parameter values of ~o for which H : ~ = ~o is accepted. This construction was worked out by Lincoln Moses (in Walker and Lev [16], and some theory developed by Lehmann [ 17]).
A method for deriving point estimates of ~ from rank tests was given by Hodges and Lehmann [17]. Both the resulting point and interval estimates share the AREs (relative to the normal theory methods) of the associated rank tests.
In the Wilcoxon case, all three (tests (in the Mann-Whitney form), point estimates and confidence intervals) are based on the quantiles of them+ n differences Yj - X; and form a cohesive whole like the classical normal methods.
9. Comparison of the four tests
On the basis of the AREs one might make the following recommendations.
(i) If firmly convinced of normality (without gross errors), the t-test is best. (ii) If fairly confident of normality, but want an insurance policy, t* seems a good solution.
(iii) If the tails ofF are believed to be as short as or shorter than those of the normal, the NS test offers the greatest advantage.
441
Journal of Nonparametric Statistics
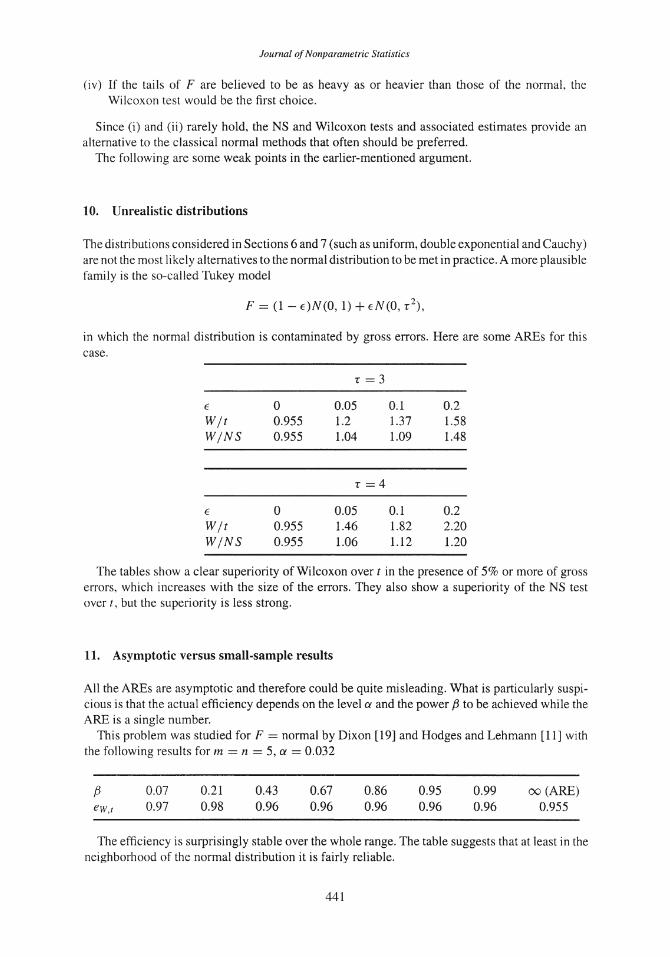
(iv) If the tails of F are believed to be as heavy as or heavier than those of the normal, the Wilcoxon test would be the first choice.
Since (i) and (ii) rarely hold, the NS and Wilcoxon tests and associated estimates provide an alternative to the classical normal methods that often should be preferred.
The following are some weak points in the earlier-mentioned argument.
10. Unrealistic distributions
The distributions considered in Sections 6 and 7 (such as uniform, double exponential and Cauchy) are not the most likely alternatives to the normal distribution to be met in practice. A more plausible family is the so-called Tukey model
F = (1- E)N(O, 1) + EN(O, r 2),
in which the normal distribution is contaminated by gross errors. Here are some AREs for this case.
r=3
€ 0 0.05 0.1 0.2 Wjt 0.955 1.2 1.37 1.58 WjNS 0.955 1.04 1.09 1.48
r=4
€ 0 0.05 0.1 0.2 Wjt 0.955 1.46 1.82 2.20 WjNS 0.955 1.06 1.12 1.20
The tables show a clear superiority of Wilcoxon overt in the presence of 5% or more of gross errors, which increases with the size of the errors. They also show a superiority of the NS test over t, but the superiority is less strong.
11. Asymptotic versus small-sample results
All the AREs are asymptotic and therefore could be quite misleading. What is particularly suspicious is that the actual efficiency depends on the level a and the power f3 to be achieved while the ARE is a single number.
This problem was studied for F = normal by Dixon [ 19] and Hodges and Lehmann [ 11] with the following results form = n = 5, a = 0.032
f3 ew,t
0.07 0.97
0.21 0.98
0.43 0.96
0.67 0.96
0.86 0.96
0.95 0.96
0.99 0.96
oo (ARE) 0.955
The efficiency is surprisingly stable over the whole range. The table suggests that at least in the neighborhood of the normal distribution it is fairly reliable.

442
E.L. Lehmann
12. Sampling versus randomisation
The ARE results were recently attacked as irrelevant to most experimental work by Ludbrook and Dudley [20] since they assume that the observations are samples from a population. These authors point out that most medical research is based on randomisation rather than on sampling. This process is represented by a randomisation model in which the N subjects are considered as fixed. Randomness then enters only through the random assignment of subjects, m to control and n to treatment.
For rank tests the null distribution is the same for the sampling and randomisation models. For permutation tests, the randomisation distribution coincides with the conditional distribution (given the subjects) of the sampling situation. The null distribution is therefore the same in both cases. The difference comes in when considering power, but the issue is deeper. It arises from the fact that in the randomisation case any inference applies only to the subjects at hand, and it cannot be generalised to other subjects.
Ludbrook and Dudley [21] admit this drawback but state:
'This needs not deter ex perimeters from inferring that their results are applicable to similar patients, ... though their argument must be verbal rather than statistical.'
Unfortunately, verbal arguments are not enough for power comparisons. However, the reference to similar patients suggests that (and, in fact, is meaningful only if) these patients form a population from which the subjects can be considered to be (at least approximately) a random sample. Only with such an assumption can the inference be extended to this population.
Such an assumption is clearly less reliable than randomisation. The theory therefore involves two stages.
1. Rely on randomisation to control the level. 2. Use the sampling model for choice of test.
For the second stage, it is not necessary to know the population F in detail, but only roughly (e.g., heavy tails).
Note that in any case, a choice has to be made, and for making this it is good to receive some guidance from statistical theory.
13. Using more than one test
The problem so far has been which of the many tests to use. However, the availability of several tests also opens up other possibilities, both for misuse and for improvement.
(i) Misuse: When considering two tests, say t and Wilcoxon, it is tempting to carry out both at level a (e.g. 5%) but report only the more significant. This is, of course, not legitimate since the level of the resulting test is no longer a. The true level a* that depends on F has been studied by Jiang [22]. The following is a numerical example for large sample sizes, when the tests used are Wand t and a = 0.05.
F Normal Double exponential t3 Sharp upper bound
a* 0.059 0.066 0.074 0.097
Thus the increase in a is not negligible. Examples in which two tests are used are given in Gastwirth [23, Chapter 11] .

443
Journal of Nonparametric Statistics
(ii) Improvement through adaptation: If we decide to use the Wilcoxon or NS test because we believe F to be heavy or light tailed respectively, we would have made a poor choice if our belief was mistaken. This difficulty can be avoided by letting the data guide us in our choice. Such an approach was suggested by Hajek [24,25] and further elaborated by Hogg [26,36] .
To be specific, letS be a selection criteria (e.g. the coefficient of kurtosis) with high or low values, indicating heavy or short tails. We shall use W when Sis large, N S when Sis small (both at level a). If S is a symmetric function of the N variables (X 1, .•• , X m; Y1, ••• , Yn) , it is independent of the ranks and the combined test has level a.
Simulation studies indicate the excellent performance of such a procedure over a broad spectrum of distributions.
14. Full adaptation
Full adaptation is in the same spirit as the partially adaptive procedures in that it uses the data to adapt the procedure to the unknown F. But it is much more ambitious because it attempts to determine the best test not among a finite number of tests (e.g. Wilcoxon and NS) but among all tests . That this may be possible was first proposed by Stein [27].
Let us assume a shift model as before. Stein's procedure consists of two steps:
(i) Estimate the unknown density f by a suitable density estimate j. (ii) Perform the test that would be optimal if j were the true density.
Then it is hoped that the resulting test will be asymptotically efficient for all f, i.e. have ARE = 1 relative to the best test when f is true, whatever f may be.
A rigorous proof of such a result was given by Hajek [10]. However, he added that it is 'of little use in practice because of slow convergence' (i.e. because it requires very large sample sizes before the asymptotic results apply).
Stein-type adaptation has been much more fully explored for estimation than for testing. Stone [28] surprisingly found excellent results even for n = 40. A general theory of adaptive estimation was developed by Bickel [29] and by Bickel et al. [30], whose conditions are given, under which full adaptation is possible. The corresponding problems for testing constitute an open area for research.
15. Extension
As mentioned in Section 1, the results discussed here apply to other simple situations, e.g. s-sample problems, simple linear regression, the measurement and testing of dependence. They do, however, not apply to more complex situations as linear models with interactions and multivariate problems. This obviously limits their usefulness.
16. The advantage of simplicity
In the simple situations in which they do apply, Wilcoxon-type (but not NS) methods have the
advantage of great simplicity and ease of interpretation. This is of particular importance for the many nonstatisticians who in their work apply such methods and for the introductory courses in which they learn about them. This fact was stressed by Noether [31] who compared the difficulty

444
E.L. Lehmann
of interpreting the sample correlation coefficient r with the simple interpretations of Kendall's rank correlation in terms of concordant and discordant pairs.
Noether implemented his ideas in an elementary text [32] in which for every problem he discusses first a Wilcoxon-type test with associated point and interval estimation, and follows it with the corresponding normal theory.
17. Conclusions
The issue of parametric versus nonparametric inference is too complex to permit neat, comprehenive conclusions, but here are a few concluding comments.
Least squares estimation (Legendre, Gauss) and the associated normal theory tests of Fisher have for a long time been, and still are, the standard. They are convenient and we have gotten used to them. However, we also know that they suffer from a defect: They are too strongly influenced by outlying observations. In testing, this results in low power.
Under the headings of robust and non parametric inference, many modifications and alternatives have been developed to eliminate or to diminish this effect [33]. In general there is no clear winner.
For simple problems to which Wilcoxon-type tests and estimators apply, I agree with Noether that they have much to recommend them as the methods of choice.
Acknowledgements
The author thanks Ralph D' Agostino and his committee for inviting him to give the 2000 Noether Lecture on which this work is based, and three referees for many helpful comments.
Note
I. The t-test is however asymptotically distribution-free. [34,35].
References
[I] F. Wilcoxon, Individual comparisons by ranking methods, Biometrics I (1945), pp. 80-83. [2] R.A. Fisher and F. Yates, Statistical Tables for Biological, Agricultural, and Medical Research (Table XX) , Oliver
and Boyd, London, 1938. [3] G.E. Noether, Asymptotic properties of the Wald-Wolfowitz test of randomness, Amer. Math. Statist. 21 (1950),
pp. 231-246. [ 4] G.E. Noether, On a theorem of Pitman, Ann. Math. Statist. 26 ( 1955), pp. 6~8. [5] A. Wald, and J. Wolfowitz, Statistical tests ba.~ed on permutations (){the observations, Ann. Math. Statistics 15
( 1944 ), pp. 358- 372. [6] G.E. Noether, On a theorem by Wald and Wolfowitz , Ann. Math. Statist. 20 ( 1949), pp. 455-458. [7] W. Hoeffding, A combinatorial centra/limit theorem, Ann. Math. Statist. 22 ( 1951 ), pp. 558-566. [8] W. Hoeffding, The large-sample power of tests based on permutations, Ann. Math. Statist. 23 (1952), pp. 169-192. [9] J. Hajek, Some extensions of the Wald-Wolfowitz-Noether theorem, Ann. Math. Statist. 32 ( 1961 ), pp. 506-523.
[10] J. Hajek, Asymptotically most powerful rank order tests, Ann. Math. Statist. 33 (1962), pp. 1124-1147. [II] J .L. Hodges, Jr. and E.L. Lehmann, The efficiency (){some nonparametric competitors (){the t-test, Ann. Math.
Statist. 27 (1956), pp. 274-335. f 12] H. Chernoff and l.R. Savage, Asymptotic normality and efficiency of certain nonparametric te.w statistics, Ann. Math.
Statist. 29 ( 1958), pp. 972-994. [ 13] J.L. Gastwirth and S. Wolff, An elementary method for obtaining lower bound;· on the asymptotic power(){ rank
tests, Ann. Math . Statist. 39 (1968), pp. 2128-2130. [14] J.L. Hodges, Jr. and E.L. Lehmann, Comparison of the Normal Scores and Wilcoxon Tests, Proceedings of the 4th
Berkeley Symposium on Mathematical Statistics Vol. I, 1961, pp. 307-317.

445
Journal ()( Nonparametric Statistics
[ 15) W.R. Van Zwet, Convex tramformations: a new approach to skewness and kurtosis, Statist. Neerlandica 18 ( 1964}, pp.433-444.
[ 16) H.M. Walker and J. Lev, Statistical Inference, Holt, New York, 1953. [ 17] E.L. Lehmann, Nonparametric confidence intervals for a shift parameter, Ann. Statist. 33 ( 1963}, pp. 1138-1154. [18) J.L. Hodges, Jr. and E.L. Lehmann, Estimates of location based on rank tests, Ann. Math. Statist. 34 (1963},
pp. 598-611. [ 19) W.J. Dixon, Power under normality()( several nonparametric tests, Ann. Math. Statist. 25 (1954}, pp. 610-614 . [20) J. Ludbrook and H. Dudley, Response (to letters concerning Ludbrook and Dudley (1998)}, A mer. Statist. 54 (2000),
p. 87. [21] J. Ludbrook and H. Dudley, Why permutation tests are superior to t and F tests in biomedical research, Amer.
Statist. 52 (1998}, pp. 127-132. [22) J. Jiang, Sharp upper and lower bounds for asymptotic levels()( some statistical tests, Statist. Probab. Letters 35
( 1997}, pp. 395-400. [23) J.L. Gastwirth, Statistical Reasoning in Law and Public Policy, Academic Press, Boston, 1988. [24] J. Hajek, Nonparametric Statistics, Holden-Day, San Francisco, 1969. [25) J. Hajek, Miscellaneous problems of rank tests, in Nonparametric Technique~· in Statistical Inference, Puri, ed.
Cambridge University Press, 1970. [26) R. Y. Hogg and R. V. Lenth, A review ()(some adaptive statistical techniques, Comm. Statist Theory Methods. 13
(1984), pp. 1551-1579. [27) C. Stein, Efficient Nonparametric Testing and Estimation, Proceedings of the Third Berkeley Symposium
Mathematical Statistics Vol. I, pp. 187-195. [28) C.J. Stone, Adaptive maximum likelihood estimators (){a location parameter, Ann. Statist. 3 ( 1975}, pp. 267-284. [29) P.J. Bickel, On adaptive estimation, Ann. Statist. 10 (1982}, pp. 647-671. [30) P.J. Bickel, C.A.J. Klaassen, Y. Ritov, and J. Wellner, Efficient and Adaptive Estimation for Semiparametric Models,
Johns Hopkins, University Press, Baltimore, 1993. [31) G.E. Noether, The role f~(nonparametrics in introductory statistics courses, Ann. Math. Statist. 34 ( 1980), pp. 22-23. [32] G.E. Noether, Introduction to Statistics: The Nonparametric Way, Springer Verlag, New York, 1976, 1991. [33) D. Birkes andY. Dodge, Alternative Methods of Regression, Wiley, New York, 1993. [34) E.L. Lehmann, Nonparametrics: Statistical Methods Based on Ranks. Springer, New York, 2006. [35) E.L. Lehmann and J.P. Romano, Testing Statistical Hypotheses, 3rd ed. , Springer, New York, 2005. [36) R.Y. Hogg, Adaptive robust procedures, J. Amer. Statist. Assoc. 69 ( 1974), pp. 909-923.