Parametric Design and Optimization of Steel Car Deck...
51
Parametric Design and Optimization of Steel Car Deck Panel Structures Master of Science Thesis BARIS ALATAN HAMED SHAKIB Department of Shipping and Marine Technology Division of Marine Design CHALMERS UNIVERSITY OF TECHNOLOGY Gothenburg, Sweden, 2012 Report No. X-12/280
Transcript of Parametric Design and Optimization of Steel Car Deck...
Parametric Design and Optimization of Steel Car
Deck Panel Structures Master of Science Thesis
BARIS ALATAN
HAMED SHAKIB
Department of Shipping and Marine Technology
Division of Marine Design
CHALMERS UNIVERSITY OF TECHNOLOGY
Gothenburg, Sweden, 2012
Report No. X-12/280


i
A THESIS FOR THE DEGREE OF MASTER OF SCIENCE
Parametric Design and Optimization of Steel Car Deck Panel Structures
BARIS ALATAN
HAMED SHAKIB
Department of Shipping and Marine Technology
CHALMERS UNIVERSITY OF TECHNOLOGY
Gothenburg, Sweden 2012

ii
Parametric Design and Optimization of Steel Car Deck Panel Structures
BARIS ALATAN and HAMED SHAKIB
© BARIS ALATAN and HAMED SHAKIB, 2012
Report No. X-12/280
Department of Shipping and Marine Technology
Chalmers University of Technology
SE-412 96 Gothenburg
Sweden
Telephone +46 (0)31-772 1000
Printed by Chalmers Reproservice
Gothenburg, Sweden, 2012
iii
Parametric Design and Optimization of Steel Car Deck Panel Structures
BARIS ALATAN and HAMED SHAKIB
Department of Shipping and Marine Technology
Division of Marine Design
Chalmers University of Technology
Abstract
Stiffened panels play a significant role in marine industry because of their high strength-
weight ratio, they account for a significant amount of a vessel’s weight. Hence, weight
optimization of these structures can reduce the material costs and to a great extent increase the
cargo capacity of a vessel.
This thesis looks into the performance of three steel car deck panels with respect to their
weights for a Pure Car and Truck Carrier (PCTC). The focus is on the structural arrangement
rather than a comparison of steel and alternative materials, since lightweight materials are still
not economically viable for these types of ships. Two of the car deck panels have
conventional structural arrangement stiffened with longitudinal and transverse stiffeners while
the third one uses diagonally positioned beams. In order to carry out a consistent comparison,
the car deck panels are optimized by means of finite element analysis and parametric
sensitivity analysis. The panels are modelled with linear elastic materials and a global strength
analysis is made with a uniformly distributed load. Results prove the accuracy of the way that
an older car deck panel (Concept B) had been developed over time, resulting in the car deck
panel currently in use (Concept A). Results also show that the current car deck panel structure
could be developed further by utilizing the optimization techniques, reducing their weight by
up to 6%.
Keywords: car deck panel, finite element analysis, optimization, parametric sensitivity
analysis, stiffened panel structure, strength, weight.

iv

v
Preface
This thesis is a part of the requirements for the master’s degree in Naval Architecture and
Ocean Engineering at Chalmers University of Technology, Gothenburg, and has been carried
out at the Division of Marine Design, Department of Shipping and Marine Technology,
Chalmers University of Technology. The current investigation has been done as a real case
study with data from a ship owner (client) who wishes to be anonymous. For this reason,
specific data related to the client have been omitted from the report. The project was
performed in cooperation with TTS Marine AB.
We would like to acknowledge and thank our examiner and supervisor, Professor Jonas
Ringsberg at the Department of Shipping and Marine Technology and our supervisors
Thomas Falk and Peter Anderson at TTS Marine AB for their supervision.
We would also like to thank Professor Anders Ulfvarson and Luis Sánchez-Heres for their
support and assistance during the project.
Gothenburg, June, 2012
Baris Alatan and Hamed Shakib

vi
vii
Contents
Abstract --------------------------------------------------------------------------------------------------- iii
Preface ------------------------------------------------------------------------------------------------------ v
Contents --------------------------------------------------------------------------------------------------- vii
1. Introduction -------------------------------------------------------------------------------------------- 9
1.1. Background ---------------------------------------------------------------------------------------- 9
1.2. Objective ------------------------------------------------------------------------------------------ 10
1.3. Methodology -------------------------------------------------------------------------------------- 10
1.4. Limitations ---------------------------------------------------------------------------------------- 11
2. Theoretical background of goal-driven optimization ---------------------------------------- 13
2.1. Design of experiments -------------------------------------------------------------------------- 13
2.2. Response surface and parametric sensitivity------------------------------------------------- 13
2.3. Optimization -------------------------------------------------------------------------------------- 14
3. Performance criteria -------------------------------------------------------------------------------- 17
3.1. Working positions ------------------------------------------------------------------------------- 17
3.1.1. Seagoing condition (Load Case I) ---------------------------------------------------- 17
3.1.2. Stowed position (Load Case II) ------------------------------------------------------- 17
3.2. Performance criteria ----------------------------------------------------------------------------- 18
3.2.1. Deflection -------------------------------------------------------------------------------- 18
3.2.2. Stress ------------------------------------------------------------------------------------- 19
4. Reference car deck panel – Concept A ---------------------------------------------------------- 21
4.1. Description of the geometry -------------------------------------------------------------------- 21
4.2. Parameterization of the geometry -------------------------------------------------------------- 21
4.3. Boundary conditions ---------------------------------------------------------------------------- 23
4.4. Mesh creation ------------------------------------------------------------------------------------- 24
4.5. Analysis-------------------------------------------------------------------------------------------- 24
4.6. Mesh convergence ------------------------------------------------------------------------------- 25
4.7. Performance --------------------------------------------------------------------------------------- 26
4.8. Results from the parametric sensitivity analysis --------------------------------------------- 26
5. Concept B---------------------------------------------------------------------------------------------- 29
5.1. Parameterization --------------------------------------------------------------------------------- 30
5.2. Mesh creation ------------------------------------------------------------------------------------ 30
5.3. Results from parametric sensitivity analysis ------------------------------------------------- 31
6. Optimization ------------------------------------------------------------------------------------------ 33
6.1. Concept A ----------------------------------------------------------------------------------------- 33
6.2. Concept B ----------------------------------------------------------------------------------------- 34
7. Development of new concepts --------------------------------------------------------------------- 37
7.1. Development of Concept B (B-II and B-III) ------------------------------------------------- 37
7.2. Concept C ----------------------------------------------------------------------------------------- 39

viii
8. Discussion --------------------------------------------------------------------------------------------- 43
9. Conclusions ------------------------------------------------------------------------------------------- 45
10. Future work ----------------------------------------------------------------------------------------- 47
11. References ------------------------------------------------------------------------------------------- 49
9
1. Introduction
1.1. Background
Thin-walled structures are widely used in the maritime industry because they make the
structure more cost-effective by offering a desirable strength/weight ratio. Reduction in the
structural weight of ships will increase their cargo-carrying efficiency. This increase in
efficiency is obtained by either carrying more cargo with the same displacement or by
increasing the speed of the ship. Moreover, the substantial decrease in material cost
supersedes the higher production costs. One can easily predict that both improvements are
also important from a sustainability point of view. Less emission of hazardous gases produced
by marine diesel engines and reducing the use of natural resources are the examples of these
structures’ advantages in terms of sustainability.
Different types of materials such as steel, aluminium, composite and plywood are used in car
deck structure design. According to Jia and Ulfvarson [1], utilizing alternative materials to
produce lightweight decks in marine structures will lead to weight reduction in panels.
However, this advantage is overshadowed by the significant manufacturing and material
costs. As a result of this, the focus in the marine industry has been shifted toward the
structural designs and optimization of panels, either by means of modifying the dimensions or
utilizing alternative configurations for the panel structures. In his study on plates subject to
shear loading, Alinia [2] has presented the relationship between the increase in critical shear
stress for buckling when a plate is stiffened and certain parameters such as the aspect ratio
and the type and number of stiffeners. Maiorana et al. [3] have in a similar study presented the
dependence of the critical buckling load of a longitudinally stiffened plate on the stiffener
position, the load that the panel is subjected to (in-plane bending, compression or shear), the
type of cross-section, stiffener flexural rigidity and panel aspect ratio. Likewise, in a study on
a longitudinally stiffened panel subjected to bending moment in its own plate, Alinia and
Moosavi [4] have shown that by placing the stiffener at its optimal position, an increase in the
critical bending stress coefficient can be increased by as much as six times. Furthermore, this
optimal position is dependent on the stiffener’s flexural rigidity and the panel’s aspect ratio.
Regarding alternative configurations, Maiorana et al. [3] have presented the fact that stiffeners
with closed cross-sections have a better buckling performance than open cross-sections,
which are generally used by the marine industry. Nie and Ma [5], on the other hand, have
investigated possible improvements that can be achieved by adding thin-walled box beams to
the decks of a warship. They have concluded that in this way up to a 20% decrease in deck
stresses and more than a 90% increase in deck buckling stress will lead to significant
improvements in hull strength and survivability with less than a 10% increase in structural
weight.
In this thesis, a methodology is presented to investigate the possibility of obtaining weight
reductions in steel car deck panels while fulfilling certain criteria such as deflections and
stresses occurring in the panel. This is to be done by means of numerical optimization
techniques, as have been tested and proven resourceful in a number of research projects, such
as those by Vanderplaats [6], Kumar et al. [7], Brosowski and Ghavami [8] and Vanderplaats
and Moses [9].

10
1.2. Objective
The main objective with this investigation is to evaluate and compare a series of car deck
panels by their weights and performance in satisfying design requirements. These are the
required free height above the fixed below deck, the deflection along the edges and the stress
requirements of the relevant classification society, which in this study is Det Norske Veritas
(DNV). The following targets were determined to have a consistent comparison between
different concepts:
• A conventional car deck panel concept currently in use was optimized and if possible
further developed by means of parametric study and optimization.
• The same procedure was applied to an older concept which had been replaced by the
current concept.
• Finally, alternative concepts were created and optimized.
The performances of optimized car deck panel designs were then compared and it was
concluded whether or not the current design should be changed. Furthermore, parameters or
details that play an important role in the weight optimization of a car deck panel were studied.
1.3. Methodology
A reference car deck panel of a pure car and truck carrier (PCTC) type of vessel was proposed
by TTS Marine AB for this study. Following the methodology shown in Fig. 1, performance
criteria were first imposed on deflections and stresses that occur in the models for different
working positions of the car deck panel. Finite element models of all the geometries were
created by parameterizing the variables such as plate thickness, web or flange width, or
stiffener spacing. The static analysis was carried out in ANSYS Mechanical APDL 13.0 [10].
Several runs were made to make a mesh convergence analysis. These parametric models were
then used in the goal-driven optimization part of the project. Using design of experiments,
several combinations of the parameters are created as "design points". By running the analysis
for each design point and recording the outputs, a mathematical formula was fitted to the data,
which is called a "response surface". The parameters with significant influence on the outputs
were determined from this formula, with which new response surfaces were created.
Numerical optimization techniques are then utilized to obtain weight-optimized panel
structures. Goal-driven optimization is presented in detail in Section 2.
11
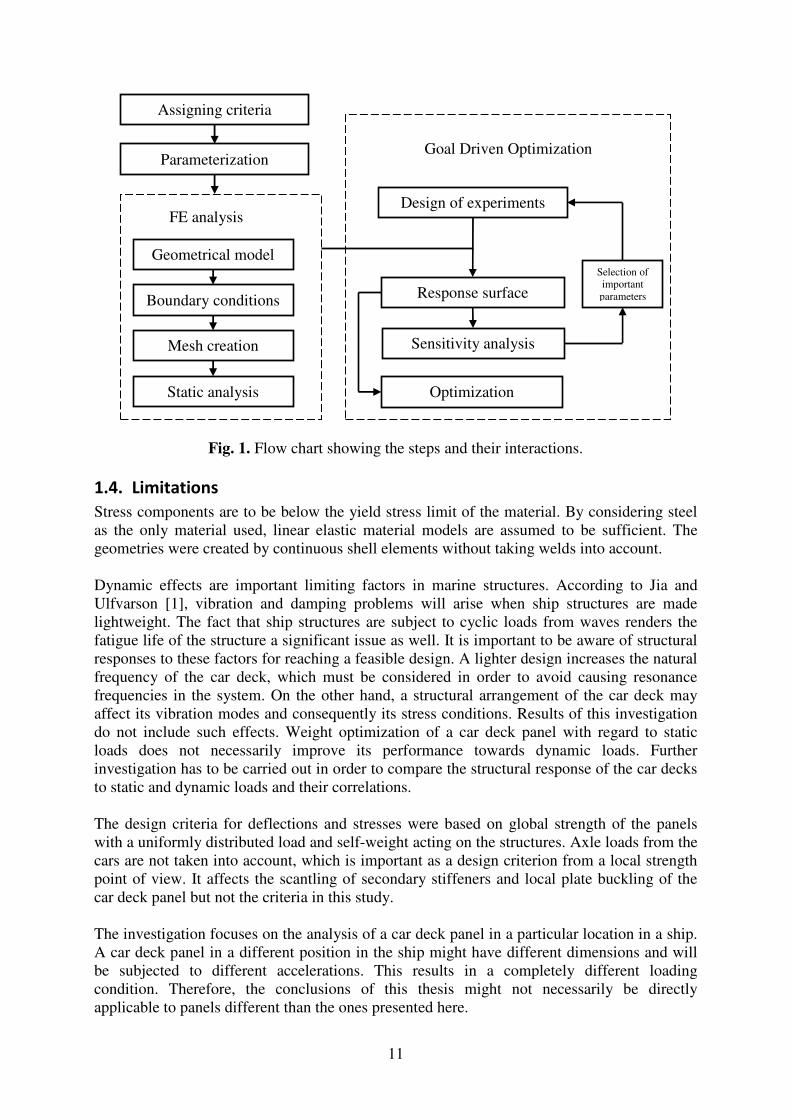
Fig. 1. Flow chart showing the steps and their interactions.
1.4. Limitations
Stress components are to be below the yield stress limit of the material. By considering steel
as the only material used, linear elastic material models are assumed to be sufficient. The
geometries were created by continuous shell elements without taking welds into account.
Dynamic effects are important limiting factors in marine structures. According to Jia and
Ulfvarson [1], vibration and damping problems will arise when ship structures are made
lightweight. The fact that ship structures are subject to cyclic loads from waves renders the
fatigue life of the structure a significant issue as well. It is important to be aware of structural
responses to these factors for reaching a feasible design. A lighter design increases the natural
frequency of the car deck, which must be considered in order to avoid causing resonance
frequencies in the system. On the other hand, a structural arrangement of the car deck may
affect its vibration modes and consequently its stress conditions. Results of this investigation
do not include such effects. Weight optimization of a car deck panel with regard to static
loads does not necessarily improve its performance towards dynamic loads. Further
investigation has to be carried out in order to compare the structural response of the car decks
to static and dynamic loads and their correlations.
The design criteria for deflections and stresses were based on global strength of the panels
with a uniformly distributed load and self-weight acting on the structures. Axle loads from the
cars are not taken into account, which is important as a design criterion from a local strength
point of view. It affects the scantling of secondary stiffeners and local plate buckling of the
car deck panel but not the criteria in this study.
The investigation focuses on the analysis of a car deck panel in a particular location in a ship.
A car deck panel in a different position in the ship might have different dimensions and will
be subjected to different accelerations. This results in a completely different loading
condition. Therefore, the conclusions of this thesis might not necessarily be directly
applicable to panels different than the ones presented here.
Design of experiments
Optimization
Response surface
Sensitivity analysis
Selection of
important
parameters
Mesh creation
Geometrical model
Boundary conditions
Static analysis
FE analysis
Assigning criteria
Parameterization Goal Driven Optimization

12
Production costs have great impacts on design of such structures and usually lead to a
contradiction preventing a lighter design to be achieved. The stress condition varies over the
plate, which requires different dimensions to be applied to different parts. Production costs,
on the other hand, would decrease if the parts had the same dimensions. For instance, parts
with the same thickness could be cut from the same plate and a manufacturer could take
advantage of the economy of scale. Therefore, the same dimensions are applied to all parts
regarding the maximum stress value. Parameterization of Concepts A and B (Sections 4.2 and
5.1) is an example of such a contradiction where unique parameters were assigned to different
parts. Otherwise, no financial analysis was made in this investigation. Consequently, the use
of technology that could improve the design by overcoming some limitations is not discussed.
For instance, by considering developments in welding technology the minimum plate
thickness that is allowed to prevent buckling could decrease. This could result in decreasing to
a great degree the weight of the structure.

13
2. Theoretical background of goal-driven optimization
This section presents the theory behind goal-driven optimization, which has been selected as
the method for obtaining weight reduction in car deck panels. How the design of experiments
is used to obtain a response surface and make a parametric sensitivity is explained. This is
followed by a presentation of different numerical optimization methods that are used in this
project.
2.1. Design of experiments
The design of experiments specifies changes in input parameters in order to observe the
corresponding output response of the system. It allows building the response surface without
the need for performing the analysis for all possible combinations of input parameters
(fractional factorial design).
A second-order polynomial model is used in this project to be fitted to the response data
(response surface). For this purpose, a central composite design according to Montgomery
[11] is the most popular and efficient design used. For details, see [11] and [12]. Each
combination of input parameters used is called a design point. The number of design points
that must be created for the number of input parameters in order to obtain the response surface
is shown in Fig. 2.
Fig. 2. The number of design points for the number input parameters [10].
2.2. Response surface and parametric sensitivity
Considering the response (output parameters, for example deflection) of a system to be
continuous and influenced by several factors (input parameters, for example web height,
flange thickness), a response surface is built by plotting the response to possible combinations
of the factors (design points). The response surface of n factors is plotted in the n+1
dimension [11], [13]. A response surface as a function of two factors, A and B is shown in
Fig. 3.
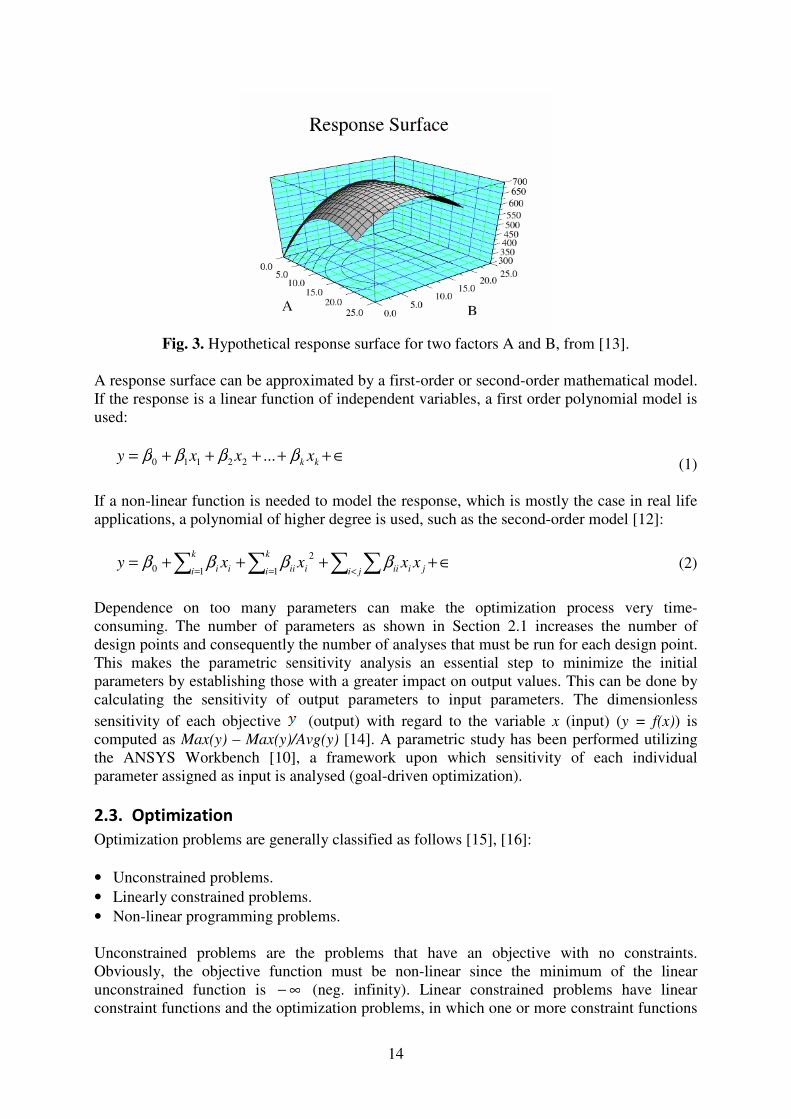
14
Fig. 3. Hypothetical response surface for two factors A and B, from [13].
A response surface can be approximated by a first-order or second-order mathematical model.
If the response is a linear function of independent variables, a first order polynomial model is
used:
∈+++++= kk xxxy ββββ ...22110 (1)
If a non-linear function is needed to model the response, which is mostly the case in real life
applications, a polynomial of higher degree is used, such as the second-order model [12]:
∈++++= ∑ ∑∑∑ <== ji jiii
k
i iii
k
i ii xxxxy ββββ1
2
10 (2)
Dependence on too many parameters can make the optimization process very time-
consuming. The number of parameters as shown in Section 2.1 increases the number of
design points and consequently the number of analyses that must be run for each design point.
This makes the parametric sensitivity analysis an essential step to minimize the initial
parameters by establishing those with a greater impact on output values. This can be done by
calculating the sensitivity of output parameters to input parameters. The dimensionless
sensitivity of each objective (output) with regard to the variable x (input) (y = f(x)) is
computed as Max(y) – Max(y)/Avg(y) [14]. A parametric study has been performed utilizing
the ANSYS Workbench [10], a framework upon which sensitivity of each individual
parameter assigned as input is analysed (goal-driven optimization).
2.3. Optimization
Optimization problems are generally classified as follows [15], [16]:
• Unconstrained problems.
• Linearly constrained problems.
• Non-linear programming problems.
Unconstrained problems are the problems that have an objective with no constraints.
Obviously, the objective function must be non-linear since the minimum of the linear
unconstrained function is ∞− (neg. infinity). Linear constrained problems have linear
constraint functions and the optimization problems, in which one or more constraint functions

15
are non-linear, are called non-linear programming problems. The problem in the current study
is an example of non-linear programming problems because of its non-linear constraint
functions.
Kumar et al. [7] define the structural design problem as shown in Table 1.
Table 1. A typical structural design problem.
MINIMIZE SUBJECT TO
Weight or some other design goal
Stress constraints
Frequency constraints
Manufacturing requirements
Reliability, quality and cost considerations
Geometry considerations
Other miscellaneous design requirements
Vanderplaats [6] provides the mathematical formulation to this problem as follows:
Minimize:
( )XF (3)
Subject to:
( ) 0≤Xg jmj ,1= (4)
u
ii
l
i XXX ≤≤ ni ,1= (5)
where Eq. (3) is the objective function, dependent on the design variables {X}, (4) the
inequality constraints, and (5) the side constraints. Constraint functions enforce limits on the
design variable values. Inequality constraints impose either upper or lower limits, whereas
side constraints affect both upper and lower limits.
To solve an optimization problem there is a vast range of analytical and numerical methods
available in the literature. A review of all existing methods and their developments is beyond
the scope of this thesis. Interested readers are referred to references [9] and [15] - [17].
Instead, random search techniques such as screening and genetic algorithms that are used in
this project are briefly described. These methods are considered as direct approaches to
optimization problems and because of their simplicity, availability and cost-effectiveness they
are preferred over the other methods.
A screening method is a direct sampling method which creates a sample set from the design
points and sorts them based on the objectives. It is a powerful method in obtaining the
approximate vicinity of global minima and is suitable for use in preliminary design. This
forms the basis for advanced methods used for more refined optimization [14].
Genetic search-based optimization methods belong to the category of stochastic search
methods. Based on Darwin’s theory of the survival of the fittest, these methods represent a set
of alternative designs as “generations”. The “traits” of individual alternatives are passed on to
the next generation through “reproducing” and “crossing”. A blending of the best properties
of cross-breeding couples leads to the offspring being superior to both parents. Better

16
objective function values are achieved with consecutive generations and the optimum design
can be searched by having the degree of superiority of a population as the target of the design
process. The fact that gradients of objective and constraint functions are not necessary is very
useful since this helps avoid getting stuck in the vicinity of a local minimum [18]. The multi-
objective genetic algorithm, (MOGA), a feature of ANSYS Workbench [10], is used in this
project.

17
3. Performance criteria
This section introduces the performance criteria of the reference car deck panel for which this
study has been carried out. The same performance conditions were also used for other
investigated concepts in the project. Different loads and boundary conditions apply to two
different positions where the panel is used. The performance criteria for these two load cases
are defined.
3.1. Working positions
The deck plan of the 6th
deck of one of a series of 10,190 lane-metres, 55,000 - square metre
PCTC ships is shown in Fig. 4. The deck is divided into liftable panels. One of the panels in
the middle, marked grey, is selected by TTS as a typical panel to be used as the reference car
deck panel in this investigation.
Fig. 4. The position of the reference car deck panel.
The panel has three working positions, as shown in Fig. 5. The first two are the seagoing
condition with different requirements for the height above the fixed deck beneath. The third
position is the stowed position when the deck is not in use. Different boundary conditions,
loads and performance criteria are defined for these two cases.
Fig. 5. Working positions of the reference panel.
3.1.1. Seagoing condition (Load Case I)
In this load case, the panel serves as car deck in a seagoing condition. The panel is loaded
with a uniformly distributed load (UDL) of 250 kg/m2 and the self-weight of the panel. The
total load is calculated as self-weight (16.2 t) + UDL (250 kg/m2 * 165.7 m
2) = 57.6 t, where t
denotes metric tonne. A dynamic addition of 50%, arising due to the motion of the ship and
calculated according to DNV rules [19] increases this load to 86.4 t [20]. In this load
condition the panel is simply supported in all four corner areas.
3.1.2. Stowed position (Load Case II)
In this load case, the unloaded panel is lifted to the stowed position. The total load consists of
the self-weight and dynamic addition of 20%, which is calculated as 19.4 t [20].

18
The car deck is usually lifted by a scissor deck lifter which supports the panel in the middle,
as show in Fig. 6-b. The deflection of the panel reduces the contact between the flanges of the
beams and the platform of the lifter to four points on the edges of platform.
Fig. 6. The panel in (a) seagoing and (b) stowed position lifted by the deck lifter.
3.2. Performance criteria
Criteria for the optimization of different designs, to assess their performance and to compare
them with each other, have to be defined. These criteria are presented by either DNV or the
client, and were used as constraint functions in the optimization procedure. The definition of
the criteria was made with feedback from TTS, and with reference to Eqs (3) and (4);
deflection and stresses are inequality constraints, while weight is the objective function. Other
factors such as buckling, fatigue life and natural frequency would usually have to be
considered in such a study, but have been left out of the scope of this investigation.
3.2.1. Deflection
The requirement for deflection is that when the panel deflects, a certain free height above the
below deck has to remain. Therefore, a certain limiting value cannot be assigned directly for
deflection; it is, rather, defined according to Fig. 7 such that the sum of the moulded depth (D)
and the maximum deflection of the lowest points of the panel (δ), in addition to an error
margin of 20 mm should not exceed a certain limit, which is determined as 423.5 mm.
Fig. 7. Moulded depth and deflection of the panel.
There is also a maximum edge deflection criterion which must not exceed 50 mm. It applies
to keep the difference in edge heights between two adjacent loaded and unloaded car decks’
minimum. This is to ensure the safe passage of cars from one panel to another.
y
z
19
3.2.2. Stress
The maximum stresses that are allowed to occur in the structural elements were calculated
according to DNV rules [19] for steel with the properties shown in Table 2. The
corresponding values for the two load cases are given in Table 3, where σx, τxz and σvM denote
normal, shear and von Mises stresses, respectively.
Table 2. Material properties of constructional steel used for this study.
Density (kg/m3) 7850
Young’s modulus (MPa) 210000
Poisson’s ratio 0.3
Yield stress (MPa) 355
Table 3. Maximum allowable stresses with regards to load conditions.
Load Case I (Seagoing) Load Case II (Harbour)
σx (MPa) 222.4 250.2
τxz (MPa) 125.1 139
σvM (MPa) 250.2 278

20
21
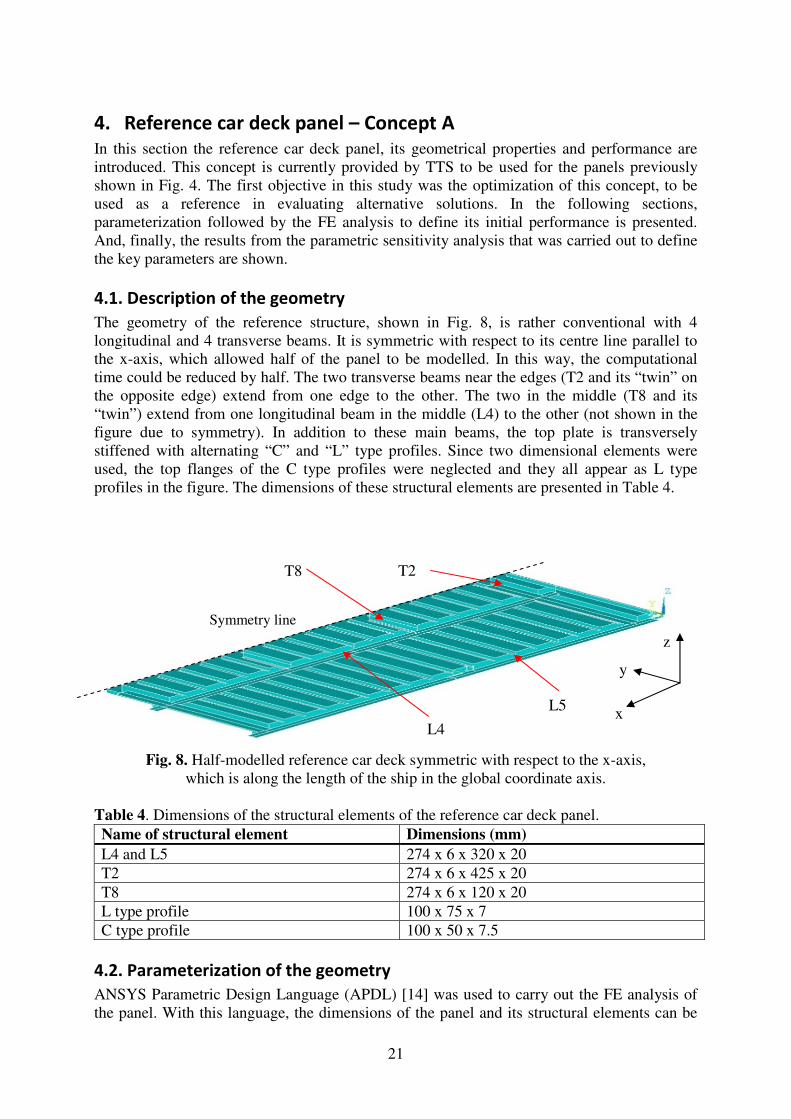
4. Reference car deck panel – Concept A
In this section the reference car deck panel, its geometrical properties and performance are
introduced. This concept is currently provided by TTS to be used for the panels previously
shown in Fig. 4. The first objective in this study was the optimization of this concept, to be
used as a reference in evaluating alternative solutions. In the following sections,
parameterization followed by the FE analysis to define its initial performance is presented.
And, finally, the results from the parametric sensitivity analysis that was carried out to define
the key parameters are shown.
4.1. Description of the geometry
The geometry of the reference structure, shown in Fig. 8, is rather conventional with 4
longitudinal and 4 transverse beams. It is symmetric with respect to its centre line parallel to
the x-axis, which allowed half of the panel to be modelled. In this way, the computational
time could be reduced by half. The two transverse beams near the edges (T2 and its “twin” on
the opposite edge) extend from one edge to the other. The two in the middle (T8 and its
“twin”) extend from one longitudinal beam in the middle (L4) to the other (not shown in the
figure due to symmetry). In addition to these main beams, the top plate is transversely
stiffened with alternating “C” and “L” type profiles. Since two dimensional elements were
used, the top flanges of the C type profiles were neglected and they all appear as L type
profiles in the figure. The dimensions of these structural elements are presented in Table 4.
Fig. 8. Half-modelled reference car deck symmetric with respect to the x-axis,
which is along the length of the ship in the global coordinate axis.
Table 4. Dimensions of the structural elements of the reference car deck panel.
Name of structural element Dimensions (mm)
L4 and L5 274 x 6 x 320 x 20
T2 274 x 6 x 425 x 20
T8 274 x 6 x 120 x 20
L type profile 100 x 75 x 7
C type profile 100 x 50 x 7.5
4.2. Parameterization of the geometry
ANSYS Parametric Design Language (APDL) [14] was used to carry out the FE analysis of
the panel. With this language, the dimensions of the panel and its structural elements can be
Symmetry line
T2 T8
L4
L5
y
z
x
22
defined as parameters in the pre-processing stage, which were used by ANSYS Workbench as
input parameters for the goal-driven optimization as described in Fig. 1.
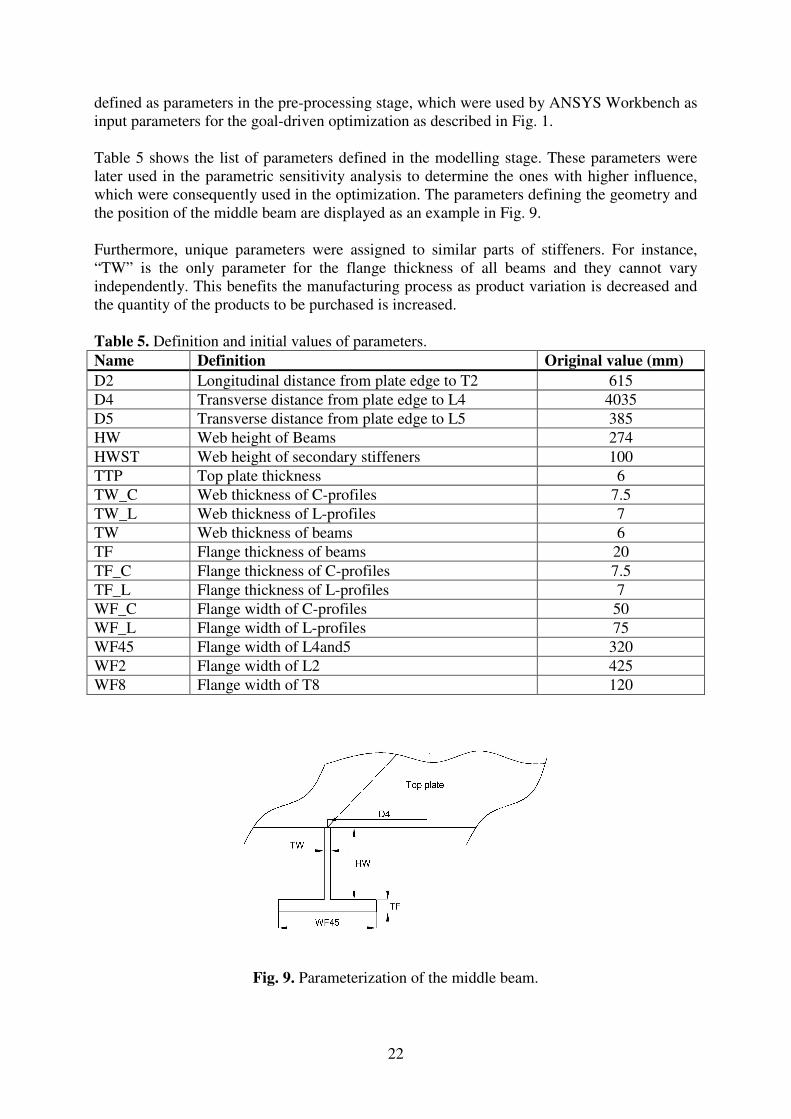
Table 5 shows the list of parameters defined in the modelling stage. These parameters were
later used in the parametric sensitivity analysis to determine the ones with higher influence,
which were consequently used in the optimization. The parameters defining the geometry and
the position of the middle beam are displayed as an example in Fig. 9.
Furthermore, unique parameters were assigned to similar parts of stiffeners. For instance,
“TW” is the only parameter for the flange thickness of all beams and they cannot vary
independently. This benefits the manufacturing process as product variation is decreased and
the quantity of the products to be purchased is increased.
Table 5. Definition and initial values of parameters.
Name Definition Original value (mm)
D2 Longitudinal distance from plate edge to T2 615
D4 Transverse distance from plate edge to L4 4035
D5 Transverse distance from plate edge to L5 385
HW Web height of Beams 274
HWST Web height of secondary stiffeners 100
TTP Top plate thickness 6
TW_C Web thickness of C-profiles 7.5
TW_L Web thickness of L-profiles 7
TW Web thickness of beams 6
TF Flange thickness of beams 20
TF_C Flange thickness of C-profiles 7.5
TF_L Flange thickness of L-profiles 7
WF_C Flange width of C-profiles 50
WF_L Flange width of L-profiles 75
WF45 Flange width of L4and5 320
WF2 Flange width of L2 425
WF8 Flange width of T8 120
Fig. 9. Parameterization of the middle beam.

23
4.3. Boundary conditions
A symmetry boundary condition was applied to the symmetry plane nodes of the structure
since half of the structure was modelled.
For load case I, the nodes in the corners (intersection line of web of edge beams) are fixed in
the z direction. A single node at the centre of the panel (at the symmetry line) is fixed in the x
and y directions and no rotation around the z axis to prevent rigid body motion. The boundary
conditions applied on the model are displayed in Fig. 10. It should be noted that for the first
load case fixing the translation of more than one node would slightly over-constrain the
model. The nodes on the intersection line of the edge beams also have a small translation in
the z direction as the plate bends. However, this effect is negligible and even necessary for
avoiding high-stress estimation at the constraints nodes.
For load case II, deflection of the panel leads to four point contacts where the two short
middle transverse beams in the middle touch the edge of the lifter platform. So, the same
fixation is applied not to the corners of the panel, but to the nodes in those points.
Fig. 10. Boundary conditions of the car deck panel for the load case I.

24
4.4. Mesh creation
Shell elements are suitable types of elements for the modelling of structures made of thin
plates. In this type of elements, the assumption of plane-stress condition simplifies the
calculation [10], which is the case for car deck panels. This allows two-dimensional elements
to be created where the plate thickness is considered constant.
The geometry of the car deck allows using quadratic 4-node shell elements (no midside
nodes) to create a fine mesh. For structural analyses, these corner node elements with extra
shape functions will often yield an accurate solution in a reasonable amount of computer time
[14]. However, to ensure accuracy in the mesh convergence analysis, 8-node shell elements
were selected when using bigger elements. As the element size became smaller they were
switched to 4-node elements which are equivalent to an 8-node element twice their size. Both
types of elements have six degrees of freedom.
Full integration is used, which allows the shell element to use the method of incompatible
modes to improve the accuracy in bending-dominated problems. It only requires one element
through the thickness [10].
4.5. Analysis
Static analysis was considered for evaluation and comparison of output parameters where the
UDL was applied as a constant load. Edge deflection was extracted from the top plate
elements at the edges; see Fig. 11, while the deflection δ is the deflection at the lowest part of
the panel (flanges, see Fig. 12). The maximum normal stress component σx, shear stress τxz
and von Misses stress σvM were extracted from the main beams where the maximum values
were expected to occur, see Fig. 13. This is obviously the middle area of the beams between
supports. The highest values among these were determined to be the maximum stresses
occurring in the structure. In this way, the areas with sharp edges with high stress
concentration factors arising from coarse mesh were excluded.
Fig. 11. “Edge Deflection” is measured along the edges marked in red.
y z
x

25
Fig. 12. The value of δ is measured at the highlighted flanges.
Fig. 13. The parts of the panel where the stresses are recorded are circled in red.
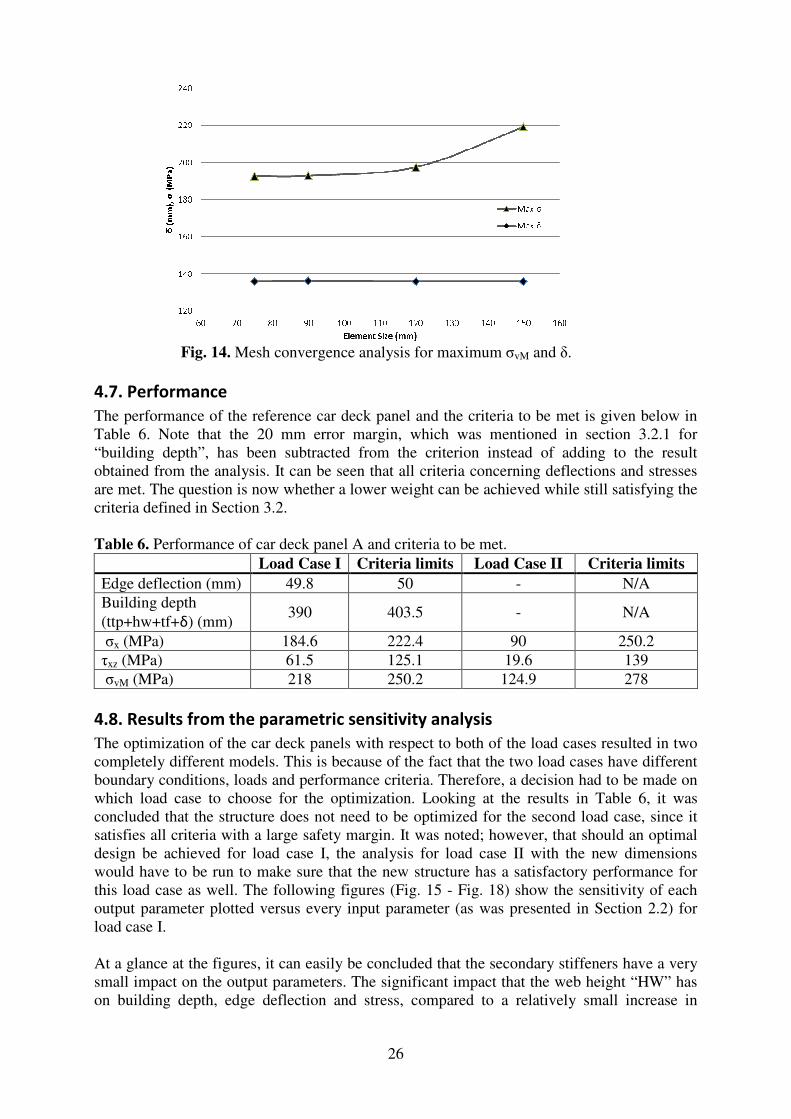
4.6. Mesh convergence
Figure 14 shows the mesh convergence analysis obtained by plotting the maximum von
Misses stress value as well as the deflection of the lower part of the panel against various
element sizes. As can be seen from the figure, the results have a minor change with a 75 mm
element size compared to 90, which was the selected element size for the analysis. The model
had 11,545 elements with this element size.
y
z
x
y
x
Example of highlighted flange
26
Fig. 14. Mesh convergence analysis for maximum σvM and δ.
4.7. Performance
The performance of the reference car deck panel and the criteria to be met is given below in
Table 6. Note that the 20 mm error margin, which was mentioned in section 3.2.1 for
“building depth”, has been subtracted from the criterion instead of adding to the result
obtained from the analysis. It can be seen that all criteria concerning deflections and stresses
are met. The question is now whether a lower weight can be achieved while still satisfying the
criteria defined in Section 3.2.
Table 6. Performance of car deck panel A and criteria to be met.
Load Case I Criteria limits Load Case II Criteria limits
Edge deflection (mm) 49.8 50 - N/A
Building depth
(ttp+hw+tf+δ) (mm) 390 403.5 - N/A
σx (MPa) 184.6 222.4 90 250.2
τxz (MPa) 61.5 125.1 19.6 139
σvM (MPa) 218 250.2 124.9 278
4.8. Results from the parametric sensitivity analysis
The optimization of the car deck panels with respect to both of the load cases resulted in two
completely different models. This is because of the fact that the two load cases have different
boundary conditions, loads and performance criteria. Therefore, a decision had to be made on
which load case to choose for the optimization. Looking at the results in Table 6, it was
concluded that the structure does not need to be optimized for the second load case, since it
satisfies all criteria with a large safety margin. It was noted; however, that should an optimal
design be achieved for load case I, the analysis for load case II with the new dimensions
would have to be run to make sure that the new structure has a satisfactory performance for
this load case as well. The following figures (Fig. 15 - Fig. 18) show the sensitivity of each
output parameter plotted versus every input parameter (as was presented in Section 2.2) for
load case I.
At a glance at the figures, it can easily be concluded that the secondary stiffeners have a very
small impact on the output parameters. The significant impact that the web height “HW” has
on building depth, edge deflection and stress, compared to a relatively small increase in

27
weight, is distinctive as the web height proportionally shifts the neutral line of the panel. The
opposite trend is shown by the top plate thickness “TTP”, which could drastically increase the
weight with small changes in panel behaviour.
The important role that the position of the middle beams (D4) plays in changing the stress, but
not to the same degree as any other objective’s value, is also considerable. The conclusion
could be that the maximum stress occurs on the longitudinal edge beam. By positioning the
middle beam (L4, see Fig. 8) closer to the edge, the stress in the edge longitudinal is lowered.
However, as it moves far towards the centre of the panel the load area that must be carried by
the edge longitudinal increases and this results in a higher stress condition. The small
influence that occurs in weight is caused by the change in the supported length (T8) for the
deck lifter to which the middle beam is connected. Hence, it is reasonable to only select the
parameters defining the geometry of the primary stiffeners and their positions to be optimized.
Fig. 15. Sensitivity of building depth to input parameters.
Fig. 16. Sensitivity of edge deflection to input parameters.
28
Fig. 17. Sensitivity of maximum von Misses stress to input parameters.
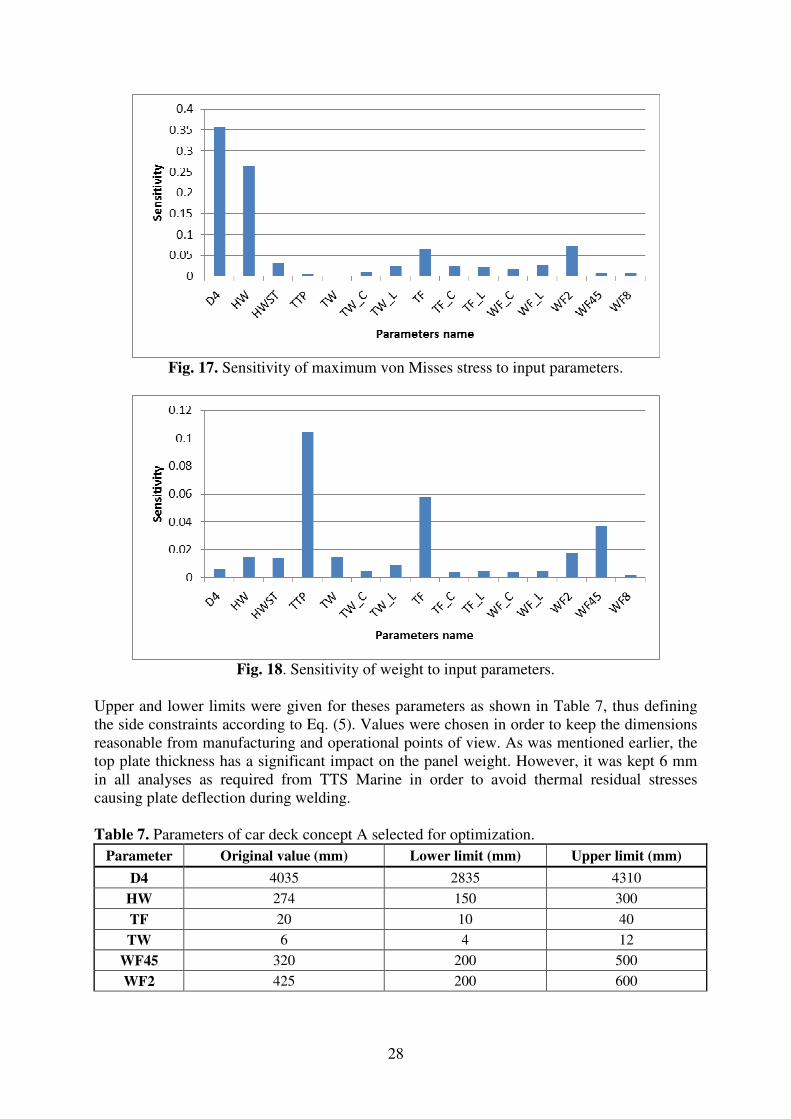
Fig. 18. Sensitivity of weight to input parameters.
Upper and lower limits were given for theses parameters as shown in Table 7, thus defining
the side constraints according to Eq. (5). Values were chosen in order to keep the dimensions
reasonable from manufacturing and operational points of view. As was mentioned earlier, the
top plate thickness has a significant impact on the panel weight. However, it was kept 6 mm
in all analyses as required from TTS Marine in order to avoid thermal residual stresses
causing plate deflection during welding.
Table 7. Parameters of car deck concept A selected for optimization.
Parameter Original value (mm) Lower limit (mm) Upper limit (mm)
D4 4035 2835 4310
HW 274 150 300
TF 20 10 40
TW 6 4 12
WF45 320 200 500
WF2 425 200 600

29
5. Concept B
In this section, the same calculations and optimization procedure for Concept A are made to
evaluate the performance of another car deck, “Concept B”. The results of their optimizations
are presented in Section 6. This concept and its design were selected together with TTS. It had
previously been supplied by TTS, but has later been replaced by concept A. As can be seen, it
is stiffened by 6 longitudinal and 6 transversal beams as shown in the Fig. 19, where they
have been reduced to four longitudinal beams and four transverse beams (including the deck
lifter supports) in Concept A.
Fig. 19. Half-modelled car deck Concept B symmetric with respect to the x-axis.
Concept A is considered as an improved design of Concept B. The changes made could be
explained as follows:
(1) The function of the transverse beams is mostly to provide support to secondary stiffeners.
Hence, by positioning the secondary stiffeners transversally, which was the case in
Concept A, they are no longer of importance.
(2) Part of the load carried by 2T and 3T is transferred to the constraint points through 8G.
So, by taking them away, the load will be taken on by 1T through 2G and 6G instead.
This improves the maximum edge deflection that usually occurs at 8G, which is the one
with the longest span, making it the most loaded one.
The same load cases, criteria and boundary conditions that were considered for Concept A
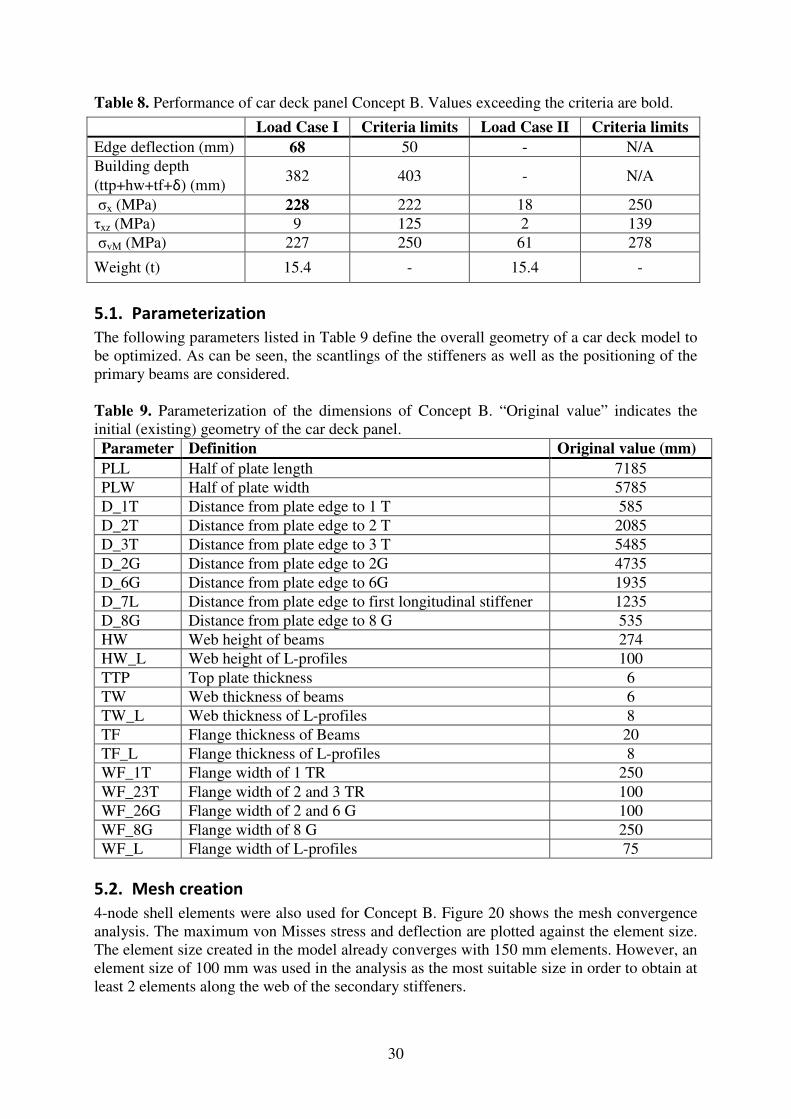
apply to Concept B as well. Table 8 shows the performance of this panel before optimization
is carried out. As can be seen, the edge deflection and maximum normal stress values exceed
the criteria limits.
y
z x
Symmetry line 1T
3T
2T
8G 6G
2G
30
Table 8. Performance of car deck panel Concept B. Values exceeding the criteria are bold.
5.1. Parameterization
The following parameters listed in Table 9 define the overall geometry of a car deck model to
be optimized. As can be seen, the scantlings of the stiffeners as well as the positioning of the
primary beams are considered.
Table 9. Parameterization of the dimensions of Concept B. “Original value” indicates the
initial (existing) geometry of the car deck panel.
Parameter Definition Original value (mm)
PLL Half of plate length 7185
PLW Half of plate width 5785
D_1T Distance from plate edge to 1 T 585
D_2T Distance from plate edge to 2 T 2085
D_3T Distance from plate edge to 3 T 5485
D_2G Distance from plate edge to 2G 4735
D_6G Distance from plate edge to 6G 1935
D_7L Distance from plate edge to first longitudinal stiffener 1235
D_8G Distance from plate edge to 8 G 535
HW Web height of beams 274
HW_L Web height of L-profiles 100
TTP Top plate thickness 6
TW Web thickness of beams 6
TW_L Web thickness of L-profiles 8
TF Flange thickness of Beams 20
TF_L Flange thickness of L-profiles 8
WF_1T Flange width of 1 TR 250
WF_23T Flange width of 2 and 3 TR 100
WF_26G Flange width of 2 and 6 G 100
WF_8G Flange width of 8 G 250
WF_L Flange width of L-profiles 75
5.2. Mesh creation
4-node shell elements were also used for Concept B. Figure 20 shows the mesh convergence
analysis. The maximum von Misses stress and deflection are plotted against the element size.
The element size created in the model already converges with 150 mm elements. However, an
element size of 100 mm was used in the analysis as the most suitable size in order to obtain at
least 2 elements along the web of the secondary stiffeners.
Load Case I Criteria limits Load Case II Criteria limits
Edge deflection (mm) 68 50 - N/A
Building depth
(ttp+hw+tf+δ) (mm) 382 403 - N/A
σx (MPa) 228 222 18 250
τxz (MPa) 9 125 2 139
σvM (MPa) 227 250 61 278
Weight (t) 15.4 - 15.4 -

31
Fig. 20. Mesh convergence analysis for maximum σvM and δ.
5.3. Results from parametric sensitivity analysis
The parametric sensitivity analyses carried out for the previous concept showed that the
dimensions of secondary stiffeners have a negligible impact on the global strength of the
panel. They are rather important for the local strength, which is not included in the
performance criteria. Hence, parameters could directly be chosen as variables defining the
dimensions and positions of the primary beams without a parametric sensitivity analysis.
Parameters to be optimized, their original values and given upper and lower limits are listed in
Table 10. These limits were defined to allow the maximum deviation from the original value
with the same approach as for the reference car deck panel.
Table 10. Parameterization of the dimension of Concept B.
Parameter Original value (mm) Lower limit (mm) Upper limit (mm)
D_2T 2085 1000 3000
D_3T 5485 4200 7000
HW 274 150 300
TW 6 5 10
TF 20 10 30
WF_26G 100 75 120
WF_8G 250 200 300

32
33
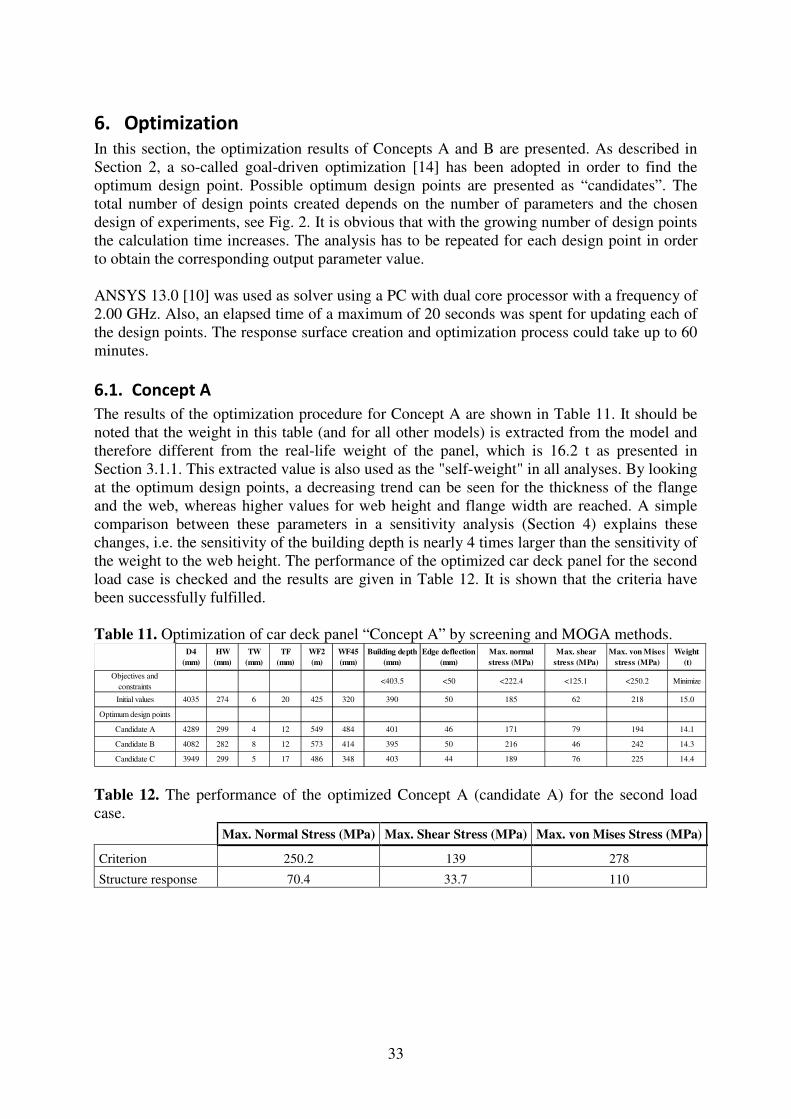
6. Optimization
In this section, the optimization results of Concepts A and B are presented. As described in
Section 2, a so-called goal-driven optimization [14] has been adopted in order to find the
optimum design point. Possible optimum design points are presented as “candidates”. The
total number of design points created depends on the number of parameters and the chosen
design of experiments, see Fig. 2. It is obvious that with the growing number of design points
the calculation time increases. The analysis has to be repeated for each design point in order
to obtain the corresponding output parameter value.
ANSYS 13.0 [10] was used as solver using a PC with dual core processor with a frequency of
2.00 GHz. Also, an elapsed time of a maximum of 20 seconds was spent for updating each of
the design points. The response surface creation and optimization process could take up to 60
minutes.
6.1. Concept A
The results of the optimization procedure for Concept A are shown in Table 11. It should be
noted that the weight in this table (and for all other models) is extracted from the model and
therefore different from the real-life weight of the panel, which is 16.2 t as presented in
Section 3.1.1. This extracted value is also used as the "self-weight" in all analyses. By looking
at the optimum design points, a decreasing trend can be seen for the thickness of the flange
and the web, whereas higher values for web height and flange width are reached. A simple
comparison between these parameters in a sensitivity analysis (Section 4) explains these
changes, i.e. the sensitivity of the building depth is nearly 4 times larger than the sensitivity of
the weight to the web height. The performance of the optimized car deck panel for the second
load case is checked and the results are given in Table 12. It is shown that the criteria have
been successfully fulfilled.
Table 11. Optimization of car deck panel “Concept A” by screening and MOGA methods. D4
(mm)
HW
(mm)
TW
(mm)
TF
(mm)
WF2
(m)
WF45
(mm)
Building depth
(mm)
Edge deflection
(mm)
Max. normal
stress (MPa)
Max. shear
stress (MPa)
Max. von Mises
stress (MPa)
Weight
(t)
Objectives and
constraints<403.5 <50 <222.4 <125.1 <250.2 Minimize
Initial values 4035 274 6 20 425 320 390 50 185 62 218 15.0
Optimum design points
Candidate A 4289 299 4 12 549 484 401 46 171 79 194 14.1
Candidate B 4082 282 8 12 573 414 395 50 216 46 242 14.3
Candidate C 3949 299 5 17 486 348 403 44 189 76 225 14.4
Table 12. The performance of the optimized Concept A (candidate A) for the second load
case.
Max. Normal Stress (MPa) Max. Shear Stress (MPa) Max. von Mises Stress (MPa)
Criterion 250.2 139 278
Structure response 70.4 33.7 110
34
6.2. Concept B
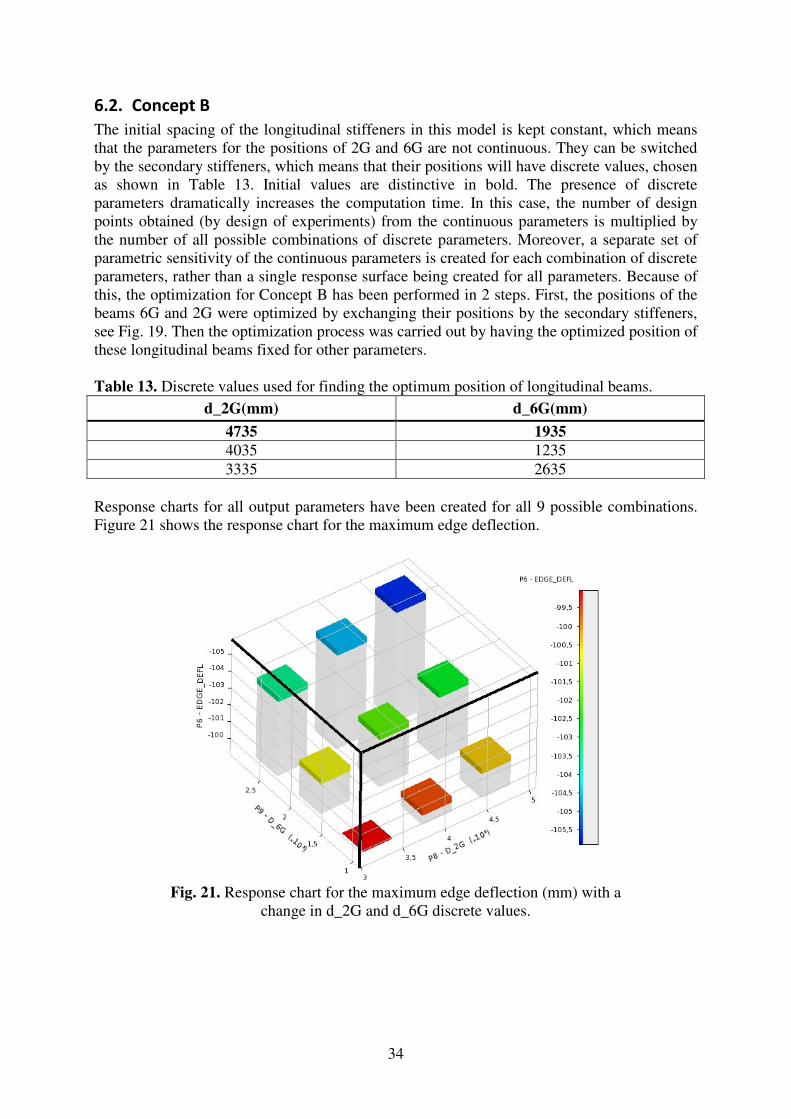
The initial spacing of the longitudinal stiffeners in this model is kept constant, which means
that the parameters for the positions of 2G and 6G are not continuous. They can be switched
by the secondary stiffeners, which means that their positions will have discrete values, chosen
as shown in Table 13. Initial values are distinctive in bold. The presence of discrete
parameters dramatically increases the computation time. In this case, the number of design
points obtained (by design of experiments) from the continuous parameters is multiplied by
the number of all possible combinations of discrete parameters. Moreover, a separate set of
parametric sensitivity of the continuous parameters is created for each combination of discrete
parameters, rather than a single response surface being created for all parameters. Because of
this, the optimization for Concept B has been performed in 2 steps. First, the positions of the
beams 6G and 2G were optimized by exchanging their positions by the secondary stiffeners,
see Fig. 19. Then the optimization process was carried out by having the optimized position of
these longitudinal beams fixed for other parameters.
Table 13. Discrete values used for finding the optimum position of longitudinal beams.
d_2G(mm) d_6G(mm)
4735 1935
4035 1235
3335 2635
Response charts for all output parameters have been created for all 9 possible combinations.
Figure 21 shows the response chart for the maximum edge deflection.
Fig. 21. Response chart for the maximum edge deflection (mm) with a
change in d_2G and d_6G discrete values.
35
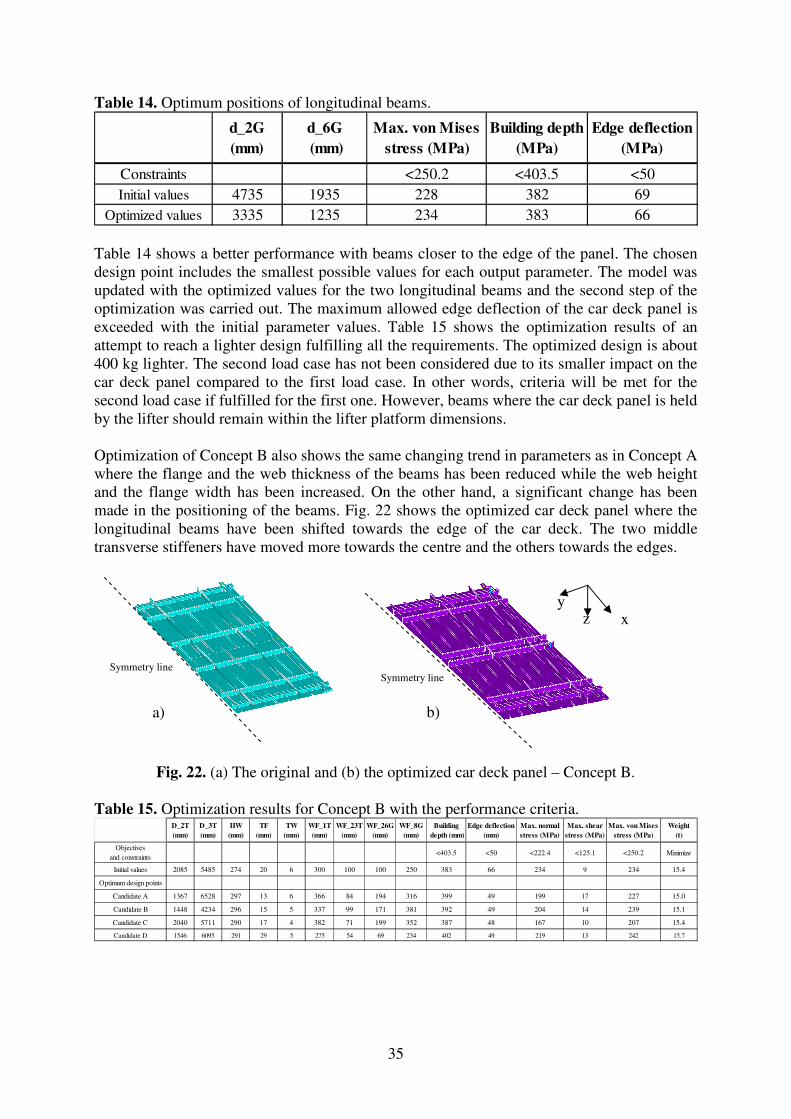
Table 14. Optimum positions of longitudinal beams.
d_2G
(mm)
d_6G
(mm)
Max. von Mises
stress (MPa)
Building depth
(MPa)
Edge deflection
(MPa)
Constraints <250.2 <403.5 <50
Initial values 4735 1935 228 382 69
Optimized values 3335 1235 234 383 66
Table 14 shows a better performance with beams closer to the edge of the panel. The chosen
design point includes the smallest possible values for each output parameter. The model was
updated with the optimized values for the two longitudinal beams and the second step of the
optimization was carried out. The maximum allowed edge deflection of the car deck panel is
exceeded with the initial parameter values. Table 15 shows the optimization results of an
attempt to reach a lighter design fulfilling all the requirements. The optimized design is about
400 kg lighter. The second load case has not been considered due to its smaller impact on the
car deck panel compared to the first load case. In other words, criteria will be met for the
second load case if fulfilled for the first one. However, beams where the car deck panel is held
by the lifter should remain within the lifter platform dimensions.
Optimization of Concept B also shows the same changing trend in parameters as in Concept A
where the flange and the web thickness of the beams has been reduced while the web height
and the flange width has been increased. On the other hand, a significant change has been
made in the positioning of the beams. Fig. 22 shows the optimized car deck panel where the
longitudinal beams have been shifted towards the edge of the car deck. The two middle
transverse stiffeners have moved more towards the centre and the others towards the edges.
Fig. 22. (a) The original and (b) the optimized car deck panel – Concept B.
Table 15. Optimization results for Concept B with the performance criteria. D_2T
(mm)
D_3T
(mm)
HW
(mm)
TF
(mm)
TW
(mm)
WF_1T
(mm)
WF_23T
(mm)
WF_26G
(mm)
WF_8G
(mm)
Building
depth (mm)
Edge deflection
(mm)
Max. normal
stress (MPa)
Max. shear
stress (MPa)
Max. von Mises
stress (MPa)
Weight
(t)
Objectives
and constraints<403.5 <50 <222.4 <125.1 <250.2 Minimize
Initial values 2085 5485 274 20 6 300 100 100 250 383 66 234 9 234 15.4
Optimum design points
Candidate A 1367 6528 297 13 6 366 84 194 316 399 49 199 17 227 15.0
Candidate B 1448 4234 296 15 5 337 99 171 381 392 49 204 14 239 15.1
Candidate C 2040 5711 290 17 4 382 71 199 352 387 48 167 10 207 15.4
Candidate D 1546 6095 291 29 5 275 54 69 234 402 49 219 13 242 15.7
Symmetry line
y z x
Symmetry line
b) a)

36
37
7. Development of new concepts
This section presents two car deck panel structures that were developed as possible alternative
solutions to the first two conventional concepts. First, Concept B that was presented in
Section 5 was further improved and a new concept with a much simpler configuration was
obtained. The second concept is a panel with diagonally positioned beams. Both new concepts
were optimized with the same procedure as described in the previous sections, based on the
load cases and performance criteria presented in Section 3. It should be noted that several
assumptions and simplifications were made based on the experience gained from the first two
concepts.
By assuming that as long as the conventional grillage configuration is not changed, the
secondary stiffeners can be kept the same as for the reference panel and do not have to be
included in the parametric study. This is because of the same or close values of unsupported
length for the stiffeners, which is the governing factor for the required scantlings.
Designing a car deck by assigning unique dimensions to different parts would entail
simplicity and productivity. However, this could have a negative impact in restricting the
optimization process. This is caused by the fact that the stress and strain condition varies over
the plate, and the beams in different positions have different functionalities. By excluding the
secondary stiffeners from the analysis, their defining parameters could be replaced by
allowing the beams at different parts of the panel to have different dimensions. This is to
allow the dimensions of different beams to be defined as different parameters instead of the
case with the first two concepts where all the beams had the same web thickness and all the
longitudinal and transverse beams had the same flange width, etc. One should still keep in
mind that this could slightly increase the manufacturing costs, especially if a small number of
car decks are to be manufactured.
Since the overall dimensions of the panel are kept constant, it is reasonable to assume with an
element size smaller than or equal to the reference concept, and having two elements along
the transverse beams, a mesh convergence analysis is not necessary.
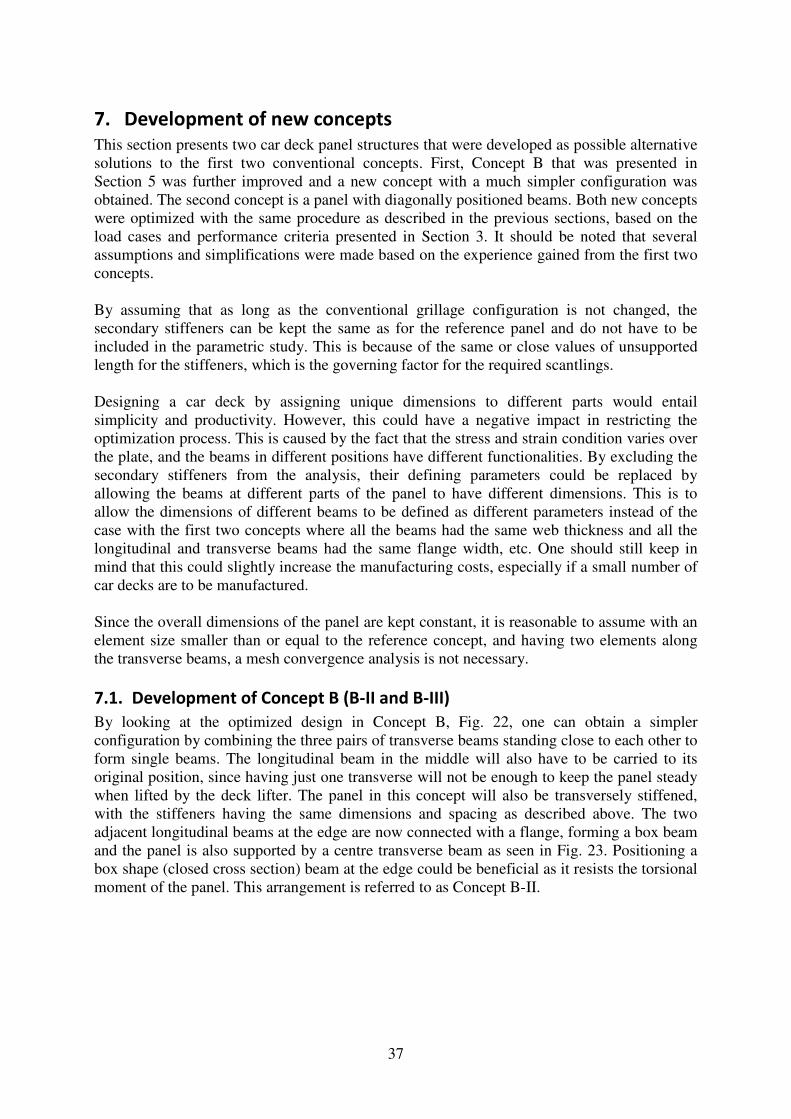
7.1. Development of Concept B (B-II and B-III)
By looking at the optimized design in Concept B, Fig. 22, one can obtain a simpler
configuration by combining the three pairs of transverse beams standing close to each other to
form single beams. The longitudinal beam in the middle will also have to be carried to its
original position, since having just one transverse will not be enough to keep the panel steady
when lifted by the deck lifter. The panel in this concept will also be transversely stiffened,
with the stiffeners having the same dimensions and spacing as described above. The two
adjacent longitudinal beams at the edge are now connected with a flange, forming a box beam
and the panel is also supported by a centre transverse beam as seen in Fig. 23. Positioning a
box shape (closed cross section) beam at the edge could be beneficial as it resists the torsional
moment of the panel. This arrangement is referred to as Concept B-II.

38
Fig. 23. Geometry of Concept B-II.
The list of dimensions used as input parameters in the optimization is shown in Table 16. The
scantlings of transverse stiffeners are the same as for Concept A, and for the sake of
simplicity all beams have the same initial dimensions and range.
Table 16. Input parameters for the optimization of Concept B-II.
Parameter Definition Initial value
(mm)
Lower limit
(mm)
Upper limit
(mm)
D_8G Distance from plate edge to box beam (8G) 285 200 400
D_7G Distance from plate edge to box beam (7G) 535 500 900
HW Web height of beams 274 204 400
T_B Web and flange thickness of box beam 10 4 20
TW_1T Web thickness of 1 TR 6 4 20
TW_2T Web thickness of 2 TR 6 4 20
TW_2G Web thickness of 2 G 6 4 20
TF_1T Flange thickness of 1 TR 20 10 40
TF_2T Flange thickness of 2 TR 20 10 40
TF_2G Flange thickness of 2G 20 10 40
WF_1T Flange width of 1 TR and its symmetric 250 200 600
WF_2T Flange width of 2 TR 250 200 600
WF_2G Flange width of 2G 250 200 600
WF_B Flange width of box beam 250 200 600
Optimization results have shown no better solution than the initial design. The reason could
be the existence of the middle transverse beam. As can be seen from Table 17, the building
depth of the initial design is close to its limit, which restricts the panel from becoming more
deflected. So by taking away the middle beam, the point of maximum deflection in the flanges
is carried away from the centre point, allowing a bigger margin for global deflection with the
same building depth. In this way, Concept B-II could be developed further (Concept B-III),
which looks the same as for Concept A except for using a closed cross section box-shaped
Symmetry line
y
z x
1T
2T
7G 8G
2G

39
beam at the edges and without the short beams in the middle for the deck lifter, instead of
which the longitudinal beam has been moved to its original position.
Fig. 24. Geometry of Concept B-III
Results from the optimization of Concept B-III in Table 18 refer to the expected improvement
compared to Concept B-II. It has approximately the same weight and performance as the
optimized Concept B while obtaining a simpler geometry.
Table 17. Performance of Concept B-II with initial values.
Building
depth (mm)
Edge deflection
(mm)
Max. normal
stress (MPa)
Max. shear
stress (MPa)
Max. von Mises
stress (Mpa)
Weight
(t)
Objectives and
constraints<403.5 <50 <222.4 <125.1 <250.2 Minimize
Initial values 375 41 187 54 184 16.63
Table 18. Optimization results for Concept B-III with the performance criteria. WF_B
(mm)
WF_2G
(mm)
WF_1T
(mm)
TF_1T
(mm)
TF_2G
(mm)
T_B
(mm)
TW_1T
(mm)
TW_2G
(mm)
HW
(mm)
Building
depth (mm)
Edge deflection
(mm)
Max. normal
stress (MPa)
Max. shear
stress (MPa)
Max. von Mises
stress (MPa)
Weight
(t)
Objectives and
constraints<403.5 <50 <222.4 <125.1 <250.2 Minimize
Initial values 250 250 250 20 20 6 6 6 274 418 89 424 59 419 13.8
Optimum design points
Candidate A 397 260 207 29 13 14 4 6 258 386 44 206 61 227 15.0
Candidate B 397 377 316 16 12 11 8 14 300 402 41 199 47 220 15.1
Candidate C 368 305 445 19 11 12 6 9 279 392 45 219 56 207 15.2
7.2. Concept C
This concept has been developed with two diagonal beams and rectangular frames creating a
shape of spider web, as seen in Fig. 25. Utilizing diagonally positioned beams has never been
common in the marine industry. By positioning beams along the diagonal, the span is
increased, which leads to larger dimensions and consequently to heavier structures. However,
an unusual boundary condition is considered in this study, in which the panels are supported
at their corners only. Thus, transferring the loads directly to the support points by crossed
beams would decrease the load on the edge beams and help fulfil the edge deflection criterion.
Furthermore, it seems it would strengthen the support points which are significant to reducing
the deflections. This is also beneficial for the second load case since the support points are
Symmetry line
y
z x

40
moved towards the centre. Equally spaced frames were introduced to the geometry; see Fig.
25. The quantity of frames is optimized at first by setting the number of frames as the only
variable n. Secondary stiffeners have been placed between the transverse beams depending on
the number of frames.
Fig. 25. Panels with crossed beams with a varying number of transverse
and longitudinal beams (n=1, 2, 3 and 4).
The car deck panels have been designed according to DNV rules in order to be used as the
starting design point. The beams are designed to satisfy global strength, using the UDL as the
design load according to DNV [19]. The scantling requirements for the beam at the edge were
the largest, since it has the longest unsupported length and the scantlings for all other beams
were determined as being the same as this one. The required cross-sectional properties are
shown in Table 19. Keeping the thicknesses the same as Concept A, the selected web height
and flange width of the beams are shown in Table 20, along with the resulting values for
cross-sectional properties for a comparison with required section properties of the beams.
Table 19. Required sectional modulus (Z), cross-sectional area (A) and moment of inertia (I)
of the edge longitudinal beam for three different cases.
n Z (cm3) A (cm2) I (cm4)
2 663 3.8 13551
3 442 2.5 9034
4 332 1.9 6776
Table 20. The selected web height and flange.
n HW (mm) WF (mm) Z (cm3) A (cm2) I (cm4)
2 334 100 679 22 20479
3 294 90 567 19 14592
4 264 80 450 17 10169
The scantlings for secondary stiffeners were also calculated according to DNV Rules [19].
The outermost stiffener with the largest unsupported length is the worst case, and the required
section modulus for all the cases was calculated as 117 cm3 (this value is the same for all
cases, since they all have the same unsupported length). An L-section of 130 x 65 mm with a
thickness of 10 mm, which has a section modulus of 125 cm3, is selected.

41
The analysis results obtaining the maximum von Mises stress, the total and the edge
deflection and the weight with the number of frame beams n = 1, 2, 3 and 4 equally spaced
along the plate are listed in Table 21. n = 1 indicates that only the edge beams are used (Fig.
25a). It is obvious that n = 2 (Fig. 25b) is the optimum number of beam frames to be used.
Table 21. Comparison of crossed-beam car decks with a different numbers of frames.
nMax. Von Misses
(MPa)
Total deflection
(mm)
Edge deflection
(mm)
Weight
(t)
1 266 95 72 13.9
2 234 85 67 14.8
3 268 179 87 15.9
4 291 124 106 15.7
Figure 26 shows the selected configuration for Concept C. The frame mainly helps to transfer
the loads to the main beams. The transverse beams of the frame are parallel to the secondary
stiffeners, while acquiring a much shorter unsupported length. So, the stronger contribution of
the secondary stiffeners renders the transversal beams of the frame unimportant and they
could be excluded.
Table 22 shows the related parameters and their initial values. To avoid difficulties in
automatic mesh creation, the web height of all beams is kept as a unique parameter.
Fig. 26. Car deck panel Concept C with 2 longitudinal beams between the cross-beams.
Symmetry line
T1
L2
L1
d3
y
z
x
42
Table 22. Parameterization of the dimension of car deck with crossed beams.
Parameter Definition Initial value
(mm)
Lower limit
(mm)
Upper limit
(mm)
WF_L1 Flange width of edge
longitudinal beams 100 50 250
WF_L2 Flange width of middle beams 100 50 250
WF_T1 Flange width of edge transverse
beams 100
50 250
WF_C Flange width of the crossed
beams 300
200 500
TW_L1 Web thickness of edge
longitudinal beams 6 4 15
TW_L2 Web thickness of edge middle
beams 6
4 15
TW_T1 Web thickness of edge
transverse beams 6
4 15
TW_C Web thickness of the crossed
beams 6
4 15
TF_L1 Flange thickness of edge
longitudinal beams 20 10 30
TF_L2 Flange thickness of edge middle
beams 20
10 30
TF_T1 Flange thickness of edge
transverse beams 20 10 30
TF_C Flange thickness of the crossed
beams 30
20 40
HW Web height of beams 334 265 400
D3 Longitudinal distance from the
plate edge to middle beams 2700 1700 3700
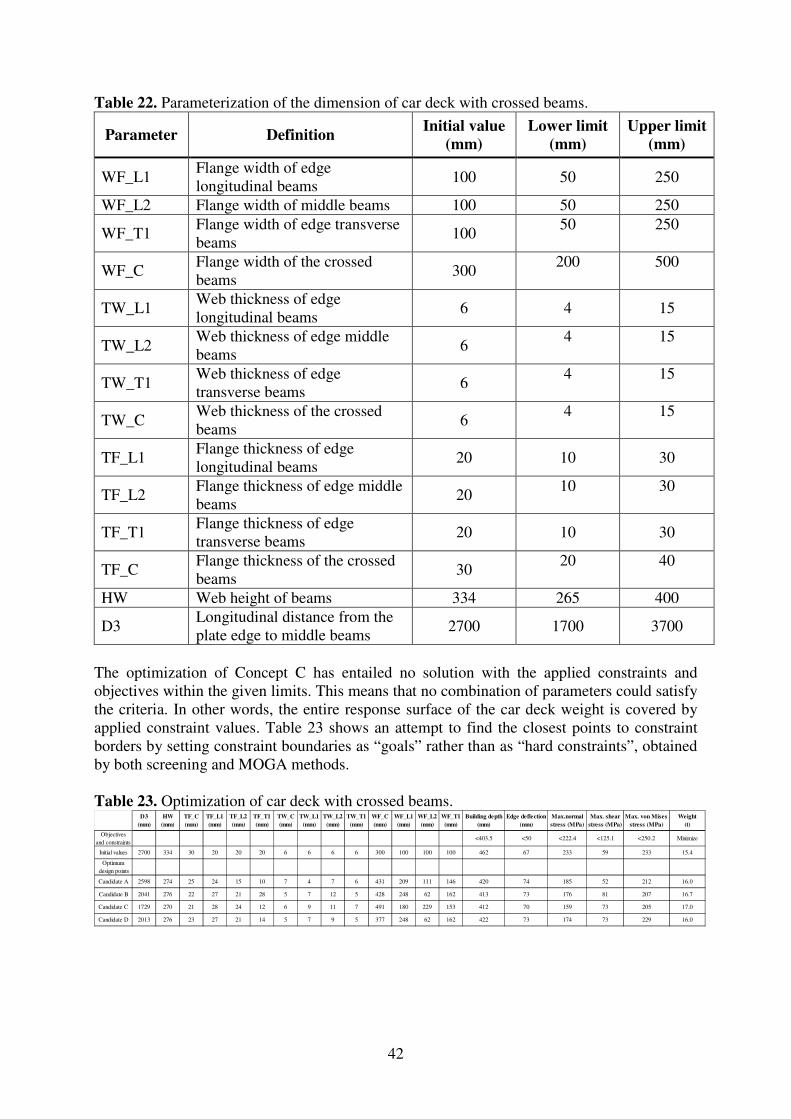
The optimization of Concept C has entailed no solution with the applied constraints and
objectives within the given limits. This means that no combination of parameters could satisfy
the criteria. In other words, the entire response surface of the car deck weight is covered by
applied constraint values. Table 23 shows an attempt to find the closest points to constraint
borders by setting constraint boundaries as “goals” rather than as “hard constraints”, obtained
by both screening and MOGA methods.
Table 23. Optimization of car deck with crossed beams. D3
(mm)
HW
(mm)
TF_C
(mm)
TF_L1
(mm)
TF_L2
(mm)
TF_T1
(mm)
TW_C
(mm)
TW_L1
(mm)
TW_L2
(mm)
TW_T1
(mm)
WF_C
(mm)
WF_L1
(mm)
WF_L2
(mm)
WF_T1
(mm)
Building depth
(mm)
Edge deflection
(mm)
Max.normal
stress (MPa)
Max. shear
stress (MPa)
Max. von Mises
stress (MPa)
Weight
(t)
Objectives
and constraints<403.5 <50 <222.4 <125.1 <250.2 Minimize
Initial values 2700 334 30 20 20 20 6 6 6 6 300 100 100 100 462 67 233 59 233 15.4
Optimum
design points
Candidate A 2598 274 25 24 15 10 7 4 7 6 431 209 111 146 420 74 185 52 212 16.0
Candidate B 2041 276 22 27 21 28 5 7 12 5 428 248 62 162 413 73 176 81 207 16.7
Candidate C 1729 270 21 28 24 12 6 9 11 7 491 180 229 153 412 70 159 73 205 17.0
Candidate D 2013 276 23 27 21 14 5 7 9 5 377 248 62 162 422 73 174 73 229 16.0
43
8. Discussion
Optimization results highly depend on the geometry, the applied loads and the boundary
conditions of a car deck panel. The number of parameters and their varying impact makes the
structure’s adaptation to change unpredictable. Therefore, a new set of analyses is required if
the working condition of the car deck or its geometry is changed.
The quality of geometry codes allowing for more flexibility in parametric study plays a
significant role in ensuring the progress towards an optimum solution. It is a challenging task
to create a code with parameters, such as the number and the spacing of stiffeners as well as
the scantlings while controlling an appropriate mesh to be created for all design points.
Limited time in this project resulted in a step-wise optimization procedure (as in Concepts B
and C). Hence, either the number or the spacing of stiffeners was optimized first. The
optimum solution was then used as a constant parameter further on in the investigation. This,
however, could raise the question of whether the first obtained solution would remain the
optimum one in the second-run optimization.
There is a balance that has to be maintained in the parametric sensitivity analysis regarding
the number of input parameters. Since different parameters have conflicting influences on the
objective and constraint functions, using too many of them is not likely to end in obtaining
satisfactory results. Too few input parameters, on the other hand, will constrain the
optimization process and limit the reduction in the objective function.
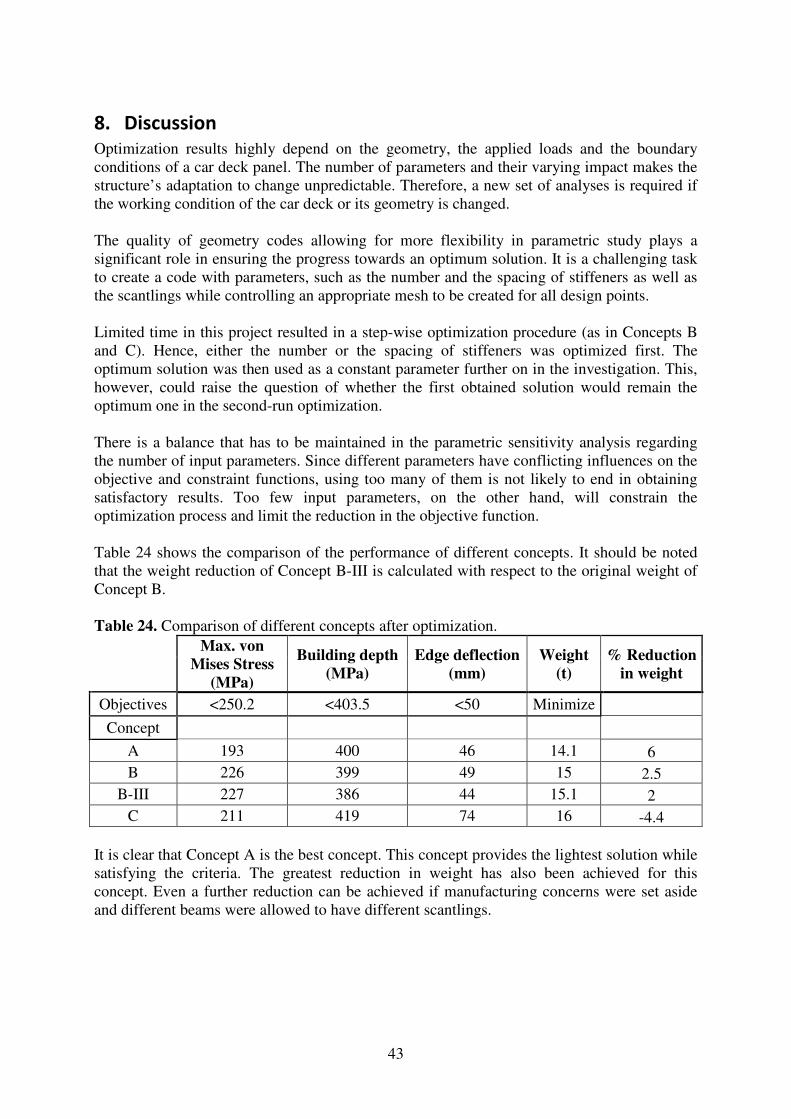
Table 24 shows the comparison of the performance of different concepts. It should be noted
that the weight reduction of Concept B-III is calculated with respect to the original weight of
Concept B.
Table 24. Comparison of different concepts after optimization.
Max. von
Mises Stress
(MPa)
Building depth
(MPa)
Edge deflection
(mm)
Weight
(t)
% Reduction
in weight
Objectives <250.2 <403.5 <50 Minimize
Concept
A 193 400 46 14.1 6
B 226 399 49 15 2.5
B-III 227 386 44 15.1 2
C 211 419 74 16 -4.4
It is clear that Concept A is the best concept. This concept provides the lightest solution while
satisfying the criteria. The greatest reduction in weight has also been achieved for this
concept. Even a further reduction can be achieved if manufacturing concerns were set aside
and different beams were allowed to have different scantlings.

44
The top plate of the panel covers a large area. A small reduction in plate thickness leads to a
noticeable reduction in the weight of the panel. However, it was kept constant in this project
in order to avoid thermal residual stresses. It is nonetheless possible that with developing
welding technology and skilled welders this problem could be overcome.
Optimization of Concept B led to the structural arrangement in B-III that is very similar to
Concept A. B-III is only marginally heavier than Concept B, but has a much simpler
geometry, making it much easier and cheaper to produce. Furthermore, when produced in
reality, B-III is likely to end up lighter than B, since it requires less welding and paint. Since
Concept A had in fact been obtained by developing Concept B, there is good agreement
between the methodology used in this project and the logic behind the improvements made to
Concept B in the industry.
The criterion “Building Depth” is obtained by adding the moulded depth of the panel to the
maximum deflection that occurs at the flanges in the middle, where the global deflection is
also at a maximum. Thus, a heavier structure is needed to lower the deflection in the middle
point of the panel to reduce the “building depth” as was the case for Concepts B-II and C.
Hence, positioning beams crossing the centre of the panel is not to be recommended.
Diagonally positioning the main beams involves a further disadvantage as it increases the load
area that they need to support.

45
9. Conclusions
The FE method has been utilized to model and assess a reference car deck with respect to
design criteria such as the normal, shear and von Mises stresses occurring in the structure;
maintaining the required free height above the fixed deck below, and the deflection occurring
along the panel’s edge. The structure was weight-optimized by means of numerical
optimization with certain dimensions defined as parameters, whose upper and lower limits are
influenced by operational and manufacturing issues. The lightest possible solution was later
compared to alternative solutions, which were either recommended by TTS or designed based
on the results achieved from previously considered concepts.
• A weight reduction of 6% was achieved with the reference concept (A).
• The concept (B) that had previously been provided by TTS was optimized in the same way
yielding a weight reduction of 2.5%.
• A reduction of 2% was, in turn, achieved from the starting point of Concept B, with a new
concept (B-III). The two-edge longitudinal beams were connected with a flange, forming a
box beam; the transverse beams near the edges standing very close to each other were
replaced with one beam each, and the two in the middle were removed. This final
generation is actually regarded as more optimal by having a much simpler geometry.
• A final concept (C), having the main beams placed diagonally, was developed without
satisfactory results. It had a poor performance in satisfying design criteria and the final
model was the heaviest among the concepts.
From the parametric sensitivity analysis it can be seen that the secondary stiffeners offer a
relatively small contribution to the global stiffness of the panel compared to the primary ones.
So, placing the main beams within an optimum distance would improve the performance of
the panel. Unlike most conventional deck structures, it is fixed only at its corners while
having a strict criterion on edge deflection. In designing such structures, the analysis showed
that denser beam spacing towards the edges would improve the design rather than spacing
them equally. Meanwhile, one should avoid placing the beams passing through the centre of
the panel to minimize its building depth.
The conventional design still proves to be more weight-efficient than possible alternative
designs. In the same way, looking at Concept B and its “children”, it can be concluded that
just by simplifying the structural configuration, a design with a similar weight and
performance can be achieved. Moreover, it is more convenient in terms of manufacturing and
maintenance owing to the simplicity of its geometry.
Parametric study, optimization and use of FE analysis appear to create a consistent
methodology in designing a car deck if the parameterization is handled with care. However,
existing design rules and engineering logic are essential in obtaining starting design points. It
can be concluded that by utilizing optimization techniques, a relatively better solution could
be reached as the optimum dimensions for scantlings are found. Otherwise, no major change
could be made to the structural arrangement in order to achieve a lighter car deck panel. It is
reasonable to expect that improvements in the structural design of car deck panels owing to
developments in material and manufacturing technologies will occur in the future. This will
most certainly allow numerical optimization methods to be more successful in this area.

46
47
10. Future work
Reducing computational time to allow for a sufficient number of different concepts to be
examined meant that certain limitations had to be accepted and some assumptions had to be
made. Having this in mind, the following points are suggested for consideration in future
work:
• Conventional T and L-shaped stiffeners in a grillage system was adopted in this project,
while the plate stiffening can be done by other various open or closed shaped beams, i.e.
with the use of trapezoidal stiffeners.
• The attention in this project has been directed towards the global strength of car decks
under uniformly distributed loads. However, other factors such as local deformations due
to vehicle axle loads and buckling of the plate as a constraint are highly recommended for
further study.
• As far as the ultimate strength capacity of the structures is concerned, collapse due to
buckling is suggested as an important factor to be incorporated in future studies.
• Only a static stress analysis has been in the scope of the project presented in this thesis.
Investigating dynamic effects will without doubt lead to more feasible solutions.
• It is suggested that a more sensitive optimization method be adopted for this task, perhaps
with a systems engineering approach and assigning different weights to different
parameters, constraints and objectives.
• The current investigation was carried out on a particular reference panel on a particular
ship. Expanding the analysis by defining several parameters such as ship size, speed,
position and the size of the panel, type and weight of vehicles, area of operation, etc., are
necessary items if one wants to find out whether different concepts can be optimal for
different cases.
• It is seen that not much can be gained by utilizing unorthodox configurations for this
reference case. However, combined with a better focus on manufacturing techniques and
exploiting alternative materials, it is highly possible that much lighter car deck solutions
can be obtained.
• The aim of this master’s thesis project has been achieved by linear analysis, assuming that
the yield limit is not exceeded. However, material non-linear analysis could be necessary
to reach results closer to reality, especially in regions of high stresses, such as sharp
corners where the material might start behaving plastically.
• All FE analyses in this project were made with constant loads. In real life, however, marine
structures are subjected to cyclic loads arising from ship motions and encounter with
waves. It is recommended for further study to incorporate fatigue design into design
criteria for such structures.

48

49
11. References
[1] J. B. Jia and A. Ulfvarson, "A Parametric Study for the Structural Behaviour of a
Lightweight Deck", Engineering Strctures, vol. 26, no. 7, pp. 963-977, 2004.
[2] M. M. Alinia, "A Study into Optimization of Stiffeners in Plates Subjected to Shear
Loading", Thin-Walled Structures, vol. 43, no. 5, pp. 845-860, 2005.
[3] E. Maiorana, C. Pellegrino and C. Modena, "Influence of Constructional Stiffeners on
Elastic Stability of Girder Webs", Journal of Constructional Steel Research, vol. 67, no.
1, pp. 51-64, 2011.
[4] M. M. Alinia and S. H. Moosavi, "A Parametric Study on the Longitudinal Stiffeners of
Web Panels", Thin-Walled Structures, vol. 46, no. 11, pp. 1213-1223, 2008.
[5] W. Nie and C.-Y. Ma, "A Comparative Study on the Hull Strength of a Ship with Thin-
Walled Box Girders", Journal of Marine Science and Application, vol. 5, no. 3, pp. 11-
16, 2006.
[6] G. N. Vanderplaats, "Effective use of Numerical Optimization in Structural Design",
Finite Elements in Analysis and Design, vol. 97, no. 112, pp. 97-112, 1989.
[7] V. Kumar,.. J. Lee and M. D. German, "Finite Element Design Sensitivity Analysis and
its Integration with Numerical Optimization Tecniques for Structural Design",
Computers and Structures, vol. 32, no. 3/4, pp. 883-897, 1989.
[8] B. Brosowski and K. Ghavami, "Multi-Criteria Optimal Design of Stiffened Plates - II.
Mathematical Modelling of the Optimal Design of Longitudinally Stiffened Plates",
Thin-Walled Structures, vol. 28, no. 2, pp. 179-198, 1997.
[9] G. N. Vanderplaats and F. Moses, "Structural Optimization by Methods of Feasible
Directions", Computers and Structures, vol. 3, no. 4, pp. 739-755, 1973.
[10] ANSYS, Inc., Ansys 13.0 help.
[11] D. C. Montgomery, Design and Analysis of Experiments, Hoboken, NJ: John Wiley and
Sons, 2009.
[12] J. Antony, Design of Experiments for Engineers and Scientists, Oxford; Burlinton, MA:
Butterworth-Heinemann, 2003.
[13] A. Dean and D. Voss, Design and Analysis of Experiments, New York: Springer Verlag,
1999.
[14] ANSYS, Inc., "ANSYS Parametric Design Language Guide", April 2009. [Online].
Available: http://www.ansys.com. [Accessed in April, 2012].
[15] J. Bonnans, J. Gilbert, C. Lemaréchal and C. Sagastizábal, Numerical Optimization,
Berlin; Heidelberg; New York: Springer Verlag, 1997.
[16] A. Bhatti, Practical Optimization Methods, New York: Springer Verlag, 2000.
[17] J. Nocedal and S. J. Wright, Numerical Optimization, New York: Springer Verlag, 2000.
[18] C. Y. Lin and P. Hajela, "Design Optimization with Advanced Genetic Search
Strategies", Advances in Engineering Software, vol. 21, no. 3, pp. 179-189, 1994.
[19] DNV, Rules for Classification of Ships, Det Norske Veritas, Hövik, Norway, 2011.
[20] TTS Ships Equipment AB, "TTS Ships Equipment AB Strength Calculation - Typical CL
Panel for Car Decks", Gothenburg, Sweden, 2009.