Parameters of Odor - St. Croix Sensory, Inc.fivesenses.com/Documents/Library/StCroixSensory... ·...
12
Parameters of Odor St. Croix Sensory specializes in quantification of perceived odors of environmental air samples and commercial products and materials. Odors are the sensory perception resulting from odorants (chemicals) stimulating olfactory receptors [ASTM E253]. Odors can be quantified by five parameters that profile the human response. These parameters include: odor threshold values, odor intensity, odor persistency, hedonic tone, and odor characterization. The following is a brief explanation of these parameters of odor evaluation services provided by St. Croix Sensory. For environmental odor samples, an odorous air sample, collected in an air sample bag, is evaluated. For product and material testing, the sample may also be from an air sample bag or it may be a direct observation of a headspace developed around the sample or from an environmental test chamber. Odor Thresholds The most common measure of odorous air samples is the odor threshold value (OTV), also referred to as the “odor concentration”. Odor concentration is quantified by determining the amount of dilution needed to bring the odorous air sample to its threshold. The higher the threshold value, the more dilution is needed to bring the odor to threshold, thus the “stronger” the odor. The odor threshold is determined by trained human assessors observing presentations of the odorous air sample dynamically diluted with an olfactometer. The testing procedures follow ASTM International E679, Standard Practice for Determination of Odor and Taste Thresholds by a Forced-Choice Ascending Concentration Series Method of Limits, and EN13725, Air Quality – Determination of Odour Concentration by Dynamic Olfactometry. EN13725, the official standard of all European Union countries, exceeds the requirements of ASTM E679 with additional, detailed QA/QC requirements. These testing standards utilize a presentation method called 3-alternative forced-choice (3-AFC) also known as triangular forced-choice (TFC). Each assessor performs the odor evaluation task by sniffing diluted odorous air from the olfactometer. The assessor sniffs three sample presentations; one contains the diluted odor while the other two are odor-free air. They must then select the one of the three that is different from the other two. The assessor is required (forced) to choose one of the three and acknowledge their response as a “guess”, “detection”, or “recognition”, as defined by ASTM E679.
Transcript of Parameters of Odor - St. Croix Sensory, Inc.fivesenses.com/Documents/Library/StCroixSensory... ·...

Parameters of Odor St. Croix Sensory specializes in quantification of perceived odors of environmental air samples and commercial products and materials. Odors are the sensory perception resulting from odorants (chemicals) stimulating olfactory receptors [ASTM E253]. Odors can be quantified by five parameters that profile the human response. These parameters include: odor threshold values, odor intensity, odor persistency, hedonic tone, and odor characterization. The following is a brief explanation of these parameters of odor evaluation services provided by St. Croix Sensory. For environmental odor samples, an odorous air sample, collected in an air sample bag, is evaluated. For product and material testing, the sample may also be from an air sample bag or it may be a direct observation of a headspace developed around the sample or from an environmental test chamber. Odor Thresholds The most common measure of odorous air samples is the odor threshold value (OTV), also referred to as the “odor concentration”. Odor concentration is quantified by determining the amount of dilution needed to bring the odorous air sample to its threshold. The higher the threshold value, the more dilution is needed to bring the odor to threshold, thus the “stronger” the odor. The odor threshold is determined by trained human assessors observing presentations of the odorous air sample dynamically diluted with an olfactometer. The testing procedures follow ASTM International E679, Standard Practice for Determination of Odor and Taste Thresholds by a Forced-Choice Ascending Concentration Series Method of Limits, and EN13725, Air Quality – Determination of Odour Concentration by Dynamic Olfactometry. EN13725, the official standard of all European Union countries, exceeds the requirements of ASTM E679 with additional, detailed QA/QC requirements. These testing standards utilize a presentation method called 3-alternative forced-choice (3-AFC) also known as triangular forced-choice (TFC). Each assessor performs the odor evaluation task by sniffing diluted odorous air from the olfactometer. The assessor sniffs three sample presentations; one contains the diluted odor while the other two are odor-free air. They must then select the one of the three that is different from the other two. The assessor is required (forced) to choose one of the three and acknowledge their response as a “guess”, “detection”, or “recognition”, as defined by ASTM E679.

Parameters of Odor
St. Croix Sensory, Inc. ©2018 2
After the first set of presentations, the assessor is then presented with the next dilution level. At this next level, the assessor is again presented with three sample choices, one of which is the diluted odor sample. However, this next dilution level presents the odor at a higher concentration (i.e. two times higher), which is one-half the dilution ratio (fewer number of dilutions = higher concentration). The first dilution level presented to the assessors is below the odor threshold (subthreshold). The assessor proceeds to higher levels of sample presentation following these methods until the odor concentration is above the recognition threshold. This presentation sequence is called the ascending concentration series. The Individual Threshold Estimates (ITEs) are computed for each assessor based on the dilution levels where correct detection or recognition responses are recorded. The responses of all assessors are averaged to determine the sample’s detection and recognition thresholds. The dynamic dilution of an odorous emission is the physical process that occurs in the atmosphere down-wind of the odor source or during mixing within an indoor space as an individual or citizen from the community observes the diluted odor. The dilution ratio is an estimate of the number of dilutions needed to make the actual odor emission just detectable. This is known as the Detection Threshold (DT). The Recognition Threshold (RT) is the dilution ratio at which the assessor first detects the odor’s character (“smells like…”). The recognition threshold value is always lower than the detection threshold value since it takes more dilution to bring an odor to its detection threshold (no odor present) compared to its recognition threshold (odor is not recognizable). The odor threshold is reported as a dimensionless dilution ratio; however, often the pseudo-dimensions of odor units (ou) are used. Units of odor units per cubic meter (ou/m3) are also commonly applied in order to calculate odor emission rates. For the testing, St. Croix Sensory utilizes an AC’SCENT® International Olfactometer, a dynamic dilution triangle olfactometer, operating at 20-LPM with 5-10 assessors, who complete the threshold determination a minimum of two times [EN13725]. Final results are retrospectively screened in order to evaluate and identify assessors who may have a specific hypersensitivity or anosmia to the odor sample presented. The assessors are tested and “certified” with a standard odorant (n-butanol) and are required to meet specific sensitivity criteria outlined in the European testing standard, EN13725. These assessors are required to have an average n-butanol detection threshold between 20-80 ppb based on their last 20 evaluations. Assessors also must maintain a defined standard deviation of n-butanol threshold measurements in order to satisfy repeatability requirements of the standard.
Parameters of Odor
St. Croix Sensory, Inc. ©2018 3
Below are example odor threshold value results of two odor samples, inlet and outlet samples of an example odor control system. The inlet is considerably higher in odor than the outlet sample with detection threshold values of 13,000 for the inlet and 450 for the outlet. These results show an odor control reduction efficiency of 97% ([13,000-450]/13,000 * 100%) [EN13725].
Odor Intensity Odor intensity is the perceived strength of the odor above the Recognition Threshold (suprathreshold). The intensity of an odor is referenced on the ASTM Odor Referencing Scale described in ASTM E544, Standard Practice for Referencing Suprathreshold Odor Intensity. St. Croix Sensory utilizes a 10-point static scale of aqueous butanol solutions for the standard procedure of odor intensity referencing. The odor intensity referencing is accomplished by assessors comparing the odor intensity of the sample to the reference odorant, n-butanol, aqueous solutions in 10 glass sniffing jars that make-up a series of increasing concentrations of the butanol. The series starts at 25-ppm butanol in water and has an increasing concentration ratio of 2 (binary scale), as shown in the table below. Each assessor observes the odorous air sample and determines the odor intensity on the 10-point scale. The average scale value of the panel of assessors is the reported intensity for the odor sample. A larger value of butanol concentration means a stronger odor. The Odor Intensity Referencing Scale serves as a standard method to quantify the intensity of odors for documentation and comparison purposes. The odor evaluation report example above includes the odor intensity values for the inlet and outlet odor control system samples. These results show the odor intensity of the inlet sample, 6.3 (~900ppm n-butanol in water), is considerably stronger than the outlet sample, 2.7 (~80ppm n-butanol in water).

Parameters of Odor
St. Croix Sensory, Inc. ©2018 4
St. Croix Sensory’s Odor Intensity Referencing Scale (ASTM E544). The 10-point scale is a series of concentrations of n-butanol in water with starting point of 25ppm and an increasing concentration step factor of two.
Static Scale Level
Word Scale Reference
n-Butanol Concentration (ppm in water)
0 no odor 0 1 just perceptible 25 2 very slight 50 3 slight 100 4 slight-moderate 200 5 moderate 400 6 slightly strong 800 7 moderately strong 1,600 8 strong 3,200 9 very strong 6,400
10 extremely strong 12,800 Odor Persistency (Dose-Response Function): Odor is a psychophysical phenomenon; the perceived odor intensity changes with concentration. Odor persistency is a term used to describe the rate at which the perceived intensity decreases as the odor is diluted, i.e. in the atmosphere down-wind from the odor source. The rate of change in intensity versus odor concentration is not the same for all odors. The odor intensity is related to the odor concentration by the following equation (Steven’s Law),
I = k (C)n Where: I is the odor intensity expressed in ppm n-butanol; C is the odor concentration expressed in number of dilutions (dilution ratio); and k & n are constants that are different for specific odorants or odorant mixtures.
This odor persistency relationship is a Dose-Response function (a psychophysical power function), which is linear on a log-log scale with the following equation:
Log I = n Log C + log k

Parameters of Odor
St. Croix Sensory, Inc. ©2018 5
The Dose-Response function is determined from intensity measurements of an odor at a minimum of three dilutions, utilizing ASTM E544, Standard Practice for Referencing Suprathreshold Odor Intensity. The plotted logarithmic values of the presented odor dilution ratios (concentrations) and the reported odor intensities create the Dose-Response function of the odor sample. The resultant straight line of the log-log plot is specific for each odor, with the slope of the line, n, representing relative persistency and the y-axis intercept, k, representing the full-strength intensity. A flatter slope of an odorant mixture represents a more persistent odor. The following figure shows this Dose-Response function with data collected at St. Croix Sensory. In this graphic, intensity is displayed as the log of the butanol reference concentration.
This Dose-Response, persistency, graph can be converted to a Power Law graph showing how the intensity changes with the odor concentration, represented in odor units. This conversion is completed by taking the recognition threshold of the odorous air sample, the full-strength odor concentration, into consideration. The number of odor units presented at each diluted odor presentation can be determined by dividing the Recognition Threshold (RT) by the Dose-Response dilution ratio test points. For example, if the RT (full strength odor concentration) is 2000 ou and the assessor is presented with this odor at 40 dilutions, then the assessor was presented with an odor that is has 50 ou. The power law relationship can then be represented as:
Log I = n’ Log (RT/C) + Log k’ This equation will have a positive slope. The slopes of the two curves are related by
n = - n’
0.0
0.5
1.0
1.5
2.0
2.5
3.0
0.0 0.5 1.0 1.5 2.0 2.5 3.0
Resp
onse
(Log
of P
PM n
-but
anol
Odo
r Int
ensit
y)
Dose (Log of the Dilution Ratio)
Odor Intensity of full strength odor sample (i.e. no dilution)
Intensity determined by panel of assessors at different dilutions of the odor sample.
Log I = n Log C + Log k
I is the Odor Intensity as n-butanol intensity reference scale
C is the Dilution Ratio of the odor sample
k and n are constants for the odor samples

Parameters of Odor
St. Croix Sensory, Inc. ©2018 6
This positive slope of the Power Law graph illustrates that the odor intensity of odorants increases as the mass concentration increases. The following graphs illustrate the persistency curves for the odor control system examples. The 10-point n-butanol scale used at St. Croix Sensory is a geometric progression (logarithmic) and thus a log conversion of the values is not necessary for plotting the Dose-Response function. The inlet sample has a recognition threshold of 8,000 ou. The assessors were presented with this odor sample at full strength and at dilution ratios of 7, 16, and 100. The outlet sample was presented to assessors at full strength and at dilution ratios of 3, 10, and 20. The odor control system outlet has a flatter slope than the inlet sample, intensity drops less per unit of dilution. The lower left graphic shows that by 20 dilutions, the odor intensity of the outlet has already decreased to faint odor intensity less than 2.0. The lower right graphic shows that at this odor intensity the odor concentration is 10 ou. Odor Control System Inlet
Odor Control System Outlet

Parameters of Odor
St. Croix Sensory, Inc. ©2018 7
Hedonic Tone Hedonic Tone (HT) is a measure of the pleasantness or unpleasantness of an odor sample. An arbitrary but common scale for ranking odor by hedonic tone is the use of a 21-point scale:
+10 Most Pleasant 0 Neutral -10 Most Unpleasant
The assigning of a hedonic tone value to an odor sample by an assessor is “subjective” to the assessor. An assessor uses her/his personal experiences and memories of odors as a referencing scale. The assessor, during training, becomes aware of their individual odor experience and memory referencing. The average value of all assessors is the reported hedonic tone (HT) for the odor sample. It is important to note that the hedonic tone values provided by the trained assessors should not be considered to represent the opinions of the general population. The values should be used for relative comparison of the pleasantness between samples within one test session since they would be observed by the same panel of assessors. The hedonic tone values for the odor control system samples show a change in the unpleasant odors. The inlet has a hedonic tone value of -4.5, while the outlet has a more neutral hedonic tone of -0.8.
Odor Characterization The character of an odor, also referred to as “odor quality,” is reported using standard descriptor lists. Assessors report both what the odor “smells like” (e.g. earth, fruit, etc.) and what the odor “feels like” (e.g. burning, cooling, etc.) Assessors also report relative strengths of the different character descriptors identified.

Parameters of Odor
St. Croix Sensory, Inc. ©2018 8
Odor Descriptors Numerous standard odor descriptor lists are available to use as a referencing vocabulary. St. Croix Sensory has developed an odor descriptor wheel based on eight (8 recognized odor descriptor categories, including Naturally Offensive (e.g. sulfur, decay), Marine (e.g. fish), Animal (e.g. sweat, urine), Chemical (e.g. petroleum, plastics, medicinal), Earth (e.g. wood, burnt, earthy), Vegetation (e.g. vegetables and vegetation), Naturally Pleasant (e.g. Fruity and Floral), and Culinary (e.g. grain, herbal, spice, dairy, confectionary). Subcategories (2nd tier) and example specific descriptors (3rd tier) within each of these odor categories are presented in the odor wheel. Additionally, categories for Trigeminal Sensations (e.g. burn, tingle, cool) and Taste experiences (e.g. sweet, sour) are presented.
Trig
erm
inal
Taste
CustomCustom
Culinary
Naturally
Pleasant
Vege
tatio
n
Nat
urall
yOffe
nsive
Marine
Animal
Chemical
Earth
Burn
Astr
inge
ntCo
ol
Met
allic
Ting
leFe
cal
Sew
erM
anur
eSk
unk
Dead A
nim
al
Putri
dRancid
Garbage
Seaweed
Ocean
Fresh Fish
Dead Fish
Sweat
Urine
Blood
Cooked Meat
TarGasoline
DieselCar ExhaustLatexVinyl
RubberStyrofoamChlorineAmmoniaAlcoholVinegarMoldMustyDirtMushrooms
PineCedar
OakOld Wood
Hot Electric
Cigarette
Smoky
Wood Sm
oke
CustomCustom
Sens
atio
n
Sul
fur
Decay
Sea
Fish
Animal
Petroleum
Plastics
Medicinal Earth
Wood Burnt
Taste
Grain
Herbal
Spice
Dairy
Confectionary
Floral
Frui
t
Sulfi
dic
Non
-sul
fidic
Vege
tatio
nSour
SaltySw
eet
Bitter
Umam
i
Custom
Custom
Custom
Custom
Custom
Custom
Custom
CustomYeastToastBreadMaltSageEucalyptusMintDill
GingerCumin
Black PepperCinnamon
Sour Milk
Butter
Milk
Cheese
Nutty
Vanilla
Cocoa
Maple
Lily
Lilac
Lavender
RoseLe
mon
AppleCo
conu
tRa
isin
Broc
coli
Cabb
age
Garli
cO
nion
Tom
ato
Corn
Cele
ryCu
cum
ber
Swam
py
Toba
cco
Hay
Gras
sy
Odor Wheel ©2016 St. Croix Sensory, Inc.

Parameters of Odor
St. Croix Sensory, Inc. ©2018 9
Each assessor rates the second-tier subcategories of these descriptors on the 10-point Odor Intensity Referencing Scale. The average results of the panel of all assessors are plotted on an Odor Rose™ diagram for each sample. An example Odor Rose for the odor control system inlet shows highest intensity of the sulfur character attribute, followed by low intensity of decay, fish, animal, earth, and sulfidic vegetable, as well as reporting of trigeminal sensations. Odor Control System Inlet

Parameters of Odor
St. Croix Sensory, Inc. ©2018 10
The Odor Rose for the odor control system outlet shows a reduction in the intensity of all odor characters. Sulfur, fish, sulfidic vegetable characters and trigeminal sensations are now not reported. Decay, animal, and earth are reduced in intensity. Herbal character is now present in the outlet at low intensity. Odor Control System Outlet

Parameters of Odor
St. Croix Sensory, Inc. ©2018 11
A spider graph (i.e. radar or polar plot) can be utilized to directly compare samples by overlaying the character profiles of multiple samples. Here the inlet and outlet samples are overlaid to show the reduction in intensity of the odor descriptors.
SensationDecay
Sulfur
Fish
Sea
Animal
Medicinal
Plastics
Petroleum
Burnt
Wood
EarthSulfidic
vegetable
Non-sulfidic
vegetable
Vegetation
Floral
Fruit
Grain
Herbal
Spice
Dairy
Confectnry
Taste
No Odor
Inlet
Outlet
2.0
4.0
6.0
0.0
8.0
10.0

Parameters of Odor
St. Croix Sensory, Inc. ©2018 12
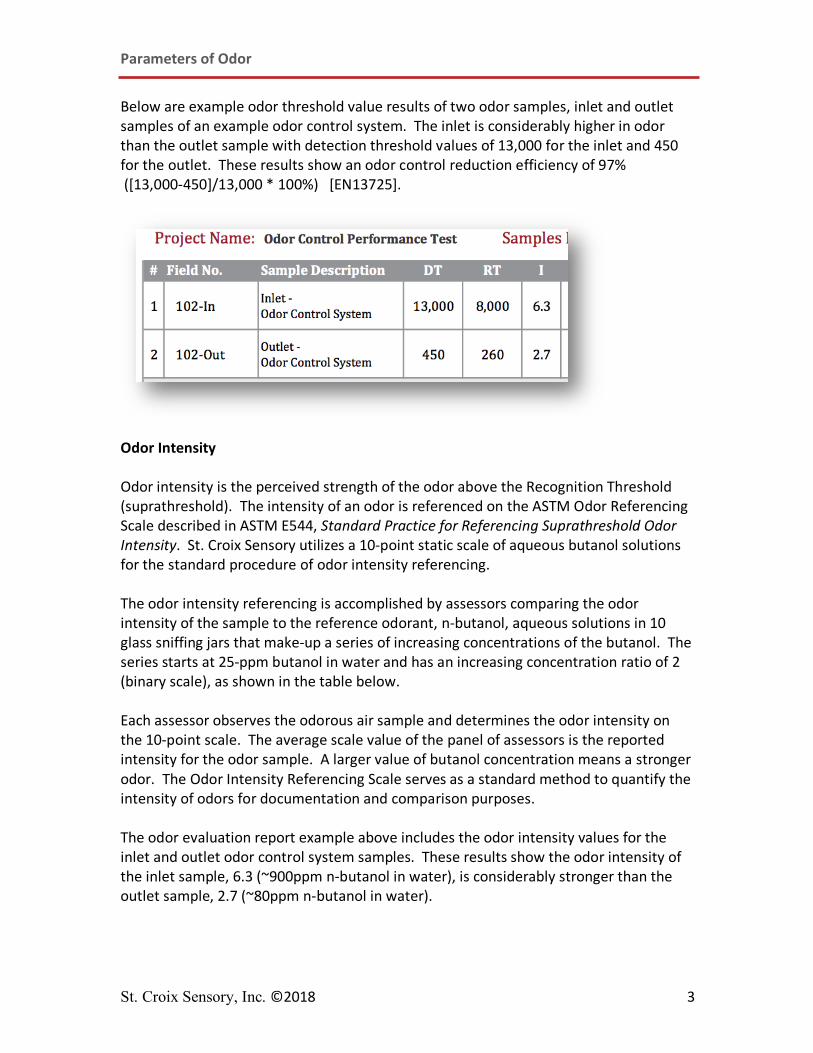
A histogram presents the percentage of assessors in the panel that assigned specific descriptors to the odor sample. Some odors are very distinguishable and show few characters with higher percentages of assessors reporting. Complex odors often have more characters listed with fewer numbers of assessors reporting each. Fewer assessors reported trigeminal sensation, sulfur, fish, animal, and sulfidic vegetable characters in the outlet sample. The outlet sample had an increase in the number of assessors reporting medicinal and herbal characters. The same number of assessors reported decay and earth character in both the inlet and outlet samples. Odor Control System Inlet Odor Control System Outlet St. Croix Sensory technical staff works closely with our clients to discuss the specific odor evaluation needs of each project to provide valuable results.