Parameterization of EUSES Chemical Fate Model for Israel: EUSES-IL Ella Cohen-Hilaleh Mary Kloc June...
46
Parameterization of EUSES Chemical Fate Model for Israel: EUSES-IL Ella Cohen-Hilaleh Mary Kloc June 2010
-
Upload
lynn-whitehead -
Category
Documents
-
view
214 -
download
1
Transcript of Parameterization of EUSES Chemical Fate Model for Israel: EUSES-IL Ella Cohen-Hilaleh Mary Kloc June...

Parameterization of EUSES Chemical Fate Model for
Israel: EUSES-IL Ella Cohen-Hilaleh
Mary Kloc
June 2010

Project Outlines
• Introduction
• Model description – EUSES.
• Data collection.
• Findings – test case, sensitivity analysis.
• Conclusion.

Project outlines• Pollution of natural resources is a main concern of
the developing world.
• Pollution sources:Natural sources – fire, oil leak, saline springs…Man-made sources – industrial spills, agricultural fertilizers and pesticides, domestic sewage, transportation emissions…
Prediction of pollutant concentration in the environment is required.
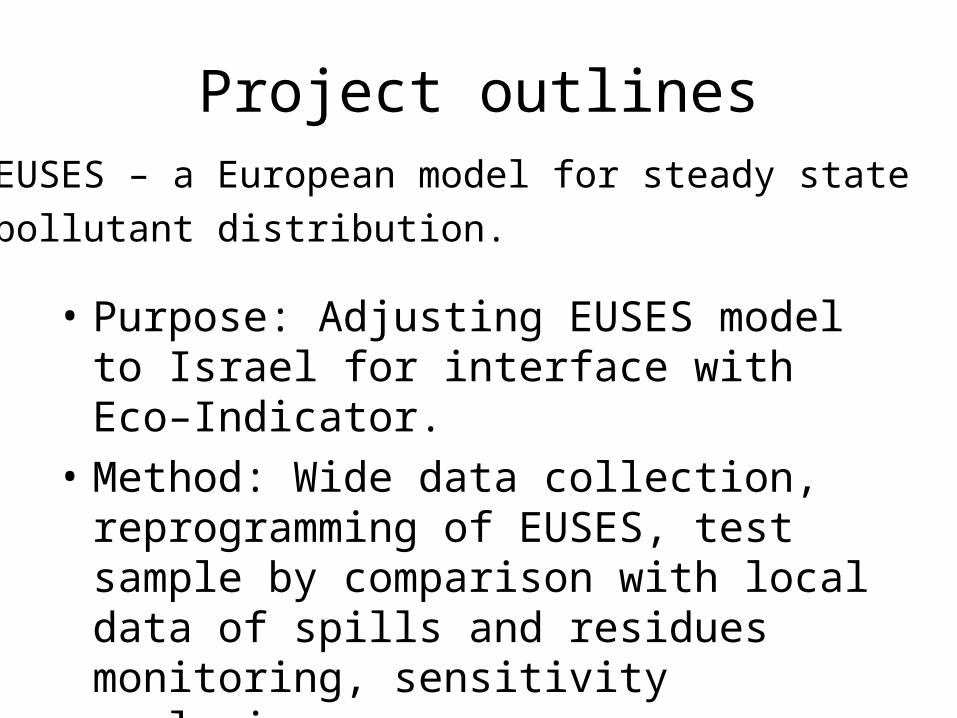
Project outlines
• Purpose: Adjusting EUSES model to Israel for interface with Eco–Indicator.
• Method: Wide data collection, reprogramming of EUSES, test sample by comparison with local data of spills and residues monitoring, sensitivity analysis.
EUSES – a European model for steady state
pollutant distribution.

Introduction to Mass Balance Models
This represents one environmental compartment (either air, water, soil, etc.)at one spatial location.

Introduction to Mass Balance Models
Chemical, such as a pesticide, is emitted into thecompartment at a certain rate.

Introduction to Mass Balance Models
Chemical can move between different environmentalcompartments (e.g., from water to soil)

Introduction to Mass Balance Models
Chemical can move between different environmentalcompartments (e.g., from water to soil) and betweendifferent spatial compartments.

Introduction to Mass Balance Models
Chemical can also be formed and degraded throughreactions.

Introduction to Mass Balance Models
flow in flow out
Mass flow for the single compartment:

Introduction to Mass Balance Models
flow in flow out
Mass flow for the single compartment:
0=
Steady state approximation

Relevant Output• Concentration in the
compartment:
•Residence Time:
the average time the chemical spends in the box

Extension to Two Compartments

SimpleBox 2.0
• 3 nested spatial scales, each with a set of environmental compartments:

Example from SimpleBox model
Emitted into soil only

Example from SimpleBox model
Moves between environmental compartments at various rates

Example from SimpleBox model
Moves between spatial compartments at various rates
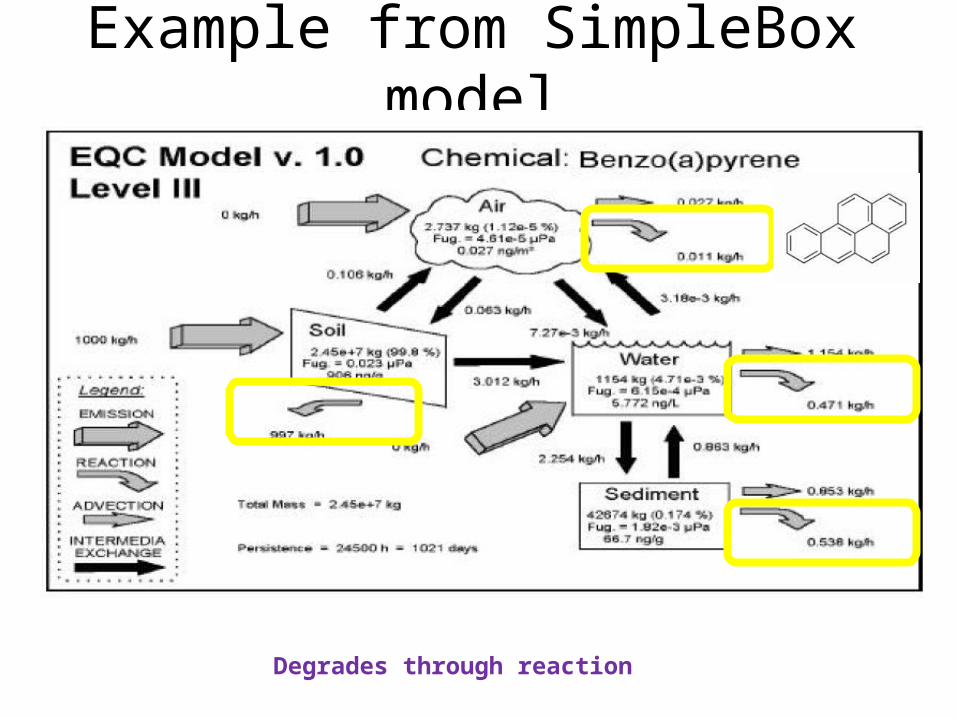
Example from SimpleBox model
Degrades through reaction

Example from SimpleBox model
Most of the chemical remains in thesoil compartment.

Parameterization for Israel
unchanged
Israel
Element from our partition
Input data to the model–
• Demographic data
• Geophysical data
• Chemical data
Sources:
Direct from literature – Scientific & Governmental sources.
Indirect - Estimations.
Will see some main informative figures..

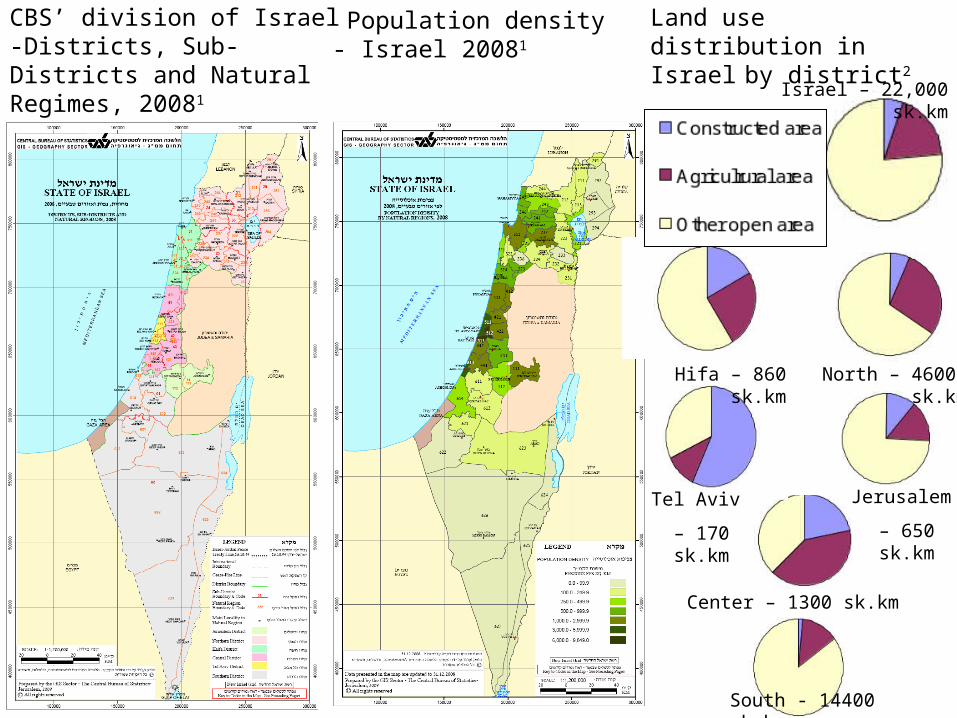
CBS’ division of Israel -Districts, Sub-Districts and Natural Regimes, 20081

CBS’ division of Israel -Districts, Sub-Districts and Natural Regimes, 20081
Population density - Israel 20081
CBS’ division of Israel -Districts, Sub-Districts and Natural Regimes, 20081
Population density - Israel 20081
South - 14400 sk.km
Center – 1300 sk.km
Jerusalem
– 650 sk.km
North – 4600 sk.km
Israel – 22,000 sk.km
Tel Aviv
– 170 sk.km
Hifa – 860 sk.km
Land use distribution in Israel by district2

Yearly rain average map (1990-1961)6

Drainage basins of Israel4,5
Yearly rain average map (1990-1961)6

Stream flow (MCM) 3Drainage basins of Israel4,5
Yearly rain average map (1990-1961)6
Cziv - 0.6 Gaaton - 0
Bezet – 0.15
Sorek – 0.5
Taninim - 25
Zipory - 2
Kishon – 0.5
Alexander - 0.5
Yarkon – 3.5
Hadera - 0
Snir (hazbany)- 45
Einan - 0
Dan - 190 Hermon
(Banyas) - 70
Dishon - 0
Amud – 1.5 Zalmon – 0.5
Yavniel - 1Southern
Yarden - 20Tavor - 1
Harodb - 6
Naaman - 15

Soil map of Israel7
Runoff coefficients were estimated according to:
• Soil type
• Land use
Rational Equation Q=ciA
Q = Peak discharge [L3 /T]c = Rational method runoff coefficienti = Rainfall intensity [L/T]A = Drainage area, [L2 [
Runoff determination11

Soil Erosion in literature
)ton/km^2/ year(
Converted Soil Erosion
)mm/year(
Hilly areas under vines9142.80.102
Wheat areas9 17.60.013
Olives90.80.001
Shrubland96.70.005
Yatir 105000.357
Assuming bulk density of 1.4 g/cm3
Conversion via bulk density:
Sandy soils – 1.2-1.8 g/cm3
Fine-textured soils– 1-1.6 g/cm3
Soil erosion degree8

Soil Erosion in literature
)ton/km^2/ year(
Converted Soil Erosion
)mm/year(
Hilly areas under vines9142.80.102
Wheat areas9 17.60.013
Olives90.80.001
Shrubland96.70.005
Yatir 105000.357
Assuming bulk density of 1.4 g/cm3.
Conversion via bulk density:
Sandy soils – 1.2-1.8 g/cm3
Fine-textured soils– 1-1.6 g/cm3
Soil erosion degree8
Color index for soil erosion rate
(Estimated)
soil erosion
(mm/year)Color
0.05green
0.1brown
0.2red
0.05light
green
0.1pink
0.2purple
0.1dark
yellow
0.2yellow
0.3blue
built up areagrey
0.2
Golan, Negev
and Yehuda desert
0.3Wadi
0.2other

Water table12
Minimum Water Table in Israel
-500
-400
-300
-200
-100
0
100
Locations
wa
ter
tab
le -
he
igh
t a
bo
ve s
ea
leve
l (m
)
Large variation over time – so minimum water tables were taken:
Coastal aquifer
Yarkon-Taninim aquifer
Western Galilee

Test sample – Pesticides in Lake Kinneret
Comparison of EUSES-IL prediction to measured concentration
in the main water compartment.
Input: Estimated amounts that are released to the environment each year, from documented purchase-lists.

Test sample – Pesticides in Lake Kinneret
Comparison of EUSES-IL prediction to measured concentration
in the main water compartment.
Input: Estimated amounts that are released to the environment each year, from documented purchase-lists.
Pesticide use comparison for 1996, 1997 and The Agricultural Extension Service recommendations (SHAHAM) between different crops13:
Pesticide actual application for different crops
0
1
2
3
4
5
6
7
Field crops Deciduous Subtropic Total
Crop
Am
ou
nt
(Kg
-l/d
u)
The Agricultural ExtensionService
1996
1997
No significant differences between crops, years and professional recommendations.

Pesticides bought in 1997
012345678
Active material
Am
ou
nt
us
ed
(to
n/y
ea
r)
4.44
0.93
0.0
0.1
0.2
0.3
0.4
0.5
0.6
Active material
Am
ou
nt
us
ed (
ton
/ye
ar)
0.03

Active material
Commercial nameChemical classGroup
EndosulfanThionexOrganochlorineInsecticide & Acaricide
DiazinonDiazolOrganophosphateInsecticide & Acaricide
AtrazineAtranex TriazineHerbicide
Endosulfan Diazinon Atrazine
Tested chemicals

Pesticide residue concentration (ppb) in lake Kinneret water14
Monitoring data -
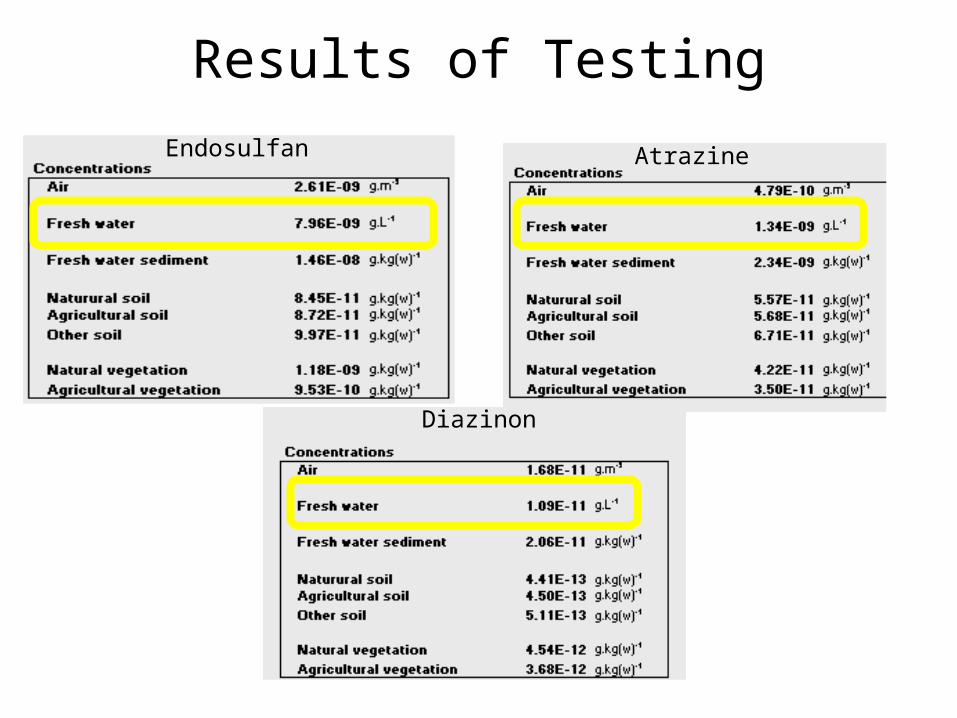
Results of Testing
Endosulfan
Diazinon
Atrazine

Comparison with EUSES and measured values
1.E-14
1.E-13
1.E-12
1.E-11
1.E-10
1.E-09
1.E-08
1.E-07
1.E-06
Endosulfan Diazinon Atrazine
Lo
g C
on
ce
ntr
ati
on
in A
ir
EUSES Result
Our Result
Measured
Endosulfan Diazinon Atrazine
0.93 ton/year0.03 ton/year 4.44 ton/year

Sensitivity Analysis
Sensitivity analysis: Temperature
-6
-5
-4
-3
-2
-1
0
1
2
3
4
1
Pe
rce
nt
Ch
an
ge
Ours, 0.5x
EUSES, 0.5x
Ours, 2x
EUSES, 2x
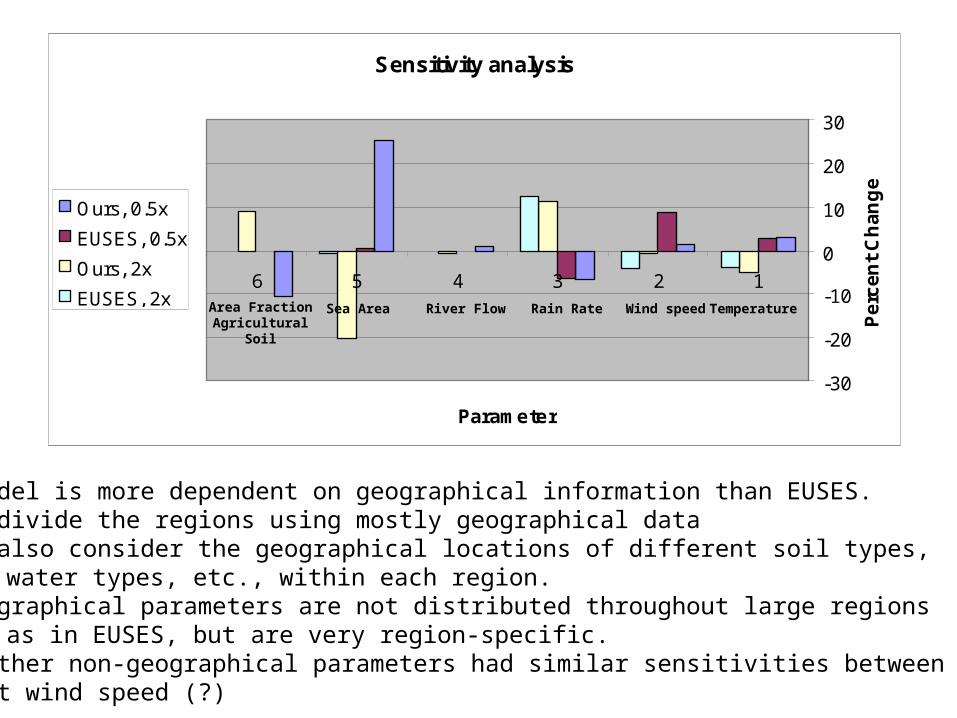
Sensitivity analysis
-30
-20
-10
0
10
20
30
123456
Parameter
Pe
rce
nt
Ch
an
ge
Ours, 0.5x
EUSES, 0.5x
Ours, 2x
EUSES, 2xTemperatureWind speedRain RateRiver FlowSea AreaArea Fraction
AgriculturalSoil
Our model is more dependent on geographical information than EUSES.• We divide the regions using mostly geographical data• We also consider the geographical locations of different soil types,
water types, etc., within each region.• Geographical parameters are not distributed throughout large regions
as in EUSES, but are very region-specific.Most other non-geographical parameters had similar sensitivities between models.•Except wind speed (?)

Chemical properties of tested chemicals
Molecular weight and Vapor Pressure
407
304
216
0.001
0.008
0.000040
100
200
300
400
500
Endosulfan Diazinon Atrazine
PesticideM
w (
m/m
ole
))
0.000
0.002
0.004
0.006
0.008
0.010
Pv
ap
25
(P
a)
MW
Pvap25
Water solubility and Octanol-Water partition coefficient
0.08
60
30
3500
1995
562
0
10
20
30
40
50
60
70
Endosulfan Diazinon Atrazine
Pesticide
Wat
er
solu
bili
ty
(mg
/l)
05001000150020002500300035004000
Ko
w
Solubility inwater
Kow
Endosulfan Diazinon Atrazine

Degredation constants in different media
1.E-08
1.E-07
1.E-06
1.E-05
1.E-04
Endosulfan Diazinon Atrazine
Pesticide
kd
eg
(1
/s)kdeg(air)
kdeg(water)
kdeg(sed)
kdeg(soil)
Endosulfan Diazinon Atrazine
Chemical properties of tested chemicals

Conclusion
EUSES-IL is a significantly improved model compared to EUSES.
Possible future improvements:• Incorporate more accurate chemical
equations into the model.• More specific information is required for
optimizing results (chemical use, geophysical data).
• Find more measured data for testing and optimizing the model.

References1. Central Bureau of Statistics - Statistical Abstract of Israel 2008 - No.59 .2. Statistical Abstract of Israel 2009-No.60, Table 1.2.3. Perlmutter M. Springs and streams in Israel 2008 - report of the SPNI (1), according to Hydrological Service data.4. Israel Hydrological service. 5. Website of Moto Track: http://www.mototracks.co.il/thematics.htm 6. Gvirtzman, H. 2002. Israel Water Resources, Chapters in Hydrology and Environmental Sciences, Yad Ben-Zvi
Press, Jerusalem, 301 p.7. Ministry of Agriculture – Agricultural research organization & soil conservation and drainage department - 1975. 8. Soil Survey, Ministry of Agriculture, Soil Conservation unit, 1954 9. Kosmasa C et al. The effect of land use on runoff and soil erosion rates under Mediterranean
conditions(1997) Catena, 29 (1), pp. 45-59.10. Laronne J., Lekach J., Cohen H., Alexandrov Y. Experimental Drainage Basins in Israel: Rainfall, Runoff,
Suspended Sediment and Bedload Monitoring American Geophysical Union, Fall Meeting 2002, abstract #H51B-0824.
11. Website of Mountain Empire Community College – Big Stone Gap, Virginia: http://water.me.vccs.edu/courses/CIV246/table2_print.htm
12. Hydrological Representative Date - February 2010, Israel Water Authority, Israel Hydrological Service: elyon1.court.gov.il/heb/mayim/Hodaot/hs_01.pdf
13. Bar-Ilan I., Melman G. Survey of pesticides use in the Northern drainage basin of Lake Kinneret (1998) MIGAL - Galilee Technology Center. Kiryat-Shmona, Israel.
14. Zohary T. et al. Kinneret research and monitoring – lab work report for 2008 (T 9/2009) ) Kinneret Limnonological Laboratory, Israel Oceanographic and Limnological Research.
15. Kawamoto K, MacLeod M, Mackay D. Evaluation and comparison of multimedia mass balance models of chemical fate: application of EUSES and ChemCAN to 68 chemicals in Japan. Chemosphere 44 (2001) 599-612.
16. Brandes LJ, den Hollander H, van de Meant D. SimpleBox 2.0: a nested multimedia fate model for evaluating the environmental fate of chemicals. RIVM report no. 719101029, Netherlands.

Thank you!!

Parameterization for Israel Units
EUSES Default CIsrael C
Land Areakm2352000021000
Sea Areakm23520000590
Area Fraction Fresh Water 0.030.029
Area Fraction Natural Soil 0.270.76
Area Fraction Agricultural Soil 0.60.18
Area Fraction Other Soil 0.10.052
Average Temperature◦C1220
Average Wind Speedm/s34.5
Rain Ratemm/yr700500
Depth of Fresh Waterm33
River Flow between continent and region 0.0340.02
Runoff Fraction 0.250.25
Infiltration Fraction 0.250.25
Soil Erosionmm/yr0.030.03