Parameter Estimation of Actuators for Benchmark Active ...mln/ltrs-pdfs/NASA-98-tm208452.pdf ·...
31
NASA/TM-1998-208452 Parameter Estimation of Actuators for Benchmark Active Control Technology (BACT) Wind Tunnel Model With Analysis of Wear and Aerodynamic Loading Effects Martin R. Waszak and Jimmy Fung Langley Research Center, Hampton, Virginia July 1998
Transcript of Parameter Estimation of Actuators for Benchmark Active ...mln/ltrs-pdfs/NASA-98-tm208452.pdf ·...

NASA/TM-1998-208452
Parameter Estimation of Actuators forBenchmark Active Control Technology(BACT) Wind Tunnel Model With Analysisof Wear and Aerodynamic Loading EffectsMartin R. Waszak and Jimmy FungLangley Research Center, Hampton, Virginia
July 1998

The NASA STI Program Office . . . in Profile
Since its founding, NASA has been dedicatedto the advancement of aeronautics and spacescience. The NASA Scientific and TechnicalInformation (STI) Program Office plays a keypart in helping NASA maintain thisimportant role.
The NASA STI Program Office is operated byLangley Research Center, the lead center forNASA’s scientific and technical information.The NASA STI Program Office providesaccess to the NASA STI Database, thelargest collection of aeronautical and spacescience STI in the world. The Program Officeis also NASA’s institutional mechanism fordisseminating the results of its research anddevelopment activities. These results arepublished by NASA in the NASA STI ReportSeries, which includes the following reporttypes:
• TECHNICAL PUBLICATION. Reports ofcompleted research or a major significantphase of research that present the resultsof NASA programs and include extensivedata or theoretical analysis. Includescompilations of significant scientific andtechnical data and information deemedto be of continuing reference value. NASAcounter-part or peer-reviewed formalprofessional papers, but having lessstringent limitations on manuscriptlength and extent of graphicpresentations.
• TECHNICAL MEMORANDUM.Scientific and technical findings that arepreliminary or of specialized interest,e.g., quick release reports, workingpapers, and bibliographies that containminimal annotation. Does not containextensive analysis.
• CONTRACTOR REPORT. Scientific andtechnical findings by NASA-sponsoredcontractors and grantees.
• CONFERENCE PUBLICATION.Collected papers from scientific andtechnical conferences, symposia,seminars, or other meetings sponsored orco-sponsored by NASA.
• SPECIAL PUBLICATION. Scientific,technical, or historical information fromNASA programs, projects, and missions,often concerned with subjects havingsubstantial public interest.
• TECHNICAL TRANSLATION. English-language translations of foreign scientificand technical material pertinent toNASA’s mission.
Specialized services that help round out theSTI Program Office’s diverse offerings includecreating custom thesauri, building customizeddatabases, organizing and publishingresearch results . . . even providing videos.
For more information about the NASA STIProgram Office, see the following:
• Access the NASA STI Program HomePage at http://www.sti.nasa.gov
• Email your question via the Internet [email protected]
• Fax your question to the NASA AccessHelp Desk at (301) 621-0134
• Phone the NASA Access Help Desk at(301) 621-0390
• Write to:NASA Access Help DeskNASA Center for AeroSpace Information7121 Standard DriveHanover, MD 21076-1320

National Aeronautics andSpace Administration
Langley Research CenterHampton, Virginia 23681-2199
NASA/TM-1998-208452
Parameter Estimation of Actuators forBenchmark Active Control Technology(BACT) Wind Tunnel Model With Analysisof Wear and Aerodynamic Loading EffectsMartin R. Waszak and Jimmy FungLangley Research Center, Hampton, Virginia
July 1998

Available from the following:
NASA Center for AeroSpace Information (CASI) National Technical Information Service (NTIS)7121 Standard Drive 5285 Port Royal RoadHanover, MD 21076-1320 Springfield, VA 22161-2171(301) 621-0390 (703) 487-4650
Acknowledgments
The authors wish to acknowledge Sherwood Hoadley, Robert Scott, Carol Wieseman, and Michael Sorokach for theirsignificant assistance.
The use of trademarks or names of manufacturers in this report is for accurate reporting and does not constitute anofficial endorsement, either expressed or implied, of such products or manufacturers by the National Aeronautics andSpace Administration.

iii
Contents
Tables . . . . . . . . . . . . . . . . . . . . . . . . . . . . . . . . . . . . . . . . . . . . . . . . . . . . . . . . . . . . . . . . . . . . . . . . . . . . v
Figures . . . . . . . . . . . . . . . . . . . . . . . . . . . . . . . . . . . . . . . . . . . . . . . . . . . . . . . . . . . . . . . . . . . . . . . . . . . v
Symbols . . . . . . . . . . . . . . . . . . . . . . . . . . . . . . . . . . . . . . . . . . . . . . . . . . . . . . . . . . . . . . . . . . . . . . . . . vii
Abstract. . . . . . . . . . . . . . . . . . . . . . . . . . . . . . . . . . . . . . . . . . . . . . . . . . . . . . . . . . . . . . . . . . . . . . . . . . . 1
Introduction . . . . . . . . . . . . . . . . . . . . . . . . . . . . . . . . . . . . . . . . . . . . . . . . . . . . . . . . . . . . . . . . . . . . . . . 1
Experimental Setup . . . . . . . . . . . . . . . . . . . . . . . . . . . . . . . . . . . . . . . . . . . . . . . . . . . . . . . . . . . . . . . . . 2
Experimental Data . . . . . . . . . . . . . . . . . . . . . . . . . . . . . . . . . . . . . . . . . . . . . . . . . . . . . . . . . . . . . . . . . . 4
Actuator Model Structure . . . . . . . . . . . . . . . . . . . . . . . . . . . . . . . . . . . . . . . . . . . . . . . . . . . . . . . . . . . . . 5
Parameter Estimation . . . . . . . . . . . . . . . . . . . . . . . . . . . . . . . . . . . . . . . . . . . . . . . . . . . . . . . . . . . . . . . . 5
Application of Parameter Estimation Procedure . . . . . . . . . . . . . . . . . . . . . . . . . . . . . . . . . . . . . . . . . . . 7
Analysis of BACT Actuator Behavior . . . . . . . . . . . . . . . . . . . . . . . . . . . . . . . . . . . . . . . . . . . . . . . . . . . 9
Concluding Remarks . . . . . . . . . . . . . . . . . . . . . . . . . . . . . . . . . . . . . . . . . . . . . . . . . . . . . . . . . . . . . . . 11
References . . . . . . . . . . . . . . . . . . . . . . . . . . . . . . . . . . . . . . . . . . . . . . . . . . . . . . . . . . . . . . . . . . . . . . . 11
Appendix—Additional Frequency Response Plots . . . . . . . . . . . . . . . . . . . . . . . . . . . . . . . . . . . . . . . . 12

v
Tables
Table 1.Analytical Transfer Function Parameters With No Aerodynamic Load . . . . . . . . . . . . . . . . . . . 7
Table 2.Analytical Transfer Function Parameters With Aerodynamic Load . . . . . . . . . . . . . . . . . . . . . . 8
Figures
Figure 1. BACT wing section and flexible mount . . . . . . . . . . . . . . . . . . . . . . . . . . . . . . . . . . . . . . . . . . 2
Figure 2. BACT wind tunnel model . . . . . . . . . . . . . . . . . . . . . . . . . . . . . . . . . . . . . . . . . . . . . . . . . . . . . 3
Figure 3. BACT wind tunnel test arrangement . . . . . . . . . . . . . . . . . . . . . . . . . . . . . . . . . . . . . . . . . . . . 3
Figure 4. Servo loop for BACT actuators . . . . . . . . . . . . . . . . . . . . . . . . . . . . . . . . . . . . . . . . . . . . . . . . 4
Figure 5. Parameter estimation process . . . . . . . . . . . . . . . . . . . . . . . . . . . . . . . . . . . . . . . . . . . . . . . . . . 5
Figure 6. Frequency response for upper spoiler with aerodynamic load . . . . . . . . . . . . . . . . . . . . . . . . . 8
Figure 7. Frequency response error between third- and second-order models of lower spoiler . . . . . . . 8
Figure 8. Frequency parameterω for unloaded conditions throughout wind tunnel test . . . . . . . . . . . . . 9
Figure 9. Damping parameterζ for unloaded conditions throughout wind tunnel test . . . . . . . . . . . . . . 9
Figure 10. Effects of servo gain variations and mechanical wear for trailing-edgeactuator frequency response with no aerodynamic load . . . . . . . . . . . . . . . . . . . . . . . . . . . . . . . . . . . 10
Figure 11. Frequency parameterω for unloaded and loaded conditions early inwind tunnel test . . . . . . . . . . . . . . . . . . . . . . . . . . . . . . . . . . . . . . . . . . . . . . . . . . . . . . . . . . . . . . . . . . 10
Figure 12. Damping parameterζ for unloaded and loaded conditions early inwind tunnel test . . . . . . . . . . . . . . . . . . . . . . . . . . . . . . . . . . . . . . . . . . . . . . . . . . . . . . . . . . . . . . . . . . 10
Figure 13. Effect of aerodynamic load for trailing-edge actuator frequency response earlyin wind tunnel test . . . . . . . . . . . . . . . . . . . . . . . . . . . . . . . . . . . . . . . . . . . . . . . . . . . . . . . . . . . . . . . . 10
Figure A1. Experimental actuator frequency response plots for no aerodynamic load (δ/δc) . . . . . . . . 13
Figure A2. Experimental actuator frequency response plots for aerodynamic load (δ/δc) . . . . . . . . . . 14
Figure A3. Analytical actuator frequency response plots for no aerodynamic load (δ/δc) . . . . . . . . . . 15
Figure A4. Analytical actuator frequency response plots for aerodynamic load (δ/δc) . . . . . . . . . . . . . 16
Figure A5. Experimental and analytical trailing-edge actuator frequency responses forno aerodynamic load (δ/δc) . . . . . . . . . . . . . . . . . . . . . . . . . . . . . . . . . . . . . . . . . . . . . . . . . . . . . . . . . 17
Figure A6. Experimental and analytical upper spoiler actuator frequency responses forno aerodynamic load (δ/δc) . . . . . . . . . . . . . . . . . . . . . . . . . . . . . . . . . . . . . . . . . . . . . . . . . . . . . . . . . 18
Figure A7. Experimental and analytical lower spoiler actuator frequency responses forno aerodynamic load (δ/δc) . . . . . . . . . . . . . . . . . . . . . . . . . . . . . . . . . . . . . . . . . . . . . . . . . . . . . . . . . 19
Figure A8. Experimental and analytical trailing-edge actuator frequency responses foraerodynamic load (δ/δc) . . . . . . . . . . . . . . . . . . . . . . . . . . . . . . . . . . . . . . . . . . . . . . . . . . . . . . . . . . . 20
Figure A9. Experimental and analytical upper spoiler actuator frequency responses foraerodynamic load (δ/δc) . . . . . . . . . . . . . . . . . . . . . . . . . . . . . . . . . . . . . . . . . . . . . . . . . . . . . . . . . . . 21
Figure A10. Experimental and analytical lower spoiler actuator frequency responses foraerodynamic load (δ/δc) . . . . . . . . . . . . . . . . . . . . . . . . . . . . . . . . . . . . . . . . . . . . . . . . . . . . . . . . . . . 22
vii
Symbols
BACT Benchmark Active Control Technology
cm arbitrary weighting on frequency response magnitude error
cp arbitrary weighting on frequency response phase error
e frequency response error vector
FFT Fast Fourier Transform
J cost function
K∆hp gain on differential hydraulic pressure
Kε gain on control surface position error
k actuator transfer function gain
LS lower spoiler
M Mach number
mag magnitude
∆mag frequency response magnitude error
PAPA Pitch and Plunge Apparatus
p first-order actuator pole
phs phase
∆phs response phase error
q dynamic pressure
S diagonal weighting matrix
s Laplace variable
TDT Langley Transonic Dynamics Tunnel
TE trailing edge
US upper spoiler
y vector of frequency response magnitude and phase

viii
normalized parameter estimate error
∆hp differential hydraulic pressure
δ control surface position
δc commanded control surface position
ε2 weighted mean squared frequency response error
εmin2 minimal allowable weighted mean squared frequency response error
ζ second-order actuator damping ratio
ω second-order actuator frequency
Subscripts:
a from analysis or estimation
e from experiment
i vector index
init initial quess
new updated estimate
opt optimal estimate
∆θθ̂
-------

Abstract
This report describes the development of transfer function models for thetrailing-edge and upper and lower spoiler actuators of the Benchmark ActiveControl Technology (BACT) wind tunnel model for application to control systemanalysis and design. A simple nonlinear least-squares parameter estimationapproach is applied to determine transfer function parameters from frequencyresponse data. Unconstrained quasi-Newton minimization of weighted frequencyresponse error was employed to estimate the transfer function parameters. Ananalysis of the behavior of the actuators over time to assess the effects of wearand aerodynamic load by using the transfer function models is also presented.The frequency responses indicate consistent actuator behavior throughout thewind tunnel test and only slight degradation in effectiveness due to aerodynamichinge loading. The resulting actuator models have been used in design, analysis,and simulation of controllers for the BACT to successfully suppress flutter over awide range of conditions.
Introduction
The ability of an active control system to accom-plish the function for which it was designed dependsto a large degree on the accuracy of the mathematicalmodels used to describe the dynamic behavior of thephysical system to be controlled. A crucial element ofthe overall system is the actuator. The commandedcontrol inputs need to be accurately produced by theactuators in order to achieve the desired level of per-formance. Mathematical models that characterize thedynamic response of the actuators are therefore keyrequirements for design, analysis, and simulation ofany control system.
The objective of this investigation is to develop aset of actuator models for the Benchmark Active Con-trol Technology (BACT) wind tunnel model (refs. 1and 2) that is appropriate for application to controlsystem analysis and design. Although this type ofapplication does not require the actuator model struc-ture and parameter estimates to be particularly accu-rate, the dynamic input-output properties of theactuators over the frequency range of interest for theBACT wind tunnel model should be fairly accurate.
Control system design usually takes into accountdesign model variations and uncertainty in the form ofgain and phase margins. Typical gain and phase mar-gins might be±6 dB and±30°, respectively. Errors inthe actuator models should only represent a small frac-tion of these margins—perhaps 10 percent or so. Inthis report, input-output frequency response accuracy,
measured in terms of magnitude and phase comparedwith experimental frequency response data, is thebasis for the acceptability of the actuator model struc-ture and parameter estimates. The accuracy of theparameter estimates themselves, however, is notconsidered.
Development of the actuator models begins by anassessment of the physical systems of the BACT windtunnel model and a review of the available data. Anactuator model structure is then chosen based on thephysical characteristics of hydraulic actuation sys-tems. A simple parameter estimation procedure basedon minimizing weighted frequency response error in aquasi-Newton scheme is outlined. The parameters ofthe model structure are determined from experimentalfrequency response data and analyzed to assess varia-tions in the dynamic input-output characteristics of theactuators over time (due to servo loop gain variationsand bearing, seal, and sensor wear) and the effects ofcontrol surface hinge loading due to aerodynamics.
Note that frequency response data are treated asthe truth data for the parameter estimation process.The frequency response data are based, however, onestimates of the power spectra of actuator responsesobtained from experimental data with fast Fouriertransform (FFT) techniques. As a result, the frequencyresponse data have associated estimation errors thatdepend on the way in which the time histories wererecorded and the manner in which the FFTs were com-puted. (See ref. 3.) The errors introduced by the FFTprocess are not considered herein.

2
Part of the information presented in this reportwas included in a paper entitled “Parameter Estima-tion and Analysis of Actuators for the BACT Wind-Tunnel Model” that was presented at the AIAA Atmo-spheric Flight Mechanics Conference, San Diego,California, July 29–31, 1996, and is available asAIAA-96-3362.
Experimental Setup
The Benchmark Active Control Technology(BACT) project is part of the Benchmark Models Pro-gram (ref. 4) for studying transonic aeroelastic phe-nomena. The BACT system was developed to collecthigh quality unsteady aerodynamic data (pressures andloads) near transonic flutter conditions and to demon-strate active flutter suppression. The BACT systemconsists of a rigid wing section and a flexible mount-ing system. (See refs. 5 and 6.) Figure 1 is a photo-graph of the BACT wing section and the flexiblemount.
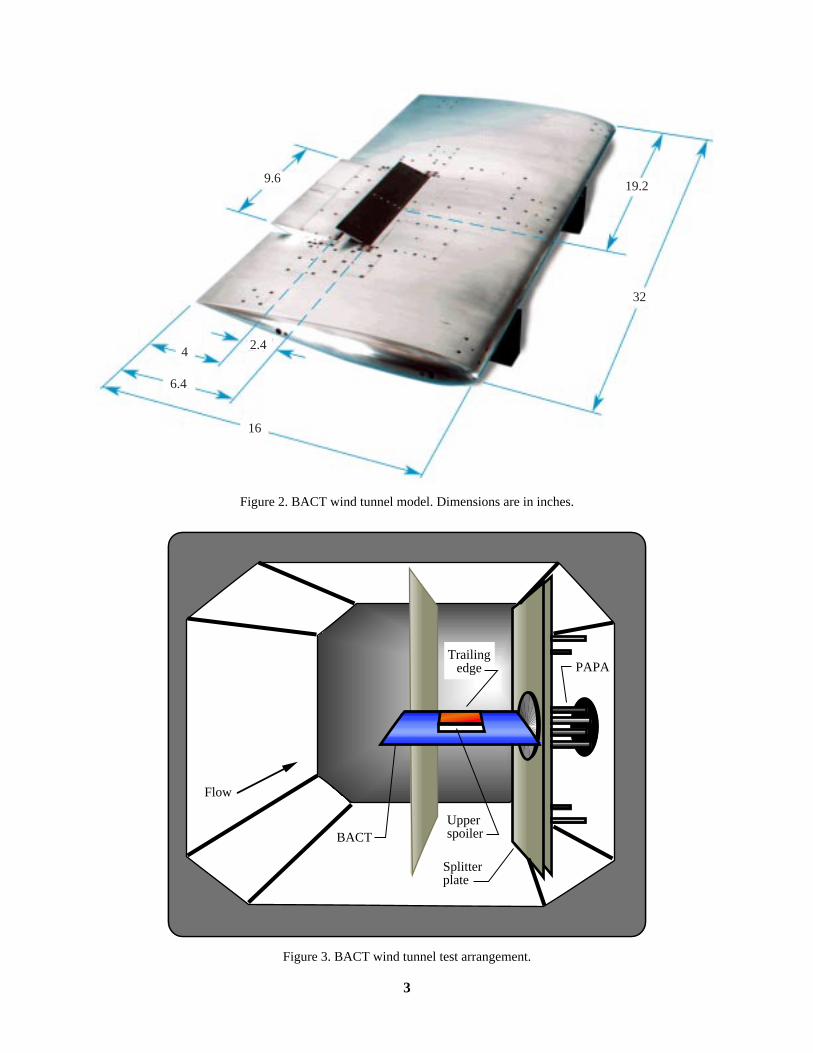
The wind tunnel model is a rigid rectangular wingwith an NACA 0012 airfoil section and is equippedwith a trailing-edge control surface and upper andlower surface spoilers that are controlled indepen-dently by hydraulic actuators. It is instrumented withpressure transducers, accelerometers, control surfaceposition sensors, and hydraulic pressure transducers.Figure 2 is a photograph of the wing section showing
dimensions of the various components including thecontrol surfaces.
The wing is mounted to a device called the Pitchand Plunge Apparatus (or PAPA) which is designed topermit motion in principally two modes—rotation (orpitch) and vertical translation (or plunge). The BACTsystem was tuned to flutter within the operating rangeof the Langley Transonic Dynamics Tunnel (TDT)(ref. 7) in which the system was tested. During opera-tion the mounting system is isolated from the wingsection by a splitter plate. In addition, the mountingsystem is isolated from the airflow by a faring that issecured to the splitter plate and the wall of the test sec-tion. Figure 3 depicts a diagram of the wind tunnel testsection showing how the BACT system was mountedin the wind tunnel.
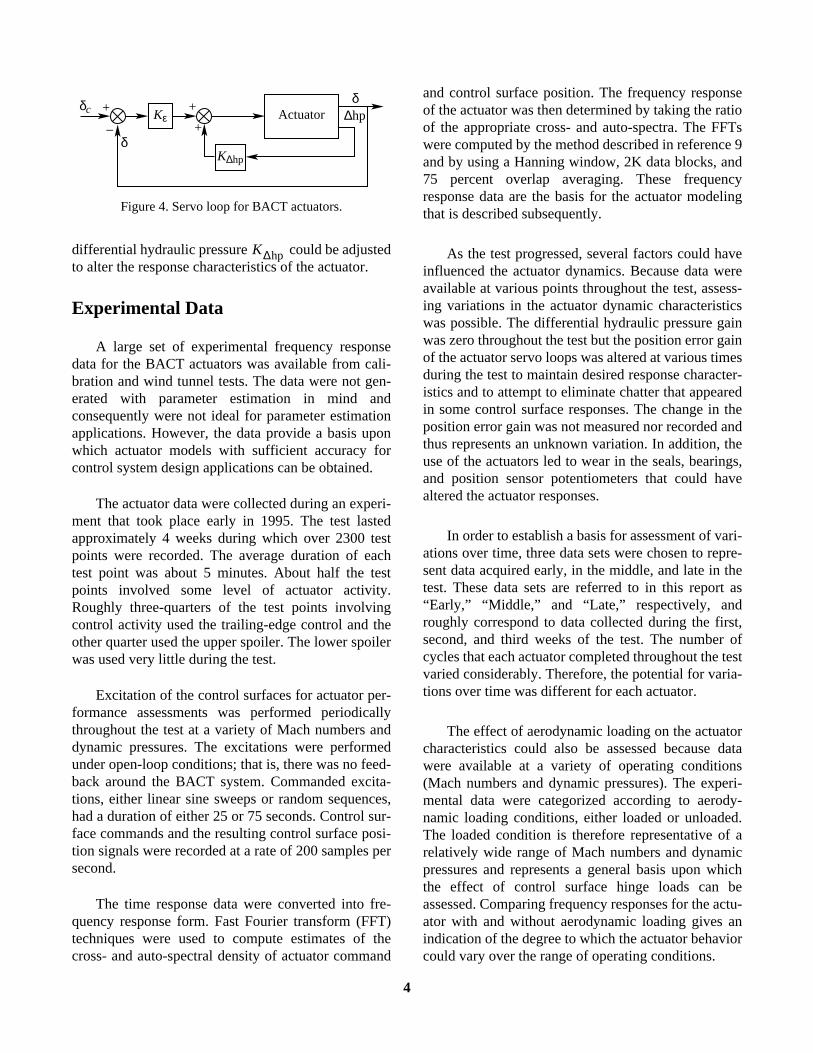
The actuators in the trailing edge and upper andlower spoiler control surface assemblies were specifi-cally designed for the BACT wind tunnel modelbecause of the space limitations arising from placingthe two spoilers and the trailing-edge control surfacein close proximity. The trailing-edge control surface isdriven by a rotary vane actuator and the spoilers aredriven by piston actuators. (See ref. 8.) Each actuatorhas a servo loop as depicted in the block diagram infigure 4. The control surface position sensors andhydraulic pressure transducers were used as servofeedback signals. The gains on position error andKε
Figure 1. BACT wing section and flexible mount.
3
Figure 2. BACT wind tunnel model. Dimensions are in inches.
Figure 3. BACT wind tunnel test arrangement.
32
19.29.6
2.44
6.4
16
BACT
PAPA
Flow
Splitterplate
Upperspoiler
Trailingedge
4
differential hydraulic pressure could be adjustedto alter the response characteristics of the actuator.
Experimental Data
A large set of experimental frequency responsedata for the BACT actuators was available from cali-bration and wind tunnel tests. The data were not gen-erated with parameter estimation in mind andconsequently were not ideal for parameter estimationapplications. However, the data provide a basis uponwhich actuator models with sufficient accuracy forcontrol system design applications can be obtained.
The actuator data were collected during an experi-ment that took place early in 1995. The test lastedapproximately 4 weeks during which over 2300 testpoints were recorded. The average duration of eachtest point was about 5 minutes. About half the testpoints involved some level of actuator activity.Roughly three-quarters of the test points involvingcontrol activity used the trailing-edge control and theother quarter used the upper spoiler. The lower spoilerwas used very little during the test.
Excitation of the control surfaces for actuator per-formance assessments was performed periodicallythroughout the test at a variety of Mach numbers anddynamic pressures. The excitations were performedunder open-loop conditions; that is, there was no feed-back around the BACT system. Commanded excita-tions, either linear sine sweeps or random sequences,had a duration of either 25 or 75 seconds. Control sur-face commands and the resulting control surface posi-tion signals were recorded at a rate of 200 samples persecond.
The time response data were converted into fre-quency response form. Fast Fourier transform (FFT)techniques were used to compute estimates of thecross- and auto-spectral density of actuator command
and control surface position. The frequency responseof the actuator was then determined by taking the ratioof the appropriate cross- and auto-spectra. The FFTswere computed by the method described in reference 9and by using a Hanning window, 2K data blocks, and75 percent overlap averaging. These frequencyresponse data are the basis for the actuator modelingthat is described subsequently.
As the test progressed, several factors could haveinfluenced the actuator dynamics. Because data wereavailable at various points throughout the test, assess-ing variations in the actuator dynamic characteristicswas possible. The differential hydraulic pressure gainwas zero throughout the test but the position error gainof the actuator servo loops was altered at various timesduring the test to maintain desired response character-istics and to attempt to eliminate chatter that appearedin some control surface responses. The change in theposition error gain was not measured nor recorded andthus represents an unknown variation. In addition, theuse of the actuators led to wear in the seals, bearings,and position sensor potentiometers that could havealtered the actuator responses.
In order to establish a basis for assessment of vari-ations over time, three data sets were chosen to repre-sent data acquired early, in the middle, and late in thetest. These data sets are referred to in this report as“Early,” “Middle,” and “Late,” respectively, androughly correspond to data collected during the first,second, and third weeks of the test. The number ofcycles that each actuator completed throughout the testvaried considerably. Therefore, the potential for varia-tions over time was different for each actuator.
The effect of aerodynamic loading on the actuatorcharacteristics could also be assessed because datawere available at a variety of operating conditions(Mach numbers and dynamic pressures). The experi-mental data were categorized according to aerody-namic loading conditions, either loaded or unloaded.The loaded condition is therefore representative of arelatively wide range of Mach numbers and dynamicpressures and represents a general basis upon whichthe effect of control surface hinge loads can beassessed. Comparing frequency responses for the actu-ator with and without aerodynamic loading gives anindication of the degree to which the actuator behaviorcould vary over the range of operating conditions.
Figure 4. Servo loop for BACT actuators.
Actuator+
–
+
+
δc
δ
δKε
K∆hp
∆hp
K∆hp
5
Actuator Model Structure
The mathematical models for the BACT actuatorswere based on a third-order transfer function structurethat characterizes the key features of hydraulic sys-tems (refs. 10 and 11) as shown in the followingequation:
(1)
Here the outputδ is the angular position of the controlsurface and the input is the actuator command. Thefour unknown parameters in this transfer functionstructure are as follows:k is a gain,p is a first-orderpole, andω and ζ are second-order frequency anddamping. The first-order pole is associated with theflow of hydraulic fluid through a small orifice and thegain on control surface position error feedback. Thesecond-order frequency and damping are associatedwith the compressibility of the hydraulic fluid, theinertia of the control surface, the compliance of thestructure, and the gain on control surface positionerror. Note that these parameters are not independentdue to coupling via the actuator servo loop. (Seefig. 4.)
A transfer function model structure was selectedbecause of its inherently simple structure and the easewith which it can be integrated into control systemanalysis, design, and simulation. It cannot, however,characterize nonlinearities such as amplitude depen-dent gains, dead zone and backlash, or position andrate limits. These effects must be addressed by othermeans and are not addressed here.
Parameter Estimation
The four transfer function parameters from equa-tion (1) were estimated from experimental frequencyresponse data by using the process outlined by theflowchart shown in figure 5. The process involvesdefining a cost (or error) function and minimizing thatfunction by the selection of the desired parameter set(k,p,ζ,ω). First, an initial parameter set was selectedand the resulting analytical frequency response data,in magnitude and phase form, were computed at thesame frequencies for which the experimental datawere available. The magnitude and phase errors
between the analytical and experimental data werethen calculated. A weighted summed square of thetransfer function magnitude and phase errors wasminimized within an optimization routine. The fre-quency response based on the optimized parameterswas then compared with the experimental data to ver-ify the accuracy of the model and the acceptability ofthe convergence criterion.
The optimizer used a quasi-Newton approachbased on the Broyden, Fletcher, Goldfarb, Shanno(BFGS) method for updating the inverse Hessian. (Seeref. 12.) MATLAB1 and the functionfminu from theOptimization Toolbox (ref. 13) were used in this studyto perform the error minimization. Note, however, thatthe specific routine is somewhat arbitrary in that anymethod able to minimize the scalar error functioncould be used.
1Registered trademark of The MathWorks, Inc.
δ s( )δc s( )------------ kpω2
s p+( ) s2
2ζωs ω2+ +( )
------------------------------------------------------------=
δc
Figure 5. Parameter estimation process.
Experimental datamage(ωi), phse(ωi)
ωi (i = 1, 2, . . .)
maga(ωi)phsa(ωi)
mage(ωi)phse(ωi)
ωi
Initial parameter set[k, p, ζ, ω]init
Cost functionJ[k, p, ζ, ω] = ε2
ε2 ≤ ε2m in?
[k, p, ζ, ω]opt
[k, p, ζ, ω]new
Optimizer
No
Actuator modelEquation (1)
ε2
ε2
6
The convergence criteria for the optimizer werethe minimum allowable frequency response error
and the change in the parameter values betweensuccessive iterations These criteria werechosen to achieve qualitatively acceptable approxima-tions to the experimental data and were determined byplotting the experimental frequency response data andthe frequency response associated with the estimatedtransfer function parameters on the same plot. Theconvergence criteria values were chosen small enoughso that the frequency response error was judged to beacceptable but large enough so that convergence couldbe achieved.
The input-output frequency response error wasjudged to be acceptable when, in the frequency rangefrom 2 to 10 hertz, the gain differences were less thanabout 0.1 and phase differences were less than about3°. These values represent approximately 10 percentof the typical control system gain and phase marginsmentioned previously. Errors greater than thesewere deemed acceptable if they appeared to be due tohigher order effects or nonlinearities in the experimen-tal data.
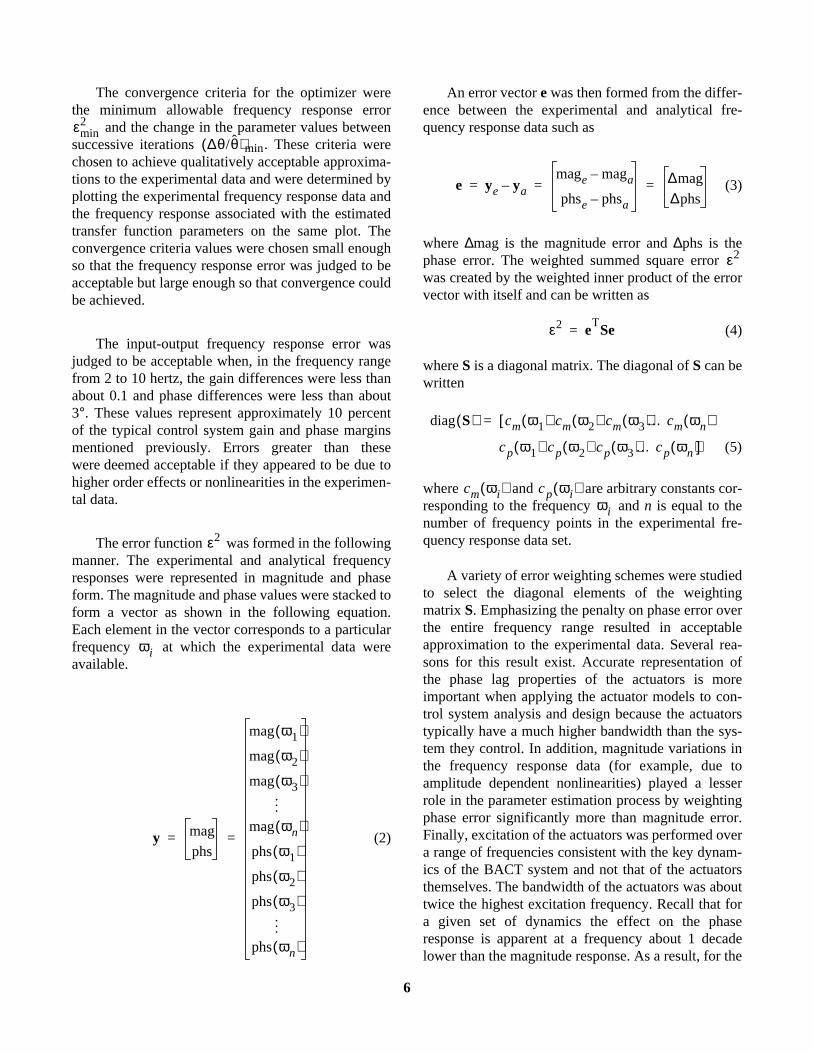
The error function was formed in the followingmanner. The experimental and analytical frequencyresponses were represented in magnitude and phaseform. The magnitude and phase values were stacked toform a vector as shown in the following equation.Each element in the vector corresponds to a particularfrequency at which the experimental data wereavailable.
(2)
An error vectore was then formed from the differ-ence between the experimental and analytical fre-quency response data such as
(3)
where∆mag is the magnitude error and∆phs is thephase error. The weighted summed square errorwas created by the weighted inner product of the errorvector with itself and can be written as
(4)
whereS is a diagonal matrix. The diagonal ofS can bewritten
(5)
where and are arbitrary constants cor-responding to the frequency and n is equal to thenumber of frequency points in the experimental fre-quency response data set.
A variety of error weighting schemes were studiedto select the diagonal elements of the weightingmatrixS. Emphasizing the penalty on phase error overthe entire frequency range resulted in acceptableapproximation to the experimental data. Several rea-sons for this result exist. Accurate representation ofthe phase lag properties of the actuators is moreimportant when applying the actuator models to con-trol system analysis and design because the actuatorstypically have a much higher bandwidth than the sys-tem they control. In addition, magnitude variations inthe frequency response data (for example, due toamplitude dependent nonlinearities) played a lesserrole in the parameter estimation process by weightingphase error significantly more than magnitude error.Finally, excitation of the actuators was performed overa range of frequencies consistent with the key dynam-ics of the BACT system and not that of the actuatorsthemselves. The bandwidth of the actuators was abouttwice the highest excitation frequency. Recall that fora given set of dynamics the effect on the phaseresponse is apparent at a frequency about 1 decadelower than the magnitude response. As a result, for the
εmin2
∆θ/θ̂( )min.
ε2
ωi
y mag
phs
mag ω1( )
mag ω2( )
mag ω3( )
mag ωn( )
phs ω1( )
phs ω2( )
phs ω3( )
phs ωn( )
= =
...
...
e ye ya–mage maga–
phse phsa–
∆mag
∆phs= = =
ε2
ε2 eT
Se=
diag S( ) cm ω1( ) cm ω2( ) cm ω3( )…cm ωn( )[=
cp ω1( ) cp ω2( ) cp ω3( )…cp ωn( ) ]
cm ωi( ) cp ωi( )ωi
7
available data, there is more information in the phaseresponse than in the magnitude response. For all thesereasons, penalizing the phase error more heavilyresulted in models that more closely approximate thekey dynamics of the actuators.
Application of Parameter EstimationProcedure
The parameter estimation procedure was appliedto construct actuator models for the BACT windtunnel model by using the available experimentalfrequency response data. The weighting strategydescribed previously was used with
equal to 1 and the values of equal to 10. The value
for the convergence criteria that resulted inacceptable convergence was and
the default values forfminu . In practice, the parameter convergence crite-rion was active, the minimum error criterion wasnever satisfied.
The estimation process was initiated with a varietyof initial guesses for the unknown parameter set(k,p,ζ,ω). When there was no aerodynamic loading,the initial guess played a relatively small role in con-vergence. When aerodynamic load was present, how-ever, the solution was more sensitive to the initialparameter set and more iterations were generallyrequired for convergence. The most critical initialparameter values were the first-order polep and thesecond-order frequencyω. Several initial guesseswere sometimes required to achieve convergence.Ultimately, initial guesses were selected in such a waythat parameters for the loaded cases were similar tothose for the unloaded cases. These initial guesses also
tended to achieve minima with lower frequencyresponse errors.
Slower convergence for the aerodynamicallyloaded conditions can be attributed to the nature of theexperimental data. Wind tunnel turbulence resulted inlower signal-to-noise ratios and consequently morenoise in the frequency response data than when no tur-bulence was present. Aerodynamic load may also con-tribute to nonlinearities or higher order effects thatcannot be approximated well with the third-order actu-ator model in equation (1). Nonlinearities, higherorder effects, and noise in the experimental frequencyresponse data result in larger weighted summed squarefrequency response error.
In addition, the sensitivity to the initial guesses forthe parameters indicates the possibility of local min-ima or very flat solution spaces. This problem wasaddressed by using multiple initial guesses and evalu-ating the convergence patterns and the similarity of theconverged parameter sets. The sensitivity of the con-verged solutions under load indicates that, althoughsimilar accuracy can be achieved over the range of fre-quencies of interest, the resulting bandwidth and reso-nant peak properties of the actuators (i.e., the values ofp, ω, andζ) can vary significantly. However, becauseno experimental data were available near the band-width frequencies, the accuracy of the estimates ofp,ω, and ζ in terms of bandwidth and resonant peakscould not be addressed in this study.
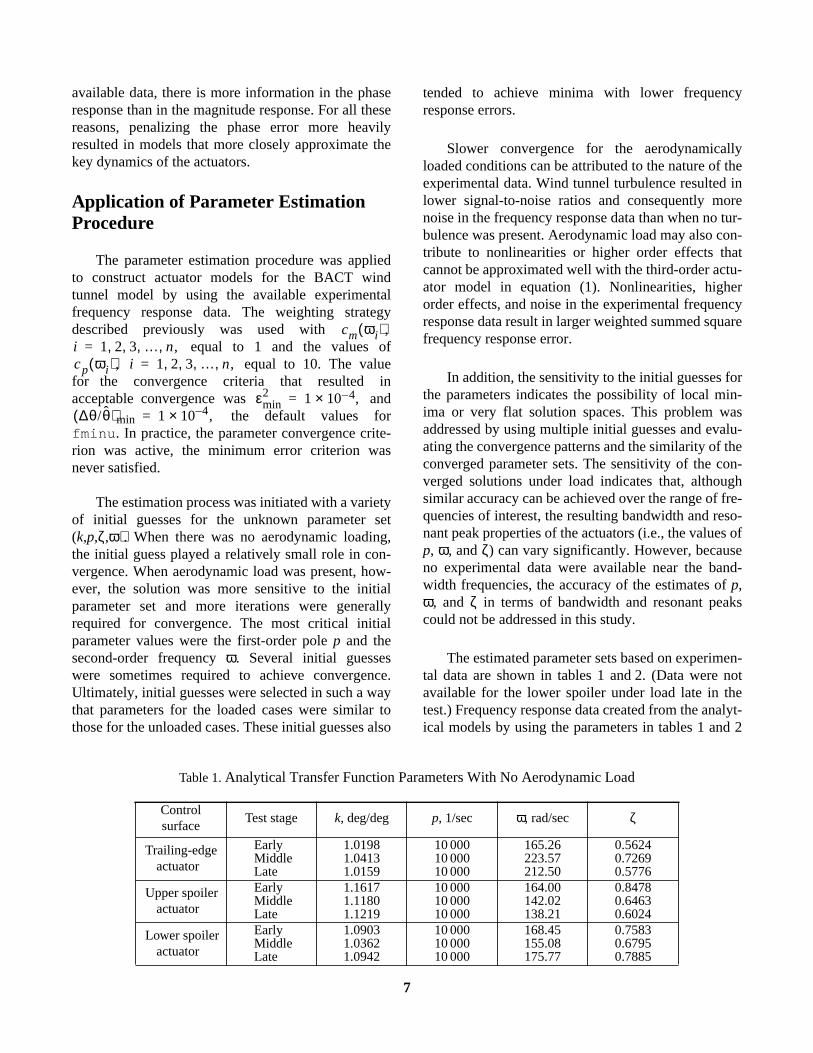
The estimated parameter sets based on experimen-tal data are shown in tables 1 and 2. (Data were notavailable for the lower spoiler under load late in thetest.) Frequency response data created from the analyt-ical models by using the parameters in tables 1 and 2
cm ωi( ),i 1 2 3 … n,, , , ,=cp ωi( ), i 1 2 3 … n,, , , ,=
εmin2 1 10 4– ,×=
∆θ/θ̂( )min 1 10 4– ,×=
Table 1.Analytical Transfer Function Parameters With No Aerodynamic Load
Controlsurface
Test stage k, deg/deg p, 1/sec ω, rad/sec ζ
Trailing-edgeactuator
Early 1.0198 10 000 165.26 0.5624Middle 1.0413 10 000 223.57 0.7269Late 1.0159 10 000 212.50 0.5776
Upper spoileractuator
Early 1.1617 10 000 164.00 0.8478Middle 1.1180 10 000 142.02 0.6463Late 1.1219 10 000 138.21 0.6024
Lower spoileractuator
Early 1.0903 10 000 168.45 0.7583Middle 1.0362 10 000 155.08 0.6795Late 1.0942 10 000 175.77 0.7885
8
very closely approximate the experimental data withrespect to both magnitude and phase over the fre-quency range from 0.5 to 12 hertz (at which experi-mental data were available). Figure 6 shows thefrequency responses of the experimental and analyti-cal data for a typical case. Additional plots are pre-sented in the appendix.
Note that the parametersk and p did not varynearly as much over time and aerodynamic loadingcondition as didω andζ. In addition, the first-orderlag p remained very large for both loaded andunloaded conditions throughout the test. As a result,
the term is almost unity over the range offrequencies of interest for the BACT, and its contribu-tion to the frequency responses based on the transferfunction model in equation (1) is negligible. There-fore, the actuator model is in a sense overparameter-ized and a second-order transfer function of thefollowing form by using the parameter values fromtables 1 and 2 could also be used with comparableresults:
(6)
Figure 7 shows the magnitude and phase dif-ferences between the frequency responses of the
Table 2.Analytical Transfer Function Parameters With Aerodynamic Load
Controlsurface
Test stage k, deg/deg p, 1/sec ω, rad/sec ζ
Trailing-edgeactuator
Early 0.9607 10 000 139.20 0.4281Middle 0.9345 10 000 133.44 0.4055Late 1.0468 6 898 242.32 0.7475
Upper spoileractuator
Early 1.1152 9 995 125.65 0.6187Middle 1.1702 9 996 135.87 0.6827Late 1.0767 2.97× 10⁸ 100.72 0.4615
Lower spoileractuator
Early 1.0289 9 998 145.07 0.6314Middle 1.0265 9 999 150.85 0.6444Late N/A N/A N/A N/A
Figure 6. Frequency response for upper spoiler with aerody-namic load.M = 0.80;q = 140 psf; late in wind tunnel test.
0
.5
1.0
1.5
0
−20
−40−50
−10
−30
0 2 4 6 8 10 12Frequency, Hz
2 4 6 8 10 12Frequency, Hz
Phas
e, d
egM
agni
tude
, deg
/deg
ExperimentAnalysis
Model parameters= 1.0767= 2.97 × 10⁸ 1/sec= 100.72 rad/sec= 0.46152
kpωζ
Figure 7. Frequency response error between third- andsecond-order models of lower spoiler. No aerodynamicload;M = 0;q = 0 psf; early in wind tunnel test.
p/ s p+( )
δ s( )δc s( )------------ kω2
s2
2ζωs ω2+ +
--------------------------------------=
3 × 10 –5
2
Mag
nitu
de e
rror
, deg
/deg
1
0 2 4 6Frequency, Hz
8 10 12
.6
.4
Phas
e er
ror,
deg
.2
0 2 4 6Frequency, Hz
8 10 12

9
third- and second-order actuator models, equations (1)and (6), respectively, for a typical case. The parametervalues used in each case were identical. The only dif-ference was the omission ofp in equation (6). Theerrors in both magnitude and phase are very small andclearly justify the use of the second-order transferfunction form (eq. (6)).
Despite the overparameterization and conver-gence issues, the parameter estimation process wassuccessful in constructing analytical models of theactuators. Therefore, the actuator models presented inequations (1) and (6) with the parameter values pre-sented in tables 1 and 2 can be effectively utilized tocharacterize the dynamic behavior of the BACTactuators.
Analysis of BACT Actuator Behavior
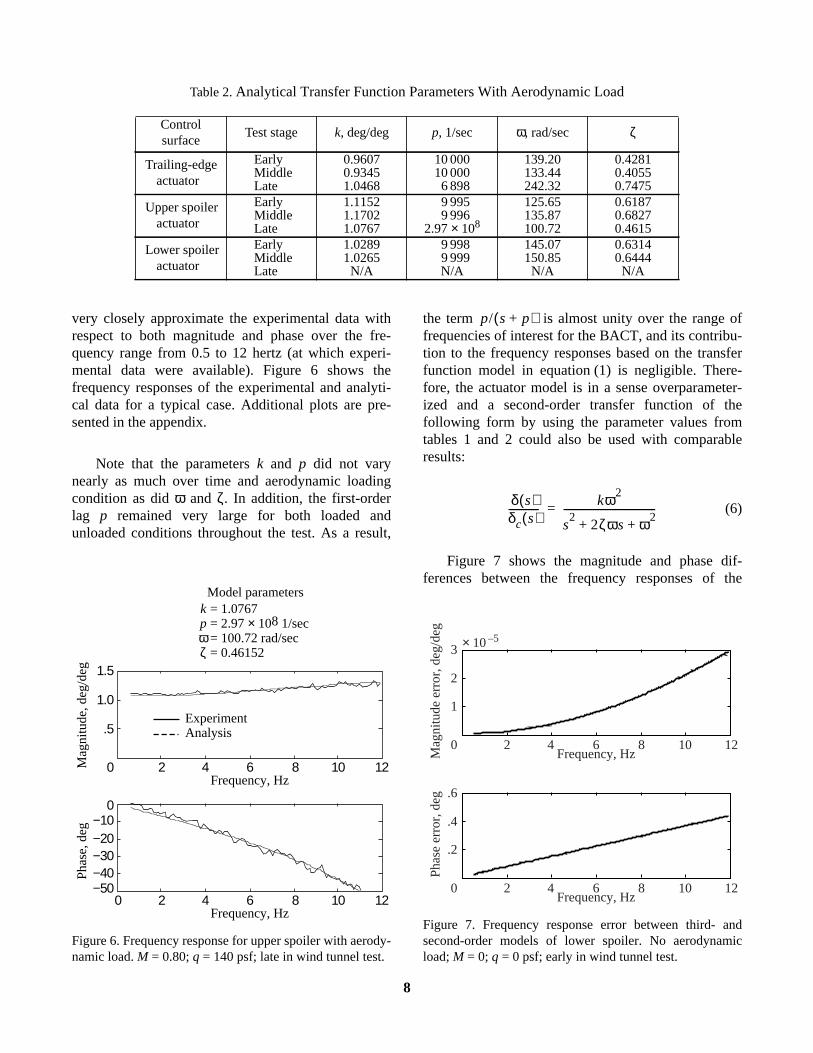
With the analytical actuator models obtained dur-ing the parameter identification process, an analysiswas done to determine consistency of the actuatordynamics during the BACT wind tunnel test. Twoissues of primary concern were addressed—the effectof variations over time (i.e., servo gain variations andmechanical wear) and the effect of hinge moments onthe dynamic characteristics of the actuators. Variationsover time were considered by comparing data over thethree test stages (early, middle, and late). Hinge loadeffects were considered by comparing data for theloaded and unloaded conditions.
If the input-output frequency response behavior ofthe actuators change significantly over time and/orwith hinge loads it would be important to considerthese effects in the design of control laws to assurethat stability and performance are maintained. Magni-tude variations of more that 0.1 and phase variationsof more than 3° were deemed unacceptable. Theseallowable variations correspond to 10 percent of thetypical gain and phase margins mentioned previously.
Comparing the data among the three test stagesindicate notable differences in the parametersω andζcaused by variations over time as can be seen by com-paring the data presented in tables 1 and 2. Figures 8and 9 indicate how actuator frequency and dampingparameters varied over time with no aerodynamichinge load. The effect of the parameter variations isprimarily to introduce phase variations in the actuator
frequency response as shown in figure 10, whichdepicts a chronological comparison of the trailing-edge actuator frequency responses for the unloadedcondition (M = q = 0) and is representative of theeffects of time variations. Additional plots showingthe effect of parameter variations are presented in theappendix.
The differences in the phase response over the fre-quency range from 0.5 to 12 hertz become significantat frequencies beyond 6 hertz. The key aeroelastic fre-quencies for the BACT wind tunnel model are in therange from 3 to 5 hertz. The smaller variations inphase at these frequencies are generally within theallowable range. However, the variations over timecould become significant if phase uncertainty at fre-quencies beyond 5 hertz was an issue in the controlsystem design. The effect of hinge moment on actua-tor behavior is less significant. Figures 11 and 12 indi-cate how actuator frequency and damping parametersvaried because of aerodynamic load early in the test.
Figure 8. Frequency parameterω for unloaded conditionsthroughout wind tunnel test.
Figure 9. Damping parameterζ for unloaded conditionsthroughout wind tunnel test.
0
50
100
150
200
250
ω
Trailingedge
Upperspoiler
Lowerspoiler
EarlyMiddleLate
0
.2
.4
.6
.8
1.0
ζ
Trailingedge
Upperspoiler
Lowerspoiler
EarlyMiddleLate
10
Note that the loaded conditions correspond to differentMach numbers and dynamic pressures and thus char-acterize the qualitative effects of hinge load. Note alsothat the comparisons at the early stage of the test areeffectively isolated from wear and gain variationsbecause little wear and no gain changes had yetoccurred; this is not true for the middle and late stagesof the test. Therefore, comparisons between the loadedand unloaded parameter estimates at the middle andlate stages combine all the possible effects.
Despite these differences, the influence of aerody-namic loading had no significant impact on any of theactuator frequency responses in the frequency range ofinterest (0.5 to 12 hertz), as shown in figure 13. Addi-tional plots are presented in the appendix that show theeffects of aerodynamic loading.
The actuator frequency responses, as a whole, var-ied little over time and under aerodynamic loadthroughout the wind tunnel test. This lack of variationwould imply that very simple actuator models couldbe used in the analysis, design, and simulation of con-trol systems for the BACT wind tunnel model. Theactuators can be effectively modeled by constant coef-ficient, second-order transfer functions of the formshown in equation (6). The coefficients do not, in gen-eral, have to be scheduled with hinge load but somescheduling for wear state might be required if smallphase variations are an issue in control system design.In addition, the parameter variations presentedin tables 1 and 2 could be used to quantify typical
Figure 10. Effects of servo gain variations and mechanicalwear for trailing-edge actuator frequency response with noaerodynamic load.
Figure 11. Frequency parameterω for unloaded and loadedconditions early in wind tunnel test.
0
.5
1.0
1.5
0
–20
–40–50
–10
–30
2 4 6Frequency, Hz
Mag
nitu
de, d
eg/d
egPh
ase,
deg
8 10 12
0 2 4 6Frequency, Hz
8 10 12
EarlyMiddleLate
0
50
100
150
200
ω
Trailingedge
Upperspoiler
Lowerspoiler
UnloadedLoaded
Figure 12. Damping parameterζ for unloaded and loadedconditions early in wind tunnel test.
Figure 13. Effect of aerodynamic load for trailing-edgeactuator frequency response early in wind tunnel test.
0
.2
.4
.6
.8
1.0
ζ
Trailingedge
Upperspoiler
Lowerspoiler
UnloadedLoaded
0
.5
1.0
1.5
0
−20
−40−50
−10
−30
0 2 4 6 8 10 12Frequency, Hz
2 4 6 8 10 12Frequency, Hz
Phas
e, d
egM
agni
tude
, deg
/deg
Unloaded; M = 0; q = 0 psfLoaded; M = 0.86; q = 115 psf

11
actuator uncertainties for application to robustnessstudies of BACT controllers.
Concluding Remarks
Experimental actuator frequency response data,generated during an experiment involving the Bench-mark Active Control Technology (BACT) wind tunnelmodel in the Langley Transonic Dynamics Tunnel,were used as a basis for estimation of parameters intransfer function models of the BACT actuators. Aparameter estimation approach based on minimizingthe difference between experimental and model-basedfrequency responses was successfully employed tomodel the dynamic characteristics of the actuators ofthe BACT wind tunnel model using third-order, con-stant coefficient transfer functions. It was also deter-mined that the actuator model could be reduced tosecond order with negligible impact on the frequencyresponse properties over the frequency range forwhich experimental data were available.
Model-based frequency response data closelyapproximated the experimental data over a wide rangeof wind tunnel operating conditions. Comparativeanalysis of the analytical data corresponding to vari-ous test conditions also indicated little change in actu-ator frequency response behavior due to mechanicalwear, servo gain variations, and aerodynamic load. Asa result, the transfer function models developed hereincan be used to model the dynamics of the BACT actu-ators over a wide range of wind tunnel operating con-ditions for application to control system design andanalysis. In addition, the parameter variations associ-ated with mechanical wear, servo gain variations, andaerodynamic loading effects can be used to developuncertainty models of the actuators for application torobustness analysis of BACT controllers.
NASA Langley Research CenterHampton, VA 23681-2199May 15, 1998
References
1. Durham, Michael H.; Keller, Donald F.; Bennett,Robert M.; and Wieseman, Carol D.: A Status Report ona Model for Benchmark Active Controls Testing.AIAA-91-1011, Apr. 1991.
2. Waszak, Martin R.: Modeling the Benchmark ActiveControl Technology Wind-Tunnel Model for Applica-tion to Flutter Suppression. AIAA-96-3437, July 1996.
3. Hardin, J. C.: Introduction to Time Series Analysis.NASA RP-1145, 1986.
4. Bennett, Robert M.; Eckstrom, Clinton V.; Rivera,Jose A., Jr.; Dansberry, Bryan E.; Farmer, Moses G.;and Durham, Michael H.:The Benchmark AeroelasticModels Program—Description and Highlights of InitialResults. NASA TM-104180, 1991.
5. Rivera, Jose A., Jr.; Dansberry, Bryan E.; Bennett,Robert M.; Durham, Michael H.; and Silva, Walter A.:NACA 0012 Benchmark Model Experimental FlutterResults With Unsteady Pressure Distributions.Thirty-Third AIAA/ASME/ASCE/AHS/ASC Structures, Struc-tural Dynamics and Materials Conference—TechnicalPapers, Part 4, 1992, pp. 1898–1908. (Available asAIAA-92-2396.)
6. Rivera, Jose A., Jr.; Dansberry, Bryan E.; Durham,Michael H.; Bennett, Robert M.; and Silva, Walter A.:Pressure Measurements on a Rectangular Wing With aNACA 0012 Airfoil During Conventional Flutter. NASATM-104211, 1992.
7. Baals, D. D.; and Corliss, W. R.:Wind Tunnels of NASA.NASA SP-440, 1981.
8. Sorokach, Michael R., Jr.: Miniature Linear-to-RotaryMotion Actuator. The 27th Aerospace MechanismsSymposium, Ron Mancini, ed., NASA CP-3205, 1993,pp. 299–314.
9. Wieseman, Carol D.; Hoadley, Sherwood T.; andMcGraw, Sandra M.: On-Line Analysis CapabilitiesDeveloped To Support the Active Flexible Wing Wind-Tunnel Tests. J. Aircr., vol. 32, no. 1, Jan.–Feb. 1995,pp. 39–44.
10. Truxal, John G.:Control Engineers’ Handbook—Servomechanisms, Regulators, and Automatic FeedbackControl Systems. McGraw-Hill Book Co., Inc., 1958.
11. Buttrill, Carey S.; Bacon, Barton J.; Heeg, Jennifer;Houck, Jacob A.; and Wood, David V.:AeroservoelasticSimulation of an Active Flexible Wing Wind TunnelModel. NASA TP-3510, 1996.
12. Gill, Philip E.; Murray, Walter; and Wright,Margaret H.:Practical Optimization. Academic Press,1981.
13. Grace, Andrew:Optimization Toolbox for Use WithMATLAB®. The MathWorks, Inc., 1994.

12
Appendix
Additional Frequency Response Plots
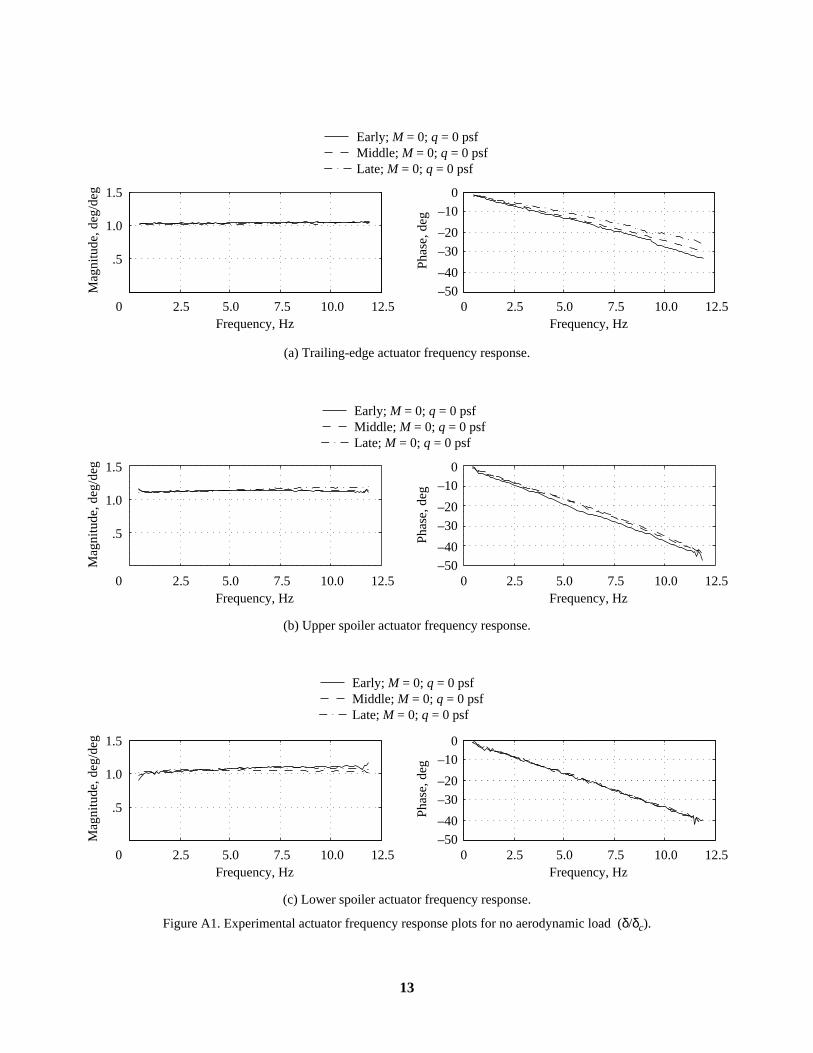
This appendix consists of additional actuator frequency response plots of both experimental and analytical datacorresponding to different times (i.e., levels of wear) and loading conditions. All the plots are in a similar format.Each figure contains several plots, corresponding to frequency response magnitude and phase versus frequency ofthe control surface position with respect to control surface command for the trailing-edge flap TE, upper spoilerUS, and lower spoiler LS actuators. Each plot is linearly scaled with magnitude values ranging between 0 and1.5 deg/deg and phase values ranging between−50° and 0°. Frequency values range between 0.5 and 12 hertz.Aerodynamically unloaded cases correspond to zero Mach numberM and dynamic pressureq conditions. Aerody-namically loaded cases correspond to a range of Mach numbers between 0.63 and 0.91 and dynamic pressuresbetween 74 and 190 psf and thus represent only qualitative effects of hinge load. To establish a reference for chro-nological comparison, three data sets were chosen to represent data acquired near the beginning, near the middle,and near the end of the wind tunnel test and are referred to as “Early,” “Middle,” and “Late,” respectively.
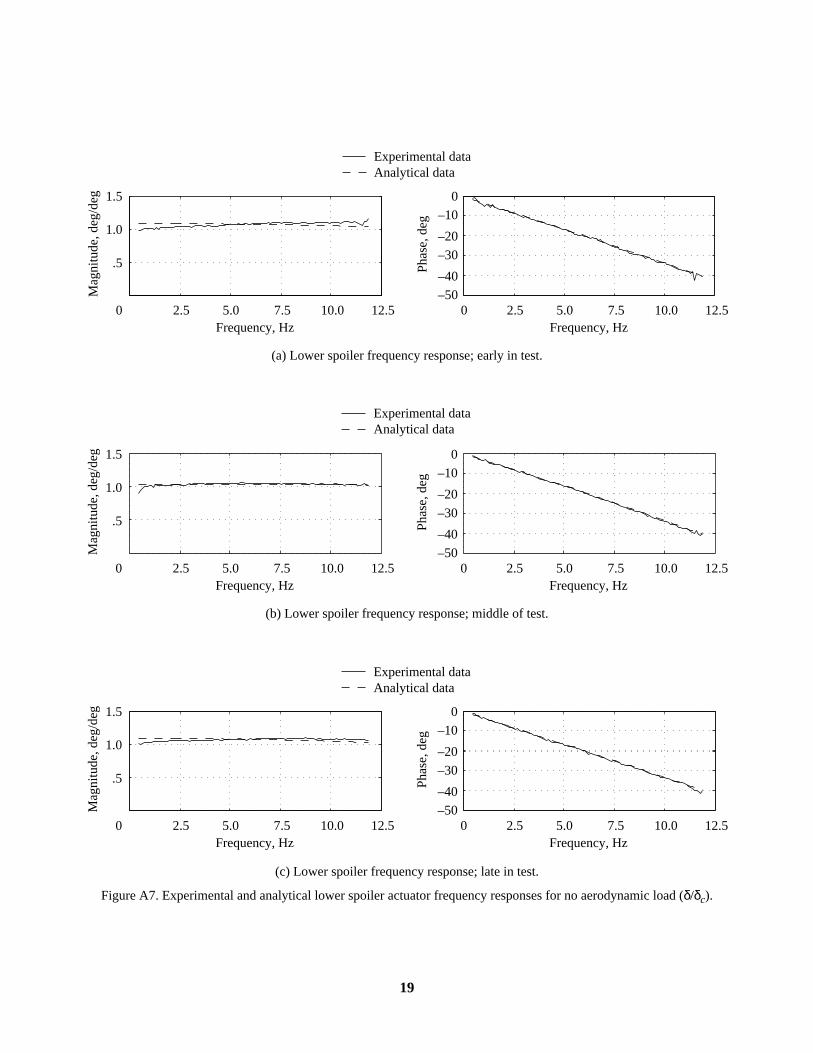
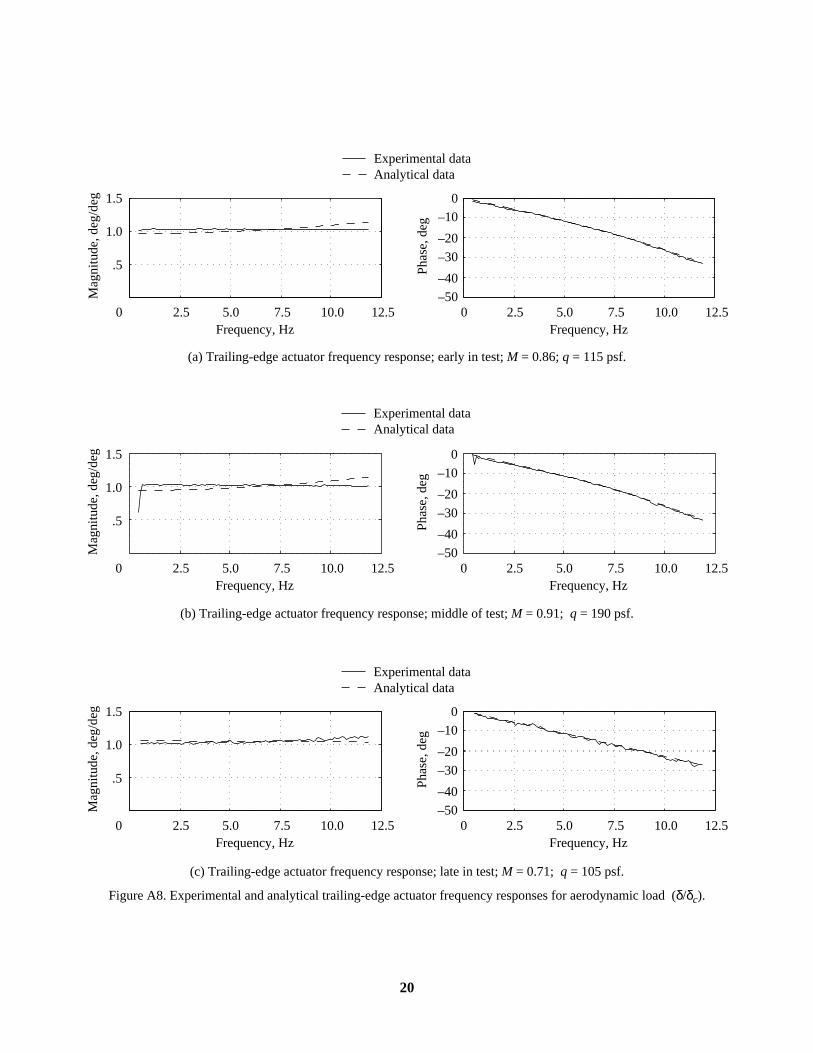
Figures A1 and A2 depict frequency response plots for experimental data over time with and without aerody-namic load. Figures A3 and A4 depict frequency response plots for the analytical data based on the actuator modelin equation (1) with the parameters resulting from the parameter identification process with and without aerody-namic load. Figures A5, A6, and A7 depict frequency response plots for the experimental and analytical data withno aerodynamic hinge loading for the TE, US, and LS actuators, respectively. Figures A8 through A10 depict thecorresponding frequency response plots for the actuators under load.
13
(a) Trailing-edge actuator frequency response.
(b) Upper spoiler actuator frequency response.
(c) Lower spoiler actuator frequency response.
Figure A1. Experimental actuator frequency response plots for no aerodynamic load (δ/δc).
5.02.5 7.5 10.0 12.50
.5
1.0
1.5
Mag
nitu
de, d
eg/d
eg
–40
–50
–20
–30
–10
0
Phas
e, d
eg
Frequency, Hz0 5.02.5 7.5 10.0 12.5
Frequency, Hz
Early; M = 0; q = 0 psfMiddle; M = 0; q = 0 psfLate; M = 0; q = 0 psf
5.02.5 7.5 10.0 12.50
.5
1.0
1.5
Mag
nitu
de, d
eg/d
eg
–40
–50
–20
–30
–10
0
Phas
e, d
eg
Frequency, Hz0 5.02.5 7.5 10.0 12.5
Frequency, Hz
Early; M = 0; q = 0 psfMiddle; M = 0; q = 0 psfLate; M = 0; q = 0 psf
5.02.5 7.5 10.0 12.50
.5
1.0
1.5
Mag
nitu
de, d
eg/d
eg
–40
–50
–20
–30
–10
0
Phas
e, d
eg
Frequency, Hz0 5.02.5 7.5 10.0 12.5
Frequency, Hz
Early; M = 0; q = 0 psfMiddle; M = 0; q = 0 psfLate; M = 0; q = 0 psf

14
(a) Trailing-edge actuator frequency response.
(b) Upper spoiler actuator frequency response.
(c) Lower spoiler actuator frequency response.
Figure A2. Experimental actuator frequency response plots for aerodynamic load (δ/δc).
5.02.5 7.5 10.0 12.50
.5
1.0
1.5
Mag
nitu
de, d
eg/d
eg
–40
–50
–20
–30
–10
0
Phas
e, d
eg
Frequency, Hz0 5.02.5 7.5 10.0 12.5
Frequency, Hz
Early; M = 0; q = 0 psfMiddle; M = 0; q = 0 psfLate; M = 0; q = 0 psf
5.02.5 7.5 10.0 12.50
.5
1.0
1.5
Mag
nitu
de, d
eg/d
eg
–40
–50
–20
–30
–10
0
Phas
e, d
eg
Frequency, Hz0 5.02.5 7.5 10.0 12.5
Frequency, Hz
Early; M = 0.65; q = 74 psfMiddle; M = 0.63; q = 154 psfLate; M = 0.80; q = 140 psf
5.02.5 7.5 10.0 12.50
.5
1.0
1.5
Mag
nitu
de, d
eg/d
eg
–40
–50
–20
–30
–10
0
Phas
e, d
eg
Frequency, Hz0 5.02.5 7.5 10.0 12.5
Frequency, Hz
Early; M = 0.65; q = 74 psfMiddle; M = 0.90; q = 188 psf

15
(a) Trailing-edge actuator frequency response.
(b) Upper spoiler actuator frequency response.
(c) Lower spoiler actuator frequency response.
Figure A3. Analytical actuator frequency response plots for no aerodynamic load (δ/δc).
5.02.5 7.5 10.0 12.50
.5
1.0
1.5
Mag
nitu
de, d
eg/d
eg
–40
–50
–20
–30
–10
0
Phas
e, d
eg
Frequency, Hz0 5.02.5 7.5 10.0 12.5
Frequency, Hz
Early; M = 0; q = 0 psfMiddle; M = 0; q = 0 psfLate; M = 0; q = 0 psf
5.02.5 7.5 10.0 12.50
.5
1.0
1.5
Mag
nitu
de, d
eg/d
eg
–40
–50
–20
–30
–10
0
Phas
e, d
eg
Frequency, Hz0 5.02.5 7.5 10.0 12.5
Frequency, Hz
Early; M = 0; q = 0 psfMiddle; M = 0; q = 0 psfLate; M = 0; q = 0 psf
5.02.5 7.5 10.0 12.50
.5
1.0
1.5
Mag
nitu
de, d
eg/d
eg
–40
–50
–20
–30
–10
0
Phas
e, d
eg
Frequency, Hz0 5.02.5 7.5 10.0 12.5
Frequency, Hz
Early; M = 0; q = 0 psfMiddle; M = 0; q = 0 psfLate; M = 0; q = 0 psf

16
(a) Trailing-edge actuator frequency response.
(b) Upper spoiler actuator frequency response.
(c) Lower spoiler actuator frequency response.
Figure A4. Analytical actuator frequency response plots for aerodynamic load (δ/δc).
5.02.5 7.5 10.0 12.50
.5
1.0
1.5
Mag
nitu
de, d
eg/d
eg
–40
–50
–20
–30
–10
0
Phas
e, d
eg
Frequency, Hz0 5.02.5 7.5 10.0 12.5
Frequency, Hz
Early; M = 0.86; q = 115 psfMiddle; M = 0.91; q = 190 psfLate; M = 0.71; q = 105 psf
5.02.5 7.5 10.0 12.50
.5
1.0
1.5
Mag
nitu
de, d
eg/d
eg
–40
–50
–20
–30
–10
0
Phas
e, d
eg
Frequency, Hz0 5.02.5 7.5 10.0 12.5
Frequency, Hz
Early; M = 0.65; q = 74 psfMiddle; M = 0.63; q = 154 psfLate; M = 0.80; q = 140 psf
5.02.5 7.5 10.0 12.50
.5
1.0
1.5
Mag
nitu
de, d
eg/d
eg
–40
–50
–20
–30
–10
0
Phas
e, d
eg
Frequency, Hz0 5.02.5 7.5 10.0 12.5
Frequency, Hz
Early; M = 0.65; q = 74 psfMiddle; M = 0.90; q = 188 psf

17
(a) Trailing-edge actuator frequency response; early in test.
(b) Trailing-edge actuator frequency response; middle of test.
(c) Trailing-edge actuator frequency response; late in test.
Figure A5. Experimental and analytical trailing-edge actuator frequency responses for no aerodynamic load (δ/δc).
5.02.5 7.5 10.0 12.50
.5
1.0
1.5
Mag
nitu
de, d
eg/d
eg
–40
–50
–20
–30
–10
0
Phas
e, d
eg
Frequency, Hz0 5.02.5 7.5 10.0 12.5
Frequency, Hz
Experimental dataAnalytical data
5.02.5 7.5 10.0 12.50
.5
1.0
1.5
Mag
nitu
de, d
eg/d
eg
–40
–50
–20
–30
–10
0
Phas
e, d
eg
Frequency, Hz0 5.02.5 7.5 10.0 12.5
Frequency, Hz
Experimental dataAnalytical data
5.02.5 7.5 10.0 12.50
.5
1.0
1.5
Mag
nitu
de, d
eg/d
eg
–40
–50
–20
–30
–10
0
Phas
e, d
eg
Frequency, Hz0 5.02.5 7.5 10.0 12.5
Frequency, Hz
Experimental dataAnalytical data

18
(a) Upper spoiler frequency response; early in test.
(b) Upper spoiler frequency response; middle of test.
(c) Upper spoiler frequency response; late in test.
Figure A6. Experimental and analytical upper spoiler actuator frequency responses for no aerodynamic load (δ/δc).
5.02.5 7.5 10.0 12.50
.5
1.0
1.5
Mag
nitu
de, d
eg/d
eg
–40
–50
–20
–30
–10
0
Phas
e, d
eg
Frequency, Hz0 5.02.5 7.5 10.0 12.5
Frequency, Hz
Experimental dataAnalytical data
5.02.5 7.5 10.0 12.50
.5
1.0
1.5
Mag
nitu
de, d
eg/d
eg
–40
–50
–20
–30
–10
0
Phas
e, d
eg
Frequency, Hz0 5.02.5 7.5 10.0 12.5
Frequency, Hz
Experimental dataAnalytical data
5.02.5 7.5 10.0 12.50
.5
1.0
1.5
Mag
nitu
de, d
eg/d
eg
–40
–50
–20
–30
–10
0
Phas
e, d
eg
Frequency, Hz0 5.02.5 7.5 10.0 12.5
Frequency, Hz
Experimental dataAnalytical data
19
(a) Lower spoiler frequency response; early in test.
(b) Lower spoiler frequency response; middle of test.
(c) Lower spoiler frequency response; late in test.
Figure A7. Experimental and analytical lower spoiler actuator frequency responses for no aerodynamic load (δ/δc).
5.02.5 7.5 10.0 12.50
.5
1.0
1.5
Mag
nitu
de, d
eg/d
eg
–40
–50
–20
–30
–10
0
Phas
e, d
eg
Frequency, Hz0 5.02.5 7.5 10.0 12.5
Frequency, Hz
Experimental dataAnalytical data
5.02.5 7.5 10.0 12.50
.5
1.0
1.5
Mag
nitu
de, d
eg/d
eg
–40
–50
–20
–30
–10
0
Phas
e, d
eg
Frequency, Hz0 5.02.5 7.5 10.0 12.5
Frequency, Hz
Experimental dataAnalytical data
5.02.5 7.5 10.0 12.50
.5
1.0
1.5
Mag
nitu
de, d
eg/d
eg
–40
–50
–20
–30
–10
0
Phas
e, d
eg
Frequency, Hz0 5.02.5 7.5 10.0 12.5
Frequency, Hz
Experimental dataAnalytical data
20
(a) Trailing-edge actuator frequency response; early in test;M = 0.86;q = 115 psf.
(b) Trailing-edge actuator frequency response; middle of test;M = 0.91; q = 190 psf.
(c) Trailing-edge actuator frequency response; late in test;M = 0.71; q = 105 psf.
Figure A8. Experimental and analytical trailing-edge actuator frequency responses for aerodynamic load (δ/δc).
5.02.5 7.5 10.0 12.50
.5
1.0
1.5
Mag
nitu
de, d
eg/d
eg
–40
–50
–20
–30
–10
0
Phas
e, d
eg
Frequency, Hz0 5.02.5 7.5 10.0 12.5
Frequency, Hz
Experimental dataAnalytical data
5.02.5 7.5 10.0 12.50
.5
1.0
1.5
Mag
nitu
de, d
eg/d
eg
–40
–50
–20
–30
–10
0
Phas
e, d
eg
Frequency, Hz0 5.02.5 7.5 10.0 12.5
Frequency, Hz
Experimental dataAnalytical data
5.02.5 7.5 10.0 12.50
.5
1.0
1.5
Mag
nitu
de, d
eg/d
eg
–40
–50
–20
–30
–10
0
Phas
e, d
eg
Frequency, Hz0 5.02.5 7.5 10.0 12.5
Frequency, Hz
Experimental dataAnalytical data

21
(a) Upper spoiler frequency response; early in test;M = 0.65;q = 74 psf.
(b) Upper spoiler frequency response; middle of test;M = 0.63;q = 154 psf.
(c) Upper spoiler frequency response; late in test;M = 0.80;q = 140 psf.
Figure A9. Experimental and analytical upper spoiler actuator frequency responses for aerodynamic load (δ/δc).
5.02.5 7.5 10.0 12.50
.5
1.0
1.5
Mag
nitu
de, d
eg/d
eg
–40
–50
–20
–30
–10
0
Phas
e, d
eg
Frequency, Hz0 5.02.5 7.5 10.0 12.5
Frequency, Hz
Experimental dataAnalytical data
5.02.5 7.5 10.0 12.50
.5
1.0
1.5
Mag
nitu
de, d
eg/d
eg
–40
–50
–20
–30
–10
0
Phas
e, d
eg
Frequency, Hz0 5.02.5 7.5 10.0 12.5
Frequency, Hz
Experimental dataAnalytical data
5.02.5 7.5 10.0 12.50
.5
1.0
1.5
Mag
nitu
de, d
eg/d
eg
–40
–50
–20
–30
–10
0
Phas
e, d
eg
Frequency, Hz0 5.02.5 7.5 10.0 12.5
Frequency, Hz
Experimental dataAnalytical data

22
(a) Lower spoiler frequency response; early in test;M = 0.65;q = 74 psf.
(b) Lower spoiler frequency response; middle of test;M = 0.90;q = 188 psf.
Figure A10. Experimental and analytical lower spoiler actuator frequency responses for aerodynamic load (δ/δc).
5.02.5 7.5 10.0 12.50
.5
1.0
1.5
Mag
nitu
de, d
eg/d
eg
–40
–50
–20
–30
–10
0
Phas
e, d
eg
Frequency, Hz0 5.02.5 7.5 10.0 12.5
Frequency, Hz
Experimental dataAnalytical data
5.02.5 7.5 10.0 12.50
.5
1.0
1.5
Mag
nitu
de, d
eg/d
eg
–40
–50
–20
–30
–10
0
Phas
e, d
eg
Frequency, Hz0 5.02.5 7.5 10.0 12.5
Frequency, Hz
Experimental dataAnalytical data
Form ApprovedOMB No. 07704-0188
Public reporting burden for this collection of information is estimated to average 1 hour per response, including the time for reviewing instructions, searching existing data sources,gathering and maintaining the data needed, and completing and reviewing the collection of information. Send comments regarding this burden estimate or any other aspect of thiscollection of information, including suggestions for reducing this burden, to Washington Headquarters Services, Directorate for Information Operations and Reports, 1215 JeffersonDavis Highway, Suite 1204, Arlington, VA 22202-4302, and to the Office of Management and Budget, Paperwork Reduction Project (0704-0188), Washington, DC 20503.
1. AGENCY USE ONLY (Leave blank) 2. REPORT DATE 3. REPORT TYPE AND DATES COVERED
4. TITLE AND SUBTITLE 5. FUNDING NUMBERS
6. AUTHOR(S)
7. PERFORMING ORGANIZATION NAME(S) AND ADDRESS(ES)
9. SPONSORING/MONITORING AGENCY NAME(S) AND ADDRESS(ES)
11. SUPPLEMENTARY NOTES
8. PERFORMING ORGANIZATIONREPORT NUMBER
10. SPONSORING/MONITORINGAGENCY REPORT NUMBER
12a. DISTRIBUTION/AVAILABILITY STATEMENT 12b. DISTRIBUTION CODE
13. ABSTRACT (Maximum 200 words)
14. SUBJECT TERMS
17. SECURITY CLASSIFICATIONOF REPORT
18. SECURITY CLASSIFICATIONOF THIS PAGE
19. SECURITY CLASSIFICATIONOF ABSTRACT
20. LIMITATIONOF ABSTRACT
15. NUMBER OF PAGES
16. PRICE CODE
NSN 7540-01-280-5500 Standard Form 298 (Rev. 2-89)Prescribed by ANSI Std. Z39-18298-102
REPORT DOCUMENTATION PAGE
July 1998 Technical Memorandum
Parameter Estimation of Actuators for Benchmark Active Control Technol-ogy (BACT) Wind Tunnel Model With Analysis of Wear and AerodynamicLoading Effects
WU 505-64-52-01
Martin R. Waszak and Jimmy Fung
L-17540
NASA/TM-1998-208452
Part of the information presented in this report was included in a paper (AIAA-96-3362) presented at the AIAAAtmospheric Flight Mechanics Conference, San Diego, CA, July 29–31, 1996.
This report describes the development of transfer function models for the trailing-edge and upper and lower spoileractuators of the Benchmark Active Control Technology (BACT) wind tunnel model for application to control sys-tem analysis and design. A simple nonlinear least-squares parameter estimation approach is applied to determinetransfer function parameters from frequency response data. Unconstrained quasi-Newton minimization of weightedfrequency response error was employed to estimate the transfer function parameters. An analysis of the behavior ofthe actuators over time to assess the effects of wear and aerodynamic load by using the transfer function models isalso presented. The frequency responses indicate consistent actuator behavior throughout the wind tunnel test andonly slight degradation in effectiveness due to aerodynamic hinge loading. The resulting actuator models have beenused in design, analysis, and simulation of controllers for the BACT to successfully suppress flutter over a widerange of conditions.
Actuator dynamics; Parameter estimation; Optimization 31
A03
NASA Langley Research CenterHampton, VA 23681-2199
National Aeronautics and Space AdministrationWashington, DC 20546-0001
Unclassified–UnlimitedSubject Category 08 Distribution: StandardAvailability: NASA CASI (301) 621-0390
Unclassified Unclassified Unclassified


![Sensors and Actuators A: Physical€¦ · M.T. Rahman et al. / Sensors and Actuators A 248 (2016) 94–103 95 cal parameter for power consumption in IoT devices/applications [12–14].](https://static.fdocuments.in/doc/165x107/5f5da68d890f472adb034451/sensors-and-actuators-a-physical-mt-rahman-et-al-sensors-and-actuators-a-248.jpg)