
Paragliding Competitions over the Years - 2013 Edition
55
Paragliding Competitions over the Years Edition 2013 ©azoom.ch Jörg Ewald 29 April 2013
-
Upload
joerg-ewald -
Category
Documents
-
view
214 -
download
0
description
An in-depth look into the statistics of international paragliding cross-country competitions from 2001 to 2012, including an investigation into the possible reasons for most recent developments.
Transcript of Paragliding Competitions over the Years - 2013 Edition

Paragliding Competitions
over the Years
Edition 2013
©azoom.ch
Jörg Ewald
29 April 2013

Paragliding Competitions over the Years Edition 2013
29 April 2013 1
Contents
1 Summary.......................................................................................................................................... 2
1.1 Key Indicators .......................................................................................................................... 2
1.1.1 Competitions ................................................................................................................... 2
1.1.2 Competitors ..................................................................................................................... 3
1.1.3 Participations ................................................................................................................... 3
1.2 Conclusions Part 1 ................................................................................................................... 4
1.3 The Crisis.................................................................................................................................. 4
1.4 Conclusions, Part 2 .................................................................................................................. 4
1.5 Recommendations................................................................................................................... 5
2 Introduction ..................................................................................................................................... 6
3 Competitions, Competitors and Participations over the Years ....................................................... 7
3.1 Competitions ........................................................................................................................... 7
3.1.1 Competitions and Tasks................................................................................................... 8
3.2 Competitors ............................................................................................................................. 9
3.2.1 Ranked Pilots ................................................................................................................. 10
3.2.2 Newcomers .................................................................................................................... 10
3.2.3 Active Years ................................................................................................................... 12
3.3 Participations ......................................................................................................................... 12
3.3.1 Participations per Pilot .................................................................................................. 13
3.3.2 Competition Size ............................................................................................................ 17
3.4 Overall View .......................................................................................................................... 19
4 Conclusions Part 1 ......................................................................................................................... 21
4.1 Conclusion 1: Ours is a small but competitive world ............................................................ 21
4.2 Conclusion 2: Ours is not a sticky world ................................................................................ 22
4.3 Conclusion 3: Everything is connected .................................................................................. 22
4.4 Conclusion 4: Something happened in 2011 ......................................................................... 22
5 Further Investigations ................................................................................................................... 24
5.1 Weather ................................................................................................................................. 24
5.2 Economy – and some more on weather ............................................................................... 25
5.3 Accessibility ........................................................................................................................... 28
5.4 Piedrahita – and some more on economics .......................................................................... 29
6 Conclusions Part 2 ......................................................................................................................... 34
6.1 Crisis or Normal? ................................................................................................................... 34
6.2 Causes .................................................................................................................................... 34
6.2.1 External Causes.............................................................................................................. 34
6.2.2 Internal Causes .............................................................................................................. 35
6.3 Remedies ............................................................................................................................... 35
Appendix A: Methodology ..................................................................................................................... 38
Appendix B: Raw data ........................................................................................................................... 40
Appendix C: Database queries .............................................................................................................. 50

Paragliding Competitions over the Years Edition 2013
29 April 2013 2
1 Summary How many paragliding competitions are there, year after year? How many pilots compete, and how
often? This report was created to answer these questions, and many others which are closely
related, with the goal of gaining some insights into the inner workings of the international paragliding
competitions scene.
There is no central place where information on all competitions worldwide is collected. The report is
based on all the FAI Category 2 paragliding competitions listed in CIVL’s World Pilot Ranking System,
WPRS. The WPRS includes the vast majority of all international competitions, dating back to 2001.
Even though the data this report is based on stems from CIVL, this is a purely private initiative and
not connected to CIVL in any way.
1.1 Key Indicators
In a first part, the report looks at the three major indicators: Number of competitions, number of
competitors, and number of participations in 2012 (Table 1). It then compares those figures with the
values of previous years (Figure 1). For each of these major indicators, a number of minor ones, like
for example years of pilots’ activity, or the average size of competitions, is evaluated as well.
Average 2006-2011 2012
Number of competitions 165 162
Number of pilots 3884 3906
Number of participations 8542 7939
Table 1: Key indicators for 2012 compared to long-term average
Figure 1: Key indicators over time
1.1.1 Competitions
• The number of competitions dropped in 2012 for the second time in a row, to the level of
2008.
100%
105%
110%
115%
120%
125%
130%
135%
140%
2006 2007 2008 2009 2010 2011 2012
competitions
pilots
participations

Paragliding Competitions over the Years Edition 2013
29 April 2013 3
• The share of competitions without any tasks was above average in 2012 at 19%, but still
smaller than the all-time high in 2011 where 24% of all sanctioned competitions did not
submit any results.
• The number of planned tasks corresponds with the number of competitions and dropped
from 762 in 2011 to 707 in 2012, well below the all-time high of 813 in 2010.
• In 2012, 41% of all planned tasks had to be cancelled. This is in line with the long-time
average, and much better than 2011, where 48% of all tasks had been cancelled.
• The average competition is planned for a bit more than four tasks. This number has been
stable for the last several years.
• The average competition manages to score a bit more than 3 tasks. In 2011, the number had
been below 3, but recovered to the usual level in 2012.
1.1.2 Competitors
• The number of competitors dropped in 2012 for the second time in a row, to the level of
2008.
• The share of female pilots lay between 7 and 8% for the last few years. It was slightly higher,
at exactly 8%, in 2011 and 2012.
• The number of competitors ranked in the WPRS dropped in 2011, but rose in 2012 due to a
rule change in early 2012 which added roughly 1000 pilots to the ranking. The share of
female pilots in the ranking dropped slightly from 7.9% in 2011 to 7.7% in 2012.
• The number of newcomers reached an all-time high in 2010 at 1234, dropped to the lowest
level since 2003 in 2011 (932) and remained at that level in 2012 (937).
• The number of pilots who stopped competing dropped from the all-time high of 1204 in 2011
to 978 in 2012, which is still above the long-term average.
• The vast majority of pilots are only active for one year. Only 460 pilots (4%) have been active
for 10 or more years.
1.1.3 Participations
• The number of participations recovered slightly in 2012, rising from 7817 in 2011 to 7939,
which is still lower than the level of 2007.
• The share of female participations rose for the second year in a row, up from 8.7% in 2011 to
9.4% in 2012.
• The average pilot competed in exactly 2 competitions in 2012, the same as 2011, and
therefore much lower than previous years back to 2005.
• The average female pilot, on the other hand, increased her participation from 2.1
competitions in 2011 to 2.4 in 2012, which is at the usual level for the past few years.
• 54% of all pilots competed in only a single competition in 2012. On the other hand, only 569
pilots (15%) participated in four or more competitions in 2012.
• Throughout the whole period from 2001 to 2012, 36% of all pilots competed in only a single
competition. 983 pilots (7%) have competed in 20 or more competitions during this period.
• The average competition size rose from an all-time low of 57.5 pilots in 2011 to 60.6 in 2012,
which is still lower than any year before 2010.
• A comparison with previous years shows that mainly the number of big competitions with
more than 100 competitors was lower in 2012 than the long-term average.

Paragliding Competitions over the Years Edition 2013
29 April 2013 4
1.2 Conclusions Part 1
The findings given above lead to a first set of conclusions:
1. The international paragliding competition scene is relatively small in numbers, but quite big
in relation to the overall population of paraglider pilots, compared to other sports. But many
of the paragliding competitors show a level of commitment to the sport that would not
qualify them as international competitors in other sports.
2. Many of the international competitors only participate in a single competition, and then
leave the scene again. Our sport lacks the clear structure and career outline given through
multiple competition levels separated by clear qualification criteria as seen in other sports.
3. The development of the three main indicators, numbers of competitions, competitors and
participations, is interconnected.
4. The international paragliding scene currently finds itself in a crisis, with all three main
indicators declining over the last 2 years, to levels which had formerly been reached around
2008 or even earlier.
1.3 The Crisis
Further investigations are performed to test four hypothesis regarding conclusion number 4 above,
to find whether any of the following are possible causes for the crisis:
• Bad weather
• The global economic situation, especially the downturn of the past few years
• Competitions and especially competition wings have become increasingly inaccessible
• The accidents in Piedrahita during the 2011 World Championships, followed by the
suspension of Competition Class wings by CIVL
This work includes comparing the key indicators between paragliding and hang gliding, a sport which
is exposed to a comparable, if not the same economic environment, as well as the same
meteorological conditions. Figure 2 gives an abstract view of the relative growth of the two sports
over the past three years. For an explanation refer to section 5.4 below.
Figure 2: Growth rates of hang gliding and paragliding
For all four of the investigated potential causes, at least some supporting data can be identified. This
leads to a second set of conclusions, regarding the current crisis.
1.4 Conclusions, Part 2
1. There are multiple factors involved, both internal and external ones.
2. The external factors include the global economy, the weather in the period from 2009 to
2011, as well as the accidents in Piedrahita and the ensuing controversy regarding various
aspects of our sport spurred by CIVL’s reaction to those accidents.
Jan
-08
Fe
b-0
8
Ma
r-0
8
Ap
r-0
8
Ma
y-0
8
Jun
-08
Jul-
08
Au
g-0
8
Se
p-0
8
Oct
-08
No
v-0
8
De
c-0
8
Jan
-09
Fe
b-0
9
Ma
r-0
9
Ap
r-0
9
Ma
y-0
9
Jun
-09
Jul-
09
Au
g-0
9
Se
p-0
9
Oct
-09
No
v-0
9
De
c-0
9
Jan
-10
Fe
b-1
0
Ma
r-1
0
Ap
r-1
0
Ma
y-1
0
Jun
-10
Jul-
10
Au
g-1
0
Se
p-1
0
Oct
-10
No
v-1
0
De
c-1
0
Jan
-11
Fe
b-1
1
Ma
r-1
1
Ap
r-1
1
Ma
y-1
1
Jun
-11
Jul-
11
Au
g-1
1
Se
p-1
1
Oct
-11
No
v-1
1
De
c-1
1
Jan
-12
Fe
b-1
2
Ma
r-1
2
Ap
r-1
2
Ma
y-1
2
Jun
-12
Jul-
12
Au
g-1
2
Se
p-1
2
Oct
-12
No
v-1
2
De
c-1
2
paragliding
hang gliding

Paragliding Competitions over the Years Edition 2013
29 April 2013 5
3. The internal factors refer back to the initial conclusion number 3, and further acknowledge
the extent to which the numbers of competitions, competitors and participations influence
each other. Another internal factor is the increasing gap between top pilots and newcomers
in terms of experience and skill levels, which leads to frustration and only short involvement
amongst the newcomers.
1.5 Recommendations
Although not formulated as a goal initially, the report concludes with a small set of recommendations
for CIVL which could help initiate a turnaround and bring international paragliding competitions back
into a positive growth zone. This because the author is convinced that competitions are the best
learning environment for aspiring cross-country pilots, and that a growing and healthy competition
scene contributes to the safety of paragliding as a whole.
The main recommendations are:
1. Short term: Encourage competition organizers to set up competitions, for example by
temporarily reducing the sanctioning fee.
2. Medium term: Investigate and clarify various aspects of our sport, mainly the actual safety
situation in competitions, the actual liability situation for competition organizers and other
stake-holders, as well as the wings to be flown in the near future.
3. Long-term: Develop multiple competition levels within the FAI Category 2, to facilitate
newcomers’ paths towards the top, and keep them interested in competing for more than
just one or two competitions.
©azoom.ch

Paragliding Competitions over the Years Edition 2013
29 April 2013 6
2 Introduction A few years ago, on the paragliding forum
1, a discussion sprang up about the key numbers in our
sport: How many competitions are there each year? How many people compete? And are the
numbers rising or falling, what are the trends? Being a competitor myself, and one with a very strong
affinity to data and numbers, I didn’t take long to convince myself that I wanted to find answers to
those questions. There is no place that gathers information on all competitions world-wide,
unfortunately. But there is a place where information on most international competitions is
collected: CIVL’s World Pilot Ranking System (WPRS). I used my Web browser and a big Excel spread
sheet to answer the questions above: at that time browsing through the ranking pages online was my
only access to the vast amounts of data buried within the WPRS.
The results were pretty interesting, at least to me. So a year later I was very curious to find out about
the further development, and especially whether my impression of the flying conditions in that
particular year (bad, I thought) were somehow reflected by the WPRS, for example in the number of
flown tasks (they were not). And this has now become more or less a habit: Every year I’d add the
last twelve months’ worth of competitions, sometimes along with some more columns and charts to
my Excel sheet. Sometimes I would post the updated charts on the forum, but just as often not – no
point in going over last year’s data if last year is already 9 months away.
A very central member of the forum community once accused me – jokingly I believe – of having a
number fetish. I guess he was not too wrong.
Then along came 2011: Grave accidents, a cancelled world championship, suspended gliders, politics,
task forces. I could barely wait for the year to end – not only, but also so that I could update my
charts and see how big the damage had been. Pretty big, I thought, but there may have been other
factors at work. I decided to wait another year, to gather more data and hopefully get a clearer
picture.
2012 has gone by now as well. In the meantime I’ve become responsible for CIVL’s software systems,
and gained access to the WPRS database. No more Web browser and Excel, I can now evaluate the
underlying data straight away, and gain insights that had not been possible before. This report is the
result of those evaluations. But note that this work grew out of my very own and private curiosity
and is by no means any official CIVL project, nor is this report an official CIVL document.
I owe a big “Thank you!” to Tom Payne and Adrian Thomas for reading through and giving valuable
feedback on a first draft of this report.
Enjoy!
©azoom.ch
1 www.paraglidingforum.com

Paragliding Competitions over the Years Edition 2013
29 April 2013 7
3 Competitions, Competitors and Participations over the Years Information on how the data presented here was collected can be found in Appendix A, along with
the definitions of all the terms used herein. The actual data this report is based on can be found in
Appendix B. Appendix C lists all the database queries that were used to extract this data from the
WPRS database.
The WPRS database covers competitions from 2001 to 2012. A summary is given in Table 2.
First competition Mexico Open 01, 2001-01-14 – 2001-01-20
Latest competition 2012 SA Winelands, 2012-12-16 – 2012-12-22
Number of competitions 1433
Number of flown tasks 4118
Number of participations 78’508 (6391 by female pilots)
Number of pilots 12’963 (998 female)
Table 2: Key figures for all competitions since 2001
3.1 Competitions
The key figures for competitions in 2012 are given in Table 3. According to those figures, 2012 was
more or less in line with the long-term average since 2006. We had almost as many competitions,
and therefore almost as many planned tasks. The percentage of competitions with no tasks is a little
above average. The percentage of scored tasks is the same as the long-term average, indicating
average global meteorological conditions in 2012.
Average 2006-2011 2012
Number of competitions 165 162
Competitions with no task 27 (16%) 31 (19%)
Number of planned tasks 732 707
Number of scored tasks 435 (59%) 416 (59%)
Table 3: Competitions in 2012
To compare current numbers with the past, we only go back as far as 2006, for the following reasons:
1. Up until 2006, competitions which had been granted sanctioning, but did not submit results
(because the weather did not allow flying any tasks, for example) do not appear in the
database. This means that competition numbers from before 2006 cannot be compared
directly with those after 2006.
2. Up until 2006, multi-event-competitions were sanctioned as one single competition. This
again has an influence on comparability between competitions from before and after 2006.
But of course averages don’t tell the whole story. Figure 3 shows the development of competitions
over the years: After a steady growth, to a peak in 2010 with 186 sanctioned competitions (157 with
tasks) by 2012 the number of competitions has dropped back to the level of 2008. The share of
competitions which did not submit any results was exceptionally high in 2011, but in 2012 is still
higher than any time between 2006 and 2010.

Paragliding Competitions over the Years Edition 2013
29 April 2013 8
Figure 3: Number of competitions
3.1.1 Competitions and Tasks
As was to be expected, Figure 4 shows that the number of planned tasks correlates with the number
of competitions. It also peaks in 2010 with 813 planned tasks (483 of which were actually flown); by
2012 the number of planned tasks has dropped back to 707, the level of 2008. The fraction of
cancelled tasks (which includes competitions that did not submit results for other reasons) was
highest also in 2010, and dropped back to a normal level of 41% in 2012.
Figure 4: Competitions and tasks
In Figure 5 we see that the planned number of tasks per competition is on a slight, but steady decline
since 2006: Competitions tend to be shorter, which can probably also be explained by an increasing
number of sanctioned week-end competitions. In 2012, the average competition was announced for
4.36 tasks. The much higher average number of tasks per competition in the period before 2006 can
be explained by the fact that up to 2006, competition series (like for example national leagues) could
be sanctioned as one single competition.
0%
5%
10%
15%
20%
25%
-
20
40
60
80
100
120
140
160
180
200
2001 2002 2003 2004 2005 2006 2007 2008 2009 2010 2011 2012
% with 0 tasks
competitions
competitions with tasks
0%
10%
20%
30%
40%
50%
60%
-
100
200
300
400
500
600
700
800
900
2001 2002 2003 2004 2005 2006 2007 2008 2009 2010 2011 2012
% tasks cancelled
competitions
tasks planned
tasks flown
Paragliding Competitions over the Years Edition 2013
29 April 2013 9
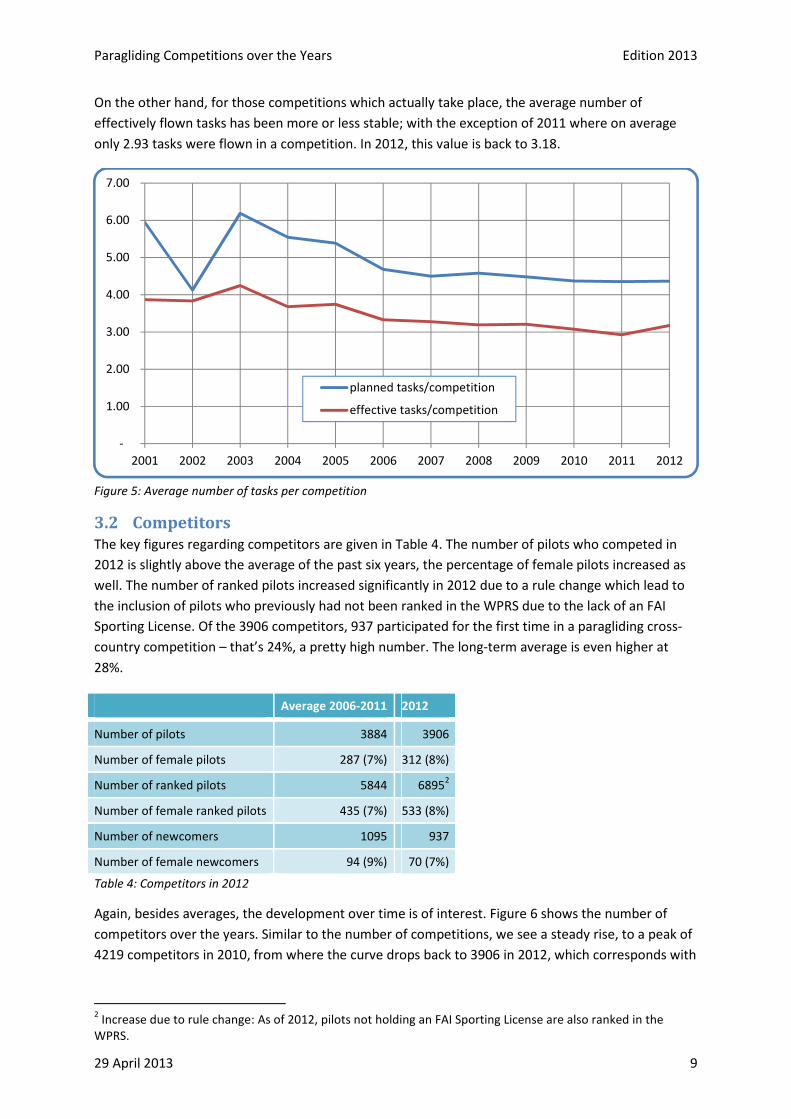
On the other hand, for those competitions which actually take place, the average number of
effectively flown tasks has been more or less stable; with the exception of 2011 where on average
only 2.93 tasks were flown in a competition. In 2012, this value is back to 3.18.
Figure 5: Average number of tasks per competition
3.2 Competitors
The key figures regarding competitors are given in Table 4. The number of pilots who competed in
2012 is slightly above the average of the past six years, the percentage of female pilots increased as
well. The number of ranked pilots increased significantly in 2012 due to a rule change which lead to
the inclusion of pilots who previously had not been ranked in the WPRS due to the lack of an FAI
Sporting License. Of the 3906 competitors, 937 participated for the first time in a paragliding cross-
country competition – that’s 24%, a pretty high number. The long-term average is even higher at
28%.
Average 2006-2011 2012
Number of pilots 3884 3906
Number of female pilots 287 (7%) 312 (8%)
Number of ranked pilots 5844 68952
Number of female ranked pilots 435 (7%) 533 (8%)
Number of newcomers 1095 937
Number of female newcomers 94 (9%) 70 (7%)
Table 4: Competitors in 2012
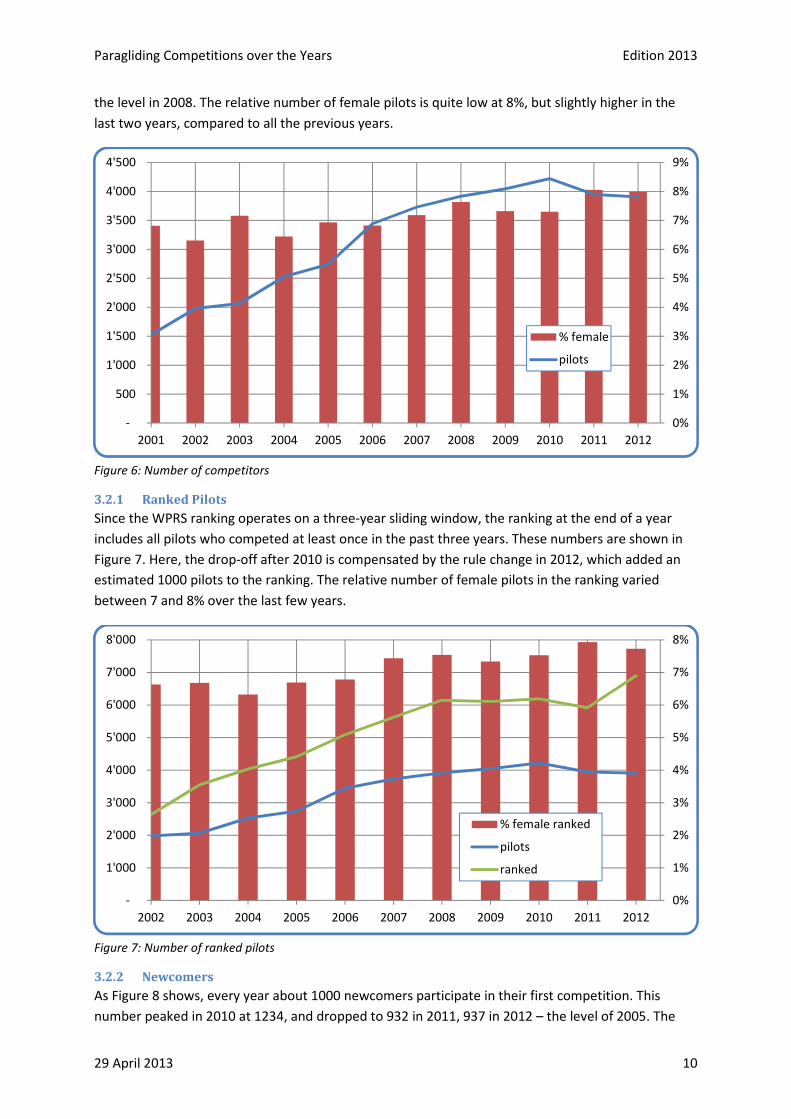
Again, besides averages, the development over time is of interest. Figure 6 shows the number of
competitors over the years. Similar to the number of competitions, we see a steady rise, to a peak of
4219 competitors in 2010, from where the curve drops back to 3906 in 2012, which corresponds with
2 Increase due to rule change: As of 2012, pilots not holding an FAI Sporting License are also ranked in the
WPRS.
-
1.00
2.00
3.00
4.00
5.00
6.00
7.00
2001 2002 2003 2004 2005 2006 2007 2008 2009 2010 2011 2012
planned tasks/competition
effective tasks/competition
Paragliding Competitions over the Years Edition 2013
29 April 2013 10
the level in 2008. The relative number of female pilots is quite low at 8%, but slightly higher in the
last two years, compared to all the previous years.
Figure 6: Number of competitors
3.2.1 Ranked Pilots
Since the WPRS ranking operates on a three-year sliding window, the ranking at the end of a year
includes all pilots who competed at least once in the past three years. These numbers are shown in
Figure 7. Here, the drop-off after 2010 is compensated by the rule change in 2012, which added an
estimated 1000 pilots to the ranking. The relative number of female pilots in the ranking varied
between 7 and 8% over the last few years.
Figure 7: Number of ranked pilots
3.2.2 Newcomers
As Figure 8 shows, every year about 1000 newcomers participate in their first competition. This
number peaked in 2010 at 1234, and dropped to 932 in 2011, 937 in 2012 – the level of 2005. The
0%
1%
2%
3%
4%
5%
6%
7%
8%
9%
-
500
1'000
1'500
2'000
2'500
3'000
3'500
4'000
4'500
2001 2002 2003 2004 2005 2006 2007 2008 2009 2010 2011 2012
% female
pilots
0%
1%
2%
3%
4%
5%
6%
7%
8%
-
1'000
2'000
3'000
4'000
5'000
6'000
7'000
8'000
2002 2003 2004 2005 2006 2007 2008 2009 2010 2011 2012
% female ranked
pilots
ranked

Paragliding Competitions over the Years Edition 2013
29 April 2013 11
percentage of female newcomers declined from 9.4% to 7.6 between 2007 and 2010, jumped up to
almost 10.8% in 2011, just to drop down to 7.5% in 2012. Of notice here is the distribution between
male and female newcomers, especially the surge in new women in 2011. This can at least partially
be attributed to the second, very successful Women’s Open in 2011, which was the first competition
ever for eight female pilots.
Figure 8: Newcomers
Figure 9 shows the annual growth as a percentage of the previous year’s number of pilots, along with
the number of pilots who entered the scene as newcomers, and the number of pilots who competed
for the last time in that year. For the period from 2007 to 2010, the number of pilots grew steadily at
a rate of about 5%. This was followed by negative growth both in 2011 and 2012, when obviously
more pilots stopped competing than new ones started. The level of newcomers in 2011 and 2012
corresponds with that previously seen in 2005. The level of leaving pilots has been unprecedentedly
high over the last three years.
Figure 9: Pilot growth
0.0%
2.0%
4.0%
6.0%
8.0%
10.0%
12.0%
-
500
1'000
1'500
2'000
2'500
3'000
3'500
4'000
4'500
2002 2003 2004 2005 2006 2007 2008 2009 2010 2011 2012
% female newcomers
pilots
newcomers
-10%
-5%
0%
5%
10%
15%
20%
25%
30%
35%
-400
-200
-
200
400
600
800
1'000
1'200
1'400
2001 2002 2003 2004 2005 2006 2007 2008 2009 2010 2011 2012
newcomers
leaving
% annual growth

Paragliding Competitions over the Years Edition 2013
29 April 2013 12
3.2.3 Active Years
With the relatively high turnover we see so far, it is interesting to find out for how many years pilots
compete actively. This is shown in Table 5 as well as in Figure 10: The vast majority of pilots are only
active for a single year, only a relatively small group of 460 pilots, or 4%, has been active for ten or
more years since 2001. On average a pilot is active for 2.94 years, the median (50% above, 50%
below) lies at 2 years.
Number of active years Number of pilots Number of pilots active for x or more years
1 5377 (41%) 12963 (100%)
2 2444 (19%) 7586 (59%)
3 1474 (11%) 5142 (40%)
4 988 (8%) 3668 (28%)
5 722 (6%) 2680 (21%)
6 523 (4%) 1958 (15%)
7 405 (3%) 1435 (11%)
8 313 (2%) 1030 (8%)
9 257 (2%) 717 (6%)
10 188 (1%) 460 (4%)
11 133 (1%) 272 (2%)
12 139 (1%) 139 (1%)
Table 5: How many years are pilots active?
Figure 10: Number of pilots for years of activity
3.3 Participations
The key figures for participations are given in Table 6. The number of participations in 2012 is
significantly below the average of the years 2006 to 2011. And this is due to the male pilots,
participations of female pilots are higher than the 2006 to 2011 average, and make up 9% of all
0
1000
2000
3000
4000
5000
6000
1 2 3 4 5 6 7 8 9 10 11 12
active years
number of pilots

Paragliding Competitions over the Years Edition 2013
29 April 2013 13
participations, 1% more than the long-term average. In general, it can be said that the few women
who compete do so in more competitions than their male counterparts: While the average pilot
competed in exactly two competitions in 2012 (down from a 2.2 long-term average), the average
female pilot participated in 2.4 competitions in 2012, which corresponds with the long-term average.
The average competition size (given as participations per competition) was also below the long-term
average in 2012.
Average 2006-2011 2012
Number of participations 8542 7939
Number of female participations 688 (8%) 747 (9%)
Participations / pilot 2.2 2.0
Participations / female pilot 2.4 2.4
Participations / competition 62.4 60.6
Table 6: Participations in 2012
The development of participations over time is given in Figure 11. Similar to the number of
competing pilots, it shows a peak in 2009, with 9473, from where it dropped to 7817 in 2011, and
climbed back to 7939 in 2012, which corresponds with the level previously reached in 2006. Female
participation remained much more stable over the last few years, peaking at 766 in 2009, to a low of
682 in 2011, and climbing back to 747 in 2012. Due to the considerable drop in male participations,
the female percentage rose from 8% in 2010 to almost 9.5% in 2012.
Figure 11: Participation over time
3.3.1 Participations per Pilot
The development of average competitions per pilot is given in Figure 12. It also shows a peak in 2009,
at 2.3, followed by a decline to just below 2.0 in 2011, from where it grew back to a bit above 2.0 in
2012. Female pilots on average compete consistently in more competitions than their male
colleagues, peaking in 2009 at 2.6 competitions per pilot, from where it dropped to 2.1 in 2011, and
grew back to 2.4 in 2012.
0.0%
1.0%
2.0%
3.0%
4.0%
5.0%
6.0%
7.0%
8.0%
9.0%
10.0%
-
1'000
2'000
3'000
4'000
5'000
6'000
7'000
8'000
9'000
10'000
2001 2002 2003 2004 2005 2006 2007 2008 2009 2010 2011 2012
% female participations
participations
female participations

Paragliding Competitions over the Years Edition 2013
29 April 2013 14
Figure 12: Participation per pilot
In Appendix B, Table B-3 shows the distribution of pilots over the different numbers of participations
over the years. For 2012, this distribution is given in Figure 13. Of the 3906 competitors, 2126
competed only in a single competition. At the other end of the spectrum, there were 17 pilots who
competed in ten or more competitions, including one pilot who competed in 13 competitions in
2012.
Figure 13: Number of pilots per number of participations in 2012
As Figure 14 shows, this distribution is not unusual – it corresponds quite well with the long-term
data. The only noticeable difference between 2012 and the years before is a higher-than-average
number of pilots who only compete in a single competition. In general, over 50% of all competitors
each year participate in only one competition. The maximum of competitions in a single year flown
by a single pilot is 16, in 2009.
-
0.5
1.0
1.5
2.0
2.5
3.0
2001 2002 2003 2004 2005 2006 2007 2008 2009 2010 2011 2012
participation/pilot
female participation per pilot
0
500
1000
1500
2000
2500
1 2 3 4 5 6 7 8 9 10 11 12 13 14 15 16
participations in 2012
number of pilots

Paragliding Competitions over the Years Edition 2013
29 April 2013 15
Figure 14: Distribution of pilots (in % of total pilots) over number of participations
As shown Table 7 as well as in Figure 15, only 596 pilots, or 15%, participated in 2012 in four or more
competitions, which is necessary to be well placed in the WPRS, where each pilot’s four best results
count for their ranking. This is well below the peaks of 2008 and 2009, where 19% of all pilots
competed in four or more competitions each year.
Average 2006-2011 2012
Pilots 3884 3906
Pilots with 2 or more participations per year 1959 (50%) 1780 (46%)
Pilots with 3 or more participations per year 1152 (30%) 982 (25%)
Pilots with 4 or more participations per year 681 (18%) 569 (15%)
Table 7: Number of pilots taking part in multiple competitions per year
0%
10%
20%
30%
40%
50%
60%
1 2 3 4 5 6 7 8 9 10 11 12 13 14 15 16
participations
% 2001-2011
%2012

Paragliding Competitions over the Years Edition 2013
29 April 2013 16
Figure 15: Pilots taking part in multiple competitions per year
Table 8 and Figure 16 show the total number of competitions in which pilots participated throughout
the whole period of 2001 to 2012. The majority of all pilots, 4653 of the 12963, or 36%, competed
only in a single competition. The record is held by a pilot who has competed in 117 competitions to
date. The average pilot participated in 6 competitions throughout his or her career. But the median is
much lower, at 2 competitions, meaning that 50% of all pilots only competed in 1 or 2 competitions.
Number of participations Number of pilots Number of pilots participating in x or more competitions
1 4653 (36%) 12963 (100%)
2 2006 (15%) 8310 (64%)
3 1190 (9%) 6372 (48%)
4 782 (6%) 5164 (39%)
5 588 (5%) 4375 (33%)
6 465 (4%) 3772 (28%)
7 394 (3%) 3308 (25%)
8 352 (3%) 2912 (22%)
9 238 (2%) 2573 (19%)
10 213 (2%) 2325 (17%)
11 185 (1%) 2120 (16%)
12 166 (1%) 1921 (14%)
13 144 (1%) 1752 (13%)
14 131 (1%) 1604 (12%)
15 113 (1%) 1479 (11%)
0%
5%
10%
15%
20%
25%
0
500
1000
1500
2000
2500
3000
3500
4000
4500
2001 2002 2003 2004 2005 2006 2007 2008 2009 2010 2011 2012
% >=4 participations
pilots
>= 4 participations
>=3 participations
>=2 participations

Paragliding Competitions over the Years Edition 2013
29 April 2013 17
Number of participations Number of pilots Number of pilots participating in x or more competitions
16 110 (1%) 1356 (10%)
17 98 (1%) 1261 (9%)
18 95 (1%) 1161 (8%)
19 71 (1%) 1063 (7%)
20 76 (1%) 983 (7%)
21-117 1-59 (<1%) 904 (6%)
Table 8: How many competitions do pilots participate in?
The group of pilots who competed in 20 or more competitions counts 983 pilots, or 7%.
Figure 16: Number of pilots per number of participations in 2001-2012
3.3.2 Competition Size
The number of participations per competition tells us how many pilots on average competed in a
competition in a given year. As shown in Table 6, the number of participations per competition in
2012 was 60.6, quite a bit below the average of 62.4 for the years 2006 to 2011. The distribution over
the years is given in Figure 17.
0
500
1000
1500
2000
2500
3000
3500
4000
4500
5000
1 4 7
10
13
16
19
22
25
28
31
34
37
40
43
46
49
52
55
58
61
64
67
70
73
77
85
11
7
participations 2001-2012
number of pilots

Paragliding Competitions over the Years Edition 2013
29 April 2013 18
Figure 17: Participations per competition
If we consider that in 2012, the number of competitions dropped, but the number of participations
rose slightly (see also Figure 20), it is only logical that the average number of competitors per
competition rose as well. In economic terms, one could say that after a short decline, demand for
competitions rose again in 2012, but with the decreasing supply in competitions, the existing
competitions managed to draw a higher number of competitors than in the years before.
Figure 18 shows the different competition sizes, and how many such competitions took place in
2012. More than half (74) of the 131 competitions which submitted tasks had 60 or less participants.
At the other end of the spectrum, only 23 competitions, less than 20%, had 100 or more competitors.
Figure 18: Distribution of competition sizes in 2012
Figure 19 shows how 2012 compares in competition sizes with the years 2001 through 2011. The
most obvious difference is the much smaller numbers of competitions with 120 and more
competitors. The shrinking attendance numbers in the World Cup certainly played a role here: In
-10%
-5%
0%
5%
10%
15%
-50.0
-40.0
-30.0
-20.0
-10.0
0.0
10.0
20.0
30.0
40.0
50.0
60.0
70.0
2001 2002 2003 2004 2005 2006 2007 2008 2009 2010 2011 2012
% growth
participations per competition
0
5
10
15
20
25
30
35
<20 21-40 41-60 61-80 81-100 101-120 121-140 141-160
number of competitors in competition
number of competitions

Paragliding Competitions over the Years Edition 2013
29 April 2013 19
2012, only two of the six PWC events saw fields of more than 120 pilots. On the other hand, we see
an increase in the competitions with between 101 and 120 pilots – that’s where the remaining four
PWC events of 2012 placed. Also, the fraction of very small competitions with less than 20
competitors grew in 2012.
Figure 19: Distribution of competitions (in % of total competitions) over number of pilots
3.4 Overall View
Finally, we look at the combination of the three topics above: competitions, competitors and
participations. Figure 20 shows the development of those three indicators over time, given in relation
to the 2006 baseline. We can see that of the three values, the pilot and competition number seem to
be clearly coupled: The more competitions, the more competitors, and as soon as the number of
competitions drop, the competitor numbers do the same. Interestingly, the number of participations
drops off before the two other values, and shows a first decline already in 2010.
Figure 20: Competitions, pilots and participations
0%
5%
10%
15%
20%
25%
<20 21-40 41-60 61-80 81-100 101-120 121-140 141-160
number of competitors in competition
2012
2001-2011
100%
105%
110%
115%
120%
125%
130%
135%
140%
2006 2007 2008 2009 2010 2011 2012
competitions
pilots
participations

Paragliding Competitions over the Years Edition 2013
29 April 2013 20
©azoom.ch

Paragliding Competitions over the Years Edition 2013
29 April 2013 21
4 Conclusions Part 1
From the information above, I draw a series of conclusions:
4.1 Conclusion 1: Ours is a small but competitive world
Two studies by the Paraglider Manufacturers Association (PMA) counted 101’000 active paraglider
pilots in 2009 and 98’120 in 20103. Since no newer figures exist, we assume a global paraglider pilot
population of 100’000. Of those 100’000 pilots, 3906 competed in a paragliding cross-country
competition that was sanctioned as an FAI Category 2 event by CIVL – that’s about 4% of the total
pilot population. Of those 3906, only 569, about 0.6% of the total pilot population, participated in
four or more events, showing ambitions for a good ranking in the World Pilot Ranking System. But
while these numbers may seem low, if we compare them with other, more mainstream sports, we
find that the percentage of paraglider pilots involved in international competitions is relatively high,
see Table 9. For example, if we had the same percentage of international competitors as skiing, we
would only see 10 pilots compete internationally every year.
One explanation for this high share of competition pilots is that international paragliding
competitions are often seen as an inexpensive form of a guided flying vacation. Many pilots
participate under this aspect in, for example, the British or Nordic Opens, or other national
championships. But their commitment level would not qualify them as international competitors in
other sports.
Skiing Tennis Paragliding Paragliding >4 competitions
Participants worldwide 110 Million4 ~50 Million
5 ~100’000 ~100’000
International competitors 2012 12’1196 3187
7 3906 569
Percentage 0.01% 0.01% 3.90% 0.57%
Table 9: Comparison of international competitor numbers
Nevertheless, looking at those figures, I can’t help but wonder whether the absolute or relative
numbers of pilots in question justify the amount of time, resources and regulatory power that has
been brought upon our sport by national associations, associations of national associations, and
manufacturer associations, in any reasonable way. On the one hand, we should probably feel
honoured, as a group, to be awarded so much “management attention”. On the other hand, I have
the feeling that all those hours spent by people with not much connection to the active international
competition world, discussing competitions and figuring out ways to change them, could be spent
much more productively on other topics, to the benefit of a broader pilot population.
3 http://www.p-m-a.info/english/welcome/news.html - “PMA Paragliding Market Study”
4 http://www.vanat.ch/RM-world-report-2011.pdf, p12
5 A very rough estimate. No information on global tennis player numbers could be found. The estimate is based
on the US market, for which varying sources give numbers between 12.5 and 30 Million. For this estimate, the
lowest of these values was quadrupled. At any rate, the number will be of the correct magnitude. 6 The International Ski Federation (FIS) lists 12119 competitors in their FIS points list valid for the end of 2012
(http://www.fis-ski.com/uk/604/607.html?sector=AL&listid=190). 7 ATP (men) 1983 + WTA (women) 1204=3187 as of December 31
st 2012

Paragliding Competitions over the Years Edition 2013
29 April 2013 22
4.2 Conclusion 2: Ours is not a sticky world
Of the 12963 pilots who competed in the 2001 to 2012 period, 5377 (41%) did so for only a single
season. 4691(36%) of them even participated in only a single competition. The number of
newcomers is compensated every year by roughly the same number of people leaving the
international competition arena. The number of long-time competitors, active for a decade or longer,
only makes up for about 10% of the annual competitors.
This all clearly shows: Most pilots do not stick around. It would appear that the effort required for
having a long-lasting international competition career is more than most pilots are willing to put up
with. Participating in one’s national championship is one thing, but even that seems to be more of a
“once in a lifetime” than a “once a year” event for many pilots. Participating in four or more
competitions, and therefore competing for top ranking in the WPRS, is done by only about 15% of all
competitors.
A possible explanation for this is that a few long-term competitors, due to their experience, fly at a
much higher level than newcomers. This makes it hard for those newcomers to break into
competition and to stay motivated long enough to get to the top level themselves. Other sports
resolve this by having a large number of competitions targeted at different levels, with competitive
qualification to the higher levels and easier conditions at the lower levels. This is probably an area
where large competition associations like CIVL and PWCA could become active to help improve the
outlook of our sport.
4.3 Conclusion 3: Everything is connected
The more competitions there are, the more pilots compete and are ranked in the WPRS. The more
pilots compete, the higher the number of pilots who compete more than once a year, who start on a
path towards a long-lasting international career. And the more competitors exist, the more
organizers find themselves who organize competitions. On the other hand, as soon as the number of
competitions drops, the number of competitors follows suit. Or the other way around, if competitors
stay away, competitions will not be profitable and organizers will stop organizing them in the
following years.
4.4 Conclusion 4: Something happened in 2011
The figures and tables shown above display a relatively small, but steady growth for the period
between 2006 and 2010. This changes quite dramatically in 2011, and does not recover much, if at
all, in 2012. Obviously, paragliding competitions are going through a phase of crisis right now, the
first since 2001, if not longer. There is probably no single cause for this development. In the
following section, I look more into this recent drop, and its possible causes.

Paragliding Competitions over the Years Edition 2013
29 April 2013 23
©azoom.ch

Paragliding Competitions over the Years Edition 2013
29 April 2013 24
5 Further Investigations A number of theories have been brought up as possible explanations for the crisis mentioned in
section 4.4. Here, I postulate the four I heard mentioned most often, as hypothesis, and then try to
support or dispel them subsequently.
• H1: Bad weather is responsible for the decline. This resulted in a decrease of interest in
competitions.
• H2: The global economic situation discourages pilots from participating in international
competitions.
• H3: Competitions have become increasingly inaccessible, not the least due to the wings being
flown in them. The introduction of the new 2-line technology aggravated this problem and
lead to a decline of pilot interest.
• H4: The accidents in Piedrahita during the 2011 World Championships, followed by the
suspension of Competition Class wings by CIVL, which was replicated by many national
associations, had an impact on the key numbers discussed in this report.
5.1 Weather
Bad weather leads to cancelled tasks. To my knowledge, the only other factor in our sport – apart
from a suspension of our wings, of course – that consistently leads to task cancellations are rescue
operations along the course line. But from my experience, these lead to far fewer cancellations than
bad weather. So for the purpose of this study, we assume that if an individual task is cancelled, it’s
due to bad weather.
If all tasks of a competition are cancelled, the competition will be cancelled; no results will be
submitted to the WPRS. But the same – no results submitted to the WPRS – can also happen if the
competition is cancelled for other reasons, for instance due to lack of registered pilots, financial
problems on the organizer’s side, or political reasons.
So in order to isolate the effects of weather on task numbers, a distinction between cancelled tasks
and cancelled competitions is required. Only cancelled tasks of competitions which submitted a
result can be exclusively attributed to bad weather (considering the restriction regarding rescue
operations mentioned above). Figure 21 takes this into account when calculating the percentage of
tasks that were cancelled due to bad weather. The investigated period spans from 2006 to 2012. For
the time before 2006, calculating planned task numbers from competition dates is difficult since at
that time competitions could include multiple events.
On average, 34% of all tasks had to be cancelled due to bad weather. From 2006 to 2008, the actual
percentage lies below this average, whereas it rises steadily above average from 2009 to 2011, a year
of exceptionally bad weather for competitions it would seem. 2012, in turn, is back to the level of
2008.
Given these numbers, it could be imagined that the three worse-than-average years 2009, 2010 and
2011 resulted in more pilots becoming frustrated with and quitting the competition scene, and fewer
organizers willing to put the effort into organizing a competition.

Paragliding Competitions over the Years Edition 2013
29 April 2013 25
Figure 21: Tasks cancelled due to bad weather
5.2 Economy – and some more on weather
Measuring the effects of any economic development on paragliding competitions would be very hard
given the data available. But if direct measuring is not possible, sometimes it’s possible to compare
with something similar. Fortunately, there exists a sport that offers itself quite naturally as a
benchmark: Hang gliding. Competitions in hang gliding work almost identically to those in
paragliding, they attract a similar clientele, and they operate under very much the same economic
constraints, if only at a slightly increased scale due to higher costs for equipment and transportation.
To understand the following figures, it is important to consider that the absolute numbers in hang
gliding are considerably lower than in paragliding (see Appendix B for the raw data used here).
Therefore, a small change in the number of pilots, for example, will result in much more pronounced
differences in the relative values. An individual competition or competitor in hang gliding counts for
more than in paragliding in those graphs.
Figure 22 shows that the number of competitions for hang gliding and paragliding grew at
comparable rates from 2006 to 2009. Hang gliding competitions declined in 2010, but increased
again both in 2011 and 2012 – those years when paragliding competitions declined for the first time
ever.
0%
5%
10%
15%
20%
25%
30%
35%
40%
2006 2007 2008 2009 2010 2011 2012
%task cancelled
due to weatheraverage

Paragliding Competitions over the Years Edition 2013
29 April 2013 26
Figure 22: Competition numbers compared
Interestingly, unlike in paragliding, the hang gliding pilot numbers do not follow the competition
numbers, as can be seen in Figure 23. Hang gliding experienced a dip in pilot numbers both in 2008,
when paragliding still was growing, and in 2011, along with paragliding. 2012 marked the year with
the highest number of hang gliding competitors to date – also very unlike paragliding.
Figure 23: Pilot numbers compared
Another difference between the two sports can be seen in Figure 24: Whereas the participations in
hang gliding competitions very much followed development in pilot numbers, the same cannot be
said about paragliding. Participation in paragliding competition drops off already in 2010, before the
decline in both competitions and pilots in 2011. In hang gliding, after a dip in 2011, participation
increased again in 2012 to the highest number to date.
100%
105%
110%
115%
120%
125%
130%
135%
140%
2006 2007 2008 2009 2010 2011 2012
paragliding
hang gliding
100%
105%
110%
115%
120%
125%
130%
135%
2006 2007 2008 2009 2010 2011 2012
paragliding
hang gliding

Paragliding Competitions over the Years Edition 2013
29 April 2013 27
Figure 24: Participation numbers compared
If the decline in competitions and competitors had been mainly driven by the economic situation, I
would have expected a much closer similarity between hang gliding and paragliding in their relative
development over the past few years. This is not the case, leading to the conclusion that H2 cannot
be confirmed.
But let’s return to the weather for a moment. Hang gliding pilots suffer from the same, so how did
the phase from 2006 to 2012 look for them in terms of cancelled tasks? Figure 25 shows that in
general, hang gliding tasks are less likely to be cancelled due to weather (probably because hang
gliders can launch in and cope with higher wind speeds than paragliders), but nevertheless, they also
experienced a very bad year in 2011, the only one significantly worse than the long-term average.
But that does not yet explain why the competition and pilot numbers in paragliding remained in their
downward cycle in 2012, whereas hang gliding figures climbed that year.
Another thing that is interesting to see in Figure 25: After the accidents in Piedrahita, and the many
discussions on the danger of competition wings, and paragliding competitions in general, one could
have assumed that meet directors in paragliding competitions would be much more inclined to
cancelling tasks which they usually, before Piedrahita, would have let run. Incidental evidence to that
point: The Swiss Paragliding League cancelled their last training weekend in 2011 due to concerns
about pilot safety. But in general, if that assumption were true, we’d see a different picture here, one
where more paragliding tasks than hang gliding tasks (which were likely unaffected by the whole
safety discussion in paragliding) were cancelled in 2011. This not being the case, we can assume that
paragliding meet directors continued doing a great job and only cancelled tasks when and where it
was called for.
100%
110%
120%
130%
140%
150%
160%
170%
2006 2007 2008 2009 2010 2011 2012
paragliding
hang gliding

Paragliding Competitions over the Years Edition 2013
29 April 2013 28
Figure 25: Effect of weather on tasks
5.3 Accessibility
If we look closely at the number of newcomers over the past eleven years, we see that the peak, with
1234 new pilots, coincides with the year when the 2-line technology first became commercially
available. This was also the second biggest relative growth since 2001. If these new wings didn’t
attract more new pilots, then they also obviously didn’t drive them away. Up to the world
championships in July of 2011, the general perception was still that 2-liner wings, including the newly
released second generation, were a great step forward, and were more accessible than previous
generations of competition wings. But after a first season, an often-voiced sentiment was that
competing with top pilots on their top wings has become less fun for newcomers (who usually fly
lower-performance wings) due to the increased performance gap. The sudden drop of almost 25% of
the expected newcomers in 2011 may be attributed to this sentiment.
Figure 26: Newcomers, and their growth
0%
5%
10%
15%
20%
25%
30%
35%
40%
45%
2006 2007 2008 2009 2010 2011 2012
% cancelled for weather PG
% cancelled for weather HG
average PG
average HG
-30%
-20%
-10%
0%
10%
20%
30%
-1'300
-650
-
650
1'300
2002 2003 2004 2005 2006 2007 2008 2009 2010 2011 2012
% annual growth
newcomers

Paragliding Competitions over the Years Edition 2013
29 April 2013 29
From 2012, all major competitions, including the World Cup, as well as the majority of other
Category 2 events, required EN certified wings. These are the wings which have a reputation
especially amongst the supporters of such a certification requirement for competition wings, of being
safer and more accessible than open class wings. Predictions were that the number of newcomers
would rise, when all those pilots who didn’t want to fly an open class wing would finally join the
international competition scene and be competitive. Surprisingly, this did not happen, the number of
newcomers stayed as low in 2012 as it had been in 2011.
An explanation for this may be that from the potential newcomers, both open class pilots (because
they were no longer allowed to fly their wings) and pilots of certified wings (because they felt that
their wing wouldn’t be competitive against the newest generation of certified competition wings)
were discouraged from starting to compete. Especially pilots who formerly used to start out with an
EN-D certified wing, but got ranked in a separate Serial Class ranking, found themselves in an
unfortunate situation: Either step down to an EN-C wing to be ranked in a class apart from the top
pilots with their competition wings. Or stick to EN-D, but then be either outclassed by better pilots
and wings. Or start flying such a certified competition wing as well, something that generally is not
recommended at the outset of a competition career.
So I think it’s safe to conclude that the indeed did the introduction of the new glider technology in
2010 contribute to a drop in newcomers in 2011. Not because those wings were less accessible, but
because the performance gap between those wings and classic EN-D wings had become too big. On
the other hand, making EN-D certification mandatory for most major competitions did not reverse
this trend; the situation remained unchanged in 2012. But in combination with the realization that
most pilots only dip their toes into the competition pond once or twice before moving on, this
indicates to me that there is indeed support for H3.
5.4 Piedrahita – and some more on economics
Can the decline in the key figures be attributed to “Piedrahita”, the accidents, the suspended
competition class wings, the stopped world championship and all the discussions that ensued? To
find that out, I looked at the three key indicators: Number of competitions, number of participations,
and number of competitors. For the first two, I determined the monthly values, and then added up
twelve-month periods. For the competitor numbers, I also looked at twelve-month periods, to
determine the total number of individual competitors for each such period.
For each of these series, I calculated the monthly growth rate, in relation to the previous month.
Finally, to remove seasonal effects, I calculated a sliding average, taking into account the past 12
months. A value of 1% therefore means that the indicator in question grew with 1% from month to
month on average over the past 12 months. Changes that can be attributed to a singular event
become visible as a sudden increase or decrease from one month to another.
The results of this analysis can be found in Figure 27 for paragliding and Figure 28 for hang gliding.
Looking at those two graphics, a number of things stand out:
1. The three indicators run in sync most of the time. For hang gliding, there was a period in late
2008/early 2009 when this was not the case: The number of competitions grew, but the
number of competitors and participation declined. In paragliding a similar phenomenon can
be observed for the second half of 2010, and early 2011: Participation was lower than 12
months prior, but competitors and competitions higher.

Paragliding Competitions over the Years Edition 2013
29 April 2013 30
2. For the past few years, hang gliding went through cycles of growth and reduction, with each
cycle lasting about 12 to 16 months and with the growth phases being more pronounced.
The last downward cycle started in late 2010 and lasted until early 2012. In paragliding, a
similar downwards cycle seems to be starting at around the same time (after a prolonged
period of shrinking participation), but has not come to an end yet.
3. The cycles can be seen more clearly in Figure 29, where I added up the three values for each
month, and smoothed the curve for more clarity. Note especially how the drop below 0
coincides for the both curves at the end of 2010.
4. The months when FAI-1 competitions occur leave a dent for paragliding, and then a peak
again 12 months later. See July 2008/2009 (European Championships Nis), May 2010/2011
(European Championships Abtenau) and July 2011/2012 (World Championships Piedrahita).
This can be explained by the fact that during, and often just before and after such events,
fewer FAI-2 competitions take place. This then in turn increases the relative growth a year
later, when everything goes back to normal. The 2009 World Championships in Valle de
Bravo do not exhibit this due to the small number of competitions usually held in
January/February.
5. Looking at the last two years in paragliding in more detail, we see that all three indicators
had started to drop by March 2011. This trend was shortly distorted in May and June due to
the effect described above (Europeans 2010), and the fact that many organizers squeezed
their competitions into June when normally they would have run them in July (for example,
up from 29 competitions in 2010 to 39 in 2011). In July, they dropped significantly, as could
be expected, when besides the World Championships in Piedrahita only 18 FAI-2
competitions took place (compared to 30 in 2010). In August and September, the numbers
recover slightly, again as would be expected, to compensate for July. But over the following
ten months, we see dropping figures in seven. The last drop, in June 2012, exists because
June 2012 was back to “normal” with 26 competitions. From then on, we see stabilization at
a low level for competitors and participation that will hopefully turn into growth again in
2013. The number of competitions on the other hand kept shrinking until October 2012,
where we count only 158 competitions in the twelve prior months. The last time this number
had been as low was exactly four years earlier, in October 2008.
What to make of these observations? With the monthly view, some parallels between hang gliding
and paragliding become obvious that had not been discernible before. I think it is safe to conclude
that in 2011, pilots in both sports reduced their level of involvement. This could have been due to the
weather – but 2010 had not been a bad year for hang gliding. Which leaves economic factors as a
potential culprit, and I think H2 can be considered at least partially supported by these findings.
But unlike hang gliding, paragliding did not recover by late 2011, on the contrary: The numbers just
kept on dropping, eroding away most of the growth our sport has seen over the past 5 years. And I
believe it is sound to assume that Piedrahita and its aftermath play a crucial role in this: The two
months immediately after Piedrahita were not much affected: competitions had been organized,
paid for, and pilots tried to cope with the situation as much as possible. Nevertheless, cases are
known where pilots opted to not switch to an EN-D wing for their national championships at last
minute as early as August. This all became more pronounced as organizers had time to cancel
competitions, and pilots had time to decide against signing up for the ones that still took place.

Paragliding Competitions over the Years Edition 2013
29 April 2013 31
Figure 27: Annual change over 12 month periods for paragliding
Figure 28: Annual change over 12 month periods for hang gliding
-2.00%
-1.50%
-1.00%
-0.50%
0.00%
0.50%
1.00%
1.50%
2.00%
Jan
-08
Fe
b-0
8
Ma
r-0
8
Ap
r-0
8
Ma
y-0
8
Jun
-08
Jul-
08
Au
g-0
8
Se
p-0
8
Oct
-08
No
v-0
8
De
c-0
8
Jan
-09
Fe
b-0
9
Ma
r-0
9
Ap
r-0
9
Ma
y-0
9
Jun
-09
Jul-
09
Au
g-0
9
Se
p-0
9
Oct
-09
No
v-0
9
De
c-0
9
Jan
-10
Fe
b-1
0
Ma
r-1
0
Ap
r-1
0
Ma
y-1
0
Jun
-10
Jul-
10
Au
g-1
0
Se
p-1
0
Oct
-10
No
v-1
0
De
c-1
0
Jan
-11
Fe
b-1
1
Ma
r-1
1
Ap
r-1
1
Ma
y-1
1
Jun
-11
Jul-
11
Au
g-1
1
Se
p-1
1
Oct
-11
No
v-1
1
De
c-1
1
Jan
-12
Fe
b-1
2
Ma
r-1
2
Ap
r-1
2
Ma
y-1
2
Jun
-12
Jul-
12
Au
g-1
2
Se
p-1
2
Oct
-12
No
v-1
2
De
c-1
2
Paragliding
% annual change competitions
% annual change participations
% annual change competitors
-3%
-2%
-1%
0%
1%
2%
3%
4%
Jan
08
Fe
b 0
8
Mrz
08
Ap
r 0
8
Ma
i 0
8
Jun
08
Jul
08
Au
g 0
8
Se
p 0
8
Ok
t 0
8
No
v 0
8
De
z 0
8
Jan
09
Fe
b 0
9
Mrz
09
Ap
r 0
9
Ma
i 0
9
Jun
09
Jul
09
Au
g 0
9
Se
p 0
9
Ok
t 0
9
No
v 0
9
De
z 0
9
Jan
10
Fe
b 1
0
Mrz
10
Ap
r 1
0
Ma
i 1
0
Jun
10
Jul
10
Au
g 1
0
Se
p 1
0
Ok
t 1
0
No
v 1
0
De
z 1
0
Jan
11
Fe
b 1
1
Mrz
11
Ap
r 1
1
Ma
i 1
1
Jun
11
Jul
11
Au
g 1
1
Se
p 1
1
Ok
t 1
1
No
v 1
1
De
z 1
1
Jan
12
Fe
b 1
2
Mrz
12
Ap
r 1
2
Ma
i 1
2
Jun
12
Jul
12
Au
g 1
2
Se
p 1
2
Ok
t 1
2
No
v 1
2
De
z 1
2
Hang Gliding% annual change competitions
% annual change participations
% annual change competitors

Paragliding Competitions over the Years Edition 2013
29 April 2013 32
Figure 29: Growth of competitions, competitors and participations, combined and smoothed, 2008-2012
Out of curiosity, I drew the curves from Figure 29 for the whole set of data available, from 2001 to 2012. In the resulting Figure 30, we see that from 2004 to 2008,
paragliding also went through very regular cycles of more or less growth, similar to the ones we see in hang gliding from 2009. This is something to probably
explore more in a future edition of this report.
Figure 30: Growth of competitions, competitors and participations, combined and smoothed, 2002-2012
Jan
-08
Fe
b-0
8
Ma
r-0
8
Ap
r-0
8
Ma
y-0
8
Jun
-08
Jul-
08
Au
g-0
8
Se
p-0
8
Oct
-08
No
v-0
8
De
c-0
8
Jan
-09
Fe
b-0
9
Ma
r-0
9
Ap
r-0
9
Ma
y-0
9
Jun
-09
Jul-
09
Au
g-0
9
Se
p-0
9
Oct
-09
No
v-0
9
De
c-0
9
Jan
-10
Fe
b-1
0
Ma
r-1
0
Ap
r-1
0
Ma
y-1
0
Jun
-10
Jul-
10
Au
g-1
0
Se
p-1
0
Oct
-10
No
v-1
0
De
c-1
0
Jan
-11
Fe
b-1
1
Ma
r-1
1
Ap
r-1
1
Ma
y-1
1
Jun
-11
Jul-
11
Au
g-1
1
Se
p-1
1
Oct
-11
No
v-1
1
De
c-1
1
Jan
-12
Fe
b-1
2
Ma
r-1
2
Ap
r-1
2
Ma
y-1
2
Jun
-12
Jul-
12
Au
g-1
2
Se
p-1
2
Oct
-12
No
v-1
2
De
c-1
2
paragliding
hang gliding
Jan-02 Jul-02 Jan-03 Jul-03 Jan-04 Jul-04 Jan-05 Jul-05 Jan-06 Jul-06 Jan-07 Jul-07 Jan-08 Jul-08 Jan-09 Jul-09 Jan-10 Jul-10 Jan-11 Jul-11 Jan-12 Jul-12
paragliding
hang gliding

Paragliding Competitions over the Years Edition 2013
29 April 2013 33
©azoom.ch

Paragliding Competitions over the Years Edition 2013
29 April 2013 34
6 Conclusions Part 2 After having gone over the data a second time, in more detail, and having compared paragliding
competitions with hang gliding competitions, did any of my initial conclusions change? Yes and no. I
still uphold the first three conclusions: Ours is a small, competitive but not very sticky world where
everything is connected. But before looking at reasons for the observed downturn, let’s briefly look
at it the fourth conclusion from a different angle:
6.1 Crisis or Normal?
In section 4.4 I concluded that paragliding competitions seem to be going through a crisis. Is that
really so, or did the sport simply surpass its prime, and is now on its natural path towards an
equilibrium at a lower level? Is it possible that paragliding as a whole is no longer growing, and that
this effect has now caught up with competitions?
I do not think so, and maintain that what we observe is indeed a crisis. Unfortunately, we do not
have reliable figures for pilots world-wide except for the years 2009 and 2010. But one of the bigger
contributors to the roughly 100’000 pilots, the Swiss association (SHV) saw a steady growth in
membership numbers over the past few years, which makes me doubt that the overall number was
much higher than 100’000 before 2009, or much lower in the years since then. Additionally, all the
figures available indicated to me a healthy environment up to 2010, with no sign of saturation.
But whatever happened that caused the downturn, it didn’t happen exclusively in 2011. There were
multiple factors at play, some of them starting already a few years earlier.
6.2 Causes
As shown above, I was able to find arguments supporting all four of the hypothesis formulated at the
outset of this investigation at least partially. On the other hand, I could not find anything that would
dispel them. What seems most likely for me by now is that the crisis we are currently observing in
paragliding competitions is an effect of multiple causes, both “internal” and “external” ones.
6.2.1 External Causes
I consider the following as external factors to the system of international paragliding competitions:
1. The economic downturn caused pilots to reduce the time and money they dedicate to
paragliding competitions
2. Increasingly bad weather from 2009 to 2011, causing higher-than-average task cancellation,
lead to an increasing number of frustrated pilots who quit the scene. In parallel, some people
who had been observing competitions with the idea in mind of joining eventually may have
decided against that since from their perspective competitions are not so much fun after all.
3. The aftermath of Piedrahita had three effects of its own:
a. Organizers became concerned regarding safety and liability, and some of them
cancelled their competitions, or decided to no longer run them in the following year.
b. The widely publicised discussion about safety made pilots reconsider their
involvement with the sport, which caused some to give up competing internationally,
and others, who would have started otherwise, to stay away.
c. The suspension of competition class wings, which was adapted by most FAI Category
2 competitions, made those competitions less attractive for three pilot groups:

Paragliding Competitions over the Years Edition 2013
29 April 2013 35
i. A group of very active competition pilots, who formerly flew competition
class wings, but decided to leave the scene rather than switching to an EN
certified wing. This includes pilots who were not able to find EN certified
wings matching their body weight.
ii. A group of very active competitions pilots who used to compete in the serial
class on EN-D wings. Rather than stepping down to the sports class flown
with EN-C wings, or stepping up to a new EN-D competition wing, or flying
against such wings on lower-performing wings, they quit.
iii. A group of potential newcomers who traditionally would have flown their
first competitions on classic EN-D wings, in the serial class, but were facing
the same problems as group ii. above, and decided to not enter the
competition scene for now.
Whether or not the third point is indeed an external one could probably be argued. My position is
that it’s not something that is part of the normal way the competition world usually runs year after
year, which makes it an external cause.
6.2.2 Internal Causes
Causes for the downturn we’re currently observing which are part of the inner workings of the
international competition system:
1. The fewer pilots participate in competitions in general, the less attractive it becomes for
organizers to organize competitions. This because the pilots’ entry fees are usually the
biggest income position in an organizer’s books. But other factors may be at play. After all,
the majority of organizers set up competitions not with the goal of making money, but to do
something for paragliding, and paragliding pilots.
2. The fewer competitions exist, the fewer pilots compete. Especially pilots who only compete
once or twice a year seem to only do so if a competition takes place within their geographic
vicinity (material for further investigations, maybe in a future edition of this report). If those
competitions do not happen, these pilots do not compete.
3. The fewer pilots compete, the lower are participation numbers.
4. The gap between newcomers and experienced pilots is increasing: A small group of
competitors has been competing for 10 or more years. These pilots evolved to an experience
level that is hard to match for most newcomers, which discourages those newcomers from
sticking to competitions long enough to get to this level themselves. Technical advancements
in wing design aggravated this development even further, by making it harder to keep up
with the top pilots while flying a lower-performing wing. Paragliding misses the clear
progression in international competitions that would lead to competing at the top level over
several steps where pilots of similar skills compete against each other.
6.3 Remedies
We could of course leave everything as it is, and hope for the best. Or even consider the observed
crisis part of a healthy process to shrink the sport to a more manageable size. But personally, I am

Paragliding Competitions over the Years Edition 2013
29 April 2013 36
convinced that growth in competitions is desirable, and should be encouraged and nurtured in any
way possible8.
We concluded that multiple factors are responsible for the crisis in paragliding competitions.
Similarly, there is no single action that will mend it all and put the international competition scene
back to onto a path of growth and prosperity. Additionally, our possibilities to influence both the
global economic and meteorological situation are probably too limited. But the third external factor
is certainly something where especially CIVL is in a good position to improve the situation:
1. Clarify the safety and liability issues surrounding the suspension of competition class gliders.
Many pilots, organizers and officials are still waiting for an official resolution of the
“temporary suspension of competition class wings”, to learn whether the switch to EN D did
actually improve safety in competitions.
2. Clarify the legal side of competitions in general. The discussion of the potential liability
hazards an organizer or organizing association may be exposed to due to various things,
choice of permitted gliders being one of them, is to date mainly based on legal superstition,
hearsay and personal opinions. Debunking all those myths surrounding competitions and
providing sound legal recommendations grounded on facts to all involved stakeholders
would go a long way towards ensuring that our scene can grow again.
3. Bring stability into the wing discussion. This is something CIVL is currently working on.
I see these three as medium-term activities.
There is nothing that can influence internal factors directly: they are just inherent to the competition
world. But there may be ways to changing the current trends.
1. In the long term, maybe in collaboration with the PWCA, CIVL should rethink the current
two-tier system of international competitions, and consider introducing levels within the FAI
Category 2 competitions. This with the goal of offering newcomer competitors a clear career
outline, and prevent them from becoming frustrated and leaving again after only a few
competitions where the gap in skills and experience between them and the top pilots was
too big.
2. In the short term, the main goal should be to increase the number of competitions. This in
turn will have positive effects on competitor and participation numbers. Therefore, I’d like to
encourage every organizer who reads this to please put up a competition this year. If CIVL
has any means for motivating organizers, apart from the three points mentioned above, I’d
highly recommend applying those means as soon as possible, if only by reducing the
sanctioning fee for the time being.
8 This conviction is rooted in my personal experience: I had already been flying for 10 years when I started to
compete. My main motivation at that time was to improve my skills, to become a better cross-country pilot.
And this has worked far beyond what I would have imagined then. Competitions, to me, are the best possible
learning environment for any aspiring cross-country pilot: A controlled environment where many of the
uncertainties and dangers of individual cross-country flying are removed by design, and where progress is
much quicker due to the presence of other pilots and the immediate feedback on one’s performance.
The more competitions there are the more pilots can profit from this learning environment and become better,
safer pilots, which in turn is to the benefit of paragliding as a whole.
Paragliding Competitions over the Years Edition 2013
29 April 2013 37
And ultimately, it’s up to us, the individual pilots: We have it in our hands to either let the
competition scene grow again, or leave it dwindling. If you have been toying with the idea of joining a
competition, now would be a perfect time to sign up. Have fun with it, and Happy Landing!
©azoom.ch

Paragliding Competitions over the Years – Appendix A: Methodology Edition 2013
29 April 2013 38
Appendix A: Methodology My goal was to create a document that is easy to understand even without any in-depth knowledge
in statistics. But for completeness sake, this appendix shows the way I went about creating the charts
and tables in the remainder of the report.
A.1 Data Source
This whole report is based on the database behind CIVL’s World Pilot Ranking System9 (WPRS). The
WPRS contains two categories of competitions:
1. FAI Category 1 competitions: World and continental championships. Each year between one
and three such competitions take place in paragliding.
2. FAI Category 2 competitions: International competitions which applied for and were granted
sanctioning by CIVL. The vast majority of international paragliding competitions fall into this
category.
The WPRS applies a three-year sliding window for its ranking: Pilots are ranked according to their
four best results over the last 36 months. Individual results are devalued over time, dropping to 0
points after 36 months. Pilots with a total score of 0 are no longer ranked.
The WPRS database dates back to 2001. For this report, all entries concerning FAI Category 2 cross
country paragliding competitions that started after January 1st
, 2001, and ended before December
31st
, 2012, were considered. The raw data was retrieved through SQL statements; the outcome was
then processed and charted in Excel. The raw data used to create this report is presented in
Appendix A. The SQL statements used to generate this data is presented in Appendix C.
A.2 Statistics
Only a few very basic mathematical concepts were used to create this report. Mainly I needed to
count entries and occurrences; in some cases a simple average was required. The most sophisticated
operation used here is a twelve-month sliding average over monthly values: For each month, add up
the values of the past year, and divide the result by twelve.
To determine the number of planned tasks for each competition, I counted the number of days the
organizer had indicated, including the first and last day. While this is not always accurate (some
competitions use the first official competition day for training and registration), this probably still
results in a sufficiently precise approximation. If a competition submitted more tasks than the dates
indicated originally, the higher value was used instead.
A proper statistical analysis of the data would have been appropriate especially for the last part of
this study, to determine the degree to which some of the involved indicators do in fact correlate. I
admit I shied away from that effort, and resorted to a simple discussion of the resulting graphs. This
is certainly not sound from a scientific stand point, but I feel that the conclusions I draw nevertheless
stand on solid ground.
9 civlrankings.fai.org

Paragliding Competitions over the Years – Appendix A: Methodology Edition 2013
29 April 2013 39
A.3 Definitions
The terms used throughout this report are defined in Table A-1.
Term Definition
Competition FAI Category 2 paragliding cross country competition
Competitor or pilot10
Any person (male or female) who competed in at least one competition between
January 1, 2001, and December 31, 2012
Participation The event of an individual pilot participating in an individual competition
Active competitor or
pilot
A pilot who competed in at least one competition in 2012
Ranked competitor or
pilot
A pilot who was ranked in the WPRS edition 2013-01-01, in other words a pilot who
competed in at least one competition in 2010, 2011 or 2012
Inactive competitor or
pilot
A pilot who did not compete in any competition in 2012
Unranked competitor
or pilot
A pilot who did not compete in any competition in 2010, 2011 and 2012
Newcomer A pilot who competed for the first time in 2012 (ignoring potential participations
before 2001)
Table A-1: Definitions
10
Note that the WPRS uses “pilot” in a very loose sense. For instance, in the competition overview, the value
“no of pilots last 12 months” actually refers to participations, not pilots.

Paragliding Competitions over the Years – Appendix B: Raw data Edition 2013
29 April 2013 40
Appendix B: Raw data competitions competitions
with 0 tasks
tasks
planned
tasks planned
where flown
tasks
flown
pilots female
pilots
participations female
participations
ranked female
ranked
new-
comers
female
newcomers
2001 38 - 226 226 147 1'526 104 2'589 200 - - 1'526 104
2002 48 - 198 198 184 1'981 125 3'226 236 2'640 175 1'137 68
2003 53 - 328 328 225 2'066 148 3'655 298 3'548 237 875 61
2004 75 - 416 416 276 2'529 163 4'804 382 4'033 255 977 54
2005 70 - 377 377 262 2'741 190 5'042 403 4'410 295 944 76
2006 133 18 623 571 383 3'444 235 7'743 579 5'087 345 1'189 83
2007 152 26 684 600 413 3'731 268 8'079 623 5'621 418 1'153 108
2008 162 21 742 655 450 3'916 299 9'026 730 6'144 463 1'046 94
2009 179 29 802 731 481 4'044 296 9'473 766 6'107 448 1'013 85
2010 186 29 813 748 483 4'219 308 9'115 745 6'191 466 1'234 94
2011 175 39 762 641 398 3'947 318 7'817 682 5'915 469 932 101
2012 162 31 707 605 416 3'906 312 7'939 747 6'895 533 937 70
Table B-1: Raw annual data paragliding
competitions competitions
with 0 tasks
tasks
planned
tasks planned
where flown
tasks
flown
pilots female
pilots
participations female
participations
ranked female
ranked
new-
comers
female
newcomers
2001 29 - 250 250 130 779 46 1319 93 - - 779 46
2002 32 - 216 216 155 1014 46 1441 76 1353 62 562 13
2003 35 - 330 330 173 961 40 1422 64 1709 72 348 10
2004 26 - 160 160 108 795 40 1159 58 1706 76 230 13
2005 29 - 226 226 122 785 42 1130 65 1568 70 209 12
2006 46 13 266 200 139 833 35 1305 60 1451 69 199 7
2007 46 12 262 208 158 879 35 1421 64 1447 60 187 4
2008 52 15 270 214 157 839 35 1381 71 1410 57 173 4
2009 59 9 320 292 203 1004 39 1886 107 1450 54 238 6
2010 57 9 338 293 201 1068 48 2028 109 1514 59 231 15
2011 58 10 336 289 176 985 44 1707 77 1469 67 177 12
2012 61 5 326 311 219 1078 44 2062 95 1678 70 163 2
Table B-2: Raw annual data hang gliding

Paragliding Competitions over the Years – Appendix B: Raw data Edition 2013
29 April 2013 41
participations 2001 2002 2003 2004 2005 2006 2007 2008 2009 2010 2011 2012
1 996 1332 1333 1445 1607 1713 1874 1832 1857 2132 2139 2126
2 300 371 334 528 574 662 786 854 851 863 826 798
3 88 117 178 247 265 417 445 471 554 494 448 413
4 57 78 100 154 136 300 271 347 311 331 253 250
5 35 40 63 63 74 133 166 139 192 172 142 144
6 32 22 26 50 43 92 79 113 126 101 72 77
7 12 16 15 23 26 51 40 72 63 73 33 43
8 4 3 10 8 8 37 36 35 37 26 18 27
9 2 1 6 6 6 19 14 22 19 16 9 11
10 1 1 3 2 10 11 17 16 4 5 10
11 2 7 4 11 5 5 2 5
12 2 4 3 5 1 1
13 1 1 6 0 1
14 0 0
15 1 1
16 1
Table B-3: Number of PG pilots per annual number of participations

Paragliding Competitions over the Years – Appendix B: Raw data Edition 2013
29 April 2013 42
participations number of pilots
1 4653
2 2006
3 1190
4 782
5 588
6 465
7 394
8 352
9 238
10 213
11 185
12 166
13 144
14 131
15 113
16 110
17 98
18 95
19 71
20 76
21 59
22 57
23 49
24 48
25 52
26 49
27 45
28 42
29 43
30 33
31 32
32 35
33 23
34 17
35 18
36 20
37 18
38 20
39 9
40 23
41 10
42 18
43 14
participations number of pilots
44 11
45 9
46 14
47 10
48 8
49 7
50 9
51 11
52 3
53 6
54 4
55 4
56 6
57 3
58 1
59 5
60 3
61 5
62 3
63 1
64 3
65 3
66 4
67 2
68 2
69 1
70 2
71 2
72 1
73 1
74 2
76 2
77 4
79 2
82 1
85 1
92 1
94 1
117 1
Table B-4: Number of PG pilots per total number of
participations

Paragliding Competitions over the Years – Appendix B: Raw data Edition 2013
29 April 2013 43
number of pilots number of comps
6 1
7 1
8 1
10 1
11 1
13 2
15 1
16 2
18 1
19 1
20 1
21 2
22 1
23 3
25 2
27 1
29 1
30 2
32 2
33 4
34 1
36 3
37 4
38 2
39 1
40 1
41 2
42 3
43 1
44 1
45 5
46 1
47 1
48 1
49 1
51 3
52 1
53 1
54 1
55 5
57 1
58 1
number of pilots number of comps
60 2
61 2
62 1
63 1
65 1
67 1
69 4
71 4
73 2
75 2
77 1
79 1
81 2
83 2
84 3
86 1
87 1
90 2
94 2
96 1
101 2
102 1
104 1
105 2
107 1
109 1
110 1
111 1
112 1
117 1
119 2
120 3
123 1
126 1
132 1
134 1
140 1
150 1
Table B-5: Number of competitions in 2012 per number
of participants

Paragliding Competitions over the Years – Appendix B: Raw data Edition 2013
29 April 2013 44
number of pilots number of comps
3 2
5 1
7 2
8 4
9 7
10 6
11 7
12 3
13 7
14 5
15 7
16 4
17 9
18 8
19 11
20 9
21 8
22 14
23 14
24 9
25 5
26 10
27 12
28 14
29 15
30 15
31 14
32 19
33 12
34 17
35 9
36 13
37 14
38 9
39 20
40 16
41 10
42 14
43 14
44 25
45 10
46 12
47 13
48 9
49 16
number of pilots number of comps
50 15
51 13
52 11
53 16
54 13
55 9
56 9
57 15
58 9
59 8
60 9
61 8
62 14
63 12
64 10
65 10
66 13
67 9
68 8
69 9
70 14
71 8
72 4
73 9
74 8
75 8
76 5
77 10
78 6
79 3
80 6
81 9
82 7
83 5
84 8
85 9
86 5
87 3
88 5
89 4
90 7
91 7
92 7
93 4
94 9

Paragliding Competitions over the Years – Appendix B: Raw data Edition 2013
29 April 2013 45
number of pilots number of comps
95 7
96 6
97 2
98 4
99 5
100 10
101 4
102 7
103 6
104 5
105 7
106 8
107 3
108 5
109 9
110 6
111 2
112 7
113 3
114 7
115 3
116 7
117 2
118 4
119 5
120 2
121 6
122 6
123 9
124 8
number of pilots number of comps
125 2
126 3
127 2
128 2
129 7
130 5
131 2
132 1
133 7
134 1
135 4
136 4
137 2
138 5
139 3
140 3
141 2
143 2
144 4
145 2
146 3
147 2
148 3
149 4
150 3
158 1
Table B-6: Number of competitions in 2001-2011 per
number of participants

Paragliding Competitions over the Years – Appendix B: Raw data Edition 2013
29 April 2013 46
date #comps # participations # competitors
Jan-01 3 119
Feb-01 3 200
Mar-01 1 77
Apr-01 1 10
May-01 6 334
Jun-01 5 415
Jul-01 5 487
Aug-01 6 455
Sep-01 4 301
Oct-01 1 53
Nov-01 2 50
Dec-01 1 88 1526
Jan-02 4 191 1559
Feb-02 3 259 1662
Mar-02 1 112 1681
Apr-02 1 101 1728
May-02 6 277 1612
Jun-02 7 566 1752
Jul-02 3 206 1650
Aug-02 10 638 1810
Sep-02 6 494 1886
Oct-02 4 249 1965
Nov-02 1 13 1960
Dec-02 2 120 1981
Jan-03 2 72 1970
Feb-03 2 133 1819
Mar-03 5 548 1980
Apr-03 4 357 2031
May-03 7 345 2092
Jun-03 8 413 2013
Jul-03 4 417 2043
Aug-03 12 767 2233
Sep-03 4 301 2129
Oct-03 2 109 2066
Nov-03 2 105 2092
Dec-03 1 88 2066
Jan-04 4 224 2156
Feb-04 1 89 2152
Mar-04 2 288 2073
Apr-04 2 101 2067
May-04 11 673 2169
Jun-04 11 820 2281
Jul-04 10 565 2365
Aug-04 12 746 2311
date #comps # participations # competitors
Sep-04 8 534 2359
Oct-04 6 395 2442
Nov-04 4 208 2507
Dec-04 4 161 2529
Jan-05 4 318 2558
Feb-05 2 147 2574
Mar-05 0 0 2520
Apr-05 4 167 2579
May-05 12 1026 2780
Jun-05 13 1039 2802
Jul-05 12 897 2784
Aug-05 8 671 2827
Sep-05 6 300 2801
Oct-05 4 235 2804
Nov-05 1 79 2744
Dec-05 4 163 2741
Jan-06 5 291 2757
Feb-06 5 335 2818
Mar-06 6 514 2904
Apr-06 5 397 2965
May-06 18 859 2835
Jun-06 30 1889 3174
Jul-06 16 1009 3220
Aug-06 15 606 3186
Sep-06 16 949 3300
Oct-06 8 375 3320
Nov-06 5 261 3405
Dec-06 4 258 3444
Jan-07 6 237 3462
Feb-07 5 493 3492
Mar-07 5 136 3453
Apr-07 9 580 3526
May-07 30 1212 3750
Jun-07 19 1310 3588
Jul-07 21 1382 3672
Aug-07 19 692 3714
Sep-07 19 1096 3731
Oct-07 8 513 3738
Nov-07 6 203 3743
Dec-07 5 225 3731
Jan-08 4 302 3718
Feb-08 7 393 3692
Mar-08 9 468 3742
Apr-08 9 340 3696

Paragliding Competitions over the Years – Appendix B: Raw data Edition 2013
29 April 2013 47
date #comps # participations # competitors
May-08 31 1476 3810
Jun-08 27 1604 3916
Jul-08 13 1090 3853
Aug-08 26 1462 3927
Sep-08 15 798 3873
Oct-08 6 435 3850
Nov-08 9 354 3909
Dec-08 6 304 3916
Jan-09 5 302 3931
Feb-09 3 154 3890
Mar-09 9 578 3851
Apr-09 11 534 3869
May-09 35 1720 3947
Jun-09 26 1268 3918
Jul-09 29 1784 4072
Aug-09 30 1601 4128
Sep-09 12 639 4069
Oct-09 7 371 4081
Nov-09 6 176 4034
Dec-09 6 346 4044
Jan-10 6 313 4088
Feb-10 3 158 4110
Mar-10 10 482 4144
Apr-10 15 777 4252
May-10 27 798 4063
Jun-10 29 1652 4296
Jul-10 30 1739 4342
Aug-10 30 1467 4275
Sep-10 12 646 4224
Oct-10 11 568 4212
Nov-10 7 237 4226
date #comps # participations # competitors
Dec-10 6 278 4219
Jan-11 5 396 4162
Feb-11 3 178 4134
Mar-11 5 177 4068
Apr-11 13 437 4026
May-11 26 957 4075
Jun-11 39 1895 4098
Jul-11 18 478 3844
Aug-11 32 1713 3919
Sep-11 14 662 3978
Oct-11 11 438 3982
Nov-11 6 306 3990
Dec-11 3 180 3947
Jan-12 3 191 3923
Feb-12 3 255 3933
Mar-12 8 342 3964
Apr-12 14 428 3972
May-12 18 935 4015
Jun-12 26 1425 3826
Jul-12 29 1357 4007
Aug-12 25 1352 3900
Sep-12 14 690 3864
Oct-12 9 375 3846
Nov-12 8 329 3899
Dec-12 5 260 3906
Jan-13 7 564 3954
Feb-13 4 243 3944
Mar-13 7 345 3947
Table B-7: Raw monthly data paragliding

Paragliding Competitions over the Years – Appendix B: Raw data Edition 2013
29 April 2013 48
date # comps # participations # competitors
Jan-01 4 227
Feb-01 1 20
Mar-01 0 0
Apr-01 4 168
May-01 3 44
Jun-01 1 46
Jul-01 6 331
Aug-01 4 270
Sep-01 1 15
Oct-01 2 69
Nov-01 0 0
Dec-01 2 42 759
Jan-02 3 230 752
Feb-02 0 0 743
Mar-02 1 54 772
Apr-02 4 181 787
May-02 6 213 929
Jun-02 3 119 981
Jul-02 5 210 1012
Aug-02 7 280 1004
Sep-02 1 79 1008
Oct-02 1 70 1019
Nov-02 0 0 1019
Dec-02 1 15 1005
Jan-03 3 221 995
Feb-03 0 0 995
Mar-03 2 67 1015
Apr-03 2 149 982
May-03 4 128 913
Jun-03 5 182 910
Jul-03 12 442 1014
Aug-03 4 115 929
Sep-03 1 28 921
Oct-03 3 167 994
Nov-03 0 0 994
Dec-03 0 0 980
Jan-04 4 218 985
Feb-04 0 0 985
Mar-04 0 0 950
Apr-04 2 98 946
May-04 6 204 971
Jun-04 2 103 969
Jul-04 2 75 731
Aug-04 5 267 816
date # comps # participations # competitors
Sep-04 1 8 813
Oct-04 2 85 770
Nov-04 1 13 775
Dec-04 0 0 775
Jan-05 2 137 736
Feb-05 1 19 746
Mar-05 0 0 746
Apr-05 3 119 780
May-05 7 307 793
Jun-05 3 57 758
Jul-05 6 217 795
Aug-05 5 223 798
Sep-05 0 0 796
Oct-05 1 61 787
Nov-05 1 54 800
Dec-05 0 0 800
Jan-06 3 127 803
Feb-06 2 62 812
Mar-06 2 0 812
Apr-06 6 235 851
May-06 7 93 783
Jun-06 6 109 804
Jul-06 9 289 817
Aug-06 5 225 807
Sep-06 2 57 833
Oct-06 1 73 842
Nov-06 2 35 839
Dec-06 2 24 855
Jan-07 2 72 818
Feb-07 1 23 810
Mar-07 3 56 838
Apr-07 6 270 845
May-07 4 117 854
Jun-07 9 266 898
Jul-07 14 380 934
Aug-07 1 43 872
Sep-07 3 76 883
Oct-07 1 61 876
Nov-07 1 27 874
Dec-07 1 30 879
Jan-08 2 112 884
Feb-08 1 22 885
Mar-08 6 73 875
Apr-08 3 94 838

Paragliding Competitions over the Years – Appendix B: Raw data Edition 2013
29 April 2013 49
date # comps # participations # competitors
May-08 10 330 914
Jun-08 5 83 856
Jul-08 8 276 780
Aug-08 10 258 854
Sep-08 1 28 850
Oct-08 2 0 816
Nov-08 3 84 845
Dec-08 1 21 839
Jan-09 2 100 837
Feb-09 1 29 844
Mar-09 3 67 814
Apr-09 3 171 875
May-09 11 328 859
Jun-09 9 234 901
Jul-09 8 272 869
Aug-09 14 455 965
Sep-09 4 86 992
Oct-09 2 85 1014
Nov-09 1 23 999
Dec-09 1 36 1004
Jan-10 5 200 1043
Feb-10 1 37 1032
Mar-10 2 54 1023
Apr-10 6 301 1073
May-10 10 242 1079
Jun-10 10 218 1058
Jul-10 8 249 1094
Aug-10 8 512 1083
Sep-10 2 63 1052
Oct-10 2 55 1048
Nov-10 2 60 1070
date # comps # participations # competitors
Dec-10 1 37 1068
Jan-11 5 118 1012
Feb-11 1 0 1011
Mar-11 3 31 968
Apr-11 4 179 939
May-11 10 317 967
Jun-11 7 86 936
Jul-11 9 291 931
Aug-11 9 395 913
Sep-11 4 91 933
Oct-11 4 146 991
Nov-11 1 0 968
Dec-11 1 53 985
Jan-12 2 126 1001
Feb-12 2 64 1047
Mar-12 4 118 1063
Apr-12 7 309 1092
May-12 11 331 1085
Jun-12 6 208 1113
Jul-12 11 402 1108
Aug-12 8 227 1088
Sep-12 4 123 1097
Oct-12 3 67 1074
Nov-12 1 14 1085
Dec-12 2 73 1078
Jan-13 2 0 1055
Feb-13 4 91 1051
Mar-13 7 88 1025
Table B-8: Raw monthly data hang gliding

Paragliding Competitions over the Years – Appendix C: Database queries Edition 2013
29 April 2013 50
Appendix C: Database queries For completeness sake, I list here the database queries I used to extract the data given in Appendix A.
The RDBMS is Microsoft SQL Server 2008 R2.
C.1 Participations view use [wprs] go create view ladder2.v_participations as select DATEPART(Year, e.date_from) as year, p.perso n_id, c.discipline_id, count(p.competition_id) as participations, c.civl_s anction_id from event.competition c, event.event e, event.comp etition_person p where c.event_id=e.id and p.competition_id=c.id group by p.person_id, DATEPART(Year, e.date_from), c.discipline_id, c.civl_sanction_id go
C.2 Competition years view use [wprs] go create view pilot.v_years as select p.person_id, count(distinct DATEPART(Year, e .date_from)) as years, c.discipline_id, c.civl_sanction_id from event.competition c, event. event e, event.competition_person p where c.event_id=e.id and p.competition_id=c.id and e.dat e_to <= '2013-01-01' group by p.person_id, c.discipline_id, c.civl_sanct ion_id go
C.3 Annual raw data use [wprs] declare @sanction INT=2, @discipline int=1, /*1=pg, 2=hg 1, 3=hg 5, 8=hg 2, 10=hg sports*/ @ladder int=1, /*1=hg 1, 2=hg 2, 3=pg, 4=pg accy, 5 =hg 5, 6=pg acro, 7=hg acro, 8=pg nor, 9=hg sports*/ @year varchar(100)='2003' select name, @year as year from event.discipline wh ere id=@discipline; select count(*) as 'number of comps' from event.com petition c, event.event e where c.event_id=e.id and c.civl_sanction_id=@sanction an d e.date_from>=@year+'-01-01' and date_from<=@year+'-12-31' and c.discipline_id=@disc ipline select count(*) as 'number of comps without tasks' from event.competition c, event.event e where c.event_id=e.id and c.civl_sanction_id=@sanction an d e.date_from>=@year+'-01-01' and date_from<=@year+'-12-31' and c.discipline_id=@disc ipline and (c.tasks=0 or c.tasks is null) select SUM(tplan) as 'tasks planned' from ( select (select MAX(v) from (values (datediff(day, e .date_from, e.date_to)), (c.tasks)) as value(v)) as tplan from event.competition c, event. event e where c.event_id=e.id and c.civl_sanction_id=@sanction an d e.date_from>=@year+'-01-01' and date_from<=@year+'-12-31' and c.discipline_id=@disc ipline ) as t1 select SUM(tplan) as 'tasks planned when flown' fro m ( select (select MAX(v) from (values (datediff(day, e .date_from, e.date_to)), (c.tasks)) as value(v)) as tplan from event.competition c, event. event e where c.event_id=e.id and c.civl_sanction_id=@sanction an d e.date_from>=@year+'-01-01' and date_from<=@year+'-12-31' and c.discipline_id=@disc ipline and c.tasks>0 ) as t1 select sum(c.tasks) as 'tasks flown' from event.com petition c, event.event e where c.event_id=e.id and c.civl_sanction_id=@sanction an d e.date_from>=@year+'-01-01' and date_from<=@year+'-12-31' and c.discipline_id=@disc ipline select count(distinct p.person_id) as 'number of pi lots' from event.competition c, event.event e, event.competition_person p where c.event_id=e.id and c.civl_sanction_id=@sanction an d e.date_from>=@year+'-01-01' and date_from<=@year+'-12-31' and c.discipline_id=@disc ipline and p.competition_id=c.id

Paragliding Competitions over the Years – Appendix C: Database queries Edition 2013
29 April 2013 51
select count(distinct p.person_id) as 'number of fe male pilots' from event.competition c, event.event e, event.competition_person p, pilot.pe rson pil where c.event_id=e.id and c.civl_sanction_id=@sanction an d e.date_from>=@year+'-01-01' and date_from<=@year+'-12-31' and c.discipline_id=@disc ipline and p.competition_id=c.id and p.person_id=pil.id and pi l.female='TRUE' select count(p.person_id) as 'number of participati ons' from event.competition c, event.event e, event.competition_person p where c.event_id=e.id and c.civl_sanction_id=@sanction an d e.date_from>=@year+'-01-01' and date_from<=@year+'-12-31' and c.discipline_id=@disc ipline and p.competition_id=c.id select count(p.person_id) as 'number of female part icipations' from event.competition c, event.event e, event.competition_person p, pilot.pe rson pil where c.event_id=e.id and c.civl_sanction_id=@sanction an d e.date_from>=@year+'-01-01' and date_from<=@year+'-12-31' and c.discipline_id=@disc ipline and p.competition_id=c.id and p.person_id=pil.id and pi l.female='TRUE' declare @ranking_date date=dateadd(year, 1, @year+'-01-01') , @ranking_date_2 date=@year+'-12-01' if @year>2006 begin select count(*) as 'ranked pilots 2007+' from ladde r2.person where ladder_id=@ladder and ranking_no=(select no from ladder2.ranking where la dder_id=@ladder and ranking_date=@ranking_date) select count(*) as 'ranked female pilots 2007+' fro m ladder2.person l, pilot.person p where ladder_id=@ladder and ranking_no=(select no from la dder2.ranking where ladder_id=@ladder and ranking_date=@ranking_date) and l.person_id=p.id and p.female='TRUE' end else if @year=2006 begin select count(*) as 'ranked pilots 2006' from ladder .ranking_person where ranking_id=(select id from ladder.ranking where ladder_id=@ladder and ran king_date=@ranking_date) select count(*) as 'ranked female pilots 2006' from ladder.ranking_person l, pilot.person p where ranking_id=(select id from ladder.ranking whe re ladder_id=@ladder and ranking_date=@ranking_date) and l.person_id=p.id and p.female='TRUE' end else if @year<2006 and @year>2001 begin select count(*) as 'ranked pilots 2002-2005' from l adder.ranking_person where ranking_id=(select id from ladder.ranking where lad der_id=@ladder and ranking_date=@ranking_date_2) select count(*) as 'ranked female pilots 2002-2005' from ladder.ranking_person l, pilot.person p where ranking_id=(select id from ladder.ranking w here ladder_id=@ladder and ranking_date=@ranking_date_2) and l.person_id=p.id and p.female='TRUE' end select COUNT(*) as 'number of newcomers' from ladde r2.v_participations p1 where p1.discipline_id=@discipline and p1.YEAR=@year and not exists (select * from ladder2.v_participati ons p2 where p2.discipline_id=@discipline and p1.person_id=p2.person_id and p2.YEAR<@year) select COUNT(*) as 'number of female newcomers' fro m ladder2.v_participations p1, pilot.person pil where p1.discipline_id=@discipline and p1.YEAR= @year and not exists (select * from ladder2.v_participati ons p2 where p2.discipline_id=@discipline and p1.person_id=p2.person_id and p2.YEAR<@year) an d p1.person_id=pil.id and pil.female='TRUE'
C.4 Participations per year use [wprs] declare @sanction INT=2, @discipline int=1, /*1=pg, 2=hg 1, 3=hg 5, 8=hg 2, 10=hg sports*/ @year varchar(100)='2012' select parts, COUNT(distinct person_id) as 'FAI 2 p articipations' from ( select person_id, SUM(participations) as parts from ladder2.v_participations p1 where p1.discipline_id=@discipline and p1.YEAR=@yea r and civl_sanction_id=@sanction group by person_id ) as p1 group by parts order by parts

Paragliding Competitions over the Years – Appendix C: Database queries Edition 2013
29 April 2013 52
select parts, COUNT(distinct person_id) as 'FAI 1+2 participations' from ( select person_id, SUM(participations) as parts from ladder2.v_participations p1 where p1.discipline_id=@discipline and p1.YEAR=@yea r group by person_id ) as p1 group by parts order by parts
C.5 Total participations use [wprs] declare @sanction INT=2, @discipline int=1, /*1=pg, 2=hg 1, 3=hg 5, 8=hg 2, 10=hg sports*/ @year varchar(100)='2012' select parts, COUNT(distinct person_id) as 'FAI 2 p articipations' from ( select person_id, SUM(participations) as parts from ladder2.v_participations p1 where p1.discipline_id=@discipline and civl_sanctio n_id=@sanction and YEAR<=@year group by person_id ) as p1 group by parts order by parts select avg(cast(parts as float)) as average from ( select person_id, SUM(participations) as parts from ladder2.v_participations p1 where p1.discipline_id=@discipline and civl_sanctio n_id=@sanction and YEAR<=@year group by person_id ) as p2 SELECT ( (SELECT MAX(cast(parts as float)) FROM (SELECT TOP 50 PERCENT parts FROM ( select person_id, SUM(participations) as parts fr om ladder2.v_participations p1 where p1.discipline_id=@discipline and civl_sanct ion_id=@sanction and YEAR<=@year group by person_id ) as p2 ORDER BY parts) AS BottomHalf) + (SELECT MIN(cast(parts as float)) FROM (SELECT TOP 50 PERCENT parts FROM ( select person_id, SUM(participations) as parts fr om ladder2.v_participations p1 where p1.discipline_id=@discipline and civl_sanct ion_id=@sanction and YEAR<=@year group by person_id ) as p3 ORDER BY parts DESC) AS TopHalf) ) / 2.0 AS Median select parts, COUNT(distinct person_id) as 'FAI 1+2 participations' from ( select person_id, SUM(participations) as parts from ladder2.v_participations p1 where p1.discipline_id=@discipline and YEAR<=@year group by person_id ) as p1 group by parts order by parts
C.6 Active competitors use [wprs] declare @sanction INT=2, @discipline int=1 /*1=pg, 2=hg 1, 3=hg 5, 8=hg 2, 1 0=hg sports*/ select years, COUNT(distinct person_id) as 'number of pilots' from pilot.v_years y where y.discipline_id=@discipline and y.civl_sanction_id= @sanction group by years order by years; select AVG(cast(years as float)) as average from pi lot.v_years y where y.discipline_id=@discipline and y.civl_sanction_id= @sanction

Paragliding Competitions over the Years – Appendix C: Database queries Edition 2013
29 April 2013 53
SELECT ( (SELECT MAX(cast(years as float)) FROM (SELECT TOP 50 PERCENT years FROM pilot.v_years y where y.discipline_id=@discipline and y.civl_sanction_id=@sanction ORDER BY years) AS Bot tomHalf) + (SELECT MIN(cast(years as float)) FROM (SELECT TOP 50 PERCENT years FROM pilot.v_years y where y.discipline_id=@discipline and y.civl_sanction_id=@sanction ORDER BY years DESC) A S TopHalf) ) / 2.0 AS Median
C.7 Monthly raw data competitions and participations use [wprs] declare @sanction INT=2, @discipline int=2 /*1=pg, 2=hg 1, 3=hg 5, 8=hg 2, 1 0=hg sports*/ select name from event.discipline where id=@discipl ine; select DATEPART(Year, e.date_to) as year, DATEPART( Month, e.date_to) as month, count(*) as 'number of comps' from event.competition c, event.e vent e where c.event_id=e.id and c.civl_sanction_id=@sanction an d c.discipline_id=@discipline group by DATEPART(Year, e.date_to), DATEPART(Month, e.date_to) order by DATEPART(Year, e.date_to), DATEPART(Month, e.date_to) select DATEPART(Year, e.date_to) as year, DATEPART( Month, e.date_to) as month, count(p.person_id) as 'number of participations' fr om event.competition c, event.event e, event.competition_person p where c.event_id=e.id and c.civl_sanction_id=@sanction an d c.discipline_id=@discipline and p.competition_id=c.id group by DATEPART(Year, e.date_to), DATEPART(Month, e.date_to) order by DATEPART(Year, e.date_to), DATEPART(Month, e.date_to)
C.8 Monthly raw data competitors use [wprs] declare @sanction INT=2, @discipline int=2 /*1=pg, 2=hg 1, 3=hg 5, 8=hg 2, 1 0=hg sports*/ DECLARE @Y int DECLARE Ys CURSOR LOCAL FOR select distinct DATEPAR T(Year, e.date_from) as year from event.event e order by year; OPEN Ys FETCH NEXT FROM Ys into @Y WHILE @@FETCH_STATUS = 0 BEGIN DECLARE @M int DECLARE Ms CURSOR LOCAL FOR select distinct DATEPA RT(Month, e.date_from) as month from event.event e order by month; OPEN Ms FETCH NEXT FROM Ms into @M WHILE @@FETCH_STATUS = 0 BEGIN declare @date1 date=dateadd(year,@Y-1900, dateadd(month, @ M-1, dateadd(day,0,0))), @date2 date=dateadd(year,@Y-1900+1, dateadd(month, @M-1, dateadd(day,0,0))) select @date2 as date, count(distinct p.person_id) as 'number of pilots' from event.competition c, event.event e, event.competiti on_person p where c.event_id=e.id and c.civl_sanction_id=@sanction a nd e.date_to>=@date1 and date_to<@date2 and c.discipline_id=@discipline and p.competition_id=c.id FETCH NEXT FROM Ms into @M END CLOSE Ms DEALLOCATE Ms FETCH NEXT FROM Ys into @Y

Paragliding Competitions over the Years – Appendix C: Database queries Edition 2013
29 April 2013 54
END CLOSE Ys DEALLOCATE Ys
C.9 Competition sizes use [wprs] declare @sanction INT=2, @discipline int=1, /*1=pg, 2=hg 1, 3=hg 5, 8=hg 2, 10=hg sports*/ @year varchar(100)='2012' select pilots as 'number of pilots', COUNT(pilots) as 'number of comps' from (select e.name, count(p.person_id) as pilots from e vent.competition c, event.event e, event.competition_person p where c.event_id=e.id and c.civl_sanction_id=@sanction an d e.date_to>=@year+'-01-01' and date_to<=@year+'-12-31' and c.discipline_id=@discip line and p.competition_id=c.id group by e.name) as p1 group by pilots select pilots as 'number of pilots', COUNT(pilots) as 'number of comps' from (select e.name, count(p.person_id) as pilots from e vent.competition c, event.event e, event.competition_person p where c.event_id=e.id and c.civl_sanction_id=@sanction an d date_to<@year+'-01-01' and c.discipline_id=@discipline and p.competition_id=c.id group by e.name) as p1 group by pilots