Parade of Trades™ - SCOAR LEAN... · Each trade has its own score sheet 2. ... Parade of Trades...
36
1 © 2009 Lean Construction Institute Parade of Trades™ Joint FCURT/LCI Meeting, 12 August 2010
Transcript of Parade of Trades™ - SCOAR LEAN... · Each trade has its own score sheet 2. ... Parade of Trades...

1© 2009 Lean Construction Institute
Parade of Trades™
Joint FCURT/LCI Meeting, 12 August 2010

3
1. Each trade has its own score sheet2. Start with all 35 chips on the left of Concrete (please count chips)3. Establish queue spaces (buffers for inventory) between each trade.4. Give die to Painter
© 2009 Lean Construction Institute 3

4
Parade of Trades Assumptions1. The project is complete when 35 units of work (chips) have been processed
by each of seven trades.
2. The trades work in sequence, with each following trade able to work only on what was produced in the previous week by the prior trade.
3. Work is done by rolling a die and passing the number of units rolled, x, up to the number of units the trade has available to process. In the real world, this is the same as your trade completing x number of units of work per week.
4. The number rolled also represents the number of workers brought to the site that week by the trade rolling the die. Each worker is able to process one unit of work per week.
5. The trades come onto the project a week apart. Work is completed and available to the next trade once a week. A die has an average production rate of 3.5 units per roll (per week).
6. What duration would you propose for the project? (Hint: 35 units per project, 3.5 units per week, 7 trades. One complete roll through all trades at a table represents 1 week).
© 2009 Lean Construction Institute 4

5 5Weeks0 1 2 3 4 5 6 7 8 9 10 11 12 13 14 15 16
ConcreteConcrete
MasonMason
FacadeFacade
CarpenterCarpenter
PlumberPlumber
The Co-created Schedule
ElectricianElectrician
PainterPainter
Note shaded-out areas on your score sheets:
Only Concrete does work 1st week;
Only Concrete & Mason do work 2nd week; etc.

6
Moving one unit through one station requires 1 “crew” work unit costing $1,000.
How much unburdened labor cost will be required to complete the project? (Hint: 35 units of work are required at each station and there are 7 stations.)
$245,000
What would you add as the markup on labor for your bid?
With 22.449% markup, each project team makes a profit if spending is equal to or less than
$300,000
Project Estimating
6© 2009 Lean Construction Institute

7
Discussion
© 2009 Lean Construction Institute
1. Which project will have the most safety incidents?
a. One with most capacity – lots of people on site
b. One that took longest – rushing to get finished
c. One that has most inventory - house-keeping, moving stuff over and over again
7

8
ResultsTeam Concrete
completeProject
completeTotal
CapacityTotal
Inventory, lost
production
Max. inventory
any station
NumbersOnDie
Die Predictability
OrReliability
RED 1 11 19 293 56 4 233445 1 (most)
RED 2 233445 1 (most)
BLACK 1 10 21 320 80 5 Pl, E 123456 2
BLACK 2 12 22 311 71 5 M, E 123456 2
BLUE 1 9 23 346 122 5 Pa 122556 3 (least)
BLUE 2 10 22 359 136 14 M 122556 3 (least)
8All have same speed (average 3.5 units / week)

9
Discussion
© 2009 Lean Construction Institute
1. Which project will have the most safety incidents?
a. One with most capacity – lots of people on site
b. One that took longest – rushing to get finished
c. One that has most inventory - house-keeping, moving stuff over and over again
Are any of these arguments about “Motivation and training of the workforce?”
Could one say that safety is directly related to the “Predictability/Reliability of workflow?”
9


11
Discussion
© 2009 Lean Construction Institute
1. What are the consequences of unpredictable workflow?
2. Which project will have fewer change orders?
3. Which project will have fewer legal issues?
4. Which one would you want to manage?
5. Which one would you want to estimate for?
6. Which would you rather have:
a. A die that was faster, or
b. A die that was more reliable/predictable?
7. Which one do we choose on our projects every day?
11

12
Discussion
© 2009 Lean Construction Institute
Turn this argument on it’s head, and ask:
“Would anybody want a die that was slowerbut more reliable?”
12

22
Typical Results
Red233445
Black123456
Blue122556
14% Slower333333
Duration Weeks 19 21 23 18
Total Capacity $ 294 332 361 252
$ Made or ($ Lost) 6 (32) (61) 48
Total Inventory 55 112 120 0
Max. Inventory @ any station except
concrete5 7 9 0
22
Same results EVERY time
14
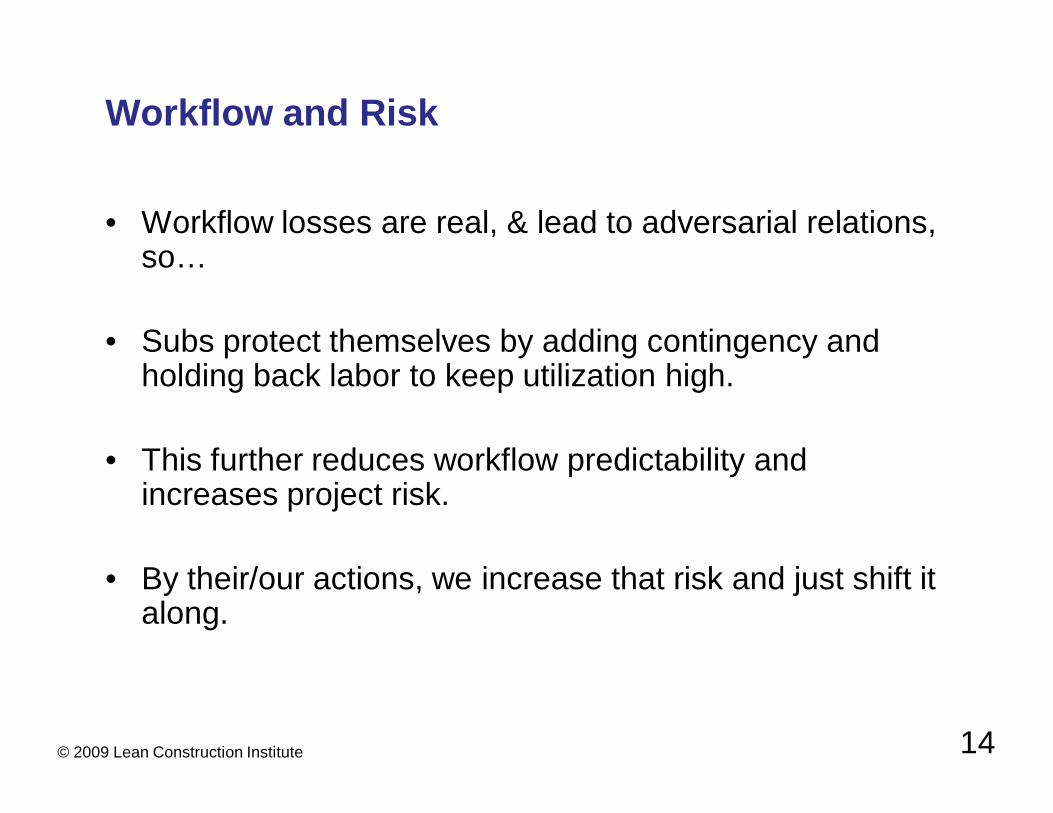
Workflow and Risk
• Workflow losses are real, & lead to adversarial relations, so…
• Subs protect themselves by adding contingency and holding back labor to keep utilization high.
• This further reduces workflow predictability and increases project risk.
• By their/our actions, we increase that risk and just shift it along.
© 2009 Lean Construction Institute 14

15
• Reducing workflow variability– Concurrently improves total system performance: cost, schedule,
quality, safety– Makes project outcomes more predictable– Simplifies coordination– Reveals new opportunities for improvement
• Point speed and productivity of a single operation doesn’t matter – throughput / workflow does.
• Strategy: Reduce variation then, and only then, go for speed to increase throughput : “Go Slow to Go Fast.”
Key Points
© 2009 Lean Construction Institute 15

16
That’s all well and good, but…
“How the heck can I get more predictable workflow on my
project?”
16

12 August 2010
Facilitators:Ed Anderson, Ted Angelo, & Patrick Potts
1

Scheduling & PlanningScheduling & Planning
versusversus
Managing WorkflowManaging Workflow
2

3
Planning and Control are two sides of a coin that keeps revolving throughout a project.
Planning: defining criteria for success and producing strategies for achieving objectives.
Control: causing events to conform to plan and triggering learning and re‐planning.

4
1. Of 10 concrete slabs committed to complete:a. 6 are 100% completeb. 4 are 95% complete (forms in place)
2. PPC (Percent Planned Complete) = (Actual number completed) / (Total number committed to)
6/10 = 60%
3. A measure of reliability to: a. Make and keep commitments; andb. Plan and execute: Did you do what you said you were going to do?
4. Not a measure of Productivity or Production

5
Weekly Work Plans
ProductionResourcesResourcesCompleted
Work
Chart PPC &
Reasons
Take action to prevent
repeatingerrors
Selecting, sequencing, &sizing work we
think can be done
Make work ready by screening & pulling
InformationWorkable Backlog
Selecting,sequencing, & sizing work
we know can be done
Current status& forecasts Lookahead
Master Schedule
WorkStructuring
DesignCriteria 1. Simple, known, repeatable process
2. Workers shielded from upstream variance (chaos)

6
Master Milestone Plan• Strategic planning• Project milestones• Logic• WHAT & WHEN
Phase Schedule: 6 week look‐ahead
• More detail• Crew coordination• Testing logic•WHO, HOW, SEQUENCE
Daily/Weekly Work Plans & Percent Plan Complete (PPC)• Detail tasks• Decentralized crew scheduling• Measure PPC• Learning• Make Ready needs identification• Resource management•WHO, HOW, SEQUENCE
Expand detail Just‐In‐Time in a rigorous, phased approach
Adjust the plan through measured progress and lessons learned
The Last Planner™ Hierarchy of Planning
Planning & Constraint Analysis:1 & 3 week look‐aheads
•Constraint identification• Responsibility assigned• Resource management• Logistics, logistics, logistics•WHO, HOW, SEQUENCE
& Production Control

7
Sat Sun Mon Tues Wed Thur Fri
ProductionMeeting
DID & WILL
Daily Huddles & Weekly Work Plan ExecutionCAN
Updating Make Ready LookaheadCAN

8
DAILY HUDDLE (Pre-Task Plan)
What are our Productivity Goals for Today? Do we have what we Need? Any Obstacles to Achieving our Goals? Does Anyone see a Better Way? Were there any Near Misses Yesterday? What Safety Hazards should we Be Aware
of Today? Lean Mission: To continually examine our processes to provide greater value to our customers without waste.

9
The Last Planner™ ‐ Pull Planning
Collaborate, really collaborate!

10
Objective: pour a 12’ x 12’ x 4’ thick concrete pad for a compressor.
5 volunteers for the following trades: Carpenter, Excavator, Steelworker, Mason, Electrician
Select from the preprinted sticky notes those tasks that fit your individual trade requirements
If you need additional tasks ask Patrick to print for you
Independently arrange sticky notes from start (far left) to finish (far right)
As a group, review all tasks and negotiate the best plan by rearranging tasks and/or adding additional tasks
The Last Planner™ Simulation – PULL“Riding the Bike”

11
Starting with the milestone Concrete Pad Complete, ask: “What constrains us from declaring this complete?”Looking at existing prerequisite tasks, do we need to add any?If so, then ask Patrick to print.
Choosing one of the next set of tasks to the left of Concrete Pad Complete, ask:
“What constrains us from declaring this complete?”Looking at existing prerequisite tasks, do we need to add any?If so, then ask Patrick to print.
Continue for a few more minutes
Import the completed plan into MS‐Project via NxtNote
The Last Planner™ Simulation – PULL“Riding the Bike”

Manage WORKFLOW through LEAN Planning and Production Control (Last Planner)
Not everyone has to play for the project & the players to win
You can concurrently improve the BIG 5: Cost, schedule, quality, safety, and reliability
Continuous learning: make new mistakes next week
You must “Ride the Bike”
Go slow to go fast: reliability 1st, then go for speed
With every pair of hands you pay for… you get a free brain
12
LEAN Project Delivery Summarized

13
Ed Anderson, [email protected], 407-473-0260
Ted Angelo, [email protected], 414-702-2234
Patrick Potts, [email protected], 917-690-4505

14
1. 1st Monday Morning: What are you going to do this week?
2. 2nd Monday Morning: Did you do what you said you were going to do?a) If not, categorize (weather, planning, coordination, materials, …)b) If not, then why not in a few words?c) What 1 or 2 things would you do differently?d) What are you going to do this coming week?
3. 3rd Monday Morning: Did you do what you said you were going to do?a) If not, categorize (weather, planning, coordination, materials, …)b) If not, then why not, in a few words?c) What 1 or 2 things would you do differently?d) What are you going to do this coming week?
4. Etc.
Weekly/Daily Production Control & Commitments

15
CRI (Commitment Reliability Index)1
Before action was taken on learning• CRI trend was slightly positive (45% to 48%)• Variance around trend line is significant
1LCI refers to CRI as PPC (Percent Planned Complete)

16

17
Root Cause AnalysisCategory Root Cause Task ID Date

18
After Action Taken on Learning
• CRI trend is very positive (40% – 84%)• Variance around trend line is less.
Commitment Reliability Index (CRI)
• CRI trend was slightly positive (45%‐48%)• Variance around trend line was sizable
Before action taken on learning

19
• LEAN Project Delivery Systems™
• LEAN Planning , Production, and Workflow Control
• LEAN Business Analyses
• Managing multiple projects utilizing LEAN IT tools• For EPC: 3D; for AEC: BIM
• One model, multiple users –• Collaborate, really collaborate• “Get information my way”
• Electronic Document Management• Integrate with the 3D model to minimize duplicate information
management and synchronization• Deliver the Information Asset as a by‐product of the project
• Effective Change Management
¹Formerly Anderson Technical Services

20
NxtNote• Simplicity of a “Sticky Note”• Speed of a Computer• Accuracy of a Bar Code• Reach of the Web
Thanks for letting us participate in your meeting, we would be excited to speak with you. For more information or a demonstration of NxtNote
Contact:Patrick PottsVice President, Sales & [email protected]‐690‐4505

Rev. 03/22/2010 To continually examine our processes to provide greater value to our customers without waste.
Lean Construction encompasses all aspects of a construction business including estimating, design, procurement, finance, information systems, project management, fabrication, service, installation, and transportation. It primarily addresses the need to examine whatever practices are currently being used and tests whether such methodology is the most effective to add value without waste. It challenges long-standing practices in light of what has been done to revolutionize the manufacturing sector, applying those principles in construction. Lean also incorporates quality control / management with problem-solving tools to identify processes for corrective action and to sustain such correction. The Lean process is systematically applied to common sense and is implemented with team effort. The idea of Lean is not new. The concept dates back to the 1920’s with Henry Ford and was later adopted and enhanced with the Toyota Production System. There are a variety of tools in the “Lean Toolbox” such as: Team Building: Teams made up of diverse backgrounds are integral to the Lean journey success. 5S: This Lean tool follows a five-step process of Sorting, Straightening, Sweeping, Standardizing, and Sustaining to reduce waste. These principles have been applied universally to areas such as the tool room, shops, offices, vehicles, and jobsites. Last Planner: When utilizing the Last Planner, team members meet weekly to scan six weeks into the future and review the project’s steps, as well as the number and type of workers required to complete the planned project. There is special emphasis on the one-week plan; this involves assigning individuals for the upcoming week’s activities. Integrated Project Delivery (IPD): IPD is a Lean project delivery method that integrates people, systems, business structures and practices into a process that harnesses the talents and insights of all participants to optimize project results, increase value to the owner, reduce waste, and maximize efficiency through all phases of design, fabrication, and construction. Value-Stream-Mapping: Value-stream-mapping creates a flow chart that visually represents every step in a business process, including the transfer of both information and materials. Just-in-Time Delivery: The principle of Just-in-Time Delivery manages deliveries, material movement, and inventory so that materials arrive on-time and are not moved again prior to installation. Problem-Solving: One of the Lean problem solving tools is “Root Cause Analysis” which is especially practical in our analysis of safety issues by asking the question “Why” at least 5 times to determine the actual root cause of a problem. We can then seek the real solution to the problem. Another Lean problem solving tool, “A3”, is a standardized format using 7 steps to communicate and organize thoughts to solve a problem. Error-Proofing: Definition = to avoid inadvertent errors. Individual employees and teams are empowered to identify the problematic issues and develop ideas and methods to prevent defects. Keep ideas as simple as possible for the most efficient implementation and sustainability. In summary, the Lean system organizes operations and material to make the most of available labor, space, and capital. Its purpose is to improve the productivity and efficiency of the things we do. Lean is not a program that is ever finished; it must become the culture of the company. Bottom Line: Continually examine one’s processes to provide greater value to the customer without waste. For more information, please contact Ted Angelo, Executive VP, Grunau Corp., [email protected], (414) 702-2234