Paper Vibroacoustic
18
For Peer Review Interior structure-borne noise reduction by controlling automotive body panel vibration Journal: Journal of Vibration and Control Manuscript ID: JVC-10-0339 Manuscript Type: Original Manuscript Date Submitted by the Author: 21-Dec-2010 Complete List of Authors: guo, rong zhang, lijun zhao, jing zhou, hong Keywords: Structure-borne noise, FEM-BEM, TPA, PACA, Damping treatment Abstract: The adoption of numerical method to perform the vibration and acoustic analysis is attracting increasing attention because of its merits of saving costs and time. The analysis flow chart of structure-borne noise reduction by controlling vehicle body panel vibration is brought forward. According to this flow chart, finite element analysis of body in white is performed by MSC. Nastran and the experimental modal analysis of body in white is also carried out. To verify finite element model, the correlation analysis between test and FE results is done. After the acoustic boundary element model with seats is built, the acoustic transfer vector (ATV) is calculated by using LMS software. The transfer path analysis is performed to estimate the powertrain and exhaust pipe operational forces at idle. Then the forces are inputted into the acoustic BEM to calculate body panel velocity. By combining ATV and body panel velocity, the interior acoustic response can be obtained. The simulation results are verified by the test. To point out the main contribution panels for the interior sound pressure level (SPL), panel acoustic contribution analysis (PACA) is based on BEM. At last, constrained damping treatments are adopted to control the main panel vibration based on PACA results. Test results indicate that the A-weighted SPL of interior noise at idle is reduced obviously before and after treatments, which has proved the correctness of PACA results. So it is believed that the proposed analysis method is feasible for reducing interior structure-borne noise. http://mc.manuscriptcentral.com/jvc Journal of Vibration and Control
-
Upload
roberto-iannuzzi -
Category
Documents
-
view
75 -
download
1
Transcript of Paper Vibroacoustic
For Peer Review
Interior structure-borne noise reduction by controlling
automotive body panel vibration
Journal: Journal of Vibration and Control
Manuscript ID: JVC-10-0339
Manuscript Type: Original Manuscript
Date Submitted by the Author:
21-Dec-2010
Complete List of Authors: guo, rong zhang, lijun zhao, jing zhou, hong
Keywords: Structure-borne noise, FEM-BEM, TPA, PACA, Damping treatment
Abstract:
The adoption of numerical method to perform the vibration and acoustic analysis is attracting increasing attention because of its merits of saving costs and time. The analysis flow chart of structure-borne noise reduction by controlling vehicle body panel vibration is brought forward. According to this flow chart, finite element analysis of body in white is performed by MSC. Nastran and the experimental modal analysis of body in white is also carried out. To verify finite element model, the correlation analysis between test and FE results is done. After the acoustic boundary element model with seats is built, the acoustic transfer vector (ATV) is calculated by using LMS software. The transfer path analysis is performed to estimate the powertrain and exhaust pipe operational
forces at idle. Then the forces are inputted into the acoustic BEM to calculate body panel velocity. By combining ATV and body panel velocity, the interior acoustic response can be obtained. The simulation results are verified by the test. To point out the main contribution panels for the interior sound pressure level (SPL), panel acoustic contribution analysis (PACA) is based on BEM. At last, constrained damping treatments are adopted to control the main panel vibration based on PACA results. Test results indicate that the A-weighted SPL of interior noise at idle is reduced obviously before and after treatments, which has proved the correctness of PACA results. So it is believed that the proposed analysis method is feasible for reducing interior structure-borne
noise.
http://mc.manuscriptcentral.com/jvc
Journal of Vibration and Control
For Peer Review
Page 1 of 16
http://mc.manuscriptcentral.com/jvc
Journal of Vibration and Control
123456789101112131415161718192021222324252627282930313233343536373839404142434445464748495051525354555657585960
For Peer Review
Interior structure-borne noise reduction by controlling automotive
body panel vibration
Rong Guo a,*
, Li-jun Zhang a, Jing Zhao
b, Hong Zhou
a
(a
Tongji University, National engineering laboratory of new energy vehicles and power systems, Shanghai, China)
(b
Shanghai Volkswagen Automotive Company Ltd., Shanghai, China)
Abstract
The adoption of numerical method to perform the vibration and acoustic analysis is attracting increasing
attention because of its merits of saving costs and time. The analysis flow chart of structure-borne noise
reduction by controlling vehicle body panel vibration is brought forward. According to this flow chart, finite
element analysis of body in white is performed by MSC. Nastran and the experimental modal analysis of
body in white is also carried out. To verify finite element model, the correlation analysis between test and FE
results is done. After the acoustic boundary element model with seats is built, the acoustic transfer vector
(ATV) is calculated by using LMS software. The transfer path analysis is performed to estimate the
powertrain and exhaust pipe operational forces at idle. Then the forces are inputted into the acoustic BEM to
calculate body panel velocity. By combining ATV and body panel velocity, the interior acoustic response can
be obtained. The simulation results are verified by the test. To point out the main contribution panels for the
interior sound pressure level (SPL), panel acoustic contribution analysis (PACA) is based on BEM. At last,
constrained damping treatments are adopted to control the main panel vibration based on PACA results. Test
results indicate that the A-weighted SPL of interior noise at idle is reduced obviously before and after
treatments, which has proved the correctness of PACA results. So it is believed that the proposed analysis
method is feasible for reducing interior structure-borne noise.
Key words: Structure-borne noise; FEM-BEM; TPA; PACA; Damping treatment
1. Introduction
Nowadays, one of the most valuable criteria for vehicle quality assessment is based on acoustic
emission levels: the comfort of a car depends on the noise level transmitted inside. Consequently, there is a
general attention to design criteria aiming at improving the structural-acoustic behaviour, in such a way to
withstand the increasingly restrictive ergonomic standard [1]. Interior noise can be divided into airborne
noise and structure-borne noise according to their transmission modes. Usually the noise below 500Hz is
transmitted by structure or solid. The structure-borne noise can be reduced by controlling noise sources or
their transfer paths.
For structure-borne analysis the frequency range of interest below 250Hz is determined by the major
sources of input energy. The excitation due to road conditions is typically predominant at frequencies less
than 25Hz, and it is usually random in nature and decrease rapidly with increasing frequency. The powertrain
idle and its harmonics have a strong excitation of frequencies below 250Hz [2]. This objective of this study
is to reduce interior structure-borne noise by controlling the body panel vibration without adjusting
powertrain mount system and suspension system.
* Corresponding author. Tel: +86 13564030444 Fax: +86 021-69589843
E-mail addresses: [email protected]
Page 2 of 16
http://mc.manuscriptcentral.com/jvc
Journal of Vibration and Control
123456789101112131415161718192021222324252627282930313233343536373839404142434445464748495051525354555657585960
For Peer Review
The structure-borne noise can be studied by numerical methodologies such as boundary element method
(BEM) and finite element method (FEM) that are effective up to medium frequencies [1]. The combined
usage of BEM and FEM is becoming more and more popular for vibro-acoustic analysis, with FEM to be
preferred for the structural dynamic simulation and BEM for the acoustic field assessment [1-8]. Such
combined approach provides results that are useful to plan active and passive design adjustments to minimize
the structure-borne noise that is transmitted inside the car body, so as to avoid very costly experimental
campaigns.
The analysis method and flow chart of structure-borne noise reduction by controlling body panel
vibration is brought forward in the present study. The finite element method is used to calculate the structural
characteristics of body in white (BIW) and correlation between FE and test results are done. After the
acoustic boundary element model with seats is built, the acoustic transfer vector (ATV) is calculated.
The transfer path analysis is performed to estimate the powertrain and exhaust pipe operational forces at
idle. Then the forces are input into the acoustic BEM to calculate body panel velocity. By combining ATV
and body panel velocity, the interior acoustic response can be achieved. And the simulation results are
verified by the test. To point out the main contribution panels for the interior SPL, panel acoustic
contribution analysis (PACA) is done based on BEM. At last, constrained damping treatments are adopted to
control panel vibration based on PACA results, and the test results verify the correctness of PACA.
2. Analysis method of structure-borne noise reduction by controlling body panel
vibration
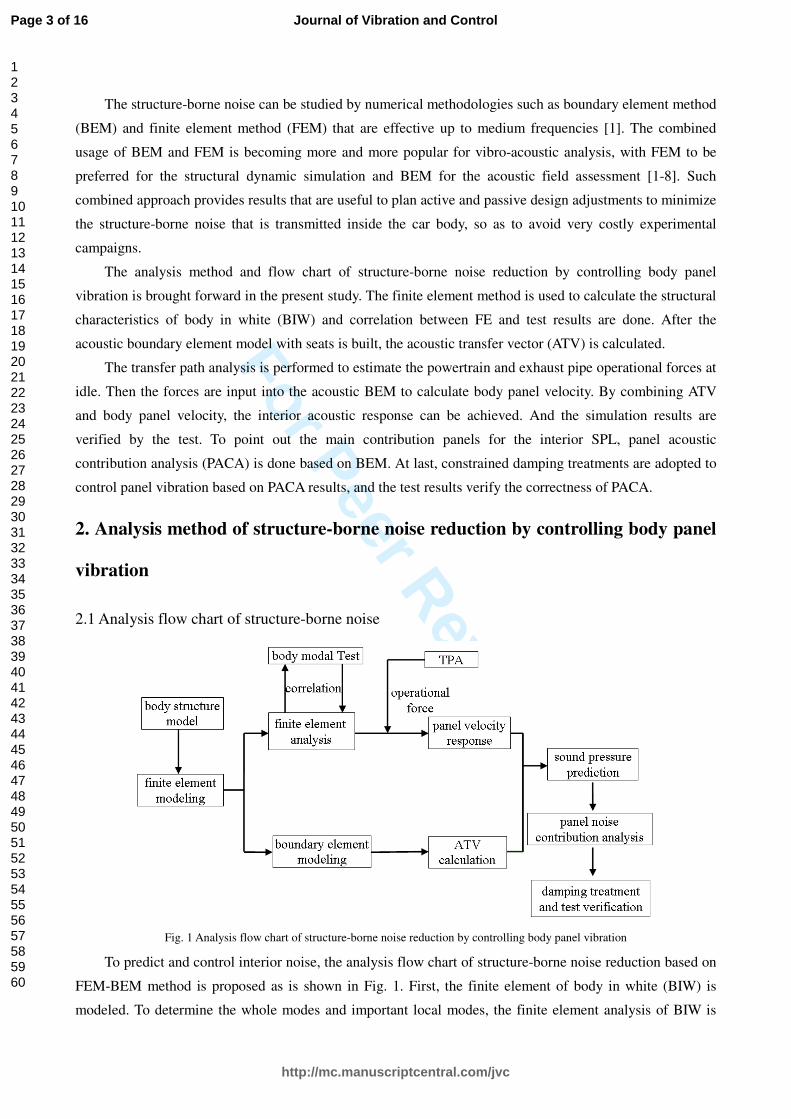
2.1 Analysis flow chart of structure-borne noise
Fig. 1 Analysis flow chart of structure-borne noise reduction by controlling body panel vibration
To predict and control interior noise, the analysis flow chart of structure-borne noise reduction based on
FEM-BEM method is proposed as is shown in Fig. 1. First, the finite element of body in white (BIW) is
modeled. To determine the whole modes and important local modes, the finite element analysis of BIW is
Page 3 of 16
http://mc.manuscriptcentral.com/jvc
Journal of Vibration and Control
123456789101112131415161718192021222324252627282930313233343536373839404142434445464748495051525354555657585960
For Peer Review
performed, and the experimental modal analysis of body in white is also carried out. The correlation analysis
between FE and test results is performed to verify finite element model. Then, the excitation forces obtained
from transfer path analysis (TPA) are loaded at the specific locations (powertrain mounts and exhaust pipe
hangers) of BIW to get body velocity response as the boundary conditions of panel acoustic contribution
analysis. On the other hand, the boundary element model of body with seats is modeled. After setting up field
points in BEM, the acoustic transfer vectors can be calculated. Then, to point out the direction for body panel
improvement, the panel acoustic contribution analysis (PACA) of peak frequencies at interior locations is
carried out through combining body velocity responses and ATVs. At last, constrained damping treatments
are adopted to control body panel vibration based on PACA results and the interior noise improvement is
verified by the test results.
2.2 Theory
The adopted FEM-BEM approach takes advantage of the Acoustic Transfer Vector (ATV) algorithm that
is particularly useful when big problems are to be solved [9]. ATV provides input-output relations between
the node normal velocities , ( )e iv ω of the radiating surface and the sound pressure level ( )p ω at a specific
field point (Eq. 1).
,
1
( ) ( ) ( )N
i e i
i
p ATV vω ω ω=
= •∑ (1)
where the terms N and ω respectively represent the total number of elements and angular frequency.
, ( )e iv ω is the normal velocity of the ith element.
ATVs can be interpreted as an ensemble of acoustic transfer functions from the surface nodes to a single
field point and they only depend on the configuration of the acoustic domain, i.e. geometry and properties
(speed of sound and density), on the acoustic surface treatment, on the frequency, and on the field point; they
do not depend on the loading conditions and structural response.
Body panel vibration velocity varies with different driving conditions. The acoustic response is
calculated for all loading conditions by combining the ATVs with the normal structural velocity boundary
condition vectors. However, acoustic transfer function is evaluated from the radiating surface to the specific
field point for the involved range frequency, without taking into account the actual loading conditions. When
the acoustic domain has not been changed, to shorten the time for solving the acoustic response and to
improve the analysis efficiency, we could use ATV technology to predict acoustic response in different
driving conditions.
3 Structural finite element analysis and test verification
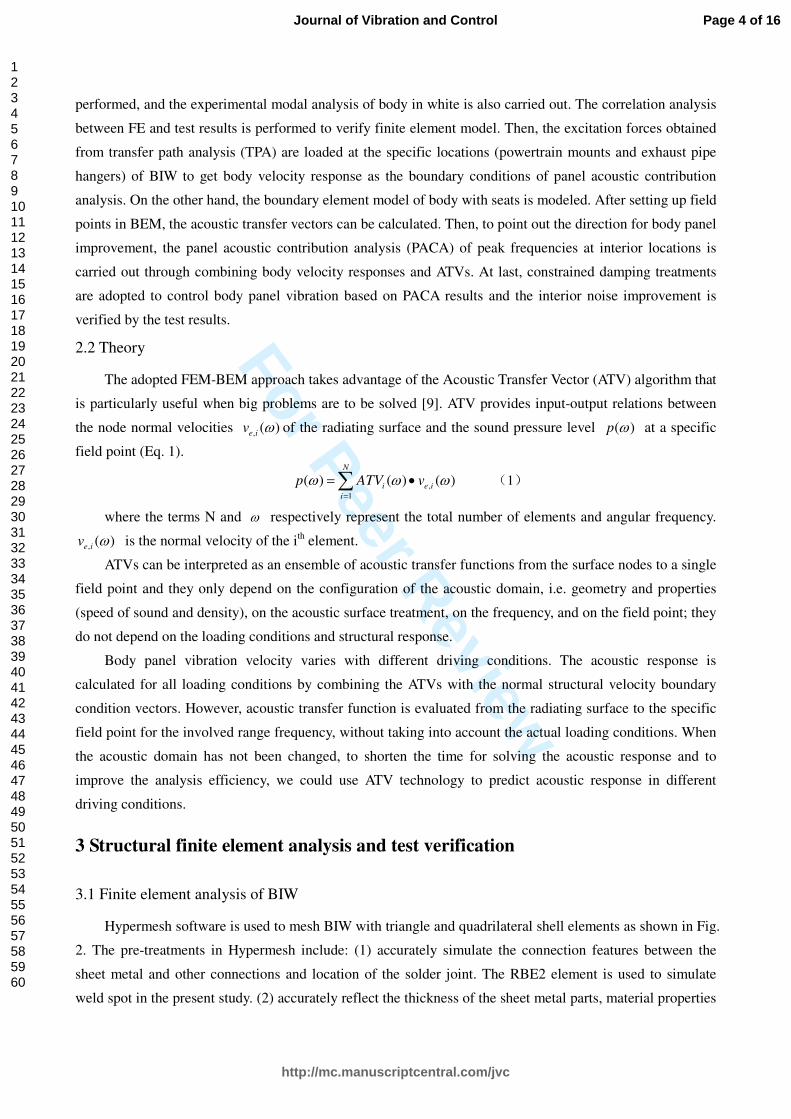
3.1 Finite element analysis of BIW
Hypermesh software is used to mesh BIW with triangle and quadrilateral shell elements as shown in Fig.
2. The pre-treatments in Hypermesh include: (1) accurately simulate the connection features between the
sheet metal and other connections and location of the solder joint. The RBE2 element is used to simulate
weld spot in the present study. (2) accurately reflect the thickness of the sheet metal parts, material properties
Page 4 of 16
http://mc.manuscriptcentral.com/jvc
Journal of Vibration and Control
123456789101112131415161718192021222324252627282930313233343536373839404142434445464748495051525354555657585960
For Peer Review
and other information.
Fig. 2 Finite element model of body in white
After the finite element has been modeled, the MSC/NASTRAN SOL103 is used to calculate the
structural modes of BIW [5].
3.2 Experimental modal analysis of BIW
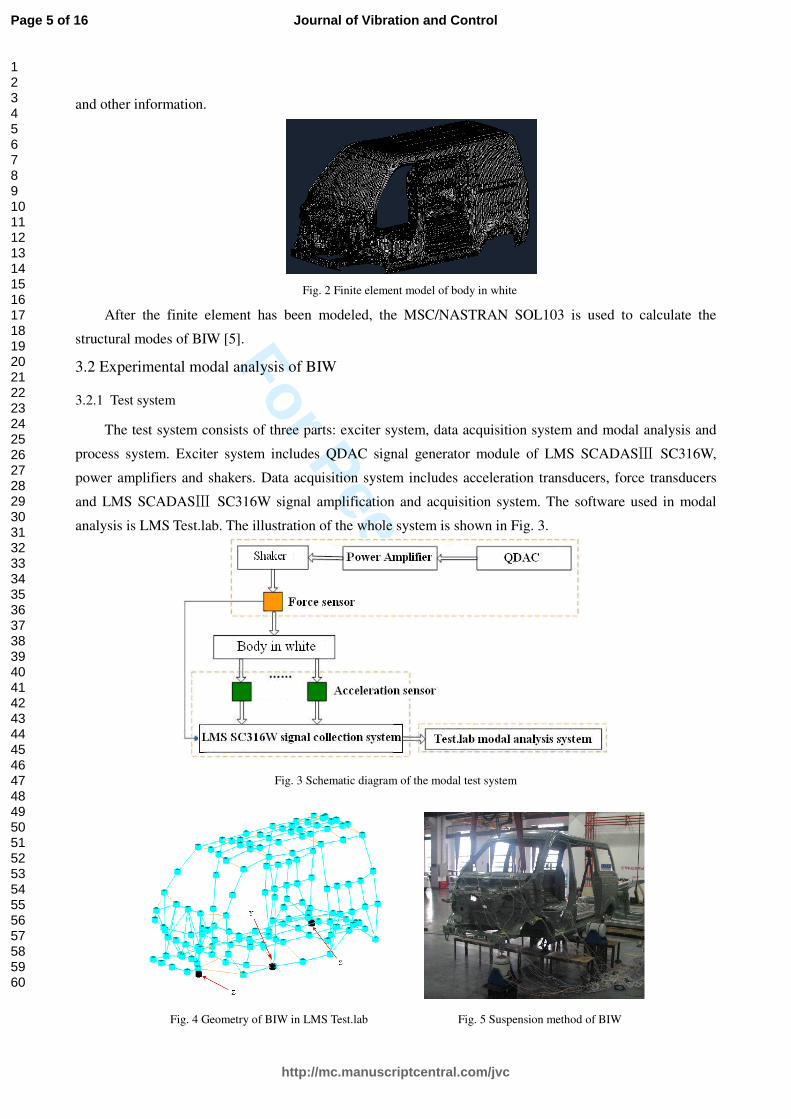
3.2.1 Test system
The test system consists of three parts: exciter system, data acquisition system and modal analysis and
process system. Exciter system includes QDAC signal generator module of LMS SCADASⅢ SC316W,
power amplifiers and shakers. Data acquisition system includes acceleration transducers, force transducers
and LMS SCADASⅢ SC316W signal amplification and acquisition system. The software used in modal
analysis is LMS Test.lab. The illustration of the whole system is shown in Fig. 3.
Fig. 3 Schematic diagram of the modal test system
Fig. 4 Geometry of BIW in LMS Test.lab Fig. 5 Suspension method of BIW
Page 5 of 16
http://mc.manuscriptcentral.com/jvc
Journal of Vibration and Control
123456789101112131415161718192021222324252627282930313233343536373839404142434445464748495051525354555657585960
For Peer Review
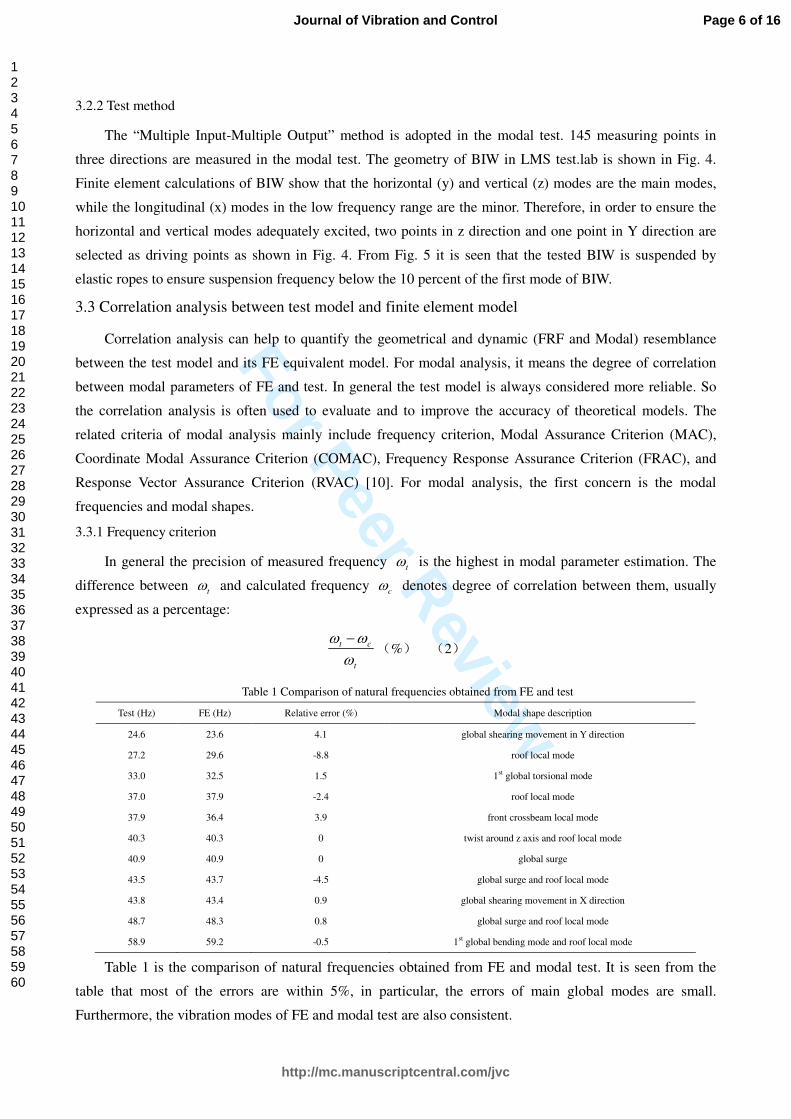
3.2.2 Test method
The “Multiple Input-Multiple Output” method is adopted in the modal test. 145 measuring points in
three directions are measured in the modal test. The geometry of BIW in LMS test.lab is shown in Fig. 4.
Finite element calculations of BIW show that the horizontal (y) and vertical (z) modes are the main modes,
while the longitudinal (x) modes in the low frequency range are the minor. Therefore, in order to ensure the
horizontal and vertical modes adequately excited, two points in z direction and one point in Y direction are
selected as driving points as shown in Fig. 4. From Fig. 5 it is seen that the tested BIW is suspended by
elastic ropes to ensure suspension frequency below the 10 percent of the first mode of BIW.
3.3 Correlation analysis between test model and finite element model
Correlation analysis can help to quantify the geometrical and dynamic (FRF and Modal) resemblance
between the test model and its FE equivalent model. For modal analysis, it means the degree of correlation
between modal parameters of FE and test. In general the test model is always considered more reliable. So
the correlation analysis is often used to evaluate and to improve the accuracy of theoretical models. The
related criteria of modal analysis mainly include frequency criterion, Modal Assurance Criterion (MAC),
Coordinate Modal Assurance Criterion (COMAC), Frequency Response Assurance Criterion (FRAC), and
Response Vector Assurance Criterion (RVAC) [10]. For modal analysis, the first concern is the modal
frequencies and modal shapes.
3.3.1 Frequency criterion
In general the precision of measured frequency t
ω is the highest in modal parameter estimation. The
difference between t
ω and calculated frequency c
ω denotes degree of correlation between them, usually
expressed as a percentage:
t c
t
ω ωω−
(%) (2)
Table 1 Comparison of natural frequencies obtained from FE and test
Test (Hz) FE (Hz) Relative error (%) Modal shape description
24.6 23.6 4.1 global shearing movement in Y direction
27.2 29.6 -8.8 roof local mode
33.0 32.5 1.5 1st global torsional mode
37.0 37.9 -2.4 roof local mode
37.9 36.4 3.9 front crossbeam local mode
40.3 40.3 0 twist around z axis and roof local mode
40.9 40.9 0 global surge
43.5 43.7 -4.5 global surge and roof local mode
43.8 43.4 0.9 global shearing movement in X direction
48.7 48.3 0.8 global surge and roof local mode
58.9 59.2 -0.5 1st global bending mode and roof local mode
Table 1 is the comparison of natural frequencies obtained from FE and modal test. It is seen from the
table that most of the errors are within 5%, in particular, the errors of main global modes are small.
Furthermore, the vibration modes of FE and modal test are also consistent.
Page 6 of 16
http://mc.manuscriptcentral.com/jvc
Journal of Vibration and Control
123456789101112131415161718192021222324252627282930313233343536373839404142434445464748495051525354555657585960
For Peer Review
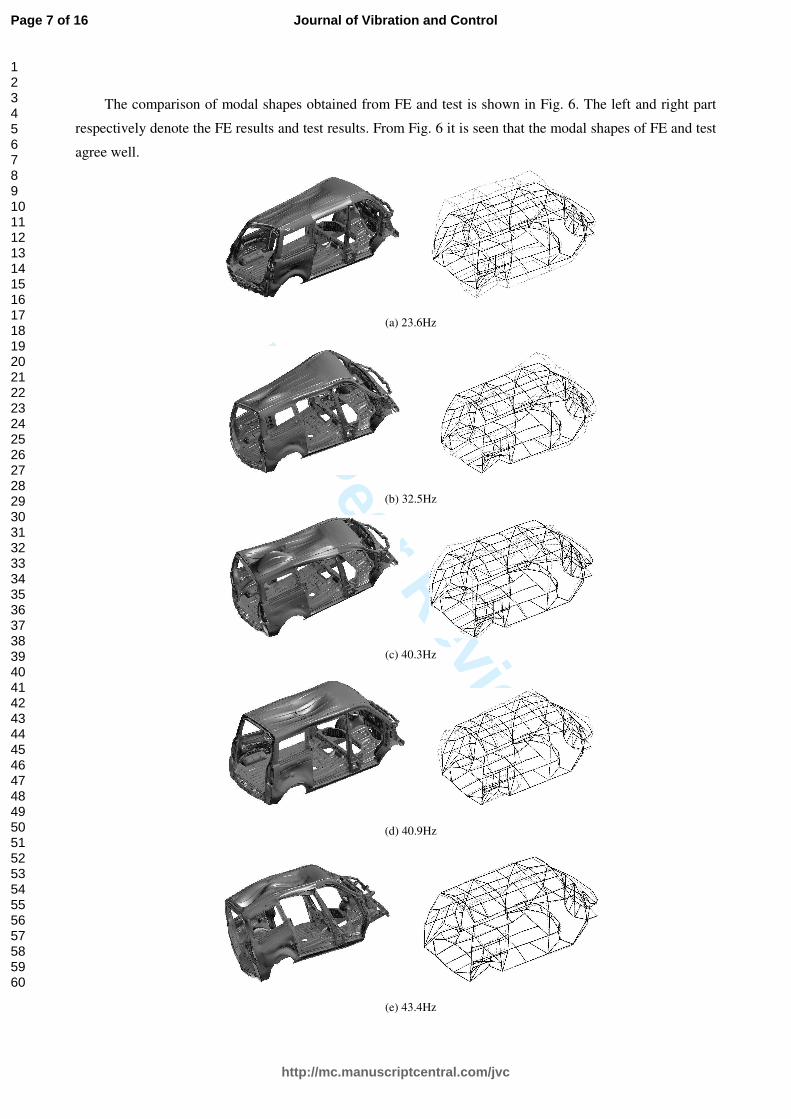
The comparison of modal shapes obtained from FE and test is shown in Fig. 6. The left and right part
respectively denote the FE results and test results. From Fig. 6 it is seen that the modal shapes of FE and test
agree well.
(a) 23.6Hz
(b) 32.5Hz
(c) 40.3Hz
(d) 40.9Hz
(e) 43.4Hz
Page 7 of 16
http://mc.manuscriptcentral.com/jvc
Journal of Vibration and Control
123456789101112131415161718192021222324252627282930313233343536373839404142434445464748495051525354555657585960
For Peer Review
(f)48.3Hz
Fig. 6 Comparison of modal shapes obtained from FE and test
3.3.2 Modal assurance criterion
Although the consistency of mode shapes can be evaluated by observing the modal shapes of FE and
test, this comparison is only qualitative analysis. Through the calculation of MAC, the degree of relationship
between modal shapes of FE and test can be quantitatively determined, and thus a more objective evaluation
can be given. The MAC values always lie between 0 and 1. The value of ijMAC is 0 when the FE and test
model are orthogonal, and 1 when the two models are equal. So, the corresponding test and FE modes should
have a high MAC values. The MAC matrix is built on position ij, using the test modal vectors ( }{ test
iψ ) and
FE modal vectors ( }{ FE
jψ ):
} }{{}{ }{( }{ }{(
2*
* *
test FE
i j
ijtest test FE FE
i i j j
MAC
ψ ψ
ψ ψ ψ ψ=
(3)
By the formula 3 we can see that the calculation of MAC should only consider the global mode shape
information. If the local modes are included in above mode shapes, the results will affect the credibility of
MAC values. Therefore, when calculating the MAC values of BIW, we should filter out the global modes as
calculation objects.
Table 2 MAC values of the main modal shapes of FE and test
Test FE 23.6Hz 32.5 Hz 40.3 Hz 40.9 Hz 43.4 Hz 48.3 Hz
24.6 Hz 0.93 0.02 0.02 0.01 0.00 0.02
33.0 Hz 0.01 0.93 0.00 0.01 0.02 0.01
40.3 Hz 0.01 0.00 0.79 0.15 0.15 0.10
40.9 Hz 0.04 0.02 0.12 0.71 0.01 0.00
43.8 Hz 0.02 0.01 0.01 0.02 0.57 0.09
48.7 Hz 0.07 0.00 0.00 0.03 0.00 0.75
Table 2 shows MAC values of the main few global modes. From the table, it shows that the values of
non-diagonal elements are close to 0 and those of the diagonal elements are above 0.7. This indicates that the
modal shapes of FE and test agree well. Thus the FE model has a high accuracy calculation for the next
analysis.
For the vibration mode of 43.8 Hz, the MAC value is small and does not meet the basic requirements
(above 0.7). This is due to the modal shapes of this frequency for the dislocation in x direction. At the same
time, in order to ensure the horizontal and vertical modes adequately excited in modal test, there are no
driving points in X direction. Thus this type of excitation could not provide enough excitation energy in X
Page 8 of 16
http://mc.manuscriptcentral.com/jvc
Journal of Vibration and Control
123456789101112131415161718192021222324252627282930313233343536373839404142434445464748495051525354555657585960
For Peer Review
direction which causes the error.
4 Acoustic boundary element modeling
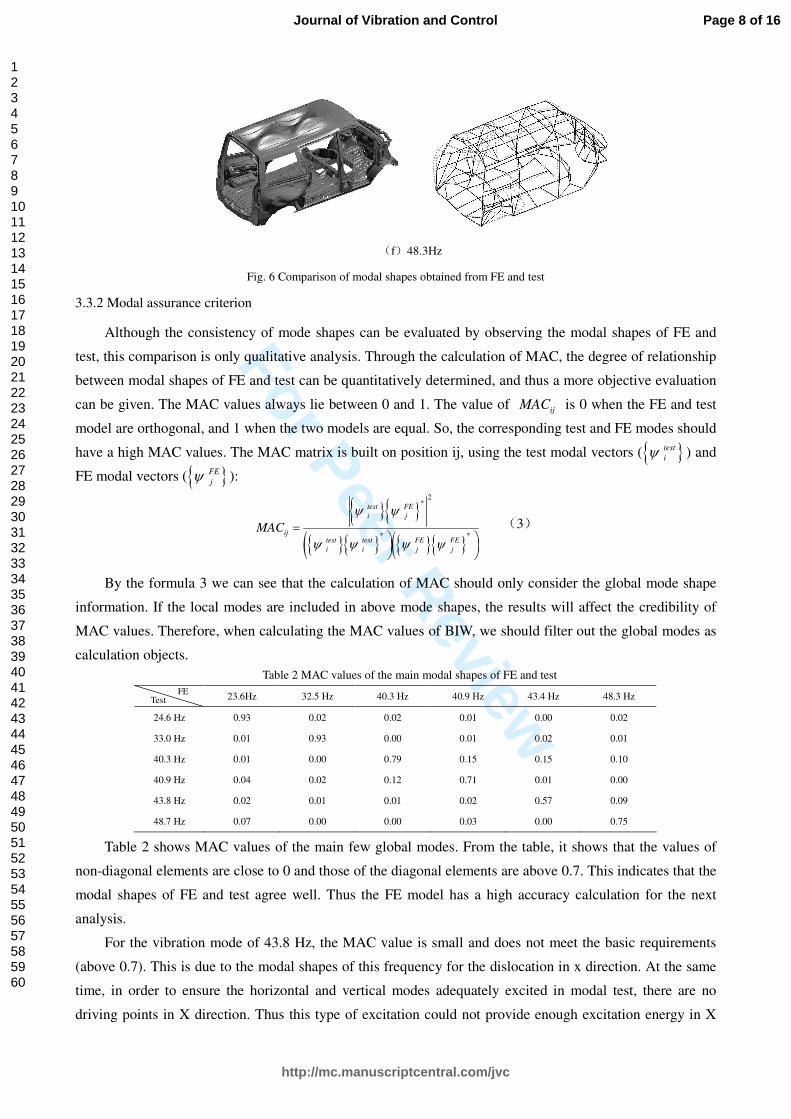
Because the existence of the seat has a great influence on the results of boundary element model [6], the
seats are included in the BEM. First, the CAD model of three rows of seats is modeled by using CATIA
software. Then the seat models are meshed in Hypermesh as shown in Fig. 7.
Through the LMS's automatic mesh generator, the acoustic finite element model of 80mm mesh size is
developed. According to the principle that there are at least six gird elements in a wavelength [7], the upper
analyzed frequency will reach to the 708.3Hz. The frequency can meet the research requirements of the
present paper. The acoustic boundary element model with seats is shown in right part of Fig. 7.
Fig. 7 Acoustic boundary element model
5 Interior structure-borne noise analysis
To determine the acoustical response, one must first compute acoustic transfer vector by the boundary
element (BE) method and determine the velocity response for the frequency range of 20-200 Hz on the
structure of the cab by the finite element (FE) method. The excitations for the velocity response using FEM
are the forces at the cab side of the mounts such as powertrain mounts and exhaust pipe hangers. This
velocity response is then translated into a boundary condition for the prediction of interior SPL by BEM.
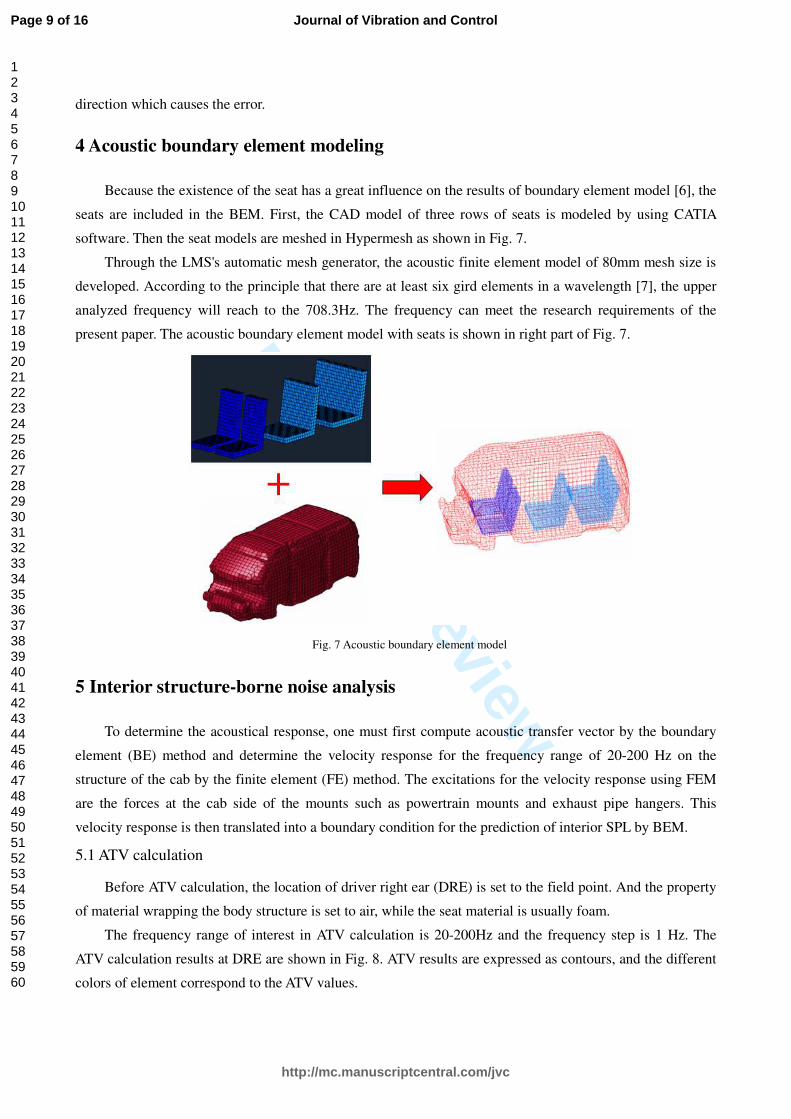
5.1 ATV calculation
Before ATV calculation, the location of driver right ear (DRE) is set to the field point. And the property
of material wrapping the body structure is set to air, while the seat material is usually foam.
The frequency range of interest in ATV calculation is 20-200Hz and the frequency step is 1 Hz. The
ATV calculation results at DRE are shown in Fig. 8. ATV results are expressed as contours, and the different
colors of element correspond to the ATV values.
Page 9 of 16
http://mc.manuscriptcentral.com/jvc
Journal of Vibration and Control
123456789101112131415161718192021222324252627282930313233343536373839404142434445464748495051525354555657585960
For Peer Review
(a) 27Hz (b) 54Hz
(c) 118Hz (d) 135Hz
Fig. 8 ATV calculation results at DRE
5.2 Structural frequency response analysis
5.2.1 Operational force calculation at idle
Engine idle condition is studied in the present paper. The engine mount exciting force transfer of XYZ
three translational degree of freedoms (DOFs) is considered and the moment transfer of rotational DOFs are
ignored. So there are nine transfer paths for three points engine mount. And we assume that the force
transmission of these paths is the process of energy coupling to each other. For exhaust pipe hangers, because
the exciting forces in X and Y direction have less influence on the interior noise, the forces in Z direction are
considered. Similar to engine mounts, we assume that the force transmission of four hangers is also the
process of energy coupling to each other. The matrix inversion method [11] is used to identify the exciting
forces. Test plans of transfer path analysis (TPA) are as follows:
(1) Two triaxial accelerators should be installed in body side of each powertrain mount. Hammer is used
to impact body side (as close to connection points as possible) of each mount in XYZ directions. At the same
time the force signal and the acceleration signal should be recorded.
(2) Two one-way accelerators should be installed in body side of each exhaust pipe hanger. Hammer is
used to vertically impact body side (as close to connection points as possible) of each hanger in Z direction.
At the same time the force signal and the acceleration signal should be recorded.
(3) Open the engine and let the engine warm up for a period of twenty minutes. After the engine idle
condition is stable, each accelerator signal should be recorded.
(4) The microphone is installed at DRE to measure the acoustic pressure at idle.
According to the matrix inversion method and above test plans, the exciting force formulas of engine
Page 10 of 16
http://mc.manuscriptcentral.com/jvc
Journal of Vibration and Control
123456789101112131415161718192021222324252627282930313233343536373839404142434445464748495051525354555657585960
For Peer Review
mounts and exhaust pipe hangers are shown in Eq. 4 and Eq. 5. To improve the accuracy of force
identification, nine reference DOFs in powertrain mounts and four reference DOFs in exhaust piper hangers
are designed in TPA.
[ ] [ ] [ ] 1
1 9 1 18 18 9PT PT PTF R H−
× × ×= × (4)
[ ] [ ] [ ] 1
1 4 1 8 8 4EP EP EPF R H−
× × ×= × (5)
where the terms [ ]iF and [ ]iR respectively represent exciting force vectors and response vectors.
The term [ ]iH is transfer function maxtrix. ‘i = PT’ and ‘i = EP’ respectively denote powertrain and
exhaust pipe.
(a) left hand side mount (b) right hand side mount
(c) transmission side mount (d) exhaust pipe mount
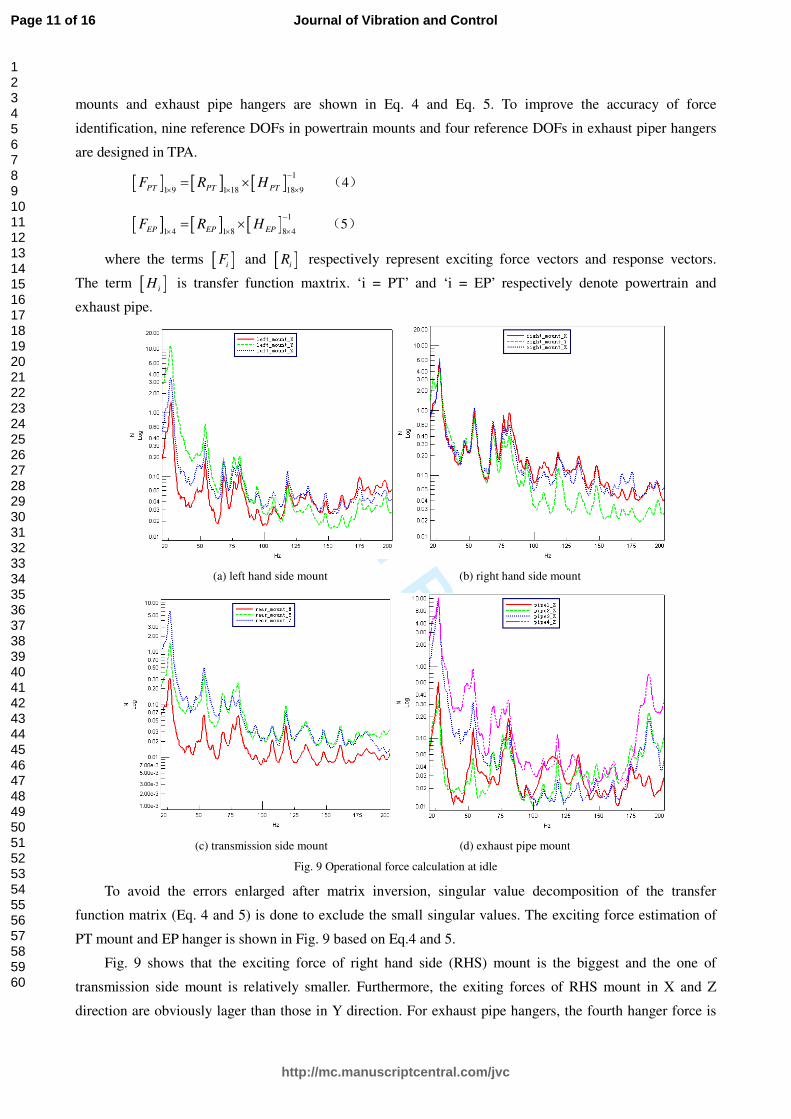
Fig. 9 Operational force calculation at idle
To avoid the errors enlarged after matrix inversion, singular value decomposition of the transfer
function matrix (Eq. 4 and 5) is done to exclude the small singular values. The exciting force estimation of
PT mount and EP hanger is shown in Fig. 9 based on Eq.4 and 5.
Fig. 9 shows that the exciting force of right hand side (RHS) mount is the biggest and the one of
transmission side mount is relatively smaller. Furthermore, the exiting forces of RHS mount in X and Z
direction are obviously lager than those in Y direction. For exhaust pipe hangers, the fourth hanger force is
Page 11 of 16
http://mc.manuscriptcentral.com/jvc
Journal of Vibration and Control
123456789101112131415161718192021222324252627282930313233343536373839404142434445464748495051525354555657585960
For Peer Review
the biggest in all 4 hangers and the third hanger force is the second.
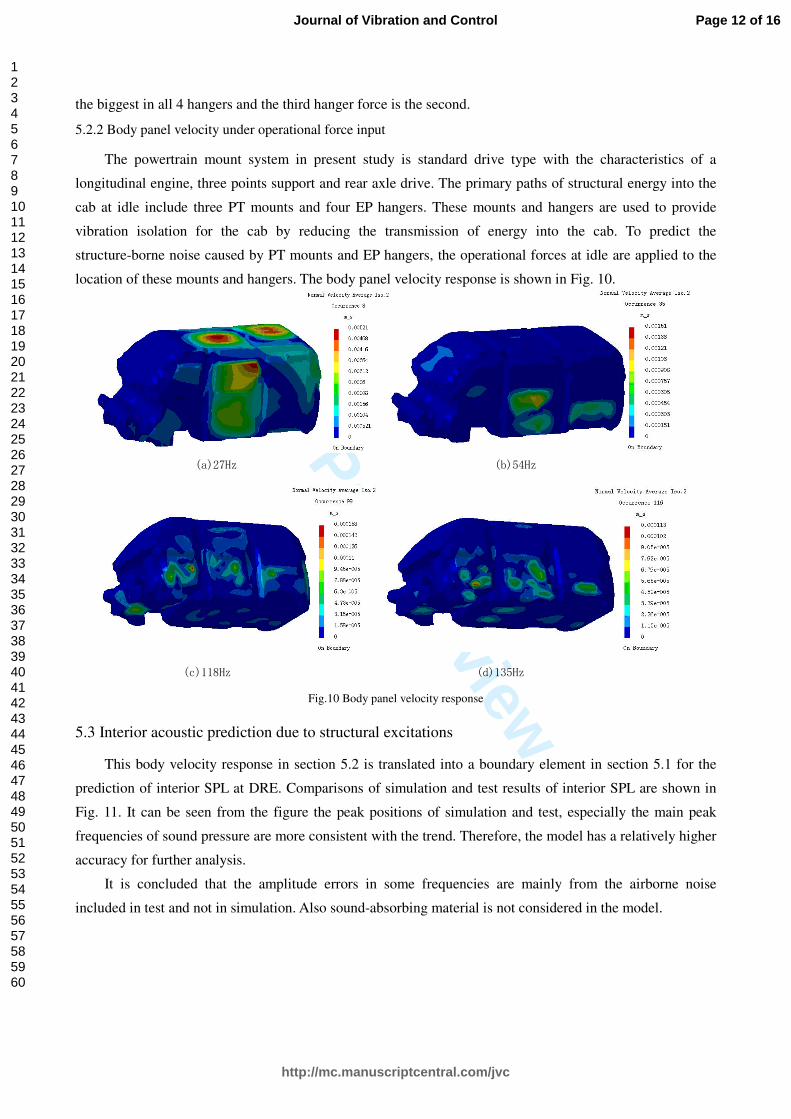
5.2.2 Body panel velocity under operational force input
The powertrain mount system in present study is standard drive type with the characteristics of a
longitudinal engine, three points support and rear axle drive. The primary paths of structural energy into the
cab at idle include three PT mounts and four EP hangers. These mounts and hangers are used to provide
vibration isolation for the cab by reducing the transmission of energy into the cab. To predict the
structure-borne noise caused by PT mounts and EP hangers, the operational forces at idle are applied to the
location of these mounts and hangers. The body panel velocity response is shown in Fig. 10.
(a)27Hz (b)54Hz
(c)118Hz (d)135Hz
Fig.10 Body panel velocity response
5.3 Interior acoustic prediction due to structural excitations
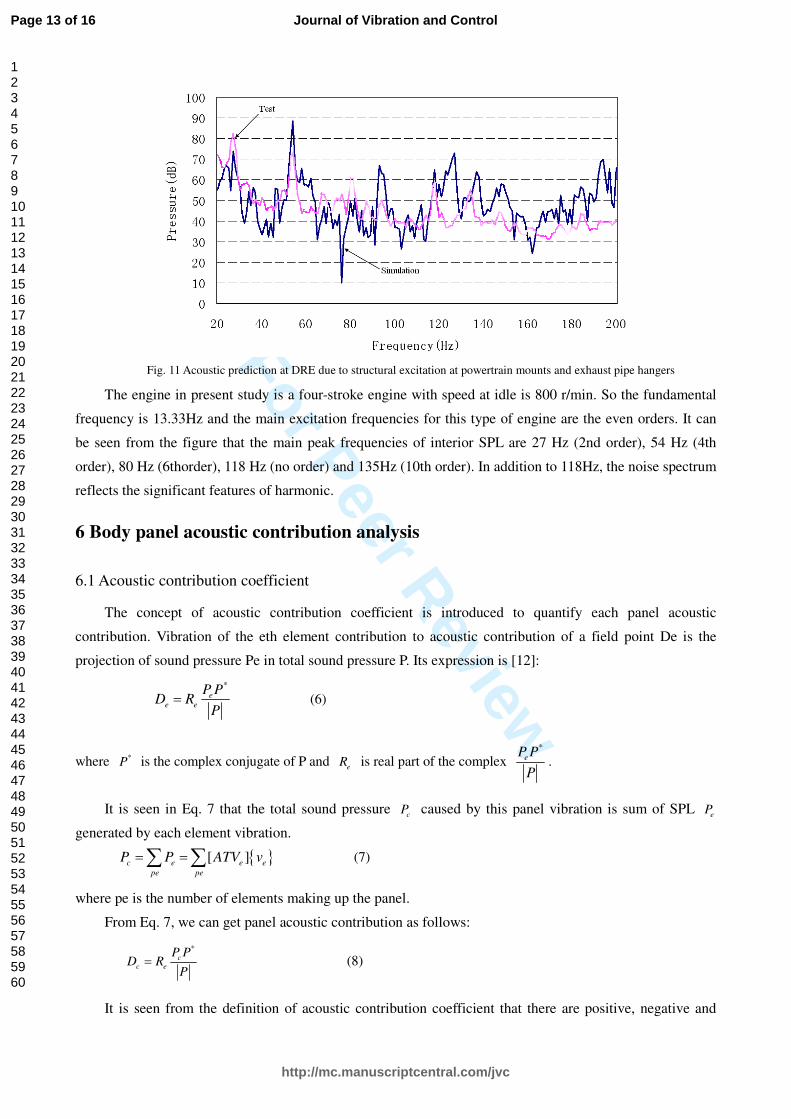
This body velocity response in section 5.2 is translated into a boundary element in section 5.1 for the
prediction of interior SPL at DRE. Comparisons of simulation and test results of interior SPL are shown in
Fig. 11. It can be seen from the figure the peak positions of simulation and test, especially the main peak
frequencies of sound pressure are more consistent with the trend. Therefore, the model has a relatively higher
accuracy for further analysis.
It is concluded that the amplitude errors in some frequencies are mainly from the airborne noise
included in test and not in simulation. Also sound-absorbing material is not considered in the model.
Page 12 of 16
http://mc.manuscriptcentral.com/jvc
Journal of Vibration and Control
123456789101112131415161718192021222324252627282930313233343536373839404142434445464748495051525354555657585960
For Peer Review
Fig. 11 Acoustic prediction at DRE due to structural excitation at powertrain mounts and exhaust pipe hangers
The engine in present study is a four-stroke engine with speed at idle is 800 r/min. So the fundamental
frequency is 13.33Hz and the main excitation frequencies for this type of engine are the even orders. It can
be seen from the figure that the main peak frequencies of interior SPL are 27 Hz (2nd order), 54 Hz (4th
order), 80 Hz (6thorder), 118 Hz (no order) and 135Hz (10th order). In addition to 118Hz, the noise spectrum
reflects the significant features of harmonic.
6 Body panel acoustic contribution analysis
6.1 Acoustic contribution coefficient
The concept of acoustic contribution coefficient is introduced to quantify each panel acoustic
contribution. Vibration of the eth element contribution to acoustic contribution of a field point De is the
projection of sound pressure Pe in total sound pressure P. Its expression is [12]:
*
e
e e
P PD R
P= (6)
where *P is the complex conjugate of P and
eR is real part of the complex
*
eP P
P.
It is seen in Eq. 7 that the total sound pressure c
P caused by this panel vibration is sum of SPL e
P
generated by each element vibration.
{ }[ ]c e e e
pe pe
P P ATV v= =∑ ∑ (7)
where pe is the number of elements making up the panel.
From Eq. 7, we can get panel acoustic contribution as follows:
*
c
c e
P PD R
P= (8)
It is seen from the definition of acoustic contribution coefficient that there are positive, negative and
Page 13 of 16
http://mc.manuscriptcentral.com/jvc
Journal of Vibration and Control
123456789101112131415161718192021222324252627282930313233343536373839404142434445464748495051525354555657585960
For Peer Review
neutral acoustic contribution. If the phase angle difference between a panel pressure and total pressure is less
than 90 °, the panel or element contributes to the total amount in a positive way. The total pressure increases
with the increasing contribution. If the phase angle difference between a panel pressure and total pressure is
more than 90 °, the panel or element contributes to the total amount in a negative way. Their contribution
actually reduces the total pressure. If the phase angle difference between a panel pressure and total pressure
is close to 90 ° or the panel pressure amplitude is small, the panel or element contribute to the total amount in
a neutral way. Neutral contribution panel can not be modified to achieve the desired objectives. So it is very
important to identify positive and negative acoustic contributions for noise reduction before structural
modifications.
6.2 Panel acoustic contribution analysis
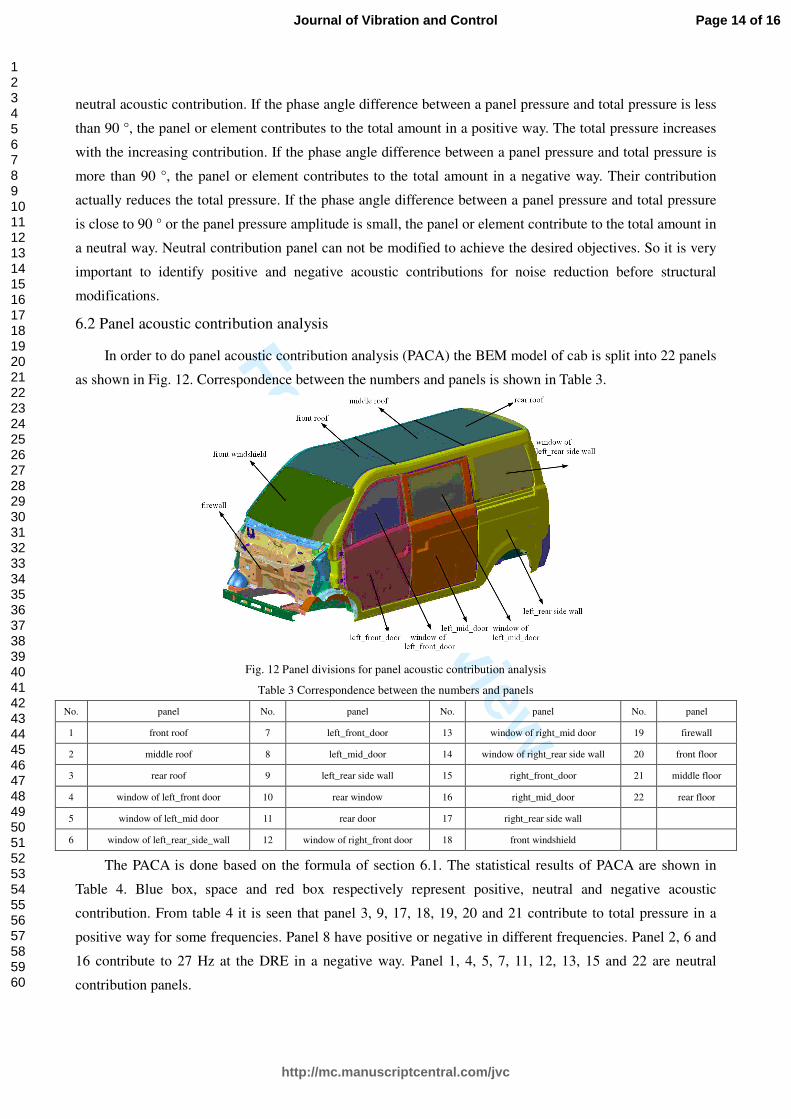
In order to do panel acoustic contribution analysis (PACA) the BEM model of cab is split into 22 panels
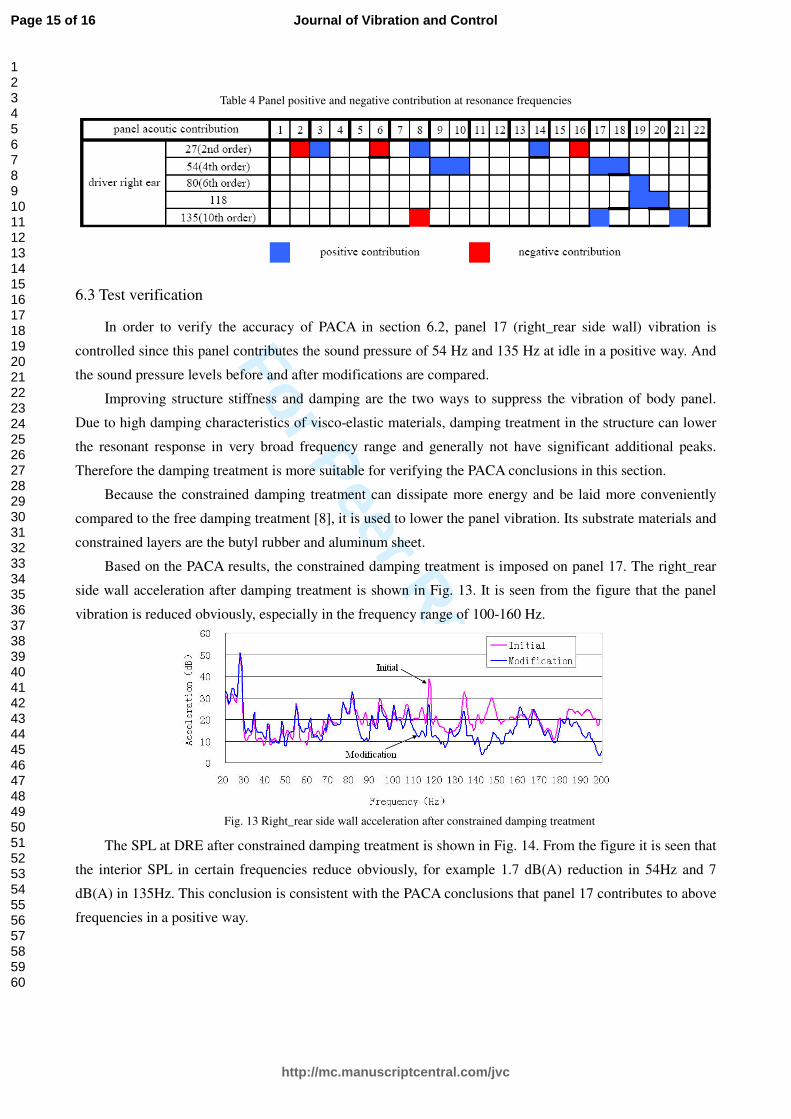
as shown in Fig. 12. Correspondence between the numbers and panels is shown in Table 3.
Fig. 12 Panel divisions for panel acoustic contribution analysis
Table 3 Correspondence between the numbers and panels
No. panel No. panel No. panel No. panel
1 front roof 7 left_front_door 13 window of right_mid door 19 firewall
2 middle roof 8 left_mid_door 14 window of right_rear side wall 20 front floor
3 rear roof 9 left_rear side wall 15 right_front_door 21 middle floor
4 window of left_front door 10 rear window 16 right_mid_door 22 rear floor
5 window of left_mid door 11 rear door 17 right_rear side wall
6 window of left_rear_side_wall 12 window of right_front door 18 front windshield
The PACA is done based on the formula of section 6.1. The statistical results of PACA are shown in
Table 4. Blue box, space and red box respectively represent positive, neutral and negative acoustic
contribution. From table 4 it is seen that panel 3, 9, 17, 18, 19, 20 and 21 contribute to total pressure in a
positive way for some frequencies. Panel 8 have positive or negative in different frequencies. Panel 2, 6 and
16 contribute to 27 Hz at the DRE in a negative way. Panel 1, 4, 5, 7, 11, 12, 13, 15 and 22 are neutral
contribution panels.
Page 14 of 16
http://mc.manuscriptcentral.com/jvc
Journal of Vibration and Control
123456789101112131415161718192021222324252627282930313233343536373839404142434445464748495051525354555657585960
For Peer Review
Table 4 Panel positive and negative contribution at resonance frequencies
6.3 Test verification
In order to verify the accuracy of PACA in section 6.2, panel 17 (right_rear side wall) vibration is
controlled since this panel contributes the sound pressure of 54 Hz and 135 Hz at idle in a positive way. And
the sound pressure levels before and after modifications are compared.
Improving structure stiffness and damping are the two ways to suppress the vibration of body panel.
Due to high damping characteristics of visco-elastic materials, damping treatment in the structure can lower
the resonant response in very broad frequency range and generally not have significant additional peaks.
Therefore the damping treatment is more suitable for verifying the PACA conclusions in this section.
Because the constrained damping treatment can dissipate more energy and be laid more conveniently
compared to the free damping treatment [8], it is used to lower the panel vibration. Its substrate materials and
constrained layers are the butyl rubber and aluminum sheet.
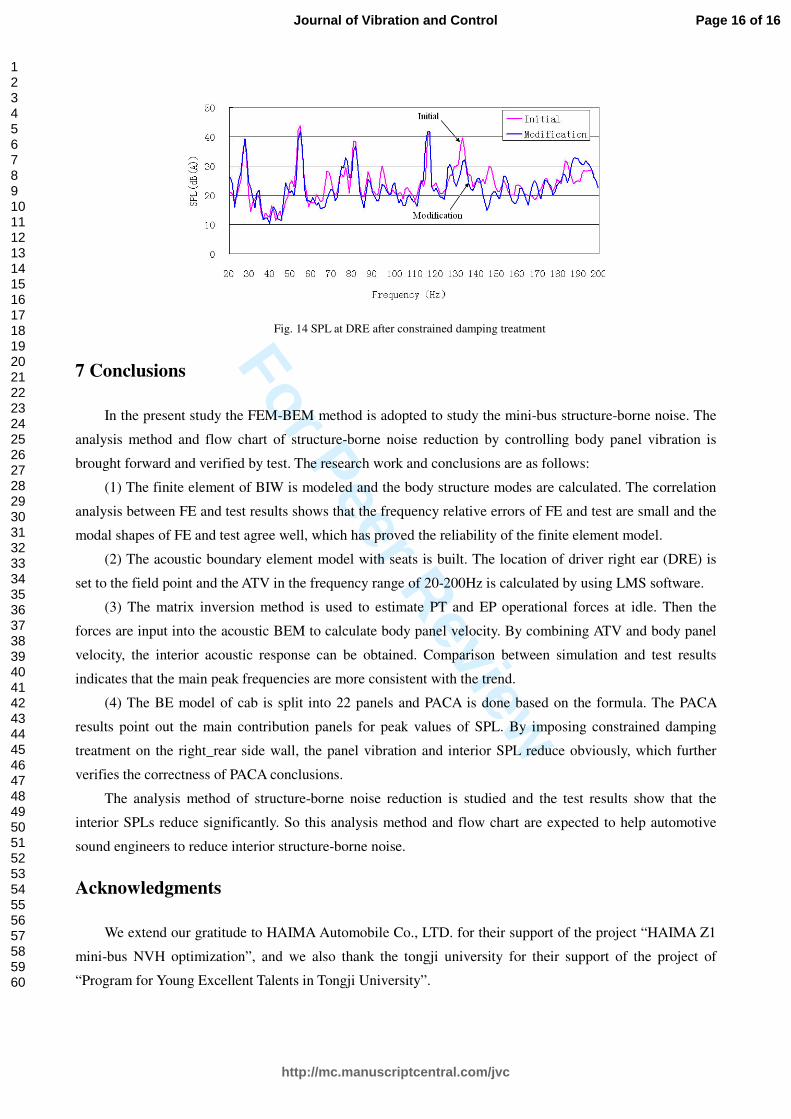
Based on the PACA results, the constrained damping treatment is imposed on panel 17. The right_rear
side wall acceleration after damping treatment is shown in Fig. 13. It is seen from the figure that the panel
vibration is reduced obviously, especially in the frequency range of 100-160 Hz.
Fig. 13 Right_rear side wall acceleration after constrained damping treatment
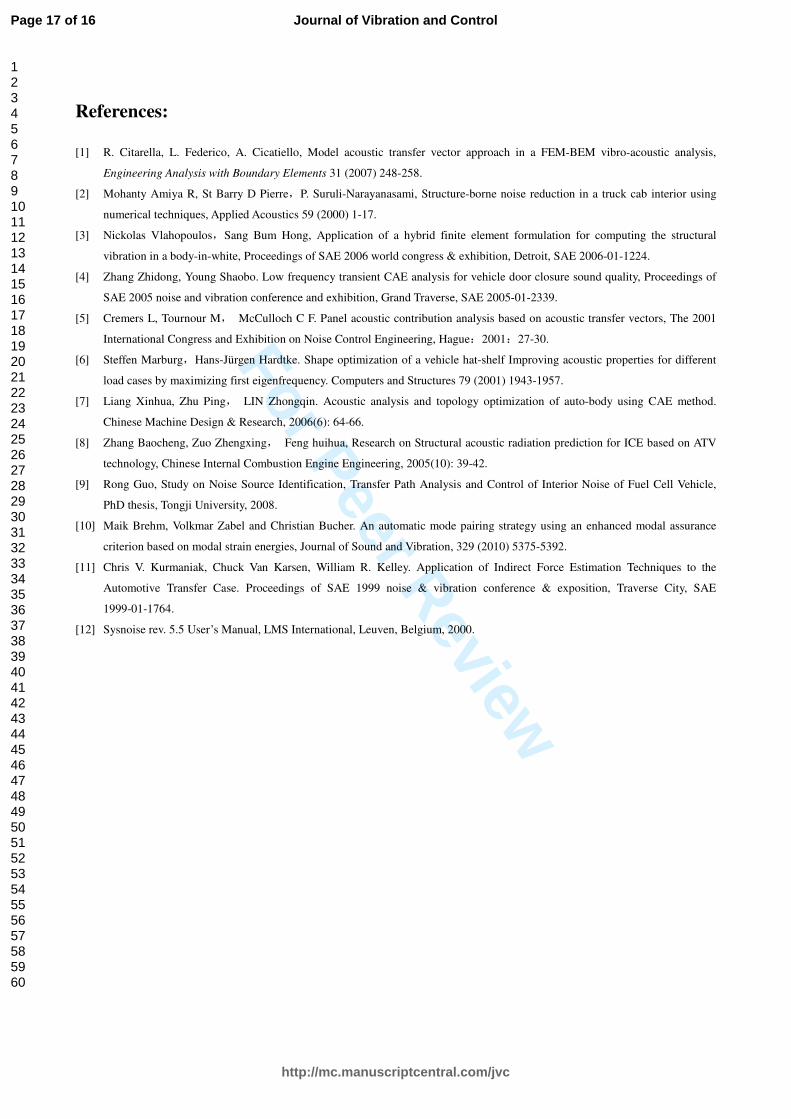
The SPL at DRE after constrained damping treatment is shown in Fig. 14. From the figure it is seen that
the interior SPL in certain frequencies reduce obviously, for example 1.7 dB(A) reduction in 54Hz and 7
dB(A) in 135Hz. This conclusion is consistent with the PACA conclusions that panel 17 contributes to above
frequencies in a positive way.
Page 15 of 16
http://mc.manuscriptcentral.com/jvc
Journal of Vibration and Control
123456789101112131415161718192021222324252627282930313233343536373839404142434445464748495051525354555657585960
For Peer Review
Fig. 14 SPL at DRE after constrained damping treatment
7 Conclusions
In the present study the FEM-BEM method is adopted to study the mini-bus structure-borne noise. The
analysis method and flow chart of structure-borne noise reduction by controlling body panel vibration is
brought forward and verified by test. The research work and conclusions are as follows:
(1) The finite element of BIW is modeled and the body structure modes are calculated. The correlation
analysis between FE and test results shows that the frequency relative errors of FE and test are small and the
modal shapes of FE and test agree well, which has proved the reliability of the finite element model.
(2) The acoustic boundary element model with seats is built. The location of driver right ear (DRE) is
set to the field point and the ATV in the frequency range of 20-200Hz is calculated by using LMS software.
(3) The matrix inversion method is used to estimate PT and EP operational forces at idle. Then the
forces are input into the acoustic BEM to calculate body panel velocity. By combining ATV and body panel
velocity, the interior acoustic response can be obtained. Comparison between simulation and test results
indicates that the main peak frequencies are more consistent with the trend.
(4) The BE model of cab is split into 22 panels and PACA is done based on the formula. The PACA
results point out the main contribution panels for peak values of SPL. By imposing constrained damping
treatment on the right_rear side wall, the panel vibration and interior SPL reduce obviously, which further
verifies the correctness of PACA conclusions.
The analysis method of structure-borne noise reduction is studied and the test results show that the
interior SPLs reduce significantly. So this analysis method and flow chart are expected to help automotive
sound engineers to reduce interior structure-borne noise.
Acknowledgments
We extend our gratitude to HAIMA Automobile Co., LTD. for their support of the project “HAIMA Z1
mini-bus NVH optimization”, and we also thank the tongji university for their support of the project of
“Program for Young Excellent Talents in Tongji University”.
Page 16 of 16
http://mc.manuscriptcentral.com/jvc
Journal of Vibration and Control
123456789101112131415161718192021222324252627282930313233343536373839404142434445464748495051525354555657585960
For Peer Review
References:
[1] R. Citarella, L. Federico, A. Cicatiello, Model acoustic transfer vector approach in a FEM-BEM vibro-acoustic analysis,
Engineering Analysis with Boundary Elements 31 (2007) 248-258.
[2] Mohanty Amiya R, St Barry D Pierre,P. Suruli-Narayanasami, Structure-borne noise reduction in a truck cab interior using
numerical techniques, Applied Acoustics 59 (2000) 1-17.
[3] Nickolas Vlahopoulos,Sang Bum Hong, Application of a hybrid finite element formulation for computing the structural
vibration in a body-in-white, Proceedings of SAE 2006 world congress & exhibition, Detroit, SAE 2006-01-1224.
[4] Zhang Zhidong, Young Shaobo. Low frequency transient CAE analysis for vehicle door closure sound quality, Proceedings of
SAE 2005 noise and vibration conference and exhibition, Grand Traverse, SAE 2005-01-2339.
[5] Cremers L, Tournour M, McCulloch C F. Panel acoustic contribution analysis based on acoustic transfer vectors, The 2001
International Congress and Exhibition on Noise Control Engineering, Hague:2001:27-30.
[6] Steffen Marburg,Hans-Jürgen Hardtke. Shape optimization of a vehicle hat-shelf Improving acoustic properties for different
load cases by maximizing first eigenfrequency. Computers and Structures 79 (2001) 1943-1957.
[7] Liang Xinhua, Zhu Ping, LIN Zhongqin. Acoustic analysis and topology optimization of auto-body using CAE method.
Chinese Machine Design & Research, 2006(6): 64-66.
[8] Zhang Baocheng, Zuo Zhengxing, Feng huihua, Research on Structural acoustic radiation prediction for ICE based on ATV
technology, Chinese Internal Combustion Engine Engineering, 2005(10): 39-42.
[9] Rong Guo, Study on Noise Source Identification, Transfer Path Analysis and Control of Interior Noise of Fuel Cell Vehicle,
PhD thesis, Tongji University, 2008.
[10] Maik Brehm, Volkmar Zabel and Christian Bucher. An automatic mode pairing strategy using an enhanced modal assurance
criterion based on modal strain energies, Journal of Sound and Vibration, 329 (2010) 5375-5392.
[11] Chris V. Kurmaniak, Chuck Van Karsen, William R. Kelley. Application of Indirect Force Estimation Techniques to the
Automotive Transfer Case. Proceedings of SAE 1999 noise & vibration conference & exposition, Traverse City, SAE
1999-01-1764.
[12] Sysnoise rev. 5.5 User’s Manual, LMS International, Leuven, Belgium, 2000.
Page 17 of 16
http://mc.manuscriptcentral.com/jvc
Journal of Vibration and Control
123456789101112131415161718192021222324252627282930313233343536373839404142434445464748495051525354555657585960