Paper Session 7 Catch Me If You Can: Financial … · 2016 CAPANA / CJAR Conference 8-9 July 2016...
55
2016 CAPANA / CJAR Conference 8-9 July 2016 Paper Session 7 Catch Me If You Can: Financial Misconduct around Corporate Headquarters Relocations By Paul Calluzzo Queen’s University Wei Wang Queen’s University and HKUST Serena Wu Queen’s University
Transcript of Paper Session 7 Catch Me If You Can: Financial … · 2016 CAPANA / CJAR Conference 8-9 July 2016...

2016 CAPANA / CJAR Conference
8-9 July 2016
Paper Session 7
Catch Me If You Can: Financial Misconduct around Corporate
Headquarters Relocations
By
Paul CalluzzoQueen’s University
Wei WangQueen’s University and HKUST
Serena WuQueen’s University

Catch Me If You Can:
Financial Misconduct around Corporate Headquarters Relocations1
Paul Calluzzo Queen’s University 2
Wei Wang
Queen’s University and HKUST 3
Serena Wu Queen’s University 4
First Version: May 2015
This Version: February, 2016
Abstract
We examine whether firms relocate to avoid the scrutiny of local Security and Exchange Commission (SEC) enforcement offices and find that financial misreporting activities are positively associated with the probability of headquarters being relocated out of the jurisdiction states of local SEC office. Firms whose financial statements suggest fraudulent activities are more likely to move to locations where the regional SEC office has a history of less intense scrutiny against local firms, and they tend to relocate without providing explicit reasons. Using shocks to SEC enforcement intensity for identification, we find that these firms are more likely to relocate after the shock. Our difference-in-difference tests further suggest that relocating firms with scrutiny avoidance as a motive exhibit higher fraud scores after relocation and are more likely to file earnings restatements than their matched peers. Our results provide new evidence on the fraudulent motives for headquarters relocation, and suggest that the intensity of SEC enforcement affects corporate strategies. Keywords: Headquarters Relocation; Enforcement; Regulation; SEC; Misreporting; Fraud; Earnings Management; Litigation; Geographic Proximity. JEL classification: G34, G38, M48 1 We are grateful for the valuable suggestions from Qiang Cheng, Huasheng Gao, Pengjie Gao, Vincent Glode, Todd Gormley, Wayne Guay, Jessica Jeffers, Doron Levit, Lily Yuanzhi Li, Adair Morse, David Musto, Tracy Yue Wang, Simona Yost, and seminar participants at the Cheung Kong Graduate School of Business, Nanyang Technological University, Tsinghua University, University of Pennsylvania, the Drexel Academic Conference on Corporate Governance, and Northern Finance Association Annual Meetings. We thank our team of dedicated research assistants including Christie Baugh, Daniel Sampieri, and Erin Shin for their excellent work. We acknowledge the Queen’s School of Business research program for their financial support. All errors are our own. 2 Stephen J.R. Smith School of Business, Queen’s University, tel: (613) 533-6249, email: [email protected]. 3 Stephen J.R. Smith School of Business, Queen’s University and Hong Kong University of Science and Technology, tel: (613) 533 3248 or (852) 23587661, email: [email protected] or [email protected]. 4 Stephen J.R. Smith School of Business, Queen’s University, tel: (613) 533 3275, email: [email protected].

Catch Me If You Can:
Financial Misconduct around Corporate Headquarters Relocations
First Version: May 2015 This Version: February, 2016
Abstract
We examine whether firms relocate to avoid the scrutiny of local Security and Exchange Commission (SEC) enforcement offices and find that financial misreporting activities are positively associated with the probability of headquarters being relocated out of the jurisdiction states of local SEC office. Firms whose financial statements suggest fraudulent activities are more likely to move to locations where the regional SEC office has a history of less intense scrutiny against local firms, and they tend to relocate without providing explicit reasons. Using shocks to SEC enforcement intensity for identification, we find that these firms are more likely to relocate after the shock. Our difference-in-difference tests further suggest that relocating firms with scrutiny avoidance as a motive exhibit higher fraud scores after relocation and are more likely to file earnings restatements than their matched peers. Our results provide new evidence on the fraudulent motives for headquarters relocation, and suggest that the intensity of SEC enforcement affects corporate strategies. Keywords: Headquarters Relocation; Enforcement; Regulation; SEC; Misreporting; Fraud; Earnings Management; Litigation; Geographic Proximity. JEL classification: G34, G38, M48

1
I. Introduction
Regulatory enforcement intensity creates disutility for corporate managers, especially those
who have been engaging in financial misconduct. Prior studies document that uncovered
misconduct imposes tremendous costs on a firm, management, and its board of directors
(Srinivasan, 2005; Desai, Hogan, and Wilkins, 2006; Fich and Shivdasani, 2007; Karpoff, Lee, and
Martin, 2008a, 2008b). Severe penalties on misconduct can impact manager behavior in two
possible ways: first, managers may refrain from fraudulent behavior, which is the ideal response in
the interest of shareholders and regulators; second, managers may continue to engage in
misconduct, while making it harder for external monitors to uncover. We are interested in the latter
response. We posit that if managers of a given firm are in the midst of financial misreporting
activities, but they have not yet been pursued by regulators, the incentives are high for them to
continue the misconduct while evading scrutiny. One potential venue through which to achieve this
objective is to relocate corporate headquarters to a different jurisdiction state.
Enforcement avoidance actions through relocation are plausible, but only if there are
frictions associated with regulatory enforcements. Such frictions can arise from two sources. Firstly,
enforcement actions are mostly conducted by the regional offices of the Securities and Exchange
Commission (SEC), which oversees a firm’s jurisdiction states (Kedia and Rajgopal, 2011). The
cross-sectional variation in enforcement intensity across regional offices provides opportunities for
firms to avoid scrutiny through relocation. Secondly, enforcement is costly and regulators are
constrained by their budget and staffing resources (Jackson and Roe, 2009). SEC regional offices
need to strike a balance between their resource constraints and enforcement activities. Headquarters
relocation disrupts the equilibrium of enforcement resources allocation, resulting in increased costs
for regulators to investigate fraudulent activities. This disruption can thus create an opportunity for
firms to alter the likelihood with which they get caught by regulators. Thus, scrutiny avoidance may

2
motivate those firms committing financial misconduct to relocate. The main agenda of this paper is
to examine whether fraudulent firms tend to relocate to avoid the scrutiny of local SEC enforcement
offices and to study the consequences of such relocations.
Using the corporate headquarters location of all Compustat firms from 1994–2012, we find
that headquarters relocations that move out of the jurisdiction states of the local SEC office are
positively associated with financial misreporting and earnings manipulation, after controlling for
covariates that are shown to affect firm relocations for economic reasons. A one standard deviation
change in a firm’s fraud score, a measure of the ex-ante likelihood of financial fraud developed by
Dechow, Ge, Larson, and Sloan (2011), is associated with a 20% higher likelihood of relocating
headquarters to another SEC jurisdiction state in the following year. Similarly, misreported (and
later restated) earnings are associated with a 26% higher likelihood of relocation to a different SEC
jurisdiction state. Our findings are robust to the inclusion of high dimensional fixed effects based on
year, industry, and state to account for possible omitted variables. We further find that firms whose
financial statements suggest fraudulent activities tend to move into SEC jurisdiction states with
histories of weak enforcement, consistent with the notion that such firms relocate headquarters to
avoid intense scrutiny by local SEC offices. Moreover, we find that these firms are less likely to
disclose reasons for relocation in their SEC filings.
Our evidence suggests a strong association between financial misreporting and subsequent
headquarters relocation, yet the endogeneity of both financial reporting and the relocation decision
may limit our ability to draw causal inferences. To isolate enforcement avoidance as the motive for
fraudulent firms’ decisions to relocate, we identify exogenous variations (i.e., shocks) to local SEC
scrutiny and examine the relocations that follow. We use two settings as potential sources of
exogenous shocks to the scrutiny intensity of the local SEC office. The first is a large increase in
recent enforcement actions in the local SEC jurisdiction; the second is the arrival of a new external

3
director at a regional SEC office with a weak enforcement history. These shocks may be due to a
change in budgetary and resource allocation, or to a change in the productivity or attitude of local
SEC enforcement officers, neither of which is directly observed. They are exogenous to a firm’s
tendency to relocate out of the region.
If firms relocate due to considerations of enforcement avoidance, we should observe that
firms with higher likelihoods of fraud tend to relocate in response to the SEC enforcement shocks.
Interacting measures of financial misconduct and the shock indicator, we find that following an
enforcement shock a firm is 0.5% more likely to relocate given a one standard deviation increase in
fraud score, representing a 33% relative increase in the likelihood of relocation. The evidence
supports the notion that scrutiny avoidance is an important motivation for corporate headquarters
relocations, especially among fraudulent firms. Our finding that firms tend to relocate after
observing the enforcement shocks further suggests that, even though the regulatory body cannot
catch all fraudsters, SEC enforcements can have a deterrent effect that alters firm behavior.
To shed light on the effectiveness of headquarters relocations in avoiding SEC scrutiny, we
then examine the changes in firms’ financial reporting behavior after relocation. If firms relocate to
avoid scrutiny as one motivation, one must wonder if such a strategy successfully enables relocated
firms to keep engaging in financial misreporting while avoiding the radar of the regulators. Using a
difference-in-differences design with a propensity score-matched sample, we find that following
relocations, the likelihood of financial misreporting increases in firms that relocate to a different
SEC jurisdiction (i.e., treated) when compared to the matched sample of firms that do not (i.e.,
control), and that the treated firms are more likely to restate their financial statements, prepared in
earlier years, after relocation. However, the treated firms are not more likely to get caught by either
regulators or shareholders when compared to the matched sample. We find these effects to be
strongest among firms that move to areas with weak local SEC enforcement and firms that move
4
into a nearby location that is under the jurisdiction of another SEC office. In contrast, we do not
find such evidence for within-SEC office relocations.
Finally, we perform an event study around the announcements of headquarters relocations.
For a subsample of firms that relocate between 1998 and 2005, and for which we are able to identify
the announcement dates, we run regressions of stock reactions to relocation announcements on
various measures of financial misconduct. Our results show a strong negative association between
market reactions and financial misconduct measures, albeit there are overall positive market
reactions surrounding relocation announcements.
Our research contributes to the literature on corporate misconduct and financial regulation in
three ways. First, our research unveils an opportunistic strategy, which firms committing financial
misconduct can undertake to reduce the likelihood of getting caught by regulators. Prior studies
document the economic and reputational penalties imposed on firms engaged in financial fraud. We
take it one step further and pose the question of whether firms develop strategies to evade scrutiny
and avoid such penalties. We find that headquarters relocation, a corporate decision that the prior
literature views as being driven by corporate need and regulation changes can, in fact, be motivated
by financial fraud and scrutiny avoidance.
Second, our findings suggest that regulatory enforcement has a real effect on corporate
decisions. Building on the emerging literature on the effect of regulatory bodies (e.g., Kedia and
Rajgopal, 2011; Yu and Yu, 2011; Del Guercio, Odders-White, and Ready, 2014), we find that SEC
enforcement matters; specifically, local SEC office leniency toward fraud investigation and
enforcement has a direct impact on a firm’s tendency to relocate. Our evidence suggests that
homogeneity in enforcement intensity across SEC regional offices would limit the effectiveness of
headquarters relocations in avoiding SEC scrutiny; it also renders support for a nuanced view of

5
centralizing enforcement decisions (in addition to delegating investigations to the individual local
offices), as reflected by recent SEC efforts. However, the gains of centralized enforcement must be
weighed against the potential costs of limiting local information collection from the regional
offices.
Third, our research highlights the potential hidden cost of headquarters relocation:
suppressed external monitoring mechanisms and, in turn, a higher likelihood of corporate
misconduct. The insights of our research will be of interest not only to academic researchers in
finance and accounting, but also to regulators and practitioners. Bringing attention to the hidden
cost of relocation can help regulators and other external monitors deter opportunistic relocations.
This research can also aid budget-constrained regulators by helping them allocate resources toward
firms that are most likely to commit fraud.
The rest of the paper is organized as follows. Section II describes the background on SEC
enforcement. Section III describes the data and presents an overview of the sample. Section IV
presents the specification of our empirical model and Section V shows the empirical results. Section
VI concludes the paper.
II. Background on SEC Enforcement
GAO reports (2006 and 2007) provide a comprehensive overview of the SEC enforcement
process.1 This process starts with initial leads obtained by the Enforcement Division staff through
SEC surveillance activities (e.g., filings review conducted by the Division of Corporate Finance at
1 See “Report to the Ranking Minority Member, Committee on Banking, Housing, and Urban Affairs, U.S. Senate – Financial Restatements Update on Public Company Trends, Market Impacts, and Regulatory Enforcement Activities” (GAO-06-678, 2006), and “Report to the Banking Member Committee on Finance, U.S. Senate – Securities and Exchange Commission Additional Actions Needed to Ensure Planned Improvements Address Limitations in Enforcement Division Operations” (GAO-07-830, 2007).

6
the SEC Washington D.C. home office2), self-regulatory organizations, investor tips, media reports,
and other whistleblowers. An informal inquiry is then conducted to determine whether the evidence
merits an investigation. Promising leads may directly result in a formal investigation. Once an
investigation starts, enforcement staff will review records and interview witnesses. After collecting
sufficient evidence and assessing the seriousness of the wrongdoing, enforcement staff will
determine whether they should recommend that the SEC authorize civil and/or administrative
enforcement actions. Most enforcement actions are settled, with respondents generally consenting to
the entry of civil judicial or administrative orders without admitting to or denying the allegations
against them rather than going through legal proceedings.3
SEC enforcement is not without frictions, which are twofold. The first is that SEC
enforcement actions are local. As budgetary restrictions limit the ability of SEC enforcement staff to
travel and operate outside their jurisdiction, the geographic nexus is regarded as the most important
consideration for SEC investigation and enforcement actions4. Investigations are typically handled
2 Blackburne (2014) studies the relationship between regulatory oversight and corporate reporting incentives, using budgetary resources allocated to the Division of Corporate Finance as a source of variation. The division is responsible for overseeing compliance with corporate disclosure regulations, but it does not conduct enforcement actions. 3 According to the GAO report (GAO-06-678, 2006), “Depending on the type of proceedings, SEC can seek sanctions that include injunctions, civil money penalties, disgorgement, cease-and-desist orders, suspensions of registration, bars from appearing before the Commission, and officer and director bars. After an investigation is completed, SEC may institute either type of proceeding against a person or entity that it believes has violated federal securities laws. Because SEC has only civil enforcement authority, it may also refer appropriate cases to the Department of Justice (DOJ) for criminal investigation and prosecution. According to SEC, most enforcement actions are settled, with respondents generally consenting to the entry of civil judicial or administrative orders without admitting or denying the allegations against them.” 4 For example, according to a law article discussing the role of the SEC enforcement division, “Given the budgetary restrictions under which the Enforcement Division staff has had to operate, and the need to avoid travel costs where at all possible, the division has reinforced the importance of a geographic nexus to the region...” (see “The Role of Regional Offices in the SEC FCPA Unit”, Law 360, New York, September 30, 2011). The SEC adopted a centralized approach for enforcement approval in 2007. Before 2007, directors at either the home or the 11 regional offices had the ability to approve an investigation. Starting in 2007, the SEC adopted a centralized approach where two deputy directors at the SEC home office were to review and approve all newly opened inquiries and investigations to ensure the appropriateness of resource allocation considerations and whether an inquiry should be pursued (GAO-07-830). Regardless of the decentralized or centralized approach, the actual investigations are mostly conducted by staff attorneys at regional offices. Our empirical results stay quantitatively the same if we remove observations after 2007.

7
by local enforcement staff at the SEC regional office overseeing the jurisdiction state in which the
company is headquartered.5
Anecdotes from a number of sources support this notion. First, the SEC, at the conclusion of
an investigation, issues enforcement releases that disclose the names of the enforcement staff
conducting the investigation. Our reading of such releases reveals that the enforcement staff
members who are listed are usually located in the regional office where the company is
headquartered. Further, upon the departure of a regional director, the SEC issues news releases that
summarize the achievements of the leaving director during his/her tenure. These releases indicate
that the local regional offices are the driving force for enforcement actions.6 Consistent with this
notion, Kedia and Rajgopal (2011) find that among firms that announce earnings restatements, the
SEC is more likely to investigate those that are in closer proximity.
The second friction is that the regulatory body faces constraints in terms of budgetary and
staffing resources (Jackson and Roe, 2009; Kedia and Rajgopal, 2011). Enforcement actions are
costly. A formal investigation can be a prolonged process, which involves collecting evidence,
interviewing witnesses, and examining records, among other activities. Due to budget and staffing
constraints, the SEC has to weigh costs against potential benefits when it targets firms for
5 The 11 SEC regional offices are Atlanta, Boston, Chicago, Denver, Fort Worth, Los Angeles, Miami, New York, Philadelphia, Salt Lake, and San Francisco, overseeing all 50 states, Washington D.C., Guam, and Puerto Rico (see Appendix Table 2 for a list of regional offices and their states of jurisdiction). Seven offices were upgraded from district offices to regional offices in 2007. The upgrades allowed these offices to report directly to the SEC office in Washington D.C. However, their states of jurisdiction remained hardly changed after the upgrades. 6 For example, at the departure of Rose Romero, Director of the SEC’s Fort Worth Regional Office, the release has stated that “under Ms. Romero’s leadership, the Fort Worth office brought highly significant cases … including… accounting and corporate reporting cases such as the case against New Orleans-based hurricane restoration company Home Solutions of America Inc. and seven of its executives for recording and reporting more than $40 million in improper revenue through an expense deferral scheme, and the $10 million case against the CEO and CFO at Oklahoma-based Quest Resources – which led to the officers’ criminal convictions and sanctions against three of the company’s auditors.”

8
enforcement actions. As a result, many firms that manipulate earnings can go unidentified or
unpursued.7
We posit that these two frictions allow headquarters relocation to alter the likelihood of
firms getting caught by the SEC. First, the SEC regional offices are not uniform in their scrutiny
strength. The cross-sectional variation in enforcement strength creates an opportunity for firms to
escape from the radar of tough regulators. Second, relocations disrupt the enforcement equilibrium
in the local offices. The regional office that oversees the new location will need to reallocate its
budget to initiate an investigation against a relocated firm. In addition, relocations entail many
changes that can increase the costs for regulators to investigate fraudulent activities. For example,
the turnover of employees can make finding and interviewing a witness more difficult.
These frictions may have been mitigated by some new processes the SEC adopted, but not
until recently. As of 2013, the SEC has started to adopt a centralized process in reviewing and
approving enforcement actions by setting up a special unit – the Financial Reporting and Audit Task
Force – within the Enforcement Division. This division contains a small group of experienced
attorneys and accountants charged with developing cutting-edge tools to better identify financial
fraud, and incubating cases to be handled by other groups. The Task Force monitors high-risk areas,
analyzes industry performance trends, and reviews restatements, revisions, and class action filings,
as well as academic research. It also works on the SEC’s Accounting Quality Model, which was
7 Enforcement by shareholders through class action lawsuits may be an alternative mechanism. However, shareholders’ collective actions and lawsuits are costly too, and they face coordination problems. Many of the cases brought against firms by shareholders do not have enough merit and go unsettled as a result. In fact, the class action lawsuits data we collect from the Stanford Law School Securities Class Action Clearinghouse shows that about 50% of the closed suits were dismissed.

9
developed to use data analytics to assess the degree to which a company’s financial reporting
appears to be noticeably different from its peers.8
III. Data and Sample Overview
A. Data Sources and Variable Construction
A1. Corporate Headquarters Relocations
We write Web-crawling algorithms that collect the annual corporate headquarters locations,
including state and ZIP code, from company 10-Ks filed with the SEC through Edgar for the
Compustat universe of firms from 1994–2012. Using the location information collected, we identify
headquarters relocations and the fiscal year in which they took place. Next, we manually examine
SEC filings (10-Ks) around the year of the relocations to verify them.9 We read through SEC filings
(10-Ks and 8-Ks) and news archives around the headquarters relocations and record the reasons
disclosed for the move. Relocations are then classified into a number of unique categories based on
the reasons stated by firms, including business expansion, cost savings, change of stakeholders, and
other reasons, following prior literature.10 We identify whether the relocation is out-of-state and/or
out-of-metropolitan-statistical-area (MSA), and out-of-SEC-jurisdiction. Our main analyses focus
on out-of-SEC-jurisdiction relocations.
A2. Financial Misconduct and Aggressive Accounting
To identify SEC enforcement actions, we obtain Accounting and Auditing Enforcement
Releases (AAERs) from the Center for Financial Reporting and Management at the Haas School of
Business, UC Berkeley. AAERs are issued by the SEC during or at the conclusion of an
8 See “Stay informed: 2014 SEC comment letter trends”, by PWC, December 2014. 9 For some firms, the business address and the headquarters address can be different, and it is possible that our Web crawling picks up the former rather than the latter. Our manual examination of the 10-K filings eliminates such concern. 10 The coding of reasons for relocations was primarily conducted by two research assistants – now auditors at two of the big four accounting firms – under the supervision of the authors of this paper. At times, a firm may indicate multiple reasons for relocation, which are projected to different categories of our classification.

10
investigation against a company, an auditor, or an officer for alleged accounting and/or auditing
misconduct. 11 The dataset contains a list of annual or quarterly financial statements that were
restated and later investigated by the SEC. In order to capture the time of the SEC’s enforcement
actions, we add two years to the fiscal years of the financial statements, as it takes an average of
about two years for frauds to emerge (Dyck, Morse, and Zingales, 2010).
To identify shareholder litigation on corporate misconduct, we use securities class action
lawsuits collected from the Stanford Law School Securities Class Action Clearinghouse, an online
database of all securities class actions filed in the U.S. Federal Court since the passage of the
Private Securities Litigation Reform Act (PSLRA) of 1995.12 Compared to AAERs, this measure
covers a broader range of misbehaviors including, but not limited to, financial misreporting. Class
Actions is an indicator variable that takes on the value of one for fiscal years coinciding with the
year when securities class action lawsuits are filed. These first two measures capture financial
misconduct, which is identified by either regulators or shareholders.
We use Fraud Score, calculated using the misstatement prediction model and coefficient
estimates of Dechow et al. (2011) to capture the ex-ante likelihood of financial misreporting. The
dependent variable in their model takes the value of one if the financial statement of a certain fiscal
year/quarter is restated and later investigated by the regulator; therefore, the predicted value fraud
score measures the likelihood of misreporting (see Appendix A for a detailed description of the
estimation of Fraud Score). We further define a dummy variable for whether the fraud score is
11 Using AAERs has several advantages relative to other potential data sources. First, the use of AAERs as a proxy for manipulation avoids potential biases introduced into samples by researchers’ individual classification schemes, and it can be easily replicated by other researchers. Second, AAERs are also likely to capture a group of economically significant manipulations, as the SEC has limited resources and likely pursues the most important cases. AAERs have been used in the accounting literature to study accounting misstatements and frauds (e.g., Dechow et al. 2011). 12 This database was employed in a number of prior studies to measure litigation risks (e.g., Field, Lowry, and Shu 2005; Dyck, et al., 2010).
11
above the sample median (high fraud score dummy) to better capture the discrete effect of fraud
score, and to easily interpret the economic magnitude.
Further, following prior studies, we use restatement of accounting earnings as another
indicator of financial misreporting (e.g., Burns and Kedia, 2006; Desai, Hogan, and Wilkins, 2006;
Efendi, Srivastava, and Swanson, 2007). We collect information on restating firms, the filing date of
restatement, and the fiscal period of restated earnings from Audit Analytics for fiscal years after
1997. The indicator variable Restatement_Class is set to one if financial statements pertaining to
that fiscal year are later restated, and zero otherwise. The indicator variable Restatement_File is set
to one for years when restatements are filed, and zero elsewhere.
We use the level of discretionary accrual to measure aggressive earnings management
following prior literature (e.g., Jones, 1991; Dechow, Sloan, and Sweeney 1995; Bergstresser and
Philippon, 2006). We first calculate total accruals as the difference between net income and cash
flow from operations, deflated by total assets. We then follow a modified Jones’ (1991) model to
tease out the component of accruals that is beyond the control of the managers. Specifically, total
accruals are regressed on the change in sales less the change in receivables and gross property plant
and equipment, both scaled by total assets. The residual is referred to as discretionary accruals. We
use the absolute value of discretionary accruals (unsigned) to capture earnings smoothing – i.e., the
upward or downward management of earnings to create a smooth pattern over time.13
A3. Firm-Level Explanatory Variables for Relocations
13 Alternatively, we use a refined measure of the discretionary accruals following Kothari, Leone, and Wasley (2005) to control for the effect of performance on accruals. We match firms based on return on assets and calculate performance-matched discretionary accruals. Specifically, we find three matches for each firm in the same fiscal year and industry with the closest ROA; performance-matched discretionary accrual is then calculated as the difference between the firm’s discretionary accrual (our primary measure) and the average of three match firms’ discretionary accrual. Using this alternative measure of earnings management does not materially change our empirical results. The results are available from the authors upon request.

12
Following prior economic geography literature, we construct a few firm-level measures to
capture economic considerations that can explain headquarters relocation, such as business
expansion, cost savings, and proximity to human capital and services.14
Firms with poor operating performance have strong incentives to pursue cost cuts through
headquarters relocation. Operating performance (ROA) is measured as operation profits scaled by
book assets. We use sales growth (sales from the current year divided by the average of sales from
last three years) and market-to-book (the ratio of market value of assets, which is the sum of all
issue-level market values, including trading and non-trading issues, to book assets) to capture the
growth motives for headquarters relocations. Firms with weak sales growth and low market
valuations would likely consider corporate relocation as a strategy to gain access to new markets
and business expansion. Further, a firm must weigh the benefits of relocation against the costs to
determine whether headquarters relocation is value enhancing. We further consider firm size
(measured as the natural logarithm of sales),15 age (measured as the years since the firm first
appeared in the Compustat database),16 and industry cluster (measured as the number of firms in the
same two-digit Standard Industrial Classification (SIC) industries located within the same MSA) as
proxies for the costs associated with the move.
14 See Calluzzo, Wang, and Wu (2016) for a comprehensive discussion of the economic factors behind headquarters relocations. 15 It is plausible to argue that relocation costs are correlated with firm size; large firms can incur more costs when moving than small firms. Relocations by large firms also tend to catch public attention, creating disincentives for firms in the midst of fraudulent activities. On the other hand, relocations may be more disruptive for small firms, as they tend to have stronger local stakeholder presence and social ties than large firms (see Coval and Moskowitz 1999; Petersen and Rajan 2002). Therefore, small firms are more likely to experience disruptions to business continuity after relocations. It is not clear whether small firms, on average, are more likely to relocate than large ones. 16 Old firms build strong social ties with the local community. Relocation can be more disruptive to these firms than to young firms. Prior studies suggest that industry geographic clustering and agglomeration bring benefits to firms. Clustered location is often due to industry specialization (e.g., energy firms tend to locate close to oil reserves, while car manufacturing firms tend to move closer to natural resources and cheap labor), thus the loss of clustering benefits can serve as another potential cost associated with firm relocation.

13
Firm-level financial data and data required to construct these measures are obtained from
Compustat. Stock prices and returns are obtained from the Center for Research in Security Prices
(CRSP). All financial variables are defined in Appendix Table 1.
A4. SEC Regional Offices
There are 11 SEC regional offices covering the entire United States. We collect information
on these offices from the SEC Website (http://www.sec.gov/contact/addresses.htm), including their
location and the jurisdiction states covered by each. Appendix Table 2 lists the states of jurisdiction
for each regional office, along with the geographic area and number of Compustat firms for which
they are responsible. The Chicago office has the most responsibility in terms of the number of states
covered, while the San Francisco office has the largest coverage in terms of area and number of
firms.
We identify the names of the regional office directors from 1995–2012. For each director,
we collect their full biographies prior to joining the office as the director. Appendix Table 3 shows a
full list of directors at the 11 regional SEC offices during our study.17
B. Sample Overview
Table 1 presents the annual frequency of corporate headquarters relocations from 1995–
2012. On average, in a given year, 1.61% of firms move their headquarters to a different state, and
1.83% of firms move to another MSA. Together, 1.47% of firms move to a different MSA that is in
another state and 1.97% of firms move to either another MSA or another state. Conditional on out-
of-state or MSA relocations, more than 70% of relocations are made into another SEC jurisdiction
17 Their full biographies are not listed in this table, but they may be requested from the authors.

14
state, while the rest are relocations within SEC jurisdiction states.18 The primary focus of our
analyses will be the 1.42% relocations out of the SEC jurisdiction states. In terms of relocation
frequency (untabulated), 1,145 firms relocated only once, while 216 firms relocated more than once
during our sample period.
Figures 1A and 1B depict the trend of headquarters relocations over the past two decades,
benchmarked with the change in SEC budget (in 2009 dollars and the ratio of total market
capitalization, respectively) in the same window (see Kedia and Rajgopal, 2011). The SEC’s budget
substantially increased after the Sarbanes-Oxley Act of 2002. In particular, the enforcement staff
increased by 25% from 1,012 in 2002 to 1,283 in 2007 (GAO-07-830). The number of investigative
attorneys in enforcement also increased substantially from 596 in 2002 to 740 in 2005.
Interestingly, the figures consistently show that the incidences of relocations out of SEC jurisdiction
states change in the opposite direction to the SEC budget, while relocations that are within SEC
jurisdiction states stay rather stable at around 0.5%. The number of relocations peaked between
1997 and 2001, and it then started to descend after 2002, when the Sarbanes-Oxley Act was enacted
and the SEC’s budget took off. Furthermore, the frequency of relocations experiences a sharp
decline after 2007, which coincides with the SEC’s adoption of a more centralized approach in
detecting fraud and initiating enforcement actions. This pattern seems to be consistent with our
premise that some relocations may be associated with scrutiny avoidance motives and are thus
discouraged when such motives become harder to achieve.
IV. Methodology
18 For example, a relocation of headquarters from Georgia to Florida is considered an out-of-SEC relocation, as the SEC office that is in charge of enforcements changes from Atlanta to Miami, while a relocation from Georgia to Alabama is considered an out-of-state/MSA but within SEC relocation, although the distance of the relocation may be similar.

15
To establish the association between the probability of headquarters relocation and potential
fraudulent activities, we first develop a panel logit regression model that estimates the probability
with which a firm relocates its headquarters to another SEC jurisdiction state. Our variables of
interest are the ex-ante measures on financial misreporting, measures of aggressive earnings
management, and the indicator of misreported financial statements that are later restated. The
deterministic model builds an association between fraudulent behavior and the likelihood of
headquarters relocations away from the local SEC regional office, and it takes the following form:
(1) otherwise if 0 and 0; if 1
,*,,
1,1,*,
=>=
++++++= −−
tititi
itsindttitiiti
MoveMoveMove
XMisconductMove eµµµγβa
where Move is an indicator variable for headquarters relocation; Move* is a latent variable;
Misconduct captures various measures on potential financial misconduct; ,tiX is a vector of control
variables motivated by the economic geography literature; tµ , indµ , and sµ are a set of year,
industry, and state fixed effects; and ite is a stochastic error term. The various fixed effects intend
to capture unobserved heterogeneity across time, industry, and state (Gormley and Matsa, 2014). In
view that a non-linear model with a large number of fixed effects may produce biased estimates due
to the incidental parameter problem (Lancaster, 2000), we adopt linear probability (OLS) models
with high dimensional fixed effects based on the interactions of year and industry, and year and
state. The high dimensional fixed effects control for unobservable time-varying factors that are
industry and region specific, such as industry-wide and local economic conditions.
Relocation likely takes place along with a series of other changes, such as adopting new
business strategies and financial policies, to boost revenue and cut costs, and to adapt to new
industry trends and local economic development. Financial reporting practices thus may have

16
changed with the simultaneous change of these fundamentals factors. We include a long list of
controls and fixed effects in Equation (1) to address the concerns that omitted variables drive both
financial reporting and relocation decisions.
To further address the endogeneity concern, we exploit exogenous variations in the scrutiny
intensity of the SEC regional offices. Specifically, we identify settings with positive exogenous
shocks to SEC enforcement intensity; if a firm’s decision to relocate to another SEC jurisdiction
state is independent of scrutiny avoidance, we would not observe changes in the probability of
relocations upon the shock; however, if scrutiny avoidance is an important motive, we would
observe that firms with fraudulent activities are more likely to move away from the SEC office after
the shock. Therefore, using enforcement shocks, we are able to identify the causal effects of
financial misconduct and scrutiny avoidance on a firm’s decision to relocate. Our linear probability
model takes on the follow form:
(2)
1,1,1,1,,
Sit
St
Ss
St
SInd
tiS
titiS
tiSS
iti XShockMisconductMisconductMove
eµµµµ
γλβa
+∗+∗+
+∗++= −−−−
We are interested in whether the coefficient for the interaction term, Sλ , is positive and statistically
significant.19
We identify two shock settings. The first occurs when there is a significant increase in the
number of AAERs brought by the SEC regional office, serving as an ex-post measure of elevated
SEC enforcement actions. Each year, we calculate the enforcement rate (i.e., the number of AAERs
scaled by the number of firms in the region) of every regional office over a rolling three-year
window (t–3 to t–1) and compare it to the enforcement rate in year t. We then sort the offices each
year and identify the two regional offices with the largest increases in enforcement rates; these two
19 The Shock variable does not appear in the equation, as it is defined at the state and year level and is thus absorbed by the interacted fixed effects.

17
offices are classified as offices with enforcement shocks. This exogenous shock may result from
budgetary and resource allocations that affect regulators’ constraints, and/or from changes in the
productivity of SEC enforcement officers.20 Regardless of the source of the variation, the SEC
enforcement shocks are exogenous to a firm’s tendency to relocate. 21 Further, to alleviate the
concern that intensified SEC enforcement may relate to a sudden rise in firms’ tendencies to commit
fraud in a given geographic region, we compare the average fraud score of firms located in the
shock state with its enforcement rate and do not find a statistically significant relationship between
the two.
Our second shock setting relies on the observation that the SEC regional office appoints a
new external director to replace a “weak” incumbent; this setting serves as an ex-ante indicator of
intensified scrutiny in the sense that the director turnover predicts heightened enforcement intensity
in the future. Specifically, if the regional office’s enforcement activities fall in the bottom half
among all offices in the three years prior to the turnover, and a new director is brought from another
SEC office, we treat the director turnover as a positive enforcement shock.22
Finally, we examine whether firms that relocate their headquarters away from the local SEC
office (Treat=1) tend to conduct more financial frauds after relocation without increasing the
chance of getting caught. For each firm that relocates headquarters (i.e., treated firms) we draw one
20 Unfortunately, the SEC does not publish its budget for each regional enforcement office. Here is the link to the 2015 budget: http://www.sec.gov/about/reports/secfy15congbudgjust.pdf. It provides useful information on the organization of the SEC. 21 It is possible that the SEC enforcement shock may coincide with local business condition changes that, in turn, drive the probability of relocation. This should not be a major concern given that we control for dimensional fixed effects based on year, state, and industry. Nonetheless, to mitigate this concern, we examine whether the state that receives an enforcement shock also experiences an economic shock by comparing the GDP growth rate in the year when the enforcement shock is observed, as well as the average GDP growth rate in the three years prior. We find no statistical significance. 22 We do not treat the appointment of a new director hired directly from the industry (e.g., law firms) as a positive shock because they are expected to lack enforcement experience. Additionally, our results are stronger if we focus on a subset of new directors with an enforcement background, or who are hired from another SEC office that has intense enforcement actions in the past three years. However, the number of shocks fitting this criterion is very small.

18
matched non-mover firm within the same SEC regional jurisdiction, in the same year of the
relocation, and with the closest propensity to relocate, estimated based on Equation (1).23 We then
perform a standard difference-in-difference test (Bertrand, Duflo, and Mullainathan, 2004), where
Post is an indicator that has a value of one for three years after relocation, and zero for three years
prior (with the year of relocation tossed out):
(3) 3210 itstatetiitiitit TreatPostTreatPosty eµµaaaa ++++++=
The coefficient estimate of interest is 3a , which indicates whether a firm that relocates is more
likely to conduct fraud after moving when compared to a control firm.
V. Empirical Results
A. Financial Misreporting and Headquarters Relocations
Table 2 reports the regressions that predict headquarters relocations with motives associated
with financial misreporting. The dependent variable is an indicator set to one if a firm relocates its
headquarters to a different SEC jurisdiction in a given year, and zero otherwise. The main variables
of interest are the proxies for financial misreporting, including fraud score (both continuous
measure and binary measure), the restatement indicator (i.e., an indicator for the fiscal year of the
misreported financial statement, not for the year when restatement is filed), and abnormal accruals;
each is investigated separately due to correlations among the measures. Panel A presents the results
of coefficient estimates using logit regressions, while Panel B presents results using high-
dimensional fixed effects ordinary least squares (OLS) regressions.
23 Stuart (2011) discusses the merits of exact matching when dealing with particularly important covariates and recommends combining a propensity score matching with exact matching. By exact matching on year and SEC regional jurisdiction, we are able to directly compare the fraudulent behavior of firms that experience an enforcement shock and relocate to a set of control firms that do not move. Our results stay invariant using other matching approaches, such as exact matching on size quintile and fraud score quintile, or exact year and propensity matching. Furthermore, our results are robust to drawing the three closest matches instead.

19
As seen from Panel A of Table 2, all financial reporting measures are positively related to
the likelihood of headquarters relocation. In particular, the coefficient of estimate is 0.39 on the
natural logarithm of fraud score (with marginal effects at 0.0049), 0.24 on the high-fraud dummy
(with the marginal effect at 0.0029), 0.32 on the restatement indicator (with the marginal effect at
0.0037), and 0.22 on abnormal accruals (with the marginal effect at 0.0028). Put into perspective,
with a one standard deviation increase in the logarithm of fraud score (0.36), the likelihood of
headquarters relocation increases by 0.18%. Firms with high fraud scores are 0.29% more likely to
relocate out of SEC office than firms with low fraud scores. A change in the Restatement_Class
dummy is associated with a 0.37% higher likelihood of relocation. A one standard deviation change
in abnormal accruals translates into a 0.12% increase in the probability of headquarters relocations,
respectively. The economic magnitude of the change is large, given that the unconditional
probability of moving out of SEC jurisdiction states is only 1.42%. Moreover, it seems that the
more severe type of potential financial misreporting matters more to the probability of relocation.
Panel B presents the results of the OLS regressions with high dimensional fixed effects. They are
qualitatively the same as those in Panel A of Table 2.
To provide further evidence, in Table 3 we perform multinomial logit regressions on the
probabilities of relocating outside SEC jurisdiction state versus relocating out-of-state/MSA but
within SEC jurisdiction state. The dependent variable takes on three outcomes: moving to a
state/MSA that is supervised by a different SEC office, moving to a state/MSA that is under the
same SEC jurisdiction, and no relocation. Our results show a clear contrast between the within-SEC
and outside-SEC relocations in that the measures of financial misconduct and aggressive accounting
hardly explain the probability of relocations within SEC jurisdiction states, while they are strongly
(both statistically and economically) associated with the probability of moving out of SEC
jurisdiction states.

20
Taken together, the results support the idea that firms whose financial statements suggest
fraudulent activities are more likely to relocate their headquarters out of the justification state of the
local SEC office. Specifically, after controlling for economic characteristics, firms with higher ex-
ante likelihood of financial fraud, with misreported earnings that are later restated, and with
heightened abnormal accruals are more likely to move.24
B. Destination and the Nature of Relocations
If regulatory scrutiny by the local SEC office is indeed a major concern for firms that
relocate their headquarters, we should see that firms engaged in fraudulent activities tend to move to
a jurisdiction where the regional SEC office undertakes fewer enforcement actions. To construct a
measure of the intensity of enforcement actions by each regional SEC office, we count the number
of AAERs in each year by the SEC office and scale it by the number of firms in the jurisdiction
states. Next, we calculate the difference in the scaled number of AAERs brought by the regional
SEC office between the new and the old location in the three-year window before the headquarters
relocations, and identify whether or not the firm moved into an area with less enforcement intensity.
Table 4 presents multinomial logit regressions with the dependent variable taking on three
outcomes: moving to a location with less SEC enforcement, moving to a region with more SEC
enforcement, and no relocation. The explanatory variables are the same as those in previous tables,
plus the year, industry, and state-level controls. Our estimation results show that the coefficient
estimates for fraud score, restatements, and abnormal accruals are larger and more statistically
significant for relocations into geographic areas with fewer enforcement actions. These results
suggest that firms that potentially engaged in financial misreporting not only tend to move, but they
24 In untabulated results, we use three-year averages of all measures on financial misreporting and earnings management in all our regressions, instead of using the fiscal year right before the headquarters relocation, and find our results remain unchanged.

21
are more likely to relocate to regions with lower SEC enforcement intensity, rendering further
support for the notion that scrutiny avoidance can motivate firms to relocate in the midst of
financial misreporting.
One potential concern with our measure of enforcement intensity is that it may capture the
quality of firms located in the SEC regional office’s jurisdiction rather than the scrutiny intensity of
the SEC office. Suppose that all SEC offices exert the same level of effort in catching financial
fraud. The ratio of AAERs to firms would be higher for those states containing more fraudulent
firms. To address this concern, we aggregate our data at the SEC Office-year level, and compute the
percentage of firms within each region and year that are the target of AAERs. We then test the
correlation of this percentage with the mean fraud score of all firms in each region and find no
significant relation between the two. Furthermore, we compare the average fraud scores of firms
located in the state that a firm moves out of with that of firms in the state it moves into. The average
F-score of all firms at the old location (i.e., the state a firm moves out of) is 1.090 and the average
F-score of all firms at the new location is 1.089. This difference is not statistically significant.
We then exploit the firm’s disclosure of relocation reasons to obtain more cross-sectional
evidence. Firms state various reasons in their public filings for the headquarters relocations, ranging
from business expansion and cost savings to regulation changes and access to amenities (see
Calluzzo et al., 2016). At times, firms provide no explicit reasons (14% of our sample) for their
headquarters relocations, making it difficult for outsiders to infer the motives for the move. In Table
5, we present multinomial logit regressions with the dependent variable representing three possible
outcomes: relocations with no explicit reasons, relocations with explicit reasons, and no relocations.
We find that fraud score, accounting restatements, and abnormal accruals are all positively
associated with headquarters relocations, with larger coefficients of estimates for relocations with
no explicit reasons. These results suggest that misconduct-motivated relocations are more salient in

22
firms that withhold information regarding why they choose to relocate headquarters. Intuitively, if
firms tend to relocate for enforcement avoidance motives, they are more likely to stay silent.
C. Enforcement Shocks
As discussed in the methodology section, we identify two distinct shocks to SEC
enforcement intensity: an ex-post shock measure based on changes in enforcement activities in the
regional SEC office, and an ex-ante measure that captures the replacement of a “weak” SEC
regional office director. These quasi-experiments allow us to address endogeneity concerns and
enhance our confidence in drawing causal inferences. Specifically, we expect to observe that firms
with high fraud scores relocate with a higher probability (than firms with low fraud measures)
following shocks to SEC enforcement intensity.
Table 6 examines the influence of enforcement action shocks on the decision to relocate,
while Table 7 reports the results with the director shock. We use a high dimensional fixed effects
model that controls for year×state and year×industry fixed effects. Our dependent variable is an
indicator of whether the firm relocates headquarters to a different SEC jurisdiction. The
independent variable of interest is the interaction of the shock indicator with various measures of
financial misreporting and earnings management.
Columns (1) and (2) of Table 6 consistently report positive and statistically significant
coefficients on the interaction of Log(fraud score) and enforcement shock, as well as the interaction
of high fraud score dummy and enforcement shock. In terms of economic magnitude, given a one
standard deviation increase in the logarithm of fraud score (0.36), a firm is 0.5% more likely to
move in response to an enforcement shock. Similarly, firms with above-the-median fraud scores are
0.4% more likely to relocate upon an enforcement shock than those with low fraud scores. Taken
together, the results suggest that potentially fraudulent firms tend to relocate after observing a

23
sudden, large increase in AAERs brought by the local SEC office. Columns (3) to (4) report
insignificant coefficients on restatements and earnings management measures, suggesting that
aggressive earnings management may not be severe enough to catch regulators’ immediate
attention. Therefore, enforcement shocks do not seem to cause these firms to move spontaneously.
We find similar results in Table 7 using SEC director shock, except that the interaction of
Log(fraud score) and enforcement shock is only marginally insignificant. The positive and
significant coefficient on the interaction of high fraud score dummy and director shock suggests that
firms with above-the-median fraud scores are 1.4% more likely to move when there is a director
shock than those with lower fraud scores. This result suggests that firms with a higher likelihood of
conducting financial fraud tend to relocate after observing a director turnover with a “weak”
incumbent replaced by a potentially tough successor. The coefficients on the interactive variables
that involve earnings management and restatement measures are not statistically significant at the
conventional levels. Overall, Tables 6 and 7 provide consistent evidence that scrutiny avoidance
does, in fact, serve as a major consideration for firms with high fraud scores to relocate
headquarters.
D. Financial Misreporting and Enforcement Actions after Relocations
In this section, we examine firms’ financial misreporting behavior following headquarters
relocations. We adopt a difference-in-difference matched sample approach around headquarters
relocations. For each firm that relocates, we identify a set of firms in the same year and located in
the same SEC office region that do not relocate. We choose one firm with the closest propensity
score to relocate as its matched control.
We then perform an OLS regression, using this matched sample, spanning three years before
and three years after relocation. The dependent variable are measures of both the ex-ante likelihood

24
of fraudulent activities and ex-post incidences of fraud allegation, including fraud score, firms’
filing of restatements of prior financial reports, enforcement actions by the SEC, and class actions
by shareholders. Among the independent variables, Treatment is an indicator that takes the value of
one for firms that relocate, Post is an indicator variable identifying the three-year period after the
move, and Post*Treatment is the interaction between the two variables. High dimensional fixed
effects are included, and standard errors are clustered at the firm level in all regressions. Our
purpose is to investigate whether a firm that chooses to relocate its headquarters is successful in
evading the radar of regulators and shareholders, while continuing to conduct fraud.
Table 8 validates the quality of our matching method by providing summary statistics on the
treated and matched control samples. The two groups of firms look similar along all measures of
financial misconduct, except for Restatement_Class. This is intuitive, as firms that relocate tend to
restate previous years’ earnings after the move. The treated and matched firms exhibit similar
probabilities of relocation.
Table 9 presents the difference-in-difference regression results. Panel A considers all
relocations; Panel B reports subsample results with firms that relocate to regions with less intense
SEC enforcement (using the same measure described in Table 4). In Panel C, we present results for
the subsample of movers that relocate to another SEC jurisdiction, yet which are still close to the
old location (e.g., within 500 km). If scrutiny avoidance is the main consideration, a fraudulent firm
would likely relocate to a nearby state under the jurisdiction of a different SEC office to minimize
the cost of relocation. Compared to the full sample, we expect to see stronger results for these
subsamples of firms.
All three panels show consistent results with stronger evidence shown in the bottom two
panels. Table 9 shows that the interaction term Post*Treat is positive and statistically significant in

25
Columns (1) and (2) in all three panels, suggesting that compared to matched non-movers, relocated
firms experience an increase in fraud scores after relocation. As expect, the interaction term is larger
in Panels B and C than it is in Panel A. Moreover, Post*Treat is positive and statistically significant
in Column (3) in the bottom two panels, suggesting that firms tend to restate their previous years’
accounting reports after relocations. It is likely that these firms time the filing of their restatements
this way to avoid the attention of the previous regional SEC offices, especially if they move to a
region with less intense regulatory enforcement.
Columns (4) and (5) report the changes in AAERs received by the firm and class action
lawsuits filed against the firm, respectively. Interestingly, we find that even though the treated firms
are engaged in heightened fraudulent activities after relocations, and that they also file more
restatements, the likelihood of them being caught by either the regulators (as measured by SEC
enforcement actions) or shareholders (as measured by class actions suits) is not higher than that of
the control firms.
Furthermore, we perform a “placebo” test by examining the changes in financial
misreporting behavior of those firms that relocate to a different MSA or state but remain in the same
SEC jurisdiction. For each firm that relocates, we follow the same propensity score-matching
procedure as discussed earlier to find the matched firm. Firms that relocate within the local SEC
jurisdiction states should not have done so for the purpose of enforcement avoidance. Therefore, we
do not expect to observe a statistically significant coefficient of Post*Treat in our difference-in-
difference test. The results presented in Table 10 Panel A confirm that this is indeed the case.
Admittedly, the SEC effect can be confounded by the state court effect. That is, firms may
relocate not to avoid intense SEC enforcements, but rather to avoid strict officials that are state

26
specific.25 We address this issue by including state fixed effects in all our prior regressions. To
further alleviate this concern, we perform difference-in-difference tests for the subsample of firms
that relocate to a different state but remain in the same SEC jurisdiction (i.e., a subset of firms in
Panel A of Table 10). If firms relocate for considerations related to the state legal authorities, we
should observe similar results in this subsample to those presented in Table 9. However, Panel B of
Table 10 shows that the results are much weaker for those firms that relocate out of state but within
SEC jurisdictions. The evidence suggests that the relocations of fraudulent firms are most likely
driven by incentives to avoid the scrutiny of the SEC.
E. Robustness Tests
E.1. Event Study
In this section, we examine stock reactions surrounding the relocation announcement of the
firm. Due to the intensive nature of manually identifying the date of the move announcement, we
focus our attention on the 796 out-of-SEC relocations that occur between 1998 and 2005. This
eight-year subsample period represents more than half of the total out-of-SEC relocations in our
sample. Through a thorough search of corporate press releases and media we are able to clearly
identify the announcement dates for only 145 moves. The relatively small number is due to a lack of
media coverage and official corporate disclosures surrounding relocations. In fact, firms for which
we are able to identify the announcement dates tend to be larger and have better analyst coverage.
This is not surprising given that these firms are visible and therefore more likely to be covered by
media.
We estimate cumulative abnormal stock returns (CAR) in the [–5, +5] window around the
announcement dates of relocations. Daily abnormal returns are computed using the four-factor 25 For example, firms relocate to avoid the scrutiny by state governor, attorney general, state courts, etc. It is possible that officials in some states are more lax than those in other states in investigating and catching fraud.

27
model (i.e., Fama-French three factors and Carhart momentum factor). We report the OLS
regressions on CAR [–5, +5] in Table 11. Explanatory variables are taken from the fiscal year
before the relocation. Year fixed effects are included and robust standard errors are calculated.
The first column of Table 11 includes no explanatory variables, so that the coefficient on the
constant term can be interpreted as the average CAR across all firms in our sample that move. The
reported coefficient is positive and statistically significant, suggesting that the relocations are
associated with an average 4.1% positive market reaction. In Columns (2)–(5), we add our financial
misconduct measures and control variables. We expect the announcement CARs to decline with the
level of our ex-ante fraud measures (i.e., fraud score), since the motives of scrutiny avoidance are
expected to be stronger in firms with higher fraud scores. Consistent with our conjecture, we find a
significantly negative relation between Log(fraud score) and Abnormal accruals and the market
reactions. The coefficients on the other two measures are also negative but statistically insignificant.
Taken together, our results suggest that investors in general view headquarters relocation as
a value-creating corporate action, particularly for this subsample of firms for which we are able to
identify announcement dates. However, the positive reactions are weakened for those firms that are
suspected to have higher probability of misconduct and thus relocate for scrutiny avoidance
purposes.
E.2. Analyst Coverage and Firm Size
Prior literature documents that analysts serve as external monitors of managerial
misconduct, playing the role of “gatekeepers” (Coffee, 2007), and they also enhance security
market information dissemination (e.g., Moyer, Chatfield, and Sisneros, 1989). Recent studies
suggest that firms manage earnings to a lesser extent when they are followed by more (experienced)
analysts and analysts from top brokers (Yu, 2008). Further, firms of large size tend to be more

28
visible and have a variety of external monitors. Strong external governance should deter relocations
driven by fraud-hiding motives, and highly visible firms may trigger investigation upon a
headquarters relocation that coincides with strong indicators of financial misreporting. Therefore,
we expect to see the relationship between financial misreporting measures and the likelihood of
relocations to be more pronounced in the subsample of firms with fewer analysts and those of
smaller size.
We split our sample by the level of analyst coverage and firm size respectively and explore
whether and how headquarters relocations due to financial misreporting motives vary across the
subsamples. We use the number of analysts following the company collected from the Institutional
Brokers' Estimate System (I/B/E/S) database. We define two dummy variables on analyst coverage:
“low analyst coverage” for firms with a below-the-median number of analysts (among the sample of
firms with non-zero analyst following) and “no analyst coverage” for firms with no analysts
following. 26. We augment our estimations in Table 2 by including interactions of each of the
misconduct measures with the analyst coverage indicators, thereby benchmark low and no analyst
firms against firms with large analyst coverage. Untabulated, our results show firms without
external monitoring from financial intermediaries are more likely to relocate for misconduct
motives. Similarly, we define two indicator variables on firm size (measured by sales): firms with
medium size (the middle tercile of firms sorted by sales each year) and firms with small size (the
bottom tercile of firms sorted by sales each year). Our untabulated results show that, compared to
large firms, medium and small firms are more likely to move when their financial statements
indicate a greater likelihood of misreporting. Taken together, we find evidence that headquarters
relocations related to financial misreporting activities are more pronounced in smaller firms with 26 Many firms in our sample have no analyst coverage. This could be due to two possible scenarios: either the firm has no public stocks listed (they file with the SEC because they have other public securities traded, such as corporate bonds), or the firm has stocks listed but no analysts covering it.

29
less analyst coverage. In addition, we repeat our difference-in-difference tests presented in Table 9
with sample splits, and find that the effects are stronger among firms with no analyst coverage.
E.3. M&A
Given that merger and asset purchases are the most frequently quoted reasons for relocations
(Calluzzo, Wang, and Wu, 2016), we investigate whether our results are robust to removing firms
with significant acquisitions. The purpose of the analysis is to address the concern that mergers may
have changed the firm’s business model and caused the accounting-based financial misreporting
measures to change accordingly.
We retrieve from SDC Platinum all completed merger and acquisition transactions from
1994–2012 that involve a U.S. target and result in the acquirer owning at least 50% of the target’s
shares. We remove transactions that are leveraged buyouts (LBOs), taken private transactions,
spinoffs, recapitalizations, self-tenders, repurchases, proxy fights, debt restructuring, sale lease
buybacks, joint ventures, and assets swaps. We merge the acquiring firms with our relocation
dataset and exclude those firm-years that have experienced at least one merger. Approximately 30%
of our total observations have to be dropped as a result. We then repeat all our empirical exercises
(untabulated) and find that our main findings remain robust thus are not driven by business changes
associated with mergers or acquisitions.
E.4. Robustness Difference-in-Difference Tests
Finally, we examine whether our difference-in-difference results presented in Section D are
driven by unobservable factors that are specific to the destination region into which our sample
firms relocate. For example, there may be a strong culture of misconduct that is specific to the new
geographic region into which firms relocate (Parsons, Sulaeman, and Titman, 2015). As a result, the
large increase in the misconduct score of the relocating firm may be a result of adapting to the new

30
misconduct culture, rather than the motivation of scrutiny avoidance. To address this concern, for
each relocated firm, we find one non-mover firm (control) matched by year, the SEC jurisdiction
region that the firm moves into, and the closest fraud score. We then repeat the difference-in-
difference regressions presented in Panel A of Table 9. Untabulated, this exercise generates results
that are consistent with Table 9; that is, relocated firms exhibit higher fraud scores after relocation,
but they are not more likely to be caught by either the regulators or shareholders, when compared to
the matched firms that are located in the region they move into.27
VI. Conclusion
Headquarters relocation is a significant corporate decision that can incur large costs for a
firm. Yet each year, approximately 2% of U.S. public firms go through this expensive process by
relocating their headquarters to another state or MSA.
We document opportunistic reasons for headquarters relocations: firms with higher ex-ante
likelihood of financial misreporting have a greater tendency to relocate their headquarters away
from the local SEC office. Evidence on the destinations of the move further supports fraud-hiding
motives – these firms tend to move to areas with weaker enforcement; such firms also seem to
refrain from reporting the explicit reasons for their relocation. For identification, we rely on scrutiny
shocks, as measured by either increased AAERs brought by local SEC offices, or the replacement of
a “weak” regional director with a regulator from another SEC office. We find consistent results that
firms potentially committing financial fraud are more likely to relocate upon such shocks. Finally,
we turn to the post-relocation window and offer evidence that relocated firms are successful in
interrupting scrutiny. We find that, when compared to non-movers with the same ex-ante likelihood
of relocation, movers experience increases in the fraud score and they tend to restate their previous 27 In further untabulated analysis, we find some evidence that relocating firms are more likely to switch auditors post-relocation than are matched firms that relocate into either the state they move away from, or the states they move into.

31
earnings after the move; however, they are not more likely to be caught by regulators or
shareholders than matched firms.
Our paper sheds light on the relationship between SEC enforcement, firms’ headquarters
relocation decisions, and their financial reporting activities. We uncover the opportunistic motives
for corporate headquarters relocation. Our findings suggest that SEC enforcement has an impact on
corporate strategies, and render support for a centralized fraud monitoring mechanism consistent
with recent SEC efforts of establishing the Financial Reporting and Audit Task Force.
Complementary to a localized enforcement process, homogenized scrutiny intensity across regional
offices, along with intensified central planning, would curb the benefits fraudulent firms can gain
from opportunistic relocations.
32
References
Bergstresser, Daniel and Thomas Philippon. 2006. CEO incentives and earnings management.
Journal of Financial Economics 80:511–529.
Bertrand, Marianne, Ester Duflo, and Sendhil Mullainathan. 2004. How much should we trust
differences-in-differences estimates? Quarterly Journal of Economics 119:249-275.
Blackburne, Terrence. 2014. Regulatory oversight and reporting incentives: evidence from SEC
budget allocations. Working paper, University of Pennsylvania.
Burns, Natasha and Simi Kedia. 2006. The impact of performance-based compensation on
misreporting. Journal of Financial Economics 79(1):35-67.
Calluzzo, Paul, Wei Wang, and Serena Wu. 2016. Why do firms relocate headquarters? Working
paper, Queen’s University.
Coffee, John C. Jr. 2006. Gatekeepers: the professions and corporate governance. Oxford
University Press, New York.
Coval, Joshua D., and Tobias J. Moskowitz. 1999. Home bias at home: Local equity preference in
domestic portfolios. Journal of Finance 54:2045-2073.
Dechow, Patricia M., Weli Ge, Chad R. Larson, and Richard G. Sloan. 2011. Predicting material
accounting misstatements. Contemporary Accounting Research 28:17-82.
Dechow, Patricia, Richard G. Sloan, and Amy P. Sweeney. 1995. Detecting earnings management.
Accounting Review 70:193–225.
Desai, Hemang, Chris E. Hogan, and Michael S. Wilkins. 2006. The reputational penalty for
aggressive accounting: Earnings restatements and management turnover. The Accounting
Review 81(1):83-112.
Dyck, Alexander, Adair Morse, and Luigi Zingales. 2010. Who blows the whistle on corporate
fraud? Journal of Finance 65:2213-2253.
Efendi, Jap, Anup Srivastava, and Edward P. Swanson. 2007. Why do corporate managers misstate
financial statements? The role of option compensation and other factors. Journal of Financial
Economics 85:667-708.
Fich, Eliezer M. and Anil Shivdasani. 2007. Financial fraud, director reputation, and shareholder
wealth. Journal of Financial Economics 86:306-336.
Field, L., M. Lowry, and S. Shu. 2005. Does disclosure deter or trigger litigation? Journal of
Accounting and Economics 39:487–507.

33
Gormley, Todd A., and David A. Matsa, 2014. Common errors: How to (and not to) control for
unobserved heterogeneity. Review of Financial Studies 27:617-661.
Del Guercio, Diane, Elizabeth R. Odders-White, and Mark J. Ready. 2014. The deterrence effect of
SEC enforcement intensity on illegal; insider trading. Working paper, University of Oregon.
Jackson, Howell E., and Mark J. Roe. 2009. Public and private enforcement of securities laws:
Resource-based evidence. Journal of Financial Economics 93:207-238.
Jones, Jennifer J. 1991. Earnings management during import relief investigations. Journal of
Accounting Research 29(2):193-228.
Karpoff, Jonathan M., D. Scott Lee, and Gerald S. Martin. 2008a. The consequences to managers
for financial misrepresentation. Journal of Financial Economics 88:193–215.
Karpoff, Jonathan M., D. Scott Lee, and Gerald S. Martin. 2008b. The cost to firms of cooking the
books. Journal of Financial and Quantitative Analysis 43:581-611.
Kedia, Simi, and Shiva Rajgopal. 2011. Do the SEC’s enforcement preferences affect corporate
misconduct? Journal of Accounting and Economics 51(3):259-278.
Kothari, S.P, Andrew Leone, and Charles Wasley. 2005. Performance matched discretionary accrual measures. Journal of Accounting and Economics 39:163-197.
Lancaster, Tony. 2000. The incidental parameter problem since 1948. Journal of Econometrics 95:391-413.
Moyer, R. Charles, Robert C. Chatfield, and Phillip M. Sisneros. 1989. Security analyst monitoring
activity: Agency costs and information demands. Journal of Financial and Quantitative
Analysis 24:503-512.
Parsons, Christopher A., Johan Sulaeman, and Sheridan Titman. 2015. The geography of financial
misconduct. Working paper, UCSD.
Petersen, Mitchell A., and Raghuram G. Rajan. 2002. Does distance still matter? The information
evolution in small business lending. Journal of Finance 57:2533-2570.
Srinivasan, Suraj, 2005. Consequences of financial reporting failure for outside directors: Evidence
from accounting restatements and audit committee members. Journal of Accounting Research
43:291–334.
Stuart, Elizabeth. 2011. The why, when, and how of propensity score methods for estimating causal
effects. Presentation for the Society of Prevention Research.
Yu, Frank. 2008. Analyst coverage and earnings management. Journal of Financial Economics
88:245-271.

34
Yu, Frank, and Xiaoyun Yu. 2011. Corporate lobbying and fraud detection. Journal of Financial
and Quantitative Analysis 46:1865-1891.
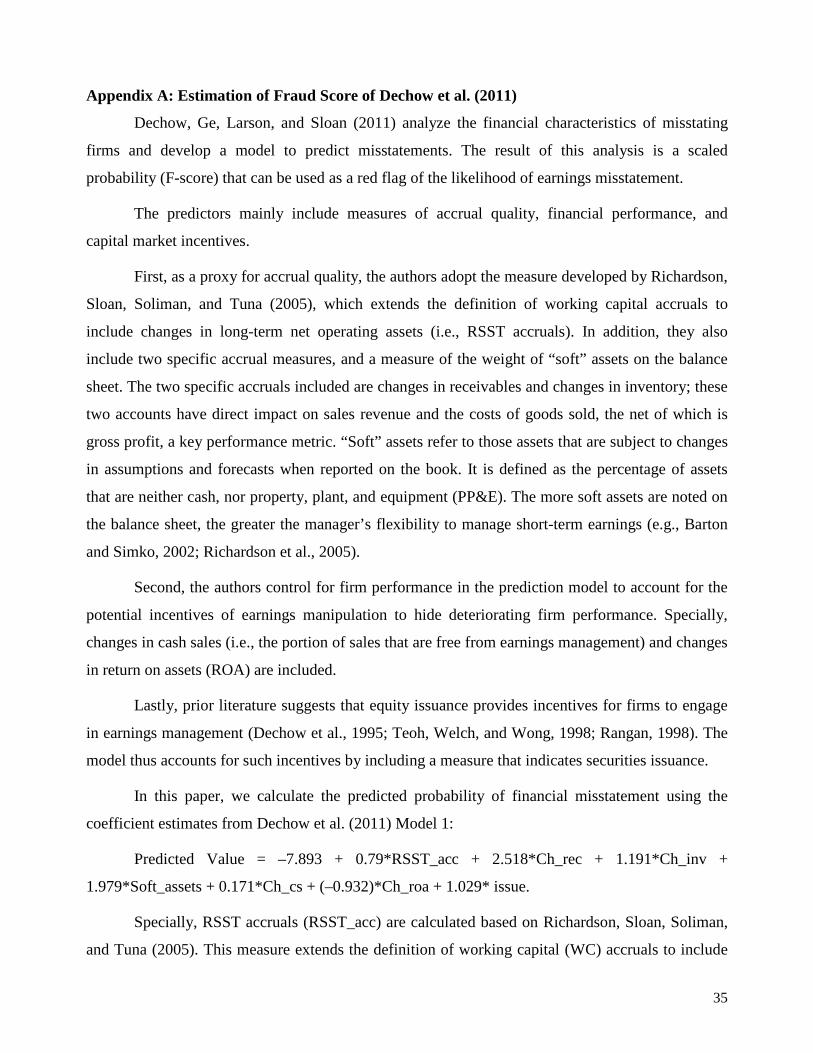
35
Appendix A: Estimation of Fraud Score of Dechow et al. (2011)
Dechow, Ge, Larson, and Sloan (2011) analyze the financial characteristics of misstating
firms and develop a model to predict misstatements. The result of this analysis is a scaled
probability (F-score) that can be used as a red flag of the likelihood of earnings misstatement.
The predictors mainly include measures of accrual quality, financial performance, and
capital market incentives.
First, as a proxy for accrual quality, the authors adopt the measure developed by Richardson,
Sloan, Soliman, and Tuna (2005), which extends the definition of working capital accruals to
include changes in long-term net operating assets (i.e., RSST accruals). In addition, they also
include two specific accrual measures, and a measure of the weight of “soft” assets on the balance
sheet. The two specific accruals included are changes in receivables and changes in inventory; these
two accounts have direct impact on sales revenue and the costs of goods sold, the net of which is
gross profit, a key performance metric. “Soft” assets refer to those assets that are subject to changes
in assumptions and forecasts when reported on the book. It is defined as the percentage of assets
that are neither cash, nor property, plant, and equipment (PP&E). The more soft assets are noted on
the balance sheet, the greater the manager’s flexibility to manage short-term earnings (e.g., Barton
and Simko, 2002; Richardson et al., 2005).
Second, the authors control for firm performance in the prediction model to account for the
potential incentives of earnings manipulation to hide deteriorating firm performance. Specially,
changes in cash sales (i.e., the portion of sales that are free from earnings management) and changes
in return on assets (ROA) are included.
Lastly, prior literature suggests that equity issuance provides incentives for firms to engage
in earnings management (Dechow et al., 1995; Teoh, Welch, and Wong, 1998; Rangan, 1998). The
model thus accounts for such incentives by including a measure that indicates securities issuance.
In this paper, we calculate the predicted probability of financial misstatement using the
coefficient estimates from Dechow et al. (2011) Model 1:
Predicted Value = –7.893 + 0.79*RSST_acc + 2.518*Ch_rec + 1.191*Ch_inv +
1.979*Soft_assets + 0.171*Ch_cs + (–0.932)*Ch_roa + 1.029* issue.
Specially, RSST accruals (RSST_acc) are calculated based on Richardson, Sloan, Soliman,
and Tuna (2005). This measure extends the definition of working capital (WC) accruals to include

36
changes in long-term operating assets (i.e., changes in NCO) and long-term operating liabilities
(i.e., changes in FIN), where WC = (Current Assets – Cash and Short-term Investments) – (Current
Liab – Debt in Current Liab); NCO = (Total Assets – Current Assets – Investments and Advances)
– (Total Liab – Current Liab – LT Debt); FIN = (ST Investments + LT Investment) – (LT Debt +
Debt in Current Liab + Preferred Stock). Ch_rec stands for changes in Accounts
Receivable/Average Total Assets. Ch_inv stands for changes in Inventory/Average Total Assets;
Soft_assets= [Total Assets – PP&E – Cash and Cash Equivalent]/Average Total Assets; Ch_cs is
the percent change in cash sales, with cash sales = [Sales – Changes in AR]; Ch_roa is
Earnings/Average Total Assets at time t minus Earnings/Average Total Assets at t–1; Issue is an
indicator variable that takes on the value of one if the firm issued securities.
F-score is then calculated as the predicted value from the above estimation model divided by
the unconditional probability of fraud.

37
Figure 1: SEC Budget and Headquarters Relocations Figure 1A: Headquarters Relocations and SEC Budget in 2009 Thousand Dollars
Figure 1B: Headquarters Relocations and SEC Budget as a Fraction of Market Capitalizations
$0
$200,000
$400,000
$600,000
$800,000
$1,000,000
$1,200,000
0.00%
0.50%
1.00%
1.50%
2.00%
2.50%
1995 1996 1997 1998 1999 2000 2001 2002 2003 2004 2005 2006 2007 2008 2009 2010 2011 2012
SEC Budget (Right)
Out of SEC jurisdiction states (Left)
Out of State/MSA but within SEC jurisdiction states (Left)
0.00000%
0.00100%
0.00200%
0.00300%
0.00400%
0.00500%
0.00600%
0.00700%
0.00800%
0.00%
0.50%
1.00%
1.50%
2.00%
2.50%
1995 1996 1997 1998 1999 2000 2001 2002 2003 2004 2005 2006 2007 2008 2009 2010 2011 2012
SEC Budget as a fraction of market cap (Right)
Out of SEC jurisdiction states (Left)
Out of State/MSA but within SEC jurisdiction states (Left)

Table 1: Annual Statistics on Corporate Headquarters Relocation
Year Number of Obs.
Moves (out of state)
Moves (out of MSA)
Moves (both out of state and out of
MSA)
Moves (either out of state or out of
MSA)
Out of State/MSA but within SEC jurisdiction
states
Out of SEC jurisdiction states
% % % % % %1995 4,140 0.87% 0.92% 0.75% 1.04% 0.27% 0.77%1996 4,876 1.27% 1.42% 1.19% 1.50% 0.41% 1.09%1997 7,622 2.20% 2.40% 1.93% 2.68% 0.77% 1.90%1998 7,487 1.94% 2.34% 1.68% 2.59% 0.85% 1.74%1999 7,561 1.77% 2.08% 1.65% 2.20% 0.60% 1.60%2000 7,533 2.10% 2.51% 1.90% 2.71% 0.88% 1.83%2001 7,312 2.16% 2.32% 1.93% 2.56% 0.63% 1.93%2002 7,009 1.71% 1.95% 1.57% 2.10% 0.58% 1.51%2003 6,648 1.65% 1.82% 1.59% 1.88% 0.32% 1.58%2004 6,392 1.64% 1.78% 1.44% 1.99% 0.67% 1.31%2005 6,179 1.65% 1.76% 1.51% 1.91% 0.40% 1.51%2006 6,009 1.61% 1.96% 1.53% 2.05% 0.63% 1.43%2007 5,711 1.54% 1.68% 1.45% 1.77% 0.40% 1.37%2008 5,450 1.36% 1.58% 1.23% 1.71% 0.59% 1.12%2009 5,223 1.26% 1.53% 1.21% 1.59% 0.54% 1.05%2010 5,014 1.22% 1.54% 1.16% 1.60% 0.52% 1.08%2011 4,960 1.15% 1.29% 1.11% 1.33% 0.30% 1.03%2012 4,944 0.67% 0.71% 0.63% 0.75% 0.18% 0.57%
All 110,070 1.61% 1.83% 1.47% 1.97% 0.56% 1.42%
This table presents the annual frequency of corporate headquarters relocation. Annual statistics are presented for out-of-state, out-of-MSA, and out-of-SEC-jurisdiction relocations, separately. Our sample comprises Compustat firm-years that have 10-K filings available from EDGAR from 1994–2012.

Panel A: Logit (1) (2) (3) (4)
Log(fraud score) 0.391*** (0.092)
High fraud score dummy 0.236*** (0.079)
Restatement_Class 0.322***(0.093)
Abnormal accrurals 0.216** (0.084)
ROA –0.313*** –0.319*** –0.183*** –0.247***(0.062) (0.062) (0.048) (0.079)
Market-to-book –0.019** –0.018** –0.002 –0.017** (0.009) (0.009) (0.006) (0.008)
Sales growth –0.712*** –0.654*** –0.535*** –0.612***(0.183) (0.186) (0.184) (0.170)
Log (age) –0.045 –0.057 –0.156*** –0.103* (0.065) (0.065) (0.056) (0.058)
Log (sales) –0.140*** –0.140*** –0.144*** –0.119***(0.023) (0.023) (0.019) (0.021)
Industry cluster –0.220*** –0.218*** –0.256*** –0.244***(0.045) (0.045) (0.043) (0.042)
Constant –13.970*** –13.787*** –15.465*** –14.774***(1.584) (1.554) (1.622) (1.461)
Year FE Y Y Y YState FE Y Y Y YTwo-Digit SIC FE Y Y Y Y
N 58,892 58,892 73,979 67,282Pseudo R-squared 0.058 0.057 0.071 0.059
This table presents the Logit (Panel A) and OLS (Panel B) regressions on headquarters relocation. The dependent variable (in both Panels A and B) takes on the value of one if a firm relocates its headquarters to a different SEC jurisdiction state in a given year. Explanatory variables are taken from the fiscal year before the headquarters relocation. Our sample comprises Compustat firm-years that have 10-K filings available from EDGAR from 1994–2012. Year fixed effects, industry fixed effects at the two-digit SIC level, and state fixed effects are included in all regressions. Standard errors are clustered at the firm level. All variables are defined in Appendix Table 1.
Table 2: Financial Misconduct and the Probability of Headquarters Relocation Outside the SEC Jurisdiction

Panel B: OLS (1) (2) (3) (4)
Log(fraud score) 0.011*** (0.003)
High fraud score dummy 0.004*** (0.001)
Restatement_Class 0.004*** (0.001)
Abnormal accrurals 0.008***(0.003)
ROA –0.009*** –0.009*** –0.004*** –0.008***(0.002) (0.002) (0.001) (0.002)
Market-to-book 0.000 0.000 0.000* 0.000(0.000) (0.000) (0.000) (0.000)
Sales growth –0.010*** –0.009*** –0.007*** –0.008***(0.003) (0.003) (0.002) (0.002)
Log (age) 0.000 0.000 –0.001** –0.001(0.001) (0.001) (0.001) (0.001)
Log (sales) –0.002*** –0.002*** –0.002*** –0.001***(0.000) (0.000) (0.000) (0.000)
Industry cluster –0.003*** –0.003*** –0.003*** –0.004***(0.001) (0.001) (0.001) (0.001)
Constant 0.024*** 0.027*** 0.030*** 0.030***(0.003) (0.003) (0.003) (0.003)
Year*Two-Digit SIC FE Y Y Y YYear*State FE Y Y Y Y
N 60,557 60,557 75,461 68,204R-squared 0.037 0.037 0.029 0.033

Table 3: Financial Misconduct and the Probability of Headquarter Relocation Within vs. Outside the SEC Jurisdiction
Outside SEC Within SEC Outside SEC Within SEC Outside SEC Within SEC Outside SEC Within SEC
Log(fraud score) 0.387*** 0.156 (0.089) (0.180)
High fraud score dummy 0.224*** 0.012 (0.075) (0.132)
Restatement_Class 0.403*** 0.287* (0.091) (0.159)
Abnormal accrurals 0.182** 0.062(0.082) (0.147)
ROA –0.268*** –0.244** –0.276*** –0.247** –0.141*** –0.101 –0.215*** –0.093(0.060) (0.106) (0.059) (0.105) (0.036) (0.078) (0.077) (0.115)
Market-to-book –0.015* –0.013 –0.014* –0.012 0.005 0.010 –0.012 0.000(0.008) (0.017) (0.008) (0.017) (0.006) (0.012) (0.008) (0.014)
Sales growth –0.693*** –0.151 –0.624*** –0.093 –0.504*** –0.297 –0.567*** –0.087(0.178) (0.316) (0.182) (0.310) (0.189) (0.343) (0.167) (0.308)
Log (age) –0.029 –0.046 –0.044 –0.055 –0.132** –0.072 –0.107* –0.142(0.064) (0.108) (0.063) (0.108) (0.055) (0.091) (0.057) (0.096)
Log (sales) –0.124*** –0.126*** –0.124*** –0.123*** –0.133*** –0.113*** –0.106*** –0.124***(0.020) (0.030) (0.021) (0.030) (0.017) (0.026) (0.019) (0.028)
Industry cluster –0.102*** –0.209*** –0.100*** –0.208*** –0.106*** –0.214*** –0.114*** –0.219***(0.031) (0.055) (0.031) (0.055) (0.029) (0.052) (0.028) (0.051)
Constant –5.981*** –6.673*** –5.852*** –6.576*** –5.535*** –6.288*** –5.530*** –6.104***(0.355) (0.685) (0.351) (0.668) (0.284) (0.520) (0.319) (0.574)
NPseudo R-squared 0.036 0.035 0.045 0.037
This table presents multinomial logit regressions on headquarters relocation. The dependent variable identifies if a firm moved to a location outside the MSA/State but within the same SEC jurisdiction states, or to a location outside the SEC jurisdiction states, or if it did not relocate. Explanatory variables are taken from the fiscal year before the headquarters relocation. Our sample comprises Compustat firm-years that have 10-K filings available from EDGAR from 1994–2012. Year fixed effects, industry fixed effects at the two-digit SIC level, and state fixed effects are included in all regressions. Standard errors are clustered at the firm level. All variables are defined in Appendix Table 1.
(1) (2) (3) (4)
65,777 65,777 82,590 74,857
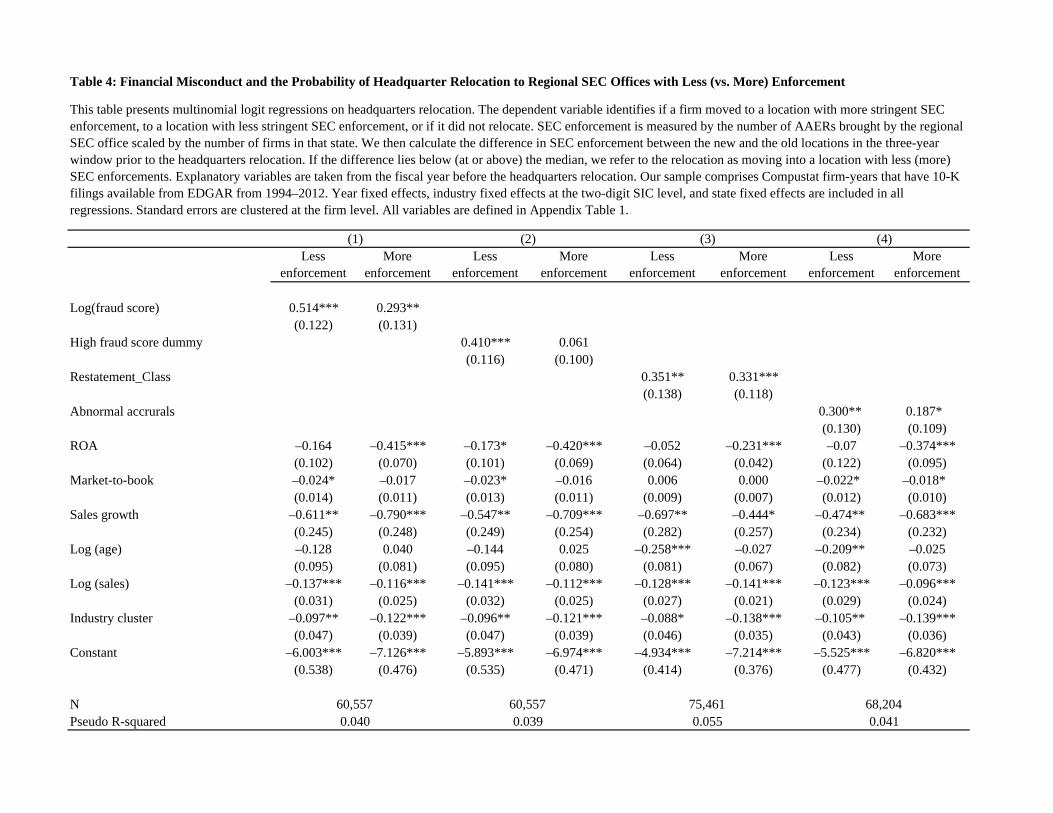
Table 4: Financial Misconduct and the Probability of Headquarter Relocation to Regional SEC Offices with Less (vs. More) Enforcement
Less enforcement
More enforcement
Less enforcement
More enforcement
Less enforcement
More enforcement
Less enforcement
More enforcement
Log(fraud score) 0.514*** 0.293** (0.122) (0.131)
High fraud score dummy 0.410*** 0.061 (0.116) (0.100)
Restatement_Class 0.351** 0.331*** (0.138) (0.118)
Abnormal accrurals 0.300** 0.187* (0.130) (0.109)
ROA –0.164 –0.415*** –0.173* –0.420*** –0.052 –0.231*** –0.07 –0.374***(0.102) (0.070) (0.101) (0.069) (0.064) (0.042) (0.122) (0.095)
Market-to-book –0.024* –0.017 –0.023* –0.016 0.006 0.000 –0.022* –0.018* (0.014) (0.011) (0.013) (0.011) (0.009) (0.007) (0.012) (0.010)
Sales growth –0.611** –0.790*** –0.547** –0.709*** –0.697** –0.444* –0.474** –0.683***(0.245) (0.248) (0.249) (0.254) (0.282) (0.257) (0.234) (0.232)
Log (age) –0.128 0.040 –0.144 0.025 –0.258*** –0.027 –0.209** –0.025(0.095) (0.081) (0.095) (0.080) (0.081) (0.067) (0.082) (0.073)
Log (sales) –0.137*** –0.116*** –0.141*** –0.112*** –0.128*** –0.141*** –0.123*** –0.096***(0.031) (0.025) (0.032) (0.025) (0.027) (0.021) (0.029) (0.024)
Industry cluster –0.097** –0.122*** –0.096** –0.121*** –0.088* –0.138*** –0.105** –0.139***(0.047) (0.039) (0.047) (0.039) (0.046) (0.035) (0.043) (0.036)
Constant –6.003*** –7.126*** –5.893*** –6.974*** –4.934*** –7.214*** –5.525*** –6.820***(0.538) (0.476) (0.535) (0.471) (0.414) (0.376) (0.477) (0.432)
NPseudo R-squared 0.040 0.039 0.055 0.041
60,557 60,557 75,461 68,204
(2)
This table presents multinomial logit regressions on headquarters relocation. The dependent variable identifies if a firm moved to a location with more stringent SEC enforcement, to a location with less stringent SEC enforcement, or if it did not relocate. SEC enforcement is measured by the number of AAERs brought by the regional SEC office scaled by the number of firms in that state. We then calculate the difference in SEC enforcement between the new and the old locations in the three-year window prior to the headquarters relocation. If the difference lies below (at or above) the median, we refer to the relocation as moving into a location with less (more) SEC enforcements. Explanatory variables are taken from the fiscal year before the headquarters relocation. Our sample comprises Compustat firm-years that have 10-K filings available from EDGAR from 1994–2012. Year fixed effects, industry fixed effects at the two-digit SIC level, and state fixed effects are included in all regressions. Standard errors are clustered at the firm level. All variables are defined in Appendix Table 1.
(1) (3) (4)

Table 5: Multinomal Logit by Self-Reported Reasons for Headquarters Relocation
No Explicit Reasons
Explicit Reasons
No Explicit Reasons
Explicit Reasons
No Explicit Reasons
Explicit Reasons
No Explicit Reasons
Explicit Reasons
Log(fraud score) 0.627*** 0.324*** (0.175) (0.103)
High fraud score dummy 0.594*** 0.133 (0.186) (0.082)
Restatement_Class 0.428** 0.303*** (0.211) (0.100)
Abnormal accrurals 0.368** 0.203** (0.180) (0.093)
ROA 0.035 –0.381*** 0.022 –0.386*** –0.019 –0.193*** 0.207 –0.341***(0.176) (0.061) (0.173) (0.061) (0.114) (0.037) (0.176) (0.083)
Market-to-book –0.004 –0.024** –0.003 –0.022** 0.007 0.001 0.002 –0.024***(0.018) (0.010) (0.018) (0.009) (0.013) (0.006) (0.015) (0.009)
Sales growth –0.679 –0.704*** –0.624 –0.632*** –0.479 –0.534*** –0.544 –0.595***(0.458) (0.195) (0.471) (0.199) (0.513) (0.205) (0.425) (0.183)
Log (age) –0.23 0.008 –0.249 –0.005 –0.244* –0.092 –0.329** –0.058(0.153) (0.066) (0.152) (0.066) (0.129) (0.057) (0.139) (0.059)
Log (sales) –0.193*** –0.109*** –0.201*** –0.107*** –0.146*** –0.129*** –0.170*** –0.092***(0.050) (0.021) (0.051) (0.021) (0.043) (0.018) (0.045) (0.020)
Industry cluster 0.029 –0.136*** 0.032 –0.135*** –0.006 –0.131*** –0.03 –0.138***(0.072) (0.034) (0.072) (0.033) (0.071) (0.031) (0.069) (0.031)
Constant –7.710*** –6.246*** –7.634*** –6.110*** –7.041*** –5.969*** –6.896*** –5.960***(0.872) (0.394) (0.879) (0.390) (0.703) (0.318) (0.766) (0.362)
NPseudo R-squared
This table presents multinomial logit regressions on headquarters relocation. The dependent variable identifies whether a firm disclosed explicit reasons for its relocation, disclosed no explicit reason for its relocation, or did not relocate. We define explicit reasons as when a firm clearly discloses one or multiple reasons for its move in its 10-K filing, and no explicit reason as when such disclosure cannot be found in a firm's 10-K filing. Explanatory variables are taken from the fiscal year before the headquarters relocation. Our sample comprises Compustat firm-years that have 10-K filings available from EDGAR from 1994–2012. Year fixed effects, industry fixed effects at the two-digit SIC level, and state fixed effects are included in all regressions. Standard errors are clustered at the firm level. All variables are defined in Appendix Table 1.
(1) (2) (3) (4)
68,2040.044
60,557 60,557 75,4610.041 0.041 0.053

Table 6: Evidence on the Likelihood of Headquarters Relocation after Enforcement Shocks
(1) (2) (3) (4)
Log(fraud score)×Enforcement shock 0.015** (0.007)
Log(fraud score) 0.006*** (0.002)
High fraud score dummy×Enforcement shock 0.005** (0.002)
High fraud score dummy 0.003*** (0.001)
Restatement_Class×Enforcement shock 0.001 (0.005)
Restatement_Class 0.004*** (0.001)
Abnormal accrurals×Enforcement shock –0.003(0.009)
Abnormal accrurals 0.008***(0.003)
ROA –0.009*** –0.009*** –0.004*** –0.008***(0.002) (0.002) (0.001) (0.002)
Market-to-book 0.000 0.000 0.000* 0.000(0.000) (0.000) (0.000) (0.000)
Sales growth –0.010*** –0.009*** –0.007*** –0.008***(0.003) (0.003) (0.002) (0.002)
Log (age) 0.000 0.000 –0.001** –0.001(0.001) (0.001) (0.001) (0.001)
Log (sales) –0.002*** –0.002*** –0.002*** –0.001***(0.000) (0.000) (0.000) (0.000)
Industry cluster –0.003*** –0.003*** –0.003*** –0.004***(0.001) (0.001) (0.001) (0.001)
Constant 0.025*** 0.027*** 0.030*** 0.030***(0.003) (0.003) (0.003) (0.003)
Year*Two-Digit SIC FE Y Y Y YYear*State FE Y Y Y Y
N 60,557 60,557 75,461 68,204R-squared 0.037 0.037 0.029 0.033
This table presents OLS regressions on the likelihood of headquarters relocation upon local enforcement shocks. We define an SEC region as experiencing an AAER shock in a given year if the number of enforcement actions brought by its regional SEC office increases the most in year t compared to the average enforcement rate over the prior three years (i.e., the largest increase out of the eleven offices). Firms in the shock jurisdictions are the treated and those in other jurisdictions are the control. The treatment and control firms are matched based on fraud scores prior to relocation. The dependent variable takes on the value of one if a firm relocates its headquarters to a different SEC jurisdiction state in a given year. Our independent variable of interest is the interaction of the shock variable and measures of financial misconduct. All explanatory variables are taken from the fiscal year before the headquarters relocation. Our sample comprises Compustat firm-years that have 10-K filings available from EDGAR from 1994–2012. Year*Industry and Year*State fixed effects are included and standard errors are clustered at the firm level in all regressions. All variables are defined in Appendix Table 1.

Table 7: Evidence on the Likelihood of Headquarters Relocation after Director Shocks
(1) (2) (3) (4)
Log(fraud score)×Director shock 0.017(0.012)
Fraud score 0.007***(0.002)
High fraud score dummy×Director shock 0.014**(0.006)
High fraud score dummy 0.003***(0.001)
Restatment_Class×Director shock 0.001(0.006)
Restatment_Class 0.004***(0.001)
Abnormal accrurals×Director shock 0.011(0.020)
Abnormal accrurals 0.008***(0.003)
ROA –0.009*** –0.009*** –0.004*** –0.008***(0.002) (0.002) (0.001) (0.002)
Market-to-book 0.000 0.000 0.000* 0.000(0.000) (0.000) (0.000) (0.000)
Sales growth –0.010*** –0.009*** –0.007*** –0.008***(0.003) (0.003) (0.002) (0.002)
Log (age) 0.000 0.000 –0.001** –0.001(0.001) (0.001) (0.001) (0.001)
Log (sales) –0.002*** –0.002*** –0.002*** –0.001***(0.000) (0.000) (0.000) (0.000)
Industry cluster –0.003*** –0.003*** –0.003*** –0.004***(0.001) (0.001) (0.001) (0.001)
Constant 0.024*** 0.027*** 0.030*** 0.030***(0.003) (0.003) (0.003) (0.003)
Year*Two-Digit SIC FE Y Y Y YYear*State FE Y Y Y Y
N 60,557 60,557 75,461 68,204R-squared 0.037 0.037 0.029 0.033
This table presents OLS regressions on the likelihood of headquarters relocation upon director turnover shocks. We define director turnover shocks as when the regional office’s enforcement activities are in the bottom half among all offices in the three years prior to the turnover, and when the incoming director is one from a different SEC office. Firms in the shock jurisdictions are the treated and those in the other jurisdictions are the control. The treatment and control firms are matched based on fraud scores prior to relocation. The dependent variable takes on the value of one if a firm relocates its headquarters to a different SEC jurisdiction state in a given year. Our independent variable of interest is the interaction of the shock variable and measures of financial misconduct. All explanatory variables are taken from the fiscal year before the headquarters relocation. Our sample comprises Compustat firm-years that have 10-K filings available from EDGAR from 1994–2012. Year*Industry and Year*State fixed effects are included and standard errors are clustered at the firm level in all regressions. All variables are defined in Appendix Table 1.
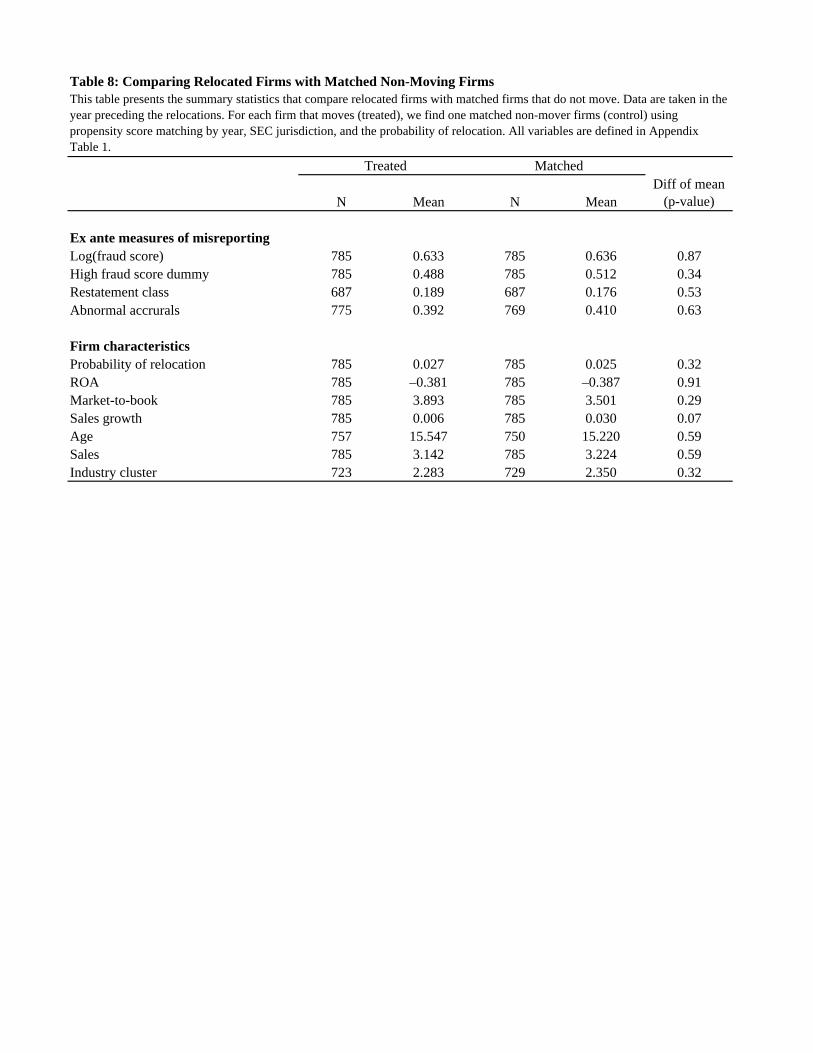
Table 8: Comparing Relocated Firms with Matched Non-Moving Firms
N Mean N MeanDiff of mean
(p-value)
Ex ante measures of misreportingLog(fraud score) 785 0.633 785 0.636 0.87High fraud score dummy 785 0.488 785 0.512 0.34Restatement class 687 0.189 687 0.176 0.53Abnormal accrurals 775 0.392 769 0.410 0.63
Firm characteristicsProbability of relocation 785 0.027 785 0.025 0.32ROA 785 –0.381 785 –0.387 0.91Market-to-book 785 3.893 785 3.501 0.29Sales growth 785 0.006 785 0.030 0.07Age 757 15.547 750 15.220 0.59Sales 785 3.142 785 3.224 0.59Industry cluster 723 2.283 729 2.350 0.32
This table presents the summary statistics that compare relocated firms with matched firms that do not move. Data are taken in the year preceding the relocations. For each firm that moves (treated), we find one matched non-mover firms (control) using propensity score matching by year, SEC jurisdiction, and the probability of relocation. All variables are defined in Appendix Table 1.
MatchedTreated

Panel A: All Relocations(1) (2) (3) (4) (5)
Log(fraud score) High fraud score dummy Restatement_File AAER Class actions
Post×Treat 0.082*** 0.089*** 0.023 0.000 0.001(0.023) (0.027) (0.018) (0.001) (0.002)
Post –0.039** –0.046** 0.008 0.002 0.003*(0.016) (0.020) (0.013) (0.001) (0.002)
Treat 0.030 0.021 0.002 0.000 0.000(0.020) (0.024) (0.013) (0.000) (0.000)
N 7,105 7,105 5,859 8,050 8,050R-squared 0.184 0.210 0.142 0.141 0.126
Panel B: Move to Less Enforcement(1) (2) (3) (4) (5)
Log(fraud score) High fraud score dummy Restatement_File AAER Class actions
Post×Treat 0.112*** 0.136*** 0.064* 0.000 0.000(0.037) (0.044) (0.035) (0.003) (0.003)
Post –0.01 –0.033 –0.006 0.003 0.004(0.026) (0.033) (0.023) (0.003) (0.003)
Treat 0.049* 0.025 0.003 0.000 0.001(0.029) (0.039) (0.023) (0.001) (0.001)
N 2,932 2,932 2,142 2,932 2,932R-squared 0.269 0.299 0.276 0.368 0.336
Panel C: Within 500km Moves(1) (2) (3) (4) (5)
Log(fraud score) High fraud score dummy Restatement_File AAER Class actions
Post×Treat 0.109* 0.147** 0.124*** –0.002 –0.008(0.061) (0.071) (0.042) (0.003) (0.005)
Post –0.046 –0.077 –0.061* 0.002 0.009(0.047) (0.056) (0.032) (0.003) (0.006)
Treat –0.022 –0.031 –0.052* 0.000 –0.001(0.053) (0.066) (0.030) (0.001) (0.002)
N 1,555 1,555 1,291 1,743 1,743R-squared 0.382 0.4 0.387 0.556 0.538
This table presents OLS regressions on financial misconduct before and after headquarters relocation, using a difference-in-difference design that compares relocated firms with firms that do not move. For each relocated firm (treated), we find one matched non-mover firm (control) that is propensity score matched by year, SEC jurisdiction, and the probability of relocation. Our sample includes the three yearsbefore and three years after the relocation year. Firms are dropped if they had AAERs or class actions in the three years pre-relocation. The dependent variable is a set of caught and uncaught financial misconduct measures, and the independent variables are treat, which identifies the firms that moved, post, which identifies the years after relocations, and post*treat, which is the interaction between the two variables. Panel A includes all headquarters relocations to a different SEC jurisdiction. Panel B considers only the subsample of headquarters relocation to an SEC jurisdiction with weaker enforcement. Panel C presents results for the subsample of movers that relocate to another SEC jurisdiction, yet which still stay close to the old location (e.g., within 500 km). Year*Industry fixed effects are included and standard errors are clustered at the firm level. All variables are defined in Appendix Table 1.
Table 9: Evidence on "Caught" and "Uncaught" Financial Misconduct Around Headquarters Relocation
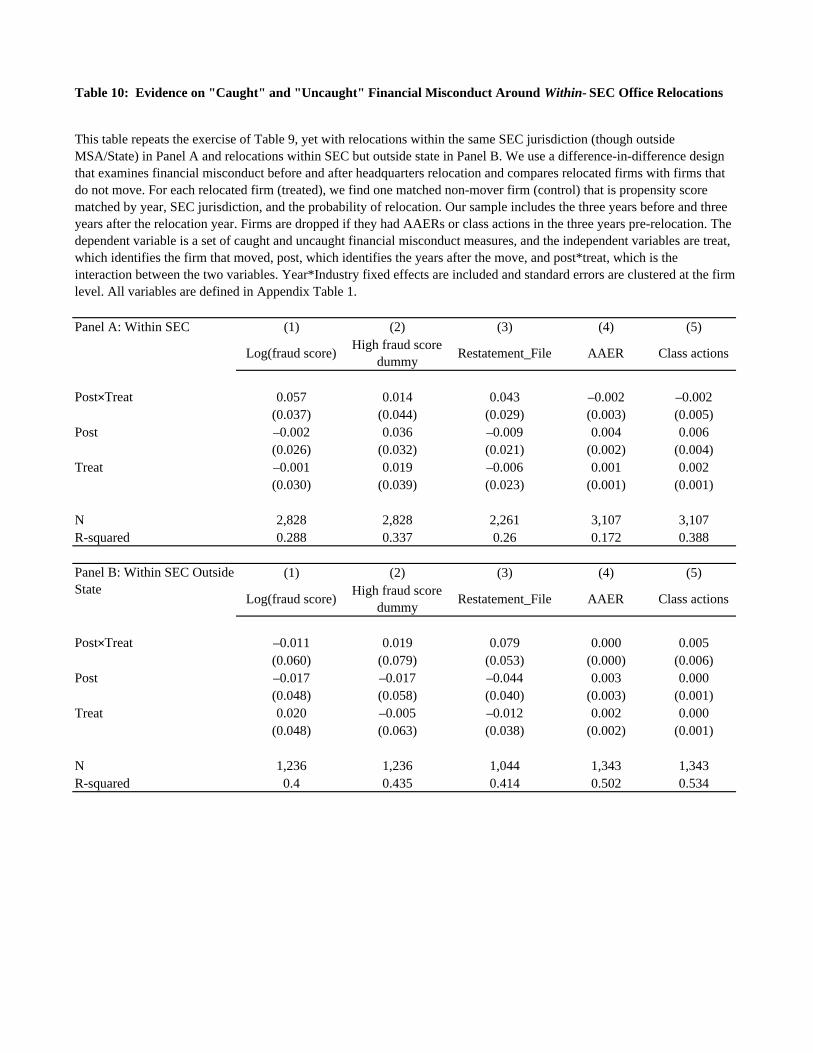
Panel A: Within SEC (1) (2) (3) (4) (5)
Log(fraud score) High fraud score dummy Restatement_File AAER Class actions
Post×Treat 0.057 0.014 0.043 –0.002 –0.002(0.037) (0.044) (0.029) (0.003) (0.005)
Post –0.002 0.036 –0.009 0.004 0.006(0.026) (0.032) (0.021) (0.002) (0.004)
Treat –0.001 0.019 –0.006 0.001 0.002(0.030) (0.039) (0.023) (0.001) (0.001)
N 2,828 2,828 2,261 3,107 3,107R-squared 0.288 0.337 0.26 0.172 0.388
(1) (2) (3) (4) (5)
Log(fraud score) High fraud score dummy Restatement_File AAER Class actions
Post×Treat –0.011 0.019 0.079 0.000 0.005(0.060) (0.079) (0.053) (0.000) (0.006)
Post –0.017 –0.017 –0.044 0.003 0.000(0.048) (0.058) (0.040) (0.003) (0.001)
Treat 0.020 –0.005 –0.012 0.002 0.000(0.048) (0.063) (0.038) (0.002) (0.001)
N 1,236 1,236 1,044 1,343 1,343R-squared 0.4 0.435 0.414 0.502 0.534
Table 10: Evidence on "Caught" and "Uncaught" Financial Misconduct Around Within- SEC Office Relocations
This table repeats the exercise of Table 9, yet with relocations within the same SEC jurisdiction (though outside MSA/State) in Panel A and relocations within SEC but outside state in Panel B. We use a difference-in-difference design that examines financial misconduct before and after headquarters relocation and compares relocated firms with firms that do not move. For each relocated firm (treated), we find one matched non-mover firm (control) that is propensity score matched by year, SEC jurisdiction, and the probability of relocation. Our sample includes the three years before and three years after the relocation year. Firms are dropped if they had AAERs or class actions in the three years pre-relocation. The dependent variable is a set of caught and uncaught financial misconduct measures, and the independent variables are treat, which identifies the firm that moved, post, which identifies the years after the move, and post*treat, which is the interaction between the two variables. Year*Industry fixed effects are included and standard errors are clustered at the firm level. All variables are defined in Appendix Table 1.
Panel B: Within SEC Outside State

(1) (2) (3) (4) (5)
Log(fraud score) –13.027*** (4.520)
High fraud score dummy –1.262 (4.970)
Restatement_Class –2.797 (5.594)
Abnormal accrurals –10.342** (5.073)
ROA –14.603 –18.957 –3.819 –19.848* (11.301) (11.462) (2.559) (10.918)
Market-to-book –2.325*** –2.643*** –1.659** –2.335***(0.783) (0.892) (0.828) (0.866)
Sales growth 11.347 15.065 12.196 18.409** (8.169) (9.615) (7.815) (8.051)
Log (age) 3.186 4.259 2.326 3.347(2.964) (3.098) (2.580) (2.894)
Log (sales) –2.497* –2.152 –1.693 –1.259(1.438) (1.577) (1.249) (1.431)
Industry cluster 0.170 0.086 0.520 0.034(1.388) (1.359) (1.221) (1.260)
Constant 4.101** 19.498** 7.693 8.006 7.058(0.188) (8.265) (8.148) (7.287) (7.565)
Year FE Y Y Y Y Y
N 145 100 100 121 113R-squared 0.000 0.277 0.202 0.110 0.164
Table 11: Cumulative Abnormal Returns around Relocation Announcements
This table presents OLS regressions on the move announcement Cumulative Abnormal Returns (CAR). The dependent variable measures the CAR in the 11-day window [–5,+5] computed using a four-factor model to calculate benchmark returns. Explanatory variables are taken from the fiscal year before the headquarters relocation. Our sample comprises Compustat firm-years that have moved between 1998 and 2005, and for which we are able to identify the data of the move announcement. Year fixed effects are included and robust standard errors are calculated. All variables are defined in Appendix Table 1.
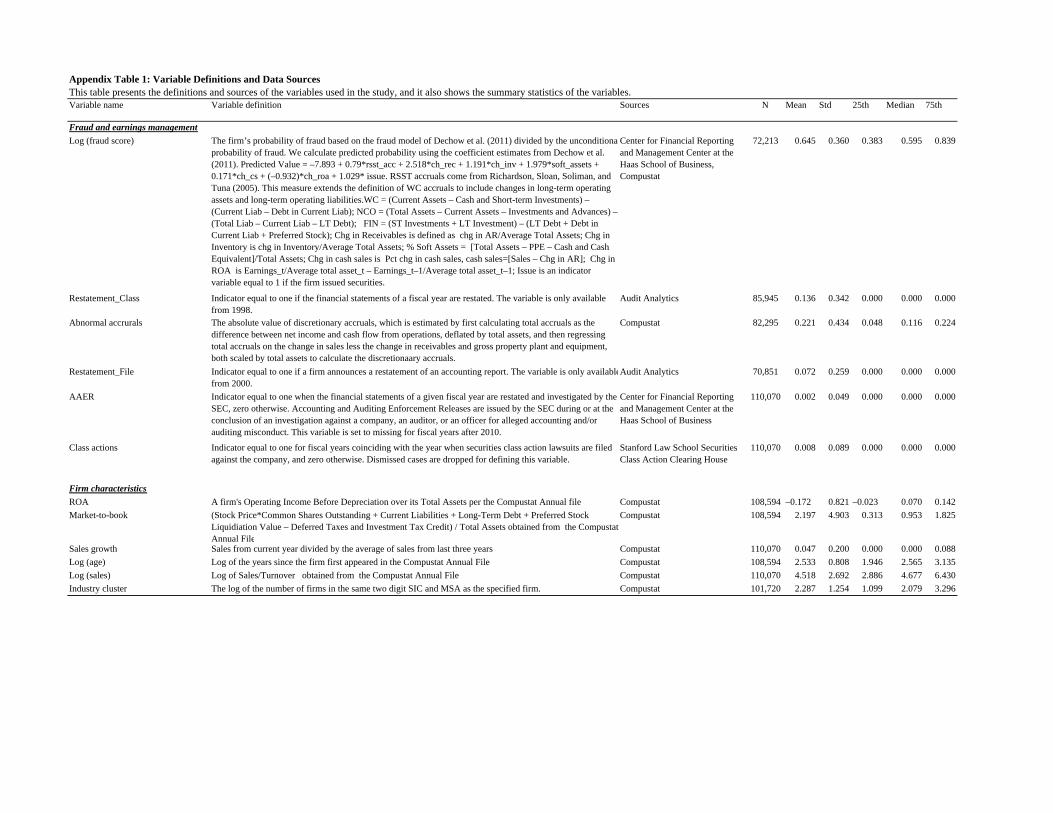
Appendix Table 1: Variable Definitions and Data Sources
Variable name Variable definition Sources N Mean Std 25th Median 75th
Log (fraud score) The firm’s probability of fraud based on the fraud model of Dechow et al. (2011) divided by the unconditionaprobability of fraud. We calculate predicted probability using the coefficient estimates from Dechow et al. (2011). Predicted Value = –7.893 + 0.79*rsst_acc + 2.518*ch_rec + 1.191*ch_inv + 1.979*soft_assets + 0.171*ch_cs + (–0.932)*ch_roa + 1.029* issue. RSST accruals come from Richardson, Sloan, Soliman, and Tuna (2005). This measure extends the definition of WC accruals to include changes in long-term operating assets and long-term operating liabilities.WC = (Current Assets – Cash and Short-term Investments) – (Current Liab – Debt in Current Liab); NCO = (Total Assets – Current Assets – Investments and Advances) – (Total Liab – Current Liab – LT Debt); FIN = (ST Investments + LT Investment) – (LT Debt + Debt in Current Liab + Preferred Stock); Chg in Receivables is defined as chg in AR/Average Total Assets; Chg in Inventory is chg in Inventory/Average Total Assets; % Soft Assets = [Total Assets – PPE – Cash and Cash Equivalent]/Total Assets; Chg in cash sales is Pct chg in cash sales, cash sales=[Sales – Chg in AR]; Chg in ROA is Earnings_t/Average total asset_t – Earnings_t–1/Average total asset_t–1; Issue is an indicator variable equal to 1 if the firm issued securities.
Center for Financial Reporting and Management Center at the Haas School of Business, Compustat
72,213 0.645 0.360 0.383 0.595 0.839
Restatement_Class Indicator equal to one if the financial statements of a fiscal year are restated. The variable is only available from 1998.
Audit Analytics 85,945 0.136 0.342 0.000 0.000 0.000
Abnormal accrurals The absolute value of discretionary accruals, which is estimated by first calculating total accruals as the difference between net income and cash flow from operations, deflated by total assets, and then regressing total accruals on the change in sales less the change in receivables and gross property plant and equipment, both scaled by total assets to calculate the discretionaary accruals.
Compustat 82,295 0.221 0.434 0.048 0.116 0.224
Restatement_File Indicator equal to one if a firm announces a restatement of an accounting report. The variable is only availablefrom 2000.
Audit Analytics 70,851 0.072 0.259 0.000 0.000 0.000
AAER Indicator equal to one when the financial statements of a given fiscal year are restated and investigated by the SEC, zero otherwise. Accounting and Auditing Enforcement Releases are issued by the SEC during or at the conclusion of an investigation against a company, an auditor, or an officer for alleged accounting and/or auditing misconduct. This variable is set to missing for fiscal years after 2010.
Center for Financial Reporting and Management Center at the Haas School of Business
110,070 0.002 0.049 0.000 0.000 0.000
Class actions Indicator equal to one for fiscal years coinciding with the year when securities class action lawsuits are filed against the company, and zero otherwise. Dismissed cases are dropped for defining this variable.
Stanford Law School Securities Class Action Clearing House
110,070 0.008 0.089 0.000 0.000 0.000
ROA A firm's Operating Income Before Depreciation over its Total Assets per the Compustat Annual file Compustat 108,594 –0.172 0.821 –0.023 0.070 0.142Market-to-book (Stock Price*Common Shares Outstanding + Current Liabilities + Long-Term Debt + Preferred Stock
Liquidiation Value – Deferred Taxes and Investment Tax Credit) / Total Assets obtained from the Compustat Annual File
Compustat 108,594 2.197 4.903 0.313 0.953 1.825
Sales growth Sales from current year divided by the average of sales from last three years Compustat 110,070 0.047 0.200 0.000 0.000 0.088Log (age) Log of the years since the firm first appeared in the Compustat Annual File Compustat 108,594 2.533 0.808 1.946 2.565 3.135Log (sales) Log of Sales/Turnover obtained from the Compustat Annual File Compustat 110,070 4.518 2.692 2.886 4.677 6.430Industry cluster The log of the number of firms in the same two digit SIC and MSA as the specified firm. Compustat 101,720 2.287 1.254 1.099 2.079 3.296
This table presents the definitions and sources of the variables used in the study, and it also shows the summary statistics of the variables.
Firm characteristics
Fraud and earnings management

Appendix Table 2: List of SEC Regional Offices and AAERs by Regional Offices
SEC offices States of jurisdication# of states covered
Areas covered (km2)
# of firms Compustat covered
(annual average)
Atlanta GA, NC, SC, TN, AL 5 623,146 455Boston CT, MA, ME, NH, VT, RI 6 186,458 527Chicago IL, IN, IA, KY, MI, MN, MO, OH, WI 9 1,436,654 1,150Denver CO, KS, NE, NM, ND, SD, WY 7 1,634,136 266Fort Worth TX, OK, AR 3 1,014,388 653Los Angeles AZ, GU, HI, NV, CA(ZIP<=93599 except for 93200–93299) 5 822,450 1,256Miami FL, MS, LA, VI, PR 5 439,452 397New York NY, NJ 2 163,887 924Philadelphia PA, DE, MD, VA, WV, DC 6 331,580 632Salt Lake City UT 1 219,887 71San Francisco WA, AK, OR, ID, MT, CA(ZIP>=93600 & 93200–93299) 6 2,966,593 1,301

Appendix Table 3: Directors at Regional SEC Offices
SEC offices Name of director appointedYear of appointment
startYear of
appointment endYear of joining
SECAtlanta Richard Wessel 1987 2006 1973Atlanta Katherine Addleman 2007 2009 1986Atlanta Rhea Kemble Dignam 2010 2015 2010Atlanta Walter Jospin 2015 Present 1980Boston Juan M Marcelino 1993 2003 1984Boston Peter H Bresnan 2003 2004 1995Boston Walter G Ricciardi 2004 2006 2004Boston David P Bergers 2006 2013 1998Boston Paul Levenson 2013 Present 2013Chicago Mary Keefe 1994 2003 1982Chicago Merri Jo Gillette 2004 2013 1986Chicago David A Glockner 2013 Present 2013Denver Robert H Davenport 1974 1996 1958Denver Daniel F Shea 1996 1999 N/ADenver Randall J Fons 2000 2006 1988Denver George Curtis 2006 2008 2006Denver Donald Hoerl 2009 2013 1982Denver Julie K Lutz 2013 Present 1977Fort Worth T Christopher Browne 1986 1995 N/AFort Worth Harold F Degenhardt 1996 2005 1996Fort Worth James Clarkson 2005 2006 1969Fort Worth Rose Romero 2006 2011 2006Fort Worth David Woodcock 2011 Present 2011Los Angeles Elaine M Cacheris 1992 1997 1984Los Angeles Valerie Caproni 1998 2000 1998Los Angeles Randall R Lee 2001 2007 2001Los Angeles Rosalind Tyson 2007 2008 1982Los Angeles Martin Murphy 2009 2012 1990Los Angeles Michele Wein Layne 2009 Present 1995Miami Charles V Senatore 1994 1997 1994Miami Randall J Fons 1997 1999 1988Miami David Nelson 2000 2009 1997Miami Eric I Bustillo 2009 Present 1990New York Richard H Walker 1991 1996 1991New York Carmen J Lawrence 1996 2000 1981New York Wayne Carlin 2000 2004 1993New York Mark K Schonfeld 2004 2008 1996New York George Canellos 2009 2012 2009New York Andrew Calamari 2012 Present 2000Philadelphia Donald Hoerl 1993 1995 1982Philadelphia (Vacant)Philadelphia Ronald Long 1997 2002 1990Philadelphia Arthur Gabinet 2003 2005 2002Philadelphia Joy Thompson 2005 2006 1986Philadelphia Daniel Hawke 2006 2014 1999Philadelphia Sharon Binger 2014 Present 2008Salt Lake Kenneth Israel 1994 2013 1975Salt Lake Karen L Martinez 2013 Present 2002San Francisco David Bayless 1994 1999 1994San Francisco Helane L Morrison 1999 2007 1996San Francisco Marc Fagel 2008 2013 1997San Francisco Jina L Choi 2013 Present 2000