Paper SAS4060-2016 Location, Location, Location...
8
1 Paper SAS4060-2016 Location, Location, Location—Analytics with SAS® Visual Analytics and ESRI Murali Nori and Himesh Patel, SAS Institute Inc ABSTRACT Business Intelligence users analyze business data in a variety of ways. Location information is a big part of business data. It is essential to combine location information, mapping and data from multiple sources like enterprise data, social media data and demographic data to provide in-depth analytical insight. New analytical capabilities are added to SAS® Visual Analytics, leveraging the new partnership with ESRI, a leader in location intelligence and mapping. The new capabilities enable users to enhance the analytical insights from SAS Visual Analytics. This paper demonstrates and discusses the new partnership with ESRI and the new capabilities added to SAS Visual Analytics. INTRODUCTION Traditionally, business intelligence systems try to answer questions related to business KPIs like profit, inventory, COGS, customer churn, burn rate. Often the focus is on the visualization of data for questions like what products are being sold. When the products are being sold, who is buying the products, what is the profit or loss, and what is the current inventory. These questions are important to a business, but business data has a good amount of location related information. Such information includes where products are sold, where your customers live, or, more interestingly, where are the profitable and happy customers? Visualization of customer data on a map is the first step to a better understanding and usage of business data that contains location information. But the journey to more advanced location analytics does not stop with just mapping. The vision and goal of SAS and SAS Visual Analytics is to enable customers to seamlessly use location visualization combined with business data to perform analytics. SAS Visual Analytics plans to enrich the location analytics by integrating mapping with SAS analytics so that business users can analyze their data using mapping as an input and, conversely, they can visualize analytical output on a map. Going beyond traditional mapping, SAS Visual Analytics plans to provide more advanced analytics. These advanced analytics include “Drive time Analysis,” “Drive distance analysis,” Geo search, and the use of ESRI Geo coding and data enrichment, which includes demographic data. SAS has signed a new partnership with ESRI, a global leader in GIS systems. With the combination of SAS analytics and ESRI GIS capabilities, customers can get a unified solution for ad-hoc data exploration, reporting, and location based analytics. This session focuses on the new functionality planned for SAS Visual Analytics 8.1. It is important to note that the functionality described below is available only in Visual Analytics 8.1 and beyond. SAS VISUAL ANALYTICS INTEGRATION WITH ESRI ARCGISONLINE Starting with SAS Visual Analytics 8.1, SAS administrators can make ESRI ArcGIS Online their default mapping provider. ACCESSING DIFFERENT LEVELS OF FUCTIONALITY The integration of SAS Visual Analytics with ESRI allows users to access different levels of functionality from ESRI. Some features are free for all users. Some features are premium features.
Transcript of Paper SAS4060-2016 Location, Location, Location...
1
Paper SAS4060-2016
Location, Location, Location—Analytics with SAS® Visual Analytics and ESRI
Murali Nori and Himesh Patel, SAS Institute Inc
ABSTRACT
Business Intelligence users analyze business data in a variety of ways. Location information is a big part of business data. It is essential to combine location information, mapping and data from multiple sources like enterprise data, social media data and demographic data to provide in-depth analytical insight. New analytical capabilities are added to SAS® Visual Analytics, leveraging the new partnership with ESRI, a leader in location intelligence and mapping. The new capabilities enable users to enhance the analytical insights from SAS Visual Analytics. This paper demonstrates and discusses the new partnership with ESRI and the new capabilities added to SAS Visual Analytics.
INTRODUCTION
Traditionally, business intelligence systems try to answer questions related to business KPIs like profit, inventory, COGS, customer churn, burn rate. Often the focus is on the visualization of data for questions like what products are being sold. When the products are being sold, who is buying the products, what is the profit or loss, and what is the current inventory. These questions are important to a business, but business data has a good amount of location related information. Such information includes where products are sold, where your customers live, or, more interestingly, where are the profitable and happy customers?
Visualization of customer data on a map is the first step to a better understanding and usage of business data that contains location information. But the journey to more advanced location analytics does not stop with just mapping. The vision and goal of SAS and SAS Visual Analytics is to enable customers to seamlessly use location visualization combined with business data to perform analytics. SAS Visual Analytics plans to enrich the location analytics by integrating mapping with SAS analytics so that business users can analyze their data using mapping as an input and, conversely, they can visualize analytical output on a map.
Going beyond traditional mapping, SAS Visual Analytics plans to provide more advanced analytics. These advanced analytics include “Drive time Analysis,” “Drive distance analysis,” Geo search, and the use of ESRI Geo coding and data enrichment, which includes demographic data.
SAS has signed a new partnership with ESRI, a global leader in GIS systems. With the combination of SAS analytics and ESRI GIS capabilities, customers can get a unified solution for ad-hoc data exploration, reporting, and location based analytics.
This session focuses on the new functionality planned for SAS Visual Analytics 8.1. It is important to note that the functionality described below is available only in Visual Analytics 8.1 and beyond.
SAS VISUAL ANALYTICS INTEGRATION WITH ESRI ARCGISONLINE
Starting with SAS Visual Analytics 8.1, SAS administrators can make ESRI ArcGIS Online their default mapping provider.
ACCESSING DIFFERENT LEVELS OF FUCTIONALITY
The integration of SAS Visual Analytics with ESRI allows users to access different levels of functionality from ESRI. Some features are free for all users. Some features are premium features.
2
Free features: Free features are features that SAS Visual Analytics and ESRI provide to all users, and customers do not need a special license:
Unlimited access to any base map from ESRI.
Geo search. The map interface exposes a search feature similar to many online mapping tools.
Ad-hoc selection of data points on a map. Users are able to use the three selection options to highlight any area on a map.
Premium feature: Some features are not free from ESRI. The features that require license and credits from ESRI are called premium features. SAS Visual Analytics provides the integration so from SAS there is not special licensing required but the customers using Visual Analytics will require licensing and credits from ESRI. Premium features require a license and credits from ESRI. Integration with SAS Visual Analytics does not require a SAS license. Some examples of premium features are:
Drive by time analysis: The ability to find all data points on a map that are a certain driving time from a given point.
Drive by distance analysis: The ability to find all data points on a map that are a certain driving distance from a given point.
Geo coding: The ability to import geo coded data and create custom shapes from ESRI
DIFFERENT LOGIN LEVELS
Because there are different levels of functionality made available by ESRI, SAS Visual Analytics enables you set permissions on a per user basis.
AD-HOC DATA SELECTION ON MAPS
On an ESRI map in SAS Visual Analytics, users can easily perform data selection on the map. There are three different ways users can do ad-hoc data selection.
1. Using a Circle
2. Using a Rectangle
3. Using a polygon
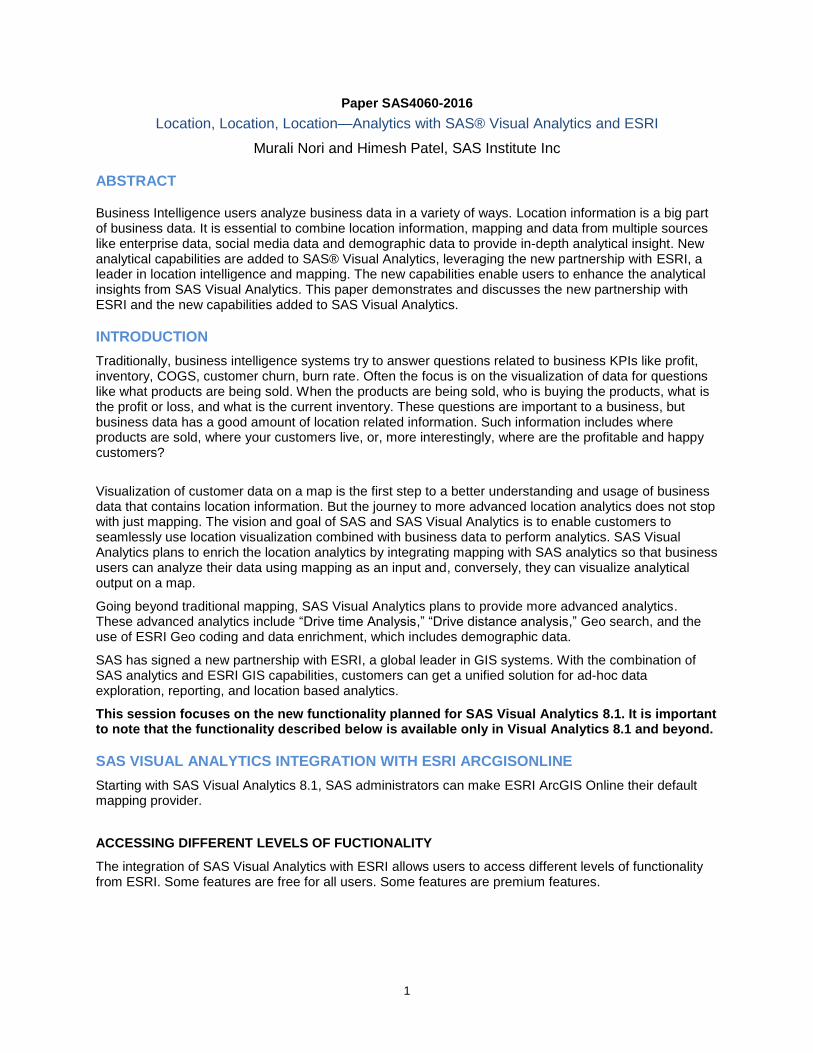
Refer to Figure 1. Using any of the three selection techniques, you can highlight any area of interest on a map. Next, you can perform further analysis on the selected data points. Because SAS Visual Analytics can perform sophisticated analysis, this ability to use map data as an input to analytics is powerful and enhances the ability of business users to quickly glean insights about your data..
3
Figure 1. Three selection options
GEO SEARCH
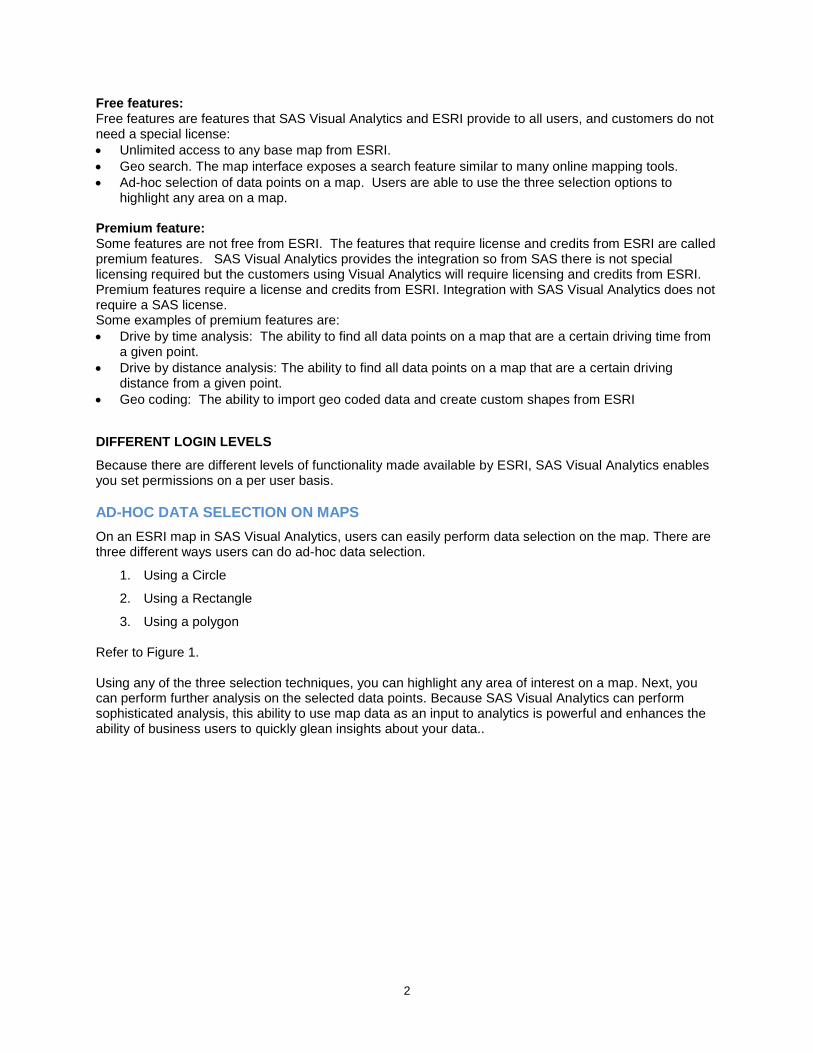
A new search interface is added to the maps that enables you to search for points of interest. For example, search for “Pizza Hut” and all the Pizza Hut locations are marked on the map.
This search functionality is free for all users of SAS Visual Analytics. The search results are from ESRI Search.
Figure 2. The search interface
4
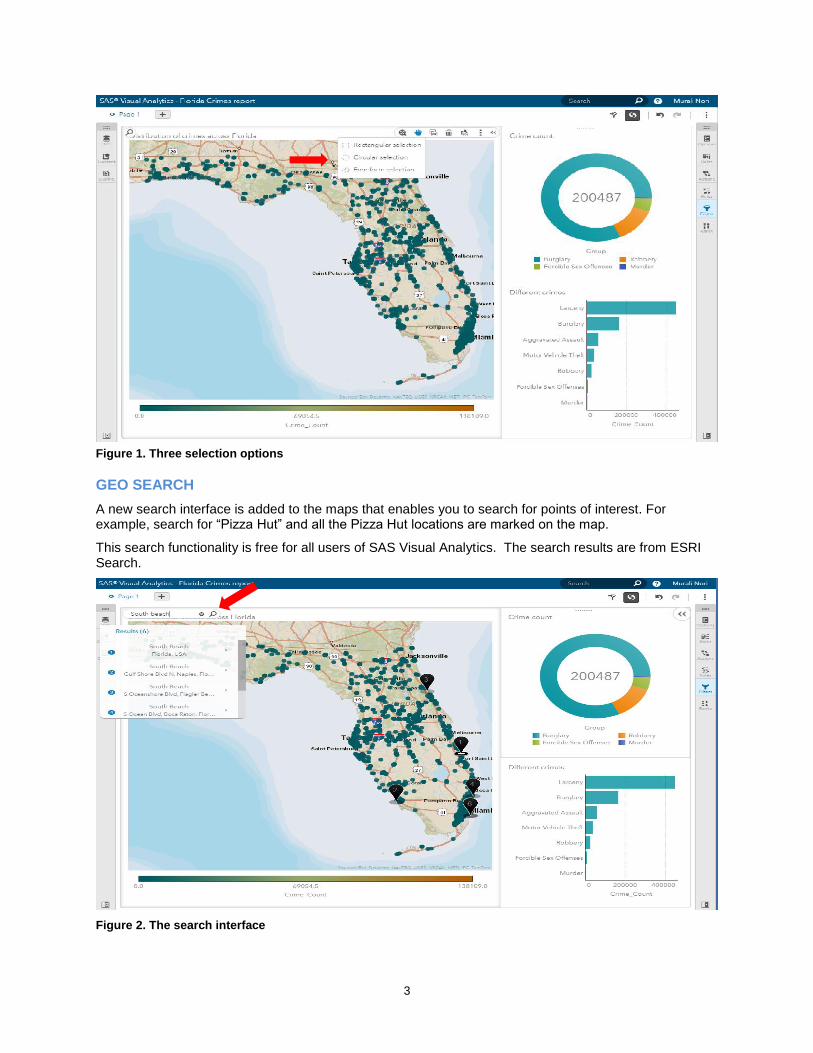
DRIVE TIME ANALYSIS OR TRAVEL ANALYTICS
Drive time analysis is the ability to find all points on the map that are certain distance or time from a given, selected point on a map. When you select a point on the map and perform drive time analysis, a polygon is drawn on the map that reflects the routes that you can drive in the given time or distance. This polygon is created by ESRI and is drawn by SAS Visual Analytics.
There are three types of analysis that can be done.
Drive by distance
Drive by time
Straight line distance
Figure 3. The distance options
DRIVE BY TIME
A drive by time analysis enables you to select a point on the map and locate all other points that can be reached within the given time. You can specify multiple drive times, and each set of points is indicated by its own polygon. Each polygon is shaded differently.
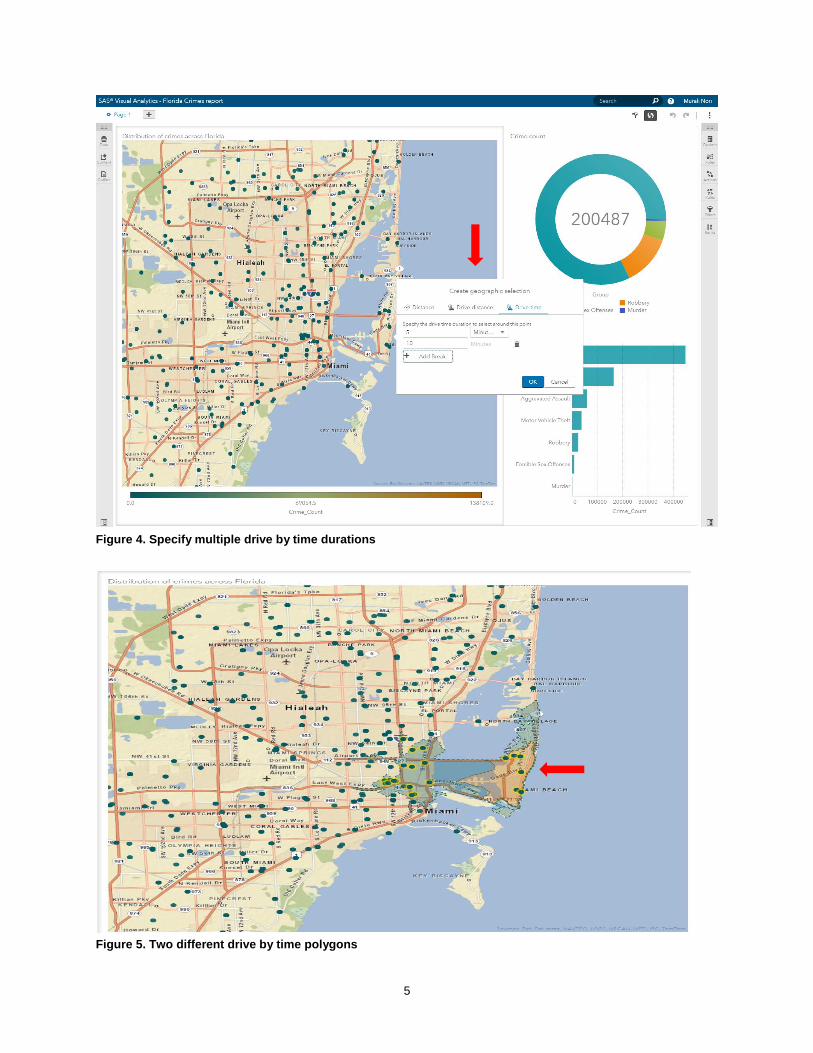
5
Figure 4. Specify multiple drive by time durations
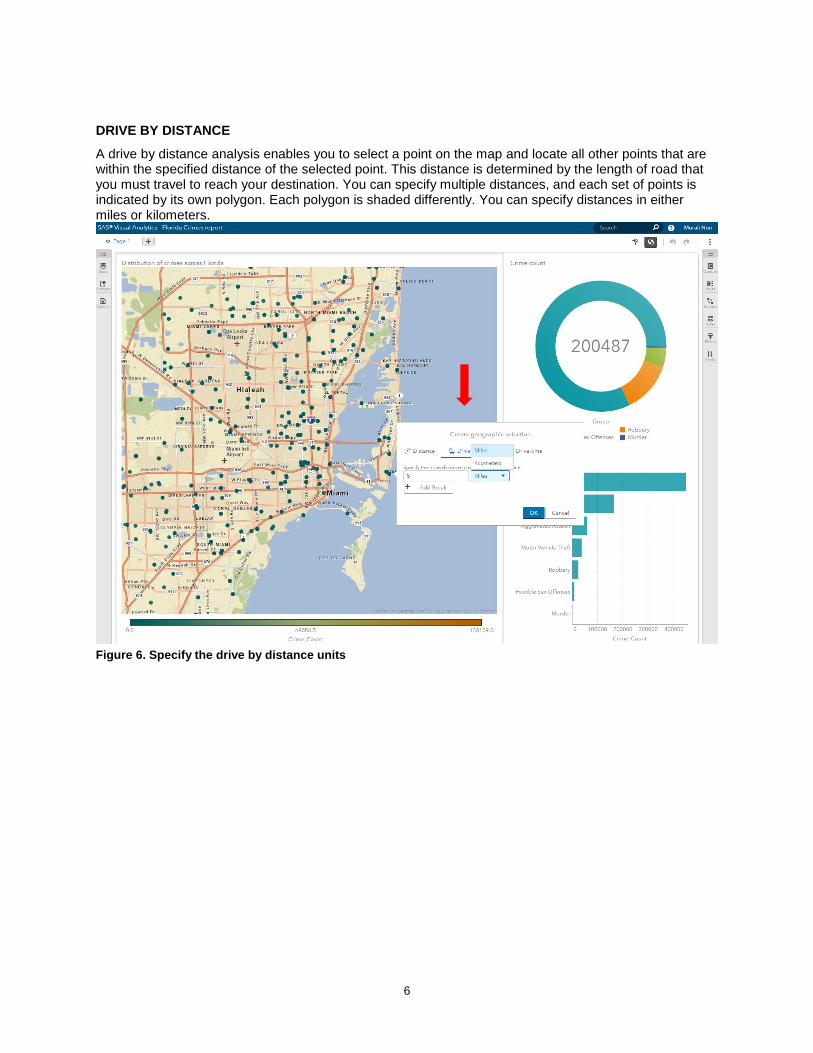
Figure 5. Two different drive by time polygons
6
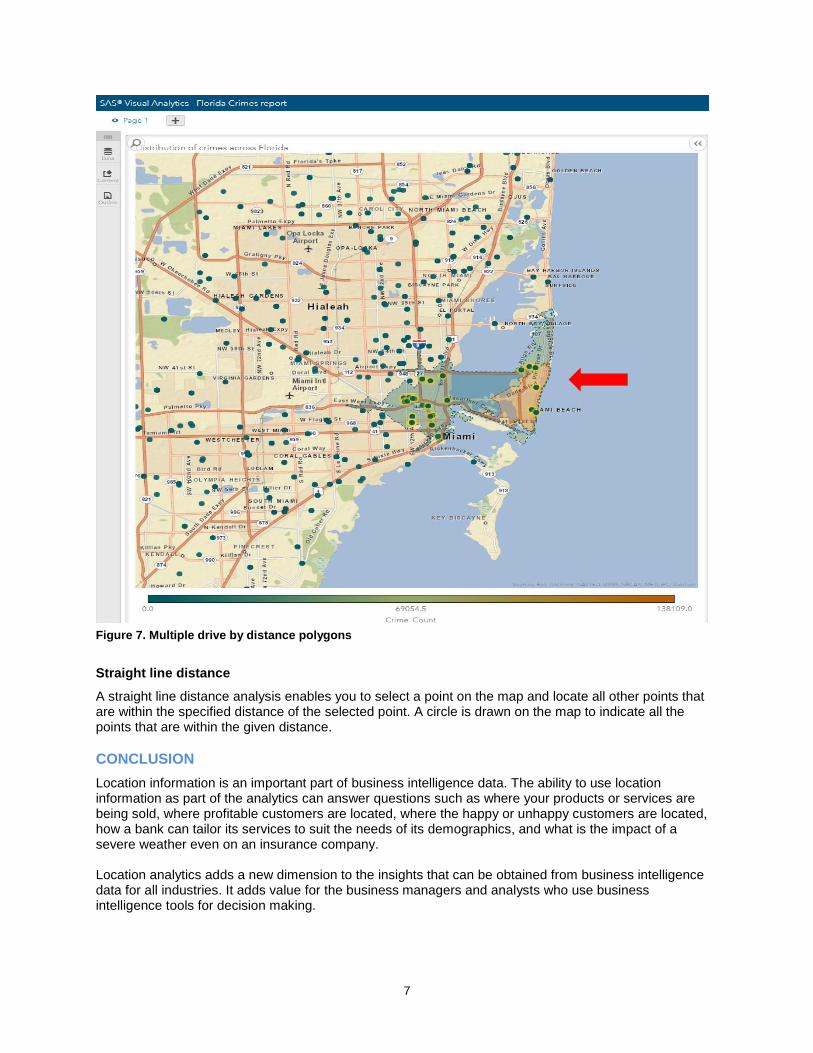
DRIVE BY DISTANCE
A drive by distance analysis enables you to select a point on the map and locate all other points that are within the specified distance of the selected point. This distance is determined by the length of road that you must travel to reach your destination. You can specify multiple distances, and each set of points is indicated by its own polygon. Each polygon is shaded differently. You can specify distances in either miles or kilometers.
Figure 6. Specify the drive by distance units
7
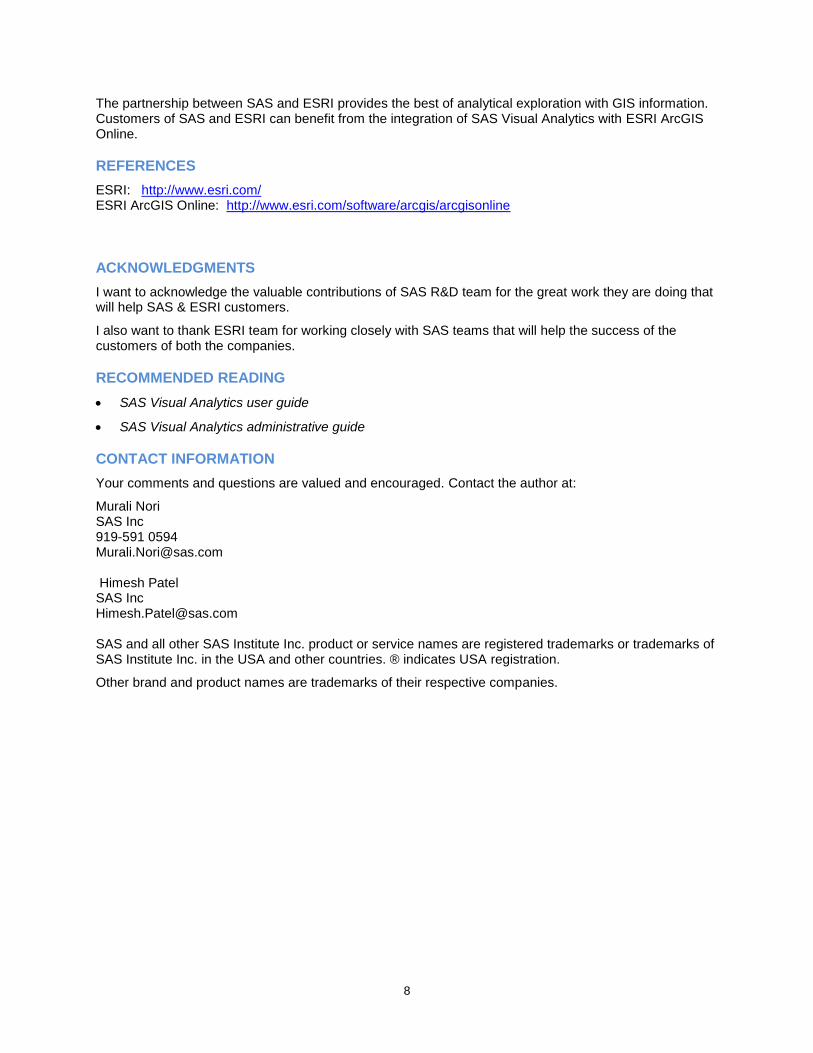
Figure 7. Multiple drive by distance polygons
Straight line distance
A straight line distance analysis enables you to select a point on the map and locate all other points that are within the specified distance of the selected point. A circle is drawn on the map to indicate all the points that are within the given distance.
CONCLUSION
Location information is an important part of business intelligence data. The ability to use location information as part of the analytics can answer questions such as where your products or services are being sold, where profitable customers are located, where the happy or unhappy customers are located, how a bank can tailor its services to suit the needs of its demographics, and what is the impact of a severe weather even on an insurance company. Location analytics adds a new dimension to the insights that can be obtained from business intelligence data for all industries. It adds value for the business managers and analysts who use business intelligence tools for decision making.
8
The partnership between SAS and ESRI provides the best of analytical exploration with GIS information. Customers of SAS and ESRI can benefit from the integration of SAS Visual Analytics with ESRI ArcGIS Online.
REFERENCES
ESRI: http://www.esri.com/ ESRI ArcGIS Online: http://www.esri.com/software/arcgis/arcgisonline
ACKNOWLEDGMENTS
I want to acknowledge the valuable contributions of SAS R&D team for the great work they are doing that will help SAS & ESRI customers.
I also want to thank ESRI team for working closely with SAS teams that will help the success of the customers of both the companies.
RECOMMENDED READING
SAS Visual Analytics user guide
SAS Visual Analytics administrative guide
CONTACT INFORMATION
Your comments and questions are valued and encouraged. Contact the author at:
Murali Nori SAS Inc 919-591 0594 [email protected] Himesh Patel SAS Inc [email protected]
SAS and all other SAS Institute Inc. product or service names are registered trademarks or trademarks of SAS Institute Inc. in the USA and other countries. ® indicates USA registration.
Other brand and product names are trademarks of their respective companies.