ScaleOut hServerv2: Enabling Real-Time Analytics Using Hadoop Map/Reduce

1
Paper SAS1957-2015
Meter Data Analytics—Enabling Actionable Decisions to Derive Business Value from Smart Meter Data
Tom Anderson and Jennifer Whaley, SAS Institute Inc.
ABSTRACT
A utility’s meter data is a valuable asset that can be daunting to leverage. Consider that one household or premise can produce over 35,000 rows of information, consisting of over 8 MB of data per year. Thirty thousand meters collecting fifteen-minute-interval data with forty variables equates to 1.2 billion rows of data. Using SAS® Visual Analytics, we provide examples of leveraging smart meter data to address business around revenue protection, meter operations, and customer analysis. Key analyses include identifying consumption on inactive meters, potential energy theft, and stopped or slowing meters; and support of all customer classes (for example, residential, small commercial, and industrial) and their data with different time intervals and frequencies.
INTRODUCTION
Analyzing the health of a utility service provider, whether gas or electric, involves the collection of data in multiple sources in multiple formats and from several physical data repository locations. Using SAS® software for smart grid data analysis enables the utility to maximize value from disparate data sources that can be organized into analytical data stores, enabling utilities to gain thorough insight on customers’ consumption and behavior.
With SAS® Visual Analytics, interactive visualization environments are optimized for discovery—a critical step for any analysis and an ongoing means of knowing what additional questions to ask and methods to try to distill more value from data. Discovery paves the way for the best problem formulation and helps reveal additional opportunities. SAS® Visual Analytics provides the following features:
Decision-making based on interactive statistical insights using advanced analytics and exploratory data analysis
A comprehensive set of advanced statistical analysis tools that produce repeatable results that are easily documented and verified
The ability to handle large, disparate data sources so that all available data can be leveraged for analysis
A point-and-click interface that leverages core SAS capabilities, including analytics, stored services, SAS code, reports, output, and integrated metadata
Visual querying, data filtering, and extensible visual analytics
But why are smart meter analytics important? Consider the following:
Utilities now have the ability to see consumption patterns in granular detail, allowing them to identify potential cases of fraud or energy theft. This has a direct bottom-line impact on reducing bad debt of the utility.
Additional granular consumption data can improve hierarchical load forecasting and sharpen the financial pencil for both planners and traders.
Energy companies can now engage in more interactive demand management programs with customers, providing them with options for time-of-use billing or peak power incentives.
The additional insights from the data provide more ability to segment customers in areas of high load growth, leading to a better understanding of future capital expansion needs.

2
SAS® VISUAL ANALYTICS
Data visualization helps you explore and make sense of your data. Adding analytics to your visualizations helps discover insights buried in your data, such as trends that affect the bottom line and outliers that identify problems. By combining dashboards, reporting, business intelligence, and analytics, SAS® Visual Analytics provides both data visualization and analytic visualization. SAS® Visual Analytics combines powerful in-memory technologies with an extremely easy-to-use exploration interface and drag-and-drop analytics capabilities. No coding is required.
SAS® Visual Analytics empowers organizations to explore huge volumes of data very quickly to identify patterns and trends and to identify opportunities for further analysis. SAS® Visual Data Builder (the data builder) enables users to summarize data, join data, and enhance the predictive power of their data. Users can prepare data for exploration and mining quickly and easily. The highly visual, drag-and-drop data interface of SAS® Visual Analytics Explorer (the explorer) enables organizations to derive value from massive amounts of data. SAS® Visual Analytics Designer (the designer) enables users to quickly create reports or dashboards, which can be viewed on a mobile device or on the web (Figure 1).
Figure 1 - SAS® Visual Analytics Components
SMART METER DATA
A utility’s meter data is a valuable asset that can be daunting to leverage. Consider that one meter can produce over 35,000 rows of information, consisting of over 8 MB of data per year. Thirty thousand meters collecting fifteen-minute-interval data with forty variables equates to 1.2 billion rows of data. The following addresses variety, volume, and velocity of smart meter data.
VARIETY
Utilities collect data from meters, outage management systems, weather stations, and customer information systems every minute of every day. The case studies provided in this paper are the result of combining these types of data. While some of this information is in standard data formats (for example, customer information system, meter management system, geographical information system, customer demographics), most are transactional or time series oriented. The transactional and time series data contribute to the velocity of big data at utilities today.
Data sources are varied and include the following examples:
Customer information system (CIS)
Meter management system (MMS)
Meter interval (consumption kWh/kVar)
Commercial/industrial codes
Outage management system (OMS)

3
Weather data
End use survey
Customer demographics and PRIZM codes
Geographical information system (GIS)
VELOCITY
Next, consider transactional and time series data. They have two distinct collection patterns. Transactional data is time-stamped data that is collected over time at no particular frequency. An example of this is meter events that might occur randomly sub-seconds apart. By contrast, time series data is time-stamped data that is collected over time at a specific frequency. An example of this is meters reading at 15-minute intervals or weather data collected every hour.
Smart meter data can encompass many types of interval data from different meter vendors. SAS has procedures for collecting and manipulating interval data so that these disparate sources can be analyzed as one. SAS® Visual Analytics enables you to understand trends and seasonal variation in load patterns with respect to other interval data that might not be on the same frequency.
Using SAS time series procedures, utilities are able to easily transform interval data to a specified interval.
• Year – yearly
• Semi-year – semiannual
• Quarter – quarterly
• Month – monthly
• Semi-month – 1st and 16th of each month
• Ten days – 1st, 11th, and 21st of each month
• Week – weekly
• Weekday – daily, ignoring weekend days
• Day – daily
• Hour – hourly
• Minute – every minute
• Second – every second
Figure 2 shows levels of interval data being represented in one dashboard. Event counts correlating with outages, event descriptions, and times to the second are displayed on the bottom left. Outage and load are shown by date, and a pie chart displays frequency of event categories. A daily report like this can provide alerts and quick insight to operations engineers about what is occurring and where incidents may be likely.

4
Figure 2 - Interval Analysis
VOLUME OF DATA
As information is collected, it is stored in systems of record such as MMS, OMS and CIS. Relational databases, data appliances, and file storage systems like Hadoop are used for storage. Using SAS/ACCESS® engines, utilities are able to not only access that data but leverage the existing hardware and database for optimal performance and in-database analytics.
In one example, analyzing transformers for system reliability has the potential to involve hundreds of GBs of data consisting of the following:
Transformer lookup (meters/transformers/circuits)
Momentary (disturbance in service)
Outages (system downtime)
Weather (station hourly reads)
Potential repairs (workflow/order systems)
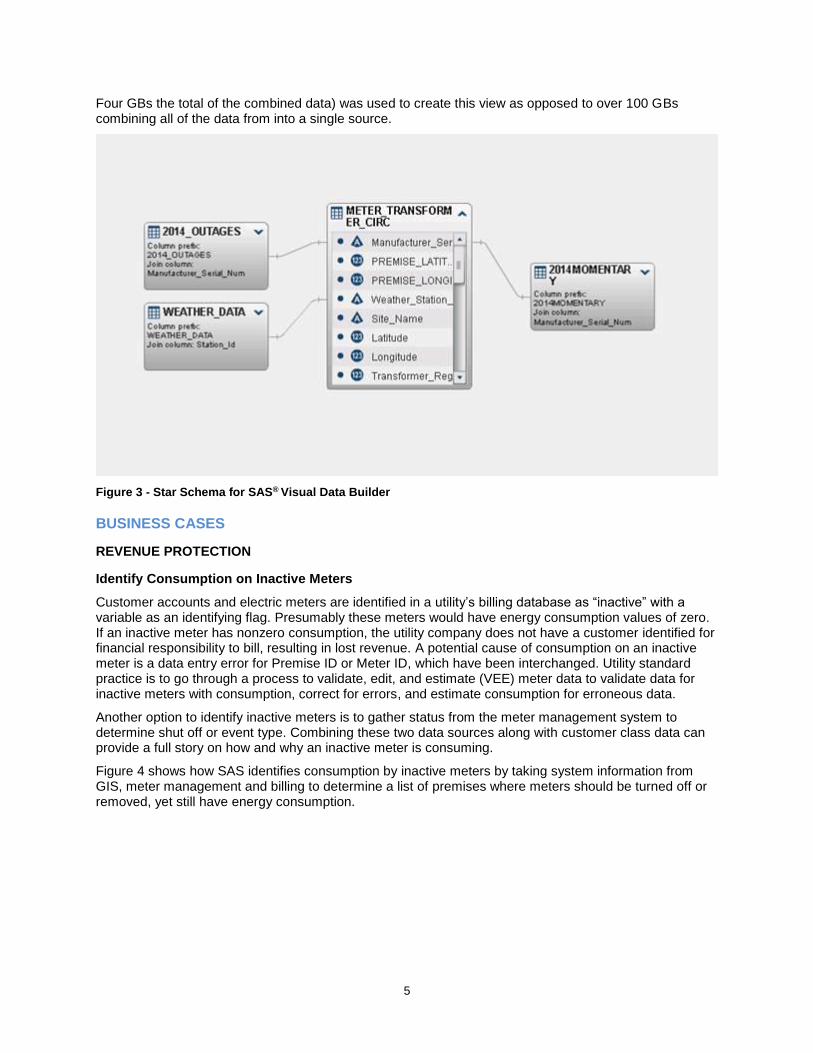
SAS® Visual Analytics enables you to combine these sources into a single view from a star schema, as shown in Figure 3. This technique avoids replicating data and reduces storage requirements dramatically.
5
Four GBs the total of the combined data) was used to create this view as opposed to over 100 GBs combining all of the data from into a single source.
Figure 3 - Star Schema for SAS® Visual Data Builder
BUSINESS CASES
REVENUE PROTECTION
Identify Consumption on Inactive Meters
Customer accounts and electric meters are identified in a utility’s billing database as “inactive” with a variable as an identifying flag. Presumably these meters would have energy consumption values of zero. If an inactive meter has nonzero consumption, the utility company does not have a customer identified for financial responsibility to bill, resulting in lost revenue. A potential cause of consumption on an inactive meter is a data entry error for Premise ID or Meter ID, which have been interchanged. Utility standard practice is to go through a process to validate, edit, and estimate (VEE) meter data to validate data for inactive meters with consumption, correct for errors, and estimate consumption for erroneous data.
Another option to identify inactive meters is to gather status from the meter management system to determine shut off or event type. Combining these two data sources along with customer class data can provide a full story on how and why an inactive meter is consuming.
Figure 4 shows how SAS identifies consumption by inactive meters by taking system information from GIS, meter management and billing to determine a list of premises where meters should be turned off or removed, yet still have energy consumption.

6
Figure 4 - Inactive Meter Analysis
Potential Energy Theft and Tampering or Intrusion
The challenge with identifying energy theft is detecting anomalous patterns of usage, keeping track of new diversion practices, and simply being unsure of what exactly to look for. According to a study by the Electric Power Research Institute (EPRI), the loss of revenue for US electric utilities due to non-technical losses are estimated to be greater than $6 billion. SAS enables utility companies to leverage the same analytics used by SAS fraud solutions in other industries like retail, insurance, and financial services. SAS advanced analytics works with complex patterns and can identify suspect usage patterns.
An example of energy theft is shown in Figure 5. SAS Visualization is used to confirm and further investigate fraudulent activity uncovered by a model that leverages demographic and operational systems of record. Shown here are usage patterns where meters from the same building, unit and/or street and have similar demographics. Highlighted on the right is a meter with significant higher consumption than its neighbors and outside of the normal specifications of its usage class.
Figure 5 - Energy Theft Analysis

7
Meters can create many alarm signals and notifications that reflect positive or negative operational events. Leveraging these alarm signals with usage, meter events, customer information, and weather information can provide greater insight into the cause of alarms.
Figure 6 shows event analysis and the ability to address recorded incidents from event logs, GIS coordinates, and meter attributes. With this analysis we can determine the number of incidents and their location and drill into specific occurrences. This further enables analysts to create incident reports that can be shared with operations engineers or provided to workflow systems for investigation.
Here we have identified a possible diversion or tamper event on an individual meter at a specific time, showing the meter’s location. This weekly report would be used to direct diversion case investigations.
Figure 6 - Tamper Event Analysis
START/STOP GAP
A start/stop gap might be an indication of a stolen meter in socket. Using meter events along with consumption information can identify events such as start/stop gaps. This combination of data enables the analyst to not only identify gaps, but also determine possible causes.
SAS can provide a visual representation of unresponsive meters to help identify which meters are having communications difficulty and which meters have failed. Meter events can be analyzed to find associations of event types. By understanding the events, the analyst can quickly identify troubled meters. Figure 7 shows an example of stopped meter analysis.

8
Figure 7 - Stopped Meter Analysis
CUSTOMER ANALYSIS
Support All Customer Classes
SAS integrates customer data from multiple systems, enabling a utility to seek specific insight into groups of customers (behavioral segmentation) or individual customers. SAS allows utility analysts to explore this combined data and visually show relationships and correlations of data elements with the combined data. This very effective portion of SAS® Visual Analytics displays how one value affects another. For instance, it can show what portion of a given region or market consists of customers that have renewable type A, or what customers have what type of property.
Residential, small commercial, and industrial are common customer classifications. With SAS, customer classes are defined and supported in the manner a utility defines them. Further classifications can be defined or discovered using SAS segmentation or classification analytics. SAS has cluster analysis to determine subclasses or even entirely new classes based on the parameters submitted.
Residential, commercial, and industrial often have several subclasses. Although these subclasses are often based on region or type (SIC codes), SAS can examine the data and determine classes based on usage and seasonal usage. For example, this can be very helpful when examining classes with renewables.
Figure 8 is the result of load shape segmentation and cluster analysis. GIS information provides a map of the segment dispersion across geographic locations. Customer classification by cluster and segments can be selected to display the segment’s overall load shape definition and the detailed load shapes of its members. This type of analysis is used to display and validate segmentation modeling. The analyst can view the customer segment definition and the details of its members.

9
Figure 8 - Customer Segment Analysis
Load Profile Analysis
By leveraging the foundations of SAS analytics and data management, analysts can design out-of-the-box solutions. Here is an example of extending the capabilities of SAS® Visual Analytics to address special report requests (Figure 9). The request was to draw a load shape and find all the customers that fit that shape. To accomplish this, meter load needs to be represented by percentage of daily total by defined intervals. In this report, six intervals represent 4-hour increments over 24 hours.
The analyst can change the interval values using slide bars to define the load shape desired (shown on the upper right). The meters that match that profile are displayed in a crosstab on the bottom left along the load values for each 4-hour interval. Selecting one or more meters from the crosstab displays the load shapes (bottom right).
This report could support investigating time-of-use rates by identifying customers with high usage within certain times of the day. Additional value can be added to the report by displaying customer characteristics, and this report might even be combined with the previous report on customer segmentation.

10
Figure 9 - Load Profile Analysis
CONCLUSION
Over the past several years, utilities have spent billions of dollars rolling out smart meter technology. These smart meters now produce massive quantities of customer usage data that is overwhelming in terms of volume and velocity. SAS® Visual Analytics enables you to analyze consumption trends to spot trends earlier than ever before, identify demand patterns that can improve load forecasting, target various customer segments with specific energy efficiency campaigns, and use detailed data to proactively manage meter performance.
REFERENCES
Electronic Power Research Institute. (2008). “Advanced Metering Infrastructure Technology.” Available http://www.epri.com/abstracts/Pages/ProductAbstract.aspx?ProductId=000000000001016049. Accessed on March 4, 2015.

11
CONTACT INFORMATION
Your comments and questions are valued and encouraged. Contact the authors:
Tom Anderson
Phoenix, AZ
SAS Institute Inc.
Jennifer Whaley
100 SAS Campus Drive
Cary, NC 27513
SAS Institute Inc.
SAS and all other SAS Institute Inc. product or service names are registered trademarks or trademarks of SAS Institute Inc. in the USA and other countries. ® indicates USA registration.
Other brand and product names are trademarks of their respective companies.