Paper SAS1925-2015 Using SAS to Deliver Web Content ... · PDF fileUsing SAS® to Deliver...
24
1 Paper SAS1925-2015 Using SAS ® to Deliver Web Content Personalization Using Cloud-Based Clickstream Data and On-Premises Customer Data Mahesh Subramanian and Suneel Grover, SAS Institute Inc. ABSTRACT Real-time web content personalization is growing up, and the rise of marketing solutions that enable marketers to finely personalize web content for visitors based on array of data attributes is maturing. This paper discusses a phased approach in which enterprises capture clickstream data and bring that data in- house to be merged with other sources of customer data. Their analytics team can use this merged data to build sophisticated predictive models that can be deployed into real-time web-personalization applications. In the final phase, enterprises continuously improve their predictive models in an iterative process. INTRODUCTION Real-time web content personalization has come into its teen years, and recently a spate of marketing solutions has enabled marketers to finely personalize web content for visitors based on their browsing behavior, geolocation, preferences, and more. In an age when the attention span of a web visitor is measured in seconds, marketers hope that tailoring the digital experience will pique each visitor's interest just long enough to increase corporate sales. The range of solutions spans the entire spectrum of cloud- based installations to on-premises platforms. Marketers struggle to find the optimal solution that would meet their corporation's marketing objectives and provide them the highest agility and fastest time to market, while maintaining a low marketing budget. In the last decade or so, marketing strategies that used on-premises customer data for personalization were quickly replaced by technology that used only web-browsing behavior (that is, clickstream data). This replacement is possible because new cloud-based solutions emerged, enabling marketers to overcome underlying IT infrastructure and storage issues that capturing clickstream data posed. However, this new trend meant that corporations weren’t using much of their treasure trove of on-premises customer data. Of late, enterprises have been trying to find solutions that give them the best of both—the ease of gathering clickstream data using cloud-based applications and the option to exploit on-premises customer data—to perform analytics that lead to better web content personalization for a visitor. This paper explains a process that attempts to address this rapidly evolving need. CLICKSTREAM DATA AND ANALYSIS Clickstream data is generated by the series of mouse clicks that a web user makes while browsing one or more web pages. It includes information about the clicks, pages, sessions (that is, visits), transactions, and more. It also includes the requests to your organization’s web server that are created by all the clicks and pages that the user’s browser requests based on actions performed by the user. Clickstream analysis is the process of collecting, aggregating, reporting, and analyzing the browsing behavior to glean a better understanding of the intentions of the users and their interests in particular content or products on the website. The marketplace today provides several options for enterprises to collect clickstream data, perform aggregations, and run reports on that data. RAW DATA Each web page consists of a large number of components (HTML tags, images, CSS files, JavaScript files, media files, Flash content, and so on). When a user requests or navigates to a page on a website, the browser makes a HTTP request for that page. When the page starts to load, the browser finds other components on that page and makes a series of parallel HTTP requests to fetch those components from their respective locations. Not all the content on a web page needs to be located or served up from a
Transcript of Paper SAS1925-2015 Using SAS to Deliver Web Content ... · PDF fileUsing SAS® to Deliver...

1
Paper SAS1925-2015
Using SAS® to Deliver Web Content Personalization Using Cloud-Based Clickstream Data and On-Premises Customer Data
Mahesh Subramanian and Suneel Grover, SAS Institute Inc.
ABSTRACT
Real-time web content personalization is growing up, and the rise of marketing solutions that enable marketers to finely personalize web content for visitors based on array of data attributes is maturing. This paper discusses a phased approach in which enterprises capture clickstream data and bring that data in-house to be merged with other sources of customer data. Their analytics team can use this merged data to build sophisticated predictive models that can be deployed into real-time web-personalization applications. In the final phase, enterprises continuously improve their predictive models in an iterative process.
INTRODUCTION
Real-time web content personalization has come into its teen years, and recently a spate of marketing solutions has enabled marketers to finely personalize web content for visitors based on their browsing behavior, geolocation, preferences, and more. In an age when the attention span of a web visitor is measured in seconds, marketers hope that tailoring the digital experience will pique each visitor's interest just long enough to increase corporate sales. The range of solutions spans the entire spectrum of cloud-based installations to on-premises platforms. Marketers struggle to find the optimal solution that would meet their corporation's marketing objectives and provide them the highest agility and fastest time to market, while maintaining a low marketing budget. In the last decade or so, marketing strategies that used on-premises customer data for personalization were quickly replaced by technology that used only web-browsing behavior (that is, clickstream data). This replacement is possible because new cloud-based solutions emerged, enabling marketers to overcome underlying IT infrastructure and storage issues that capturing clickstream data posed. However, this new trend meant that corporations weren’t using much of their treasure trove of on-premises customer data. Of late, enterprises have been trying to find solutions that give them the best of both—the ease of gathering clickstream data using cloud-based applications and the option to exploit on-premises customer data—to perform analytics that lead to better web content personalization for a visitor. This paper explains a process that attempts to address this rapidly evolving need.
CLICKSTREAM DATA AND ANALYSIS
Clickstream data is generated by the series of mouse clicks that a web user makes while browsing one or more web pages. It includes information about the clicks, pages, sessions (that is, visits), transactions, and more. It also includes the requests to your organization’s web server that are created by all the clicks and pages that the user’s browser requests based on actions performed by the user.
Clickstream analysis is the process of collecting, aggregating, reporting, and analyzing the browsing behavior to glean a better understanding of the intentions of the users and their interests in particular content or products on the website.
The marketplace today provides several options for enterprises to collect clickstream data, perform aggregations, and run reports on that data.
RAW DATA
Each web page consists of a large number of components (HTML tags, images, CSS files, JavaScript files, media files, Flash content, and so on). When a user requests or navigates to a page on a website, the browser makes a HTTP request for that page. When the page starts to load, the browser finds other components on that page and makes a series of parallel HTTP requests to fetch those components from their respective locations. Not all the content on a web page needs to be located or served up from a

2
single web server. While the web content is loading, each individual component (say, JavaScript) can begin executing and perform additional activity. All this is seamless for the end user.
A typical clickstream data collection process involves embedding a JavaScript tag or file on the web page to allow that script to be downloaded to the browser and begin executing while the page is loading. This JavaScript collects information about other content on the page to send back to the collection process, and it can inject or modify existing content on that web page.
Figure 1 shows a sample set of HTTP requests that are generated by the browser when a web visitor reaches the www.sas.com web page.
Figure 1. HTTP Requests Generated by the Browser When a User Visits the www.sas.com Web Page
In all, there were approximately 200 HTTP requests issued by the browser for just this one web page. A single visitor session can involve the user navigating over a few dozen pages or performing light to moderate activity (clicking, viewing videos, downloading content, and so on), potentially creating thousands of records of raw data. A busy website with hundreds of visitors every hour could capture millions of records every day.
NORMALIZED DATA
The collection process obtains a large volume of data about the browsing behavior of all visitors to a website. This data contains information about the referring source, pages visited by user session, buttons clicked, whether this is a returning customer, timestamps, geographic location, user device, browser, and so on.
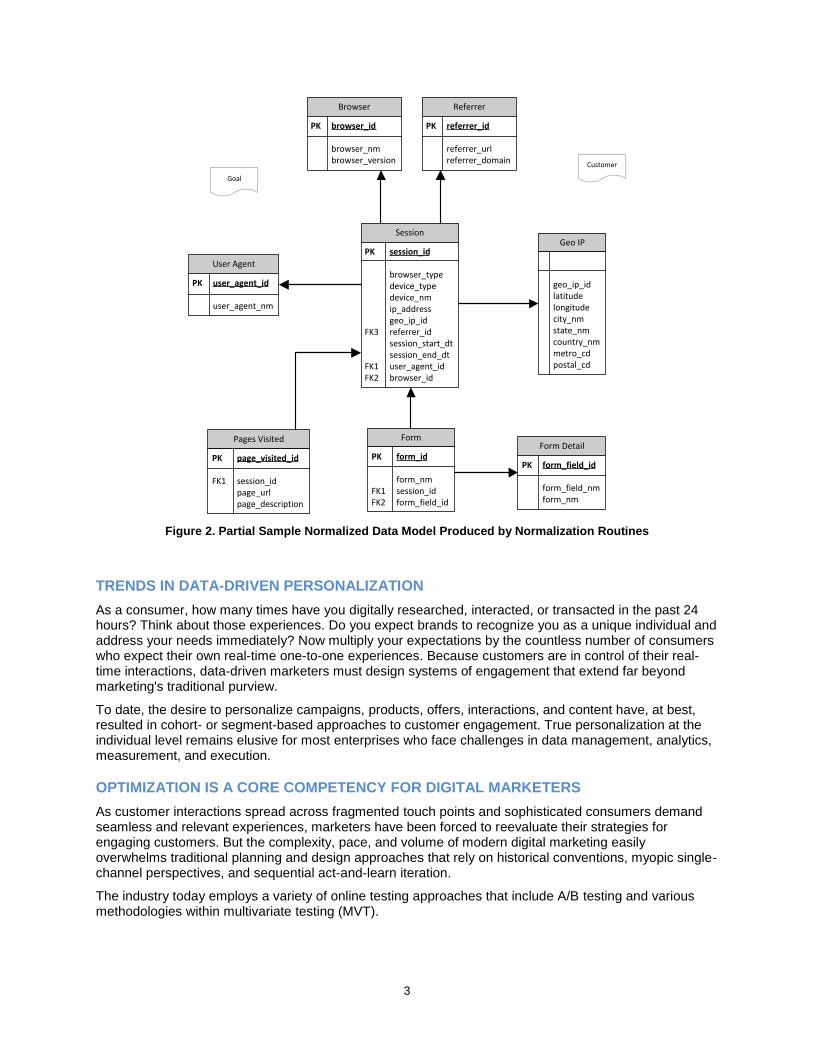
To perform proper analysis of this data and develop analytical models, statisticians, data miners, and analysts prefer the raw data to be transformed into a normalized format, in which information about sessions, pages visited, forms submitted, geo-IP information, and additional related data is structured. Figure 2 shows a partial data model that is produced by the normalization routines.
3
Session
PK session_id
browser_type device_type device_nm ip_address geo_ip_idFK3 referrer_id session_start_dt session_end_dtFK1 user_agent_idFK2 browser_id
User Agent
PK user_agent_id
user_agent_nm
Browser
PK browser_id
browser_nm browser_version
Referrer
PK referrer_id
referrer_url referrer_domain
Geo IP
geo_ip_id latitude longitude city_nm state_nm country_nm metro_cd postal_cd
Pages Visited
PK page_visited_id
FK1 session_id page_url page_description
Form
PK form_id
form_nmFK1 session_idFK2 form_field_id
Form Detail
PK form_field_id
form_field_nm form_nm
Goal
Customer
Figure 2. Partial Sample Normalized Data Model Produced by Normalization Routines
TRENDS IN DATA-DRIVEN PERSONALIZATION
As a consumer, how many times have you digitally researched, interacted, or transacted in the past 24 hours? Think about those experiences. Do you expect brands to recognize you as a unique individual and address your needs immediately? Now multiply your expectations by the countless number of consumers who expect their own real-time one-to-one experiences. Because customers are in control of their real-time interactions, data-driven marketers must design systems of engagement that extend far beyond marketing's traditional purview.
To date, the desire to personalize campaigns, products, offers, interactions, and content have, at best, resulted in cohort- or segment-based approaches to customer engagement. True personalization at the individual level remains elusive for most enterprises who face challenges in data management, analytics, measurement, and execution.
OPTIMIZATION IS A CORE COMPETENCY FOR DIGITAL MARKETERS
As customer interactions spread across fragmented touch points and sophisticated consumers demand seamless and relevant experiences, marketers have been forced to reevaluate their strategies for engaging customers. But the complexity, pace, and volume of modern digital marketing easily overwhelms traditional planning and design approaches that rely on historical conventions, myopic single-channel perspectives, and sequential act-and-learn iteration.
The industry today employs a variety of online testing approaches that include A/B testing and various methodologies within multivariate testing (MVT).

4
A/B TESTING
A/B testing is a method of website optimization in which the conversion rates of two versions of a page—version A and version B—are compared to one another by using visitor traffic. Site visitors are presented with one version or the other. By tracking the way visitors interact with the content they are shown—the videos they watch, the buttons they click, or whether or not they sign up for a newsletter—you can infer which version of the content is most effective.
The advantages of A/B testing are based on its simplicity in concept and design. A/B testing is a powerful and widely used testing method. When paired with smart experimental design and a commitment to iterative cycles of testing and redesign, A/B testing can help make huge improvements to your organization’s website or mobile app. However, it is important to remember the limitations of this type of test. A/B testing is best used to measure the impact of two interaction variables. Tests with more variables take longer to run, and A/B testing does not reveal any information about the interaction effects between variables.
MULTIVARIATE TESTING (MVT)
Multivariate testing uses the same core ingredients as A/B testing, but it can compare more than two variables. In addition, it reveals more information about how these variables interact with one another. As in an A/B test, traffic to a page is split between different versions of the experiment design. When a brand’s website has received enough traffic to statistically validate the test results, the data from each variation is compared to find the most effective approach and to reveal which elements have the greatest positive or negative impact on a visitor’s interaction.
The advantages of multivariate testing lie within its power to help target redesign efforts for the elements of your organization’s web pages or mobile app where they will have the most impact on visitors’ experiences. This power is especially useful when designing landing page campaigns, for example. The data about the impact of a certain element’s design can be applied to future campaigns, even if the context of the element has changed.
The single biggest limitation of multivariate testing is the amount of traffic needed to complete the test. The typical methodology used for multivariate testing is full factorial. However, too many changing elements at once can quickly add up to a very large number of possible combinations that must be tested. A site with fairly high traffic might have trouble completing a test with more than 25 combinations in a practical amount of time.
TYPES OF MULTIVARIATE TESTS
Full Factorial Testing
In this method, you distribute digital traffic equally among all combinations. If there are 16 combinations, each one receives one-sixteenth of all the visitor traffic. Because each combination gets the same amount of traffic, this method provides all the data needed to determine which particular combination and section performed best.
For example, an online retailer wants to conduct an email marketing campaign to reactivate inactive customers who had not purchased from the web store within the past 12 months. The goal is to maximize the conversion rate of the campaign. Before launching the full campaign, the retailer wants to conduct an experiment to identify the combination of offer elements that would yield the highest predicted conversion rate.
Table 1 describes the six factors (offer elements) included in the test. Each factor is tested at two levels. Level 1 represents the current form of the offer, and level 2 represents the new level to be tested. A full factorial design of this test would require 26 = 64 test cells (Krutsick 2012).

5
Table 1. Example of Six-Factor Full Factorial Test Design
Partial or Fractional Factorial Testing
As described by Kelly and Lucas (2013), this method requires only a fraction of the available combinations to be exposed to website traffic. If you have 10 factors, each with two levels, you would need 1,024 treatments to have a full factorial. For most organizations, this is an impractical situation. However, if you think about smaller experiments, every treatment might have been necessary—the number of treatments is tied to the number of parameter estimates your team wants. The same is true in larger experiments, but many of the degrees of freedom are estimating effects that are:
unlikely to exist
not likely to be large enough to take action
possibly too complex to rationally explain, even if they do exist
Hence, if you really wanted only the 10 main effects, or the 10 main effects and the 45 two-factor interactions, you ostensibly need only 11 to 56 treatment combinations.
Taguchi Testing
According to Sietsema (2014), the Taguchi method was originally developed for the purpose of improving the quality of manufactured goods. However, it allows for a more efficient (albeit controversial) means of finding out what combination of elements will produce the best result. Let’s use an example to describe it.
Figure 3 shows what a pay-per-click (PPC) ad test would look like with a full factorial multivariate test.
Figure 3. Example of Pay-Per-Click (PPC) Ad Test Using a Full Factorial Multivariate Test Design
Using the Taguchi method, the test would look like Figure 4.
6
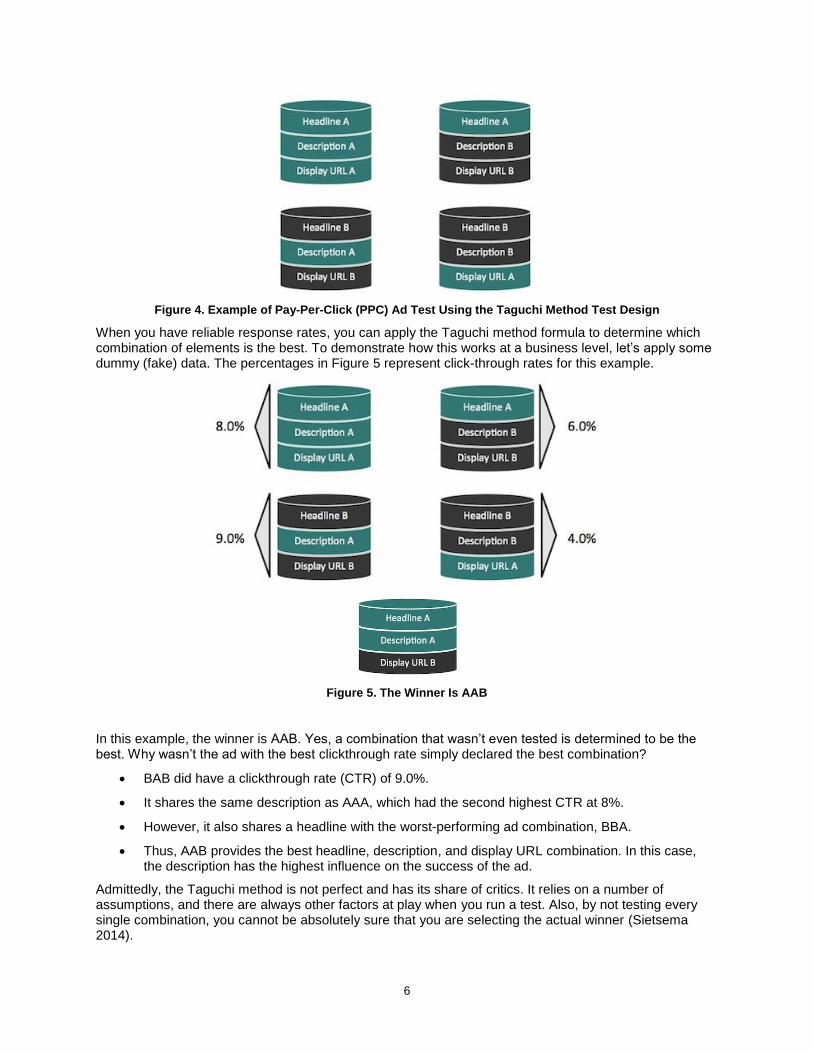
Figure 4. Example of Pay-Per-Click (PPC) Ad Test Using the Taguchi Method Test Design
When you have reliable response rates, you can apply the Taguchi method formula to determine which combination of elements is the best. To demonstrate how this works at a business level, let’s apply some dummy (fake) data. The percentages in Figure 5 represent click-through rates for this example.
Figure 5. The Winner Is AAB
In this example, the winner is AAB. Yes, a combination that wasn’t even tested is determined to be the best. Why wasn’t the ad with the best clickthrough rate simply declared the best combination?
BAB did have a clickthrough rate (CTR) of 9.0%.
It shares the same description as AAA, which had the second highest CTR at 8%.
However, it also shares a headline with the worst-performing ad combination, BBA.
Thus, AAB provides the best headline, description, and display URL combination. In this case, the description has the highest influence on the success of the ad.
Admittedly, the Taguchi method is not perfect and has its share of critics. It relies on a number of assumptions, and there are always other factors at play when you run a test. Also, by not testing every single combination, you cannot be absolutely sure that you are selecting the actual winner (Sietsema 2014).

7
A/B AND MVT VERSUS PREDICTIVE ANALYTICS
How does online testing help? Online testing applies statistical techniques to compare how variations of customer experiences perform against a control group in order to determine the best treatment option. Online testing is appealing not only because it is efficient and measurable but also because it cuts through noise and assumptions to help marketers present the most effective content, promotions, and experiences to customers and prospects.
The evolving digital marketing landscape drives expanding requirements for online testing: to operate in more channels, handle more data, and support more users. Online testing must move beyond traditional on-site experimentation to fully optimize today's multifaceted digital customer experiences.
The majority of today’s technologies that are specific to digital personalization and experience delivery have generally fallen short in their use of predictive analytics to contextualize digital customer experiences. Many of today’s pure-play offerings are based on simple rules-based recommendations, segmentation, and targeting that are usually limited to a single customer touch point. Despite some use of predictive techniques, digital experience delivery platforms are behind in incorporating predictive analytics to contextualize omni-channel digital customer experiences. How does a marketer know what to test? There are so many possibilities, and predictive analytics can help uncover what to test (and prioritize) and what to ignore (or deprioritize).
There are three key areas where current trends in digital personalization are falling short as defined by Yakkundi and Curranin (2015):
They are limited to highly targeted, web-based scenarios. Most digital experience delivery platforms offer predictive analytics capabilities for a targeted part of a website in order to support customer acquisition. What's missing? They offer limited functionality to:
o Incorporate predictive insights across various data sources, primarily because cloud-based solutions were not designed to incorporate on-premises first-party offline data. In other cases, organizations are offered the opportunity to upload first-party data into the vendor’s cloud platform, but uploading that data would violate internal IT policies regarding the sensitivity of sharing customer data and associated risks.
o Support more than just customer acquisition (that is, customer lifecycle support) to fuel the entire digital experience
They act like a black-box scoring engine. Many digital experience delivery technologies offer predictive capabilities, but do not offer transparency. That is, they aim to provide results for a specific scenario (such as recommendations for next best offer) with algorithms that are more or less opaque to the user. Marketers or their supporting analysts can't see into the process of the prediction, limiting their ability to monitor or optimize the predictive model.
They rely too heavily on manually-entered rules. Other digital experience delivery platforms veer too much away from the black boxes, instead relying heavily on predefined customer segments, personas, and scenarios. As firms who have adopted this approach begin to mature, these rules multiply, forcing marketers and campaign planners to manage hundreds of rules. Business rules have a place in predictive analytics, but they are the wrapper, and predictive models must be the meat.

8
PERSONALIZED DIGITAL EXPERIENCES NEED ADAPTABLE PREDICTION
There is a landscape of modern, third-party predictive analytics solutions that support the delivery of exquisite digital experiences. Solutions are available that enable not only data scientists but also developers to design, develop, and deploy predictive models to websites and mobile applications. These stand-alone predictive solutions surpass embedded predictive capabilities that are found in many digital experience platforms because they have the ability to:
Incorporate large and varied data sets from numerous sources, producing nonobvious insights. Unlike the digital experience platforms, which aim to own the data, predictive analytic capabilities can support either cloud-based or on-premises platforms, enabling marketers to find customer patterns across a variety of internal and external data silos. Often, this goal-oriented nature of predictive analytics leads to unexpected customer insights that firms might not have found by using traditional segmentation methodologies. The key is to ensure that the data sources are available for real-time personalization applications, meaning that clickstream data (historical and in-session), demographics, and other valuable inputs can be processed, analyzed, scored, and treated within milliseconds.
Allow for monitoring of predictive models and adaptation to new developments. Over the long term, data-driven marketers must evaluate predictions for effectiveness. If a model's predictive confidence drops below a certain level, its business value decreases and it might become no more useful than rules-based personas. When a model becomes unacceptably inaccurate, users should be able to modify the algorithms and variables that are used to make the predictions in order to reach higher accuracy levels.
Provide both the predictive epiphanies and the wisdom of rules. Despite their power, predictive models must also be constrained with information about the real world in order to deliver the most value.
COMPONENTS OF PERSONALIZATION ARCHITECTURE
Most enterprises have several customer-facing web applications, each with varying levels of visitor traffic. Before undertaking a web-personalization initiative, the enterprise has to first identify the most suitable web application for personalization and its related content management systems. Some of the factors that go into this decision include average number of daily visitors, geographical and time-of-day distribution of visitors, purpose of the web application, existing hosting platform (cloud versus on-premises), and ease of website modifications for personalization.
After the most suitable web application and its related content management system have been identified, the following components (implemented by what this paper calls engines) are recommended for a robust web-personalization solution:
Collection Engine
Normalization Engine
Analytical Engine
Decision Engine
Personalization Engine

9
COLLECTION ENGINE (CE)
This component of the solution tracks the browsing behavior of website visitors. It is responsible for recording all configured interactions between the visitors and the enterprise’s web application. This component is designed to passively collect data and does not typically require any human intervention. Figure 1 is a screen capture that shows the raw clickstream data. Figure 6 shows one of the configuration screens for the Collection Engine.
Figure 6. Example of Digital Data Collection Engine—Configuration User Interface
NORMALIZATION ENGINE (NE)
This component is configured to download data from the collection engine repository and transform the raw data into normalized clickstream data tables that are suitable for analysis by marketing and analytic teams. These are usually very detailed processes that operate on a scheduled basis. Figure 2 shows a partial sample data model that is populated by the normalization routines.
ANALYTICAL ENGINE (AE)
All tools and processes that are used by the analytical team for statistical analysis fall under this category. This includes tools and processes for additional extract, transfer, and load (ETL) activity, predictive model development, data visualization, and more. Most components of this infrastructure are intended for human users (such as marketing analysts and data miners) and does not impact website performance.
10
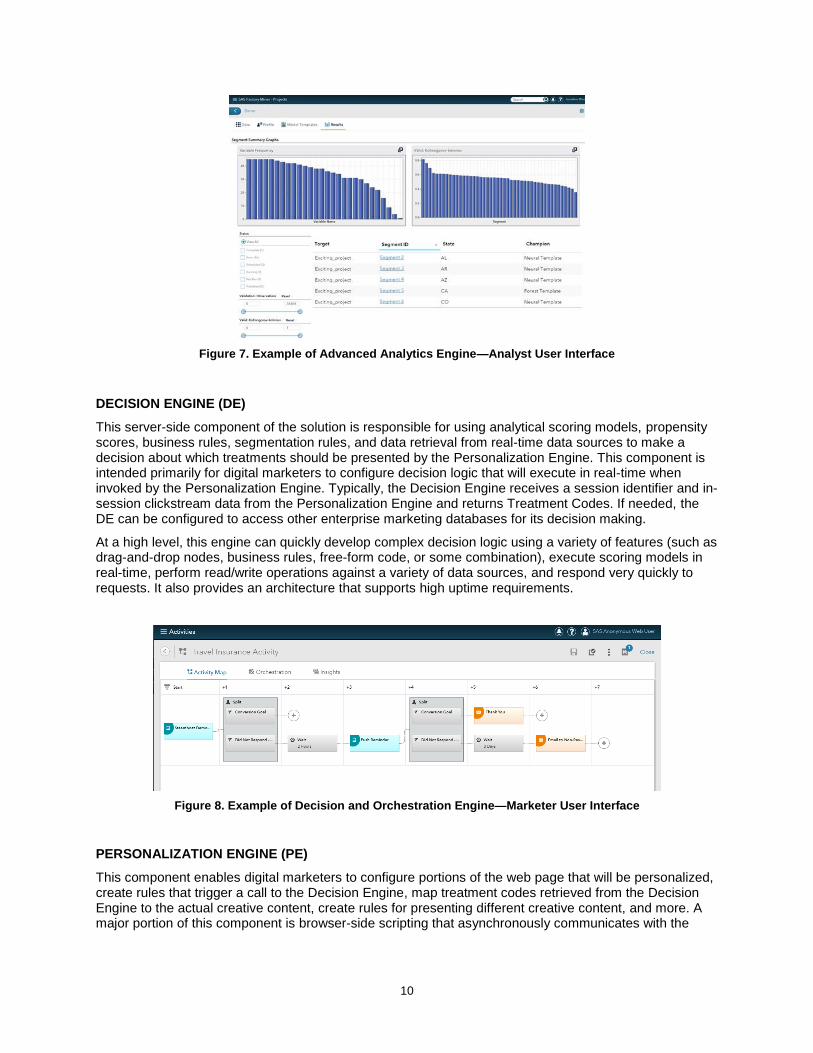
Figure 7. Example of Advanced Analytics Engine—Analyst User Interface
DECISION ENGINE (DE)
This server-side component of the solution is responsible for using analytical scoring models, propensity scores, business rules, segmentation rules, and data retrieval from real-time data sources to make a decision about which treatments should be presented by the Personalization Engine. This component is intended primarily for digital marketers to configure decision logic that will execute in real-time when invoked by the Personalization Engine. Typically, the Decision Engine receives a session identifier and in-session clickstream data from the Personalization Engine and returns Treatment Codes. If needed, the DE can be configured to access other enterprise marketing databases for its decision making.
At a high level, this engine can quickly develop complex decision logic using a variety of features (such as drag-and-drop nodes, business rules, free-form code, or some combination), execute scoring models in real-time, perform read/write operations against a variety of data sources, and respond very quickly to requests. It also provides an architecture that supports high uptime requirements.
Figure 8. Example of Decision and Orchestration Engine—Marketer User Interface
PERSONALIZATION ENGINE (PE)
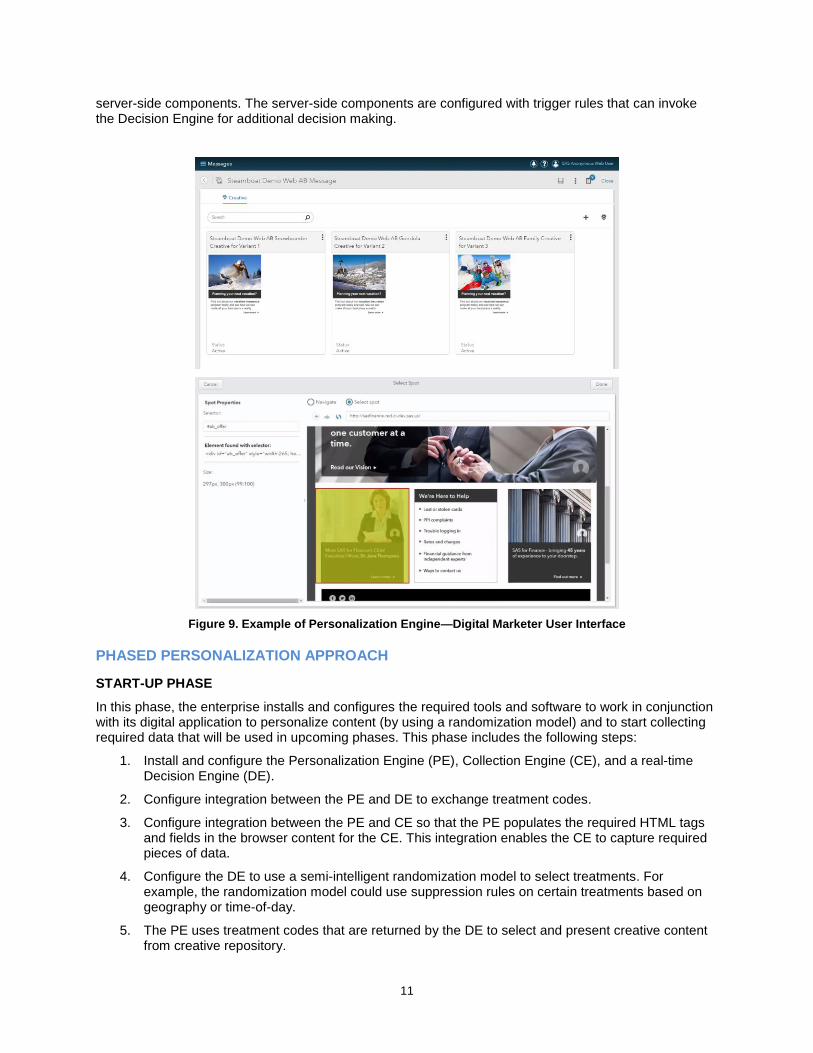
This component enables digital marketers to configure portions of the web page that will be personalized, create rules that trigger a call to the Decision Engine, map treatment codes retrieved from the Decision Engine to the actual creative content, create rules for presenting different creative content, and more. A major portion of this component is browser-side scripting that asynchronously communicates with the
11
server-side components. The server-side components are configured with trigger rules that can invoke the Decision Engine for additional decision making.
Figure 9. Example of Personalization Engine—Digital Marketer User Interface
PHASED PERSONALIZATION APPROACH
START-UP PHASE
In this phase, the enterprise installs and configures the required tools and software to work in conjunction with its digital application to personalize content (by using a randomization model) and to start collecting required data that will be used in upcoming phases. This phase includes the following steps:
1. Install and configure the Personalization Engine (PE), Collection Engine (CE), and a real-time Decision Engine (DE).
2. Configure integration between the PE and DE to exchange treatment codes.
3. Configure integration between the PE and CE so that the PE populates the required HTML tags and fields in the browser content for the CE. This integration enables the CE to capture required pieces of data.
4. Configure the DE to use a semi-intelligent randomization model to select treatments. For example, the randomization model could use suppression rules on certain treatments based on geography or time-of-day.
5. The PE uses treatment codes that are returned by the DE to select and present creative content from creative repository.
12
6. The PE runs until statistical significance is achieved (usually, 7–30 days).
7. Configure the CE to ingest clickstream data.
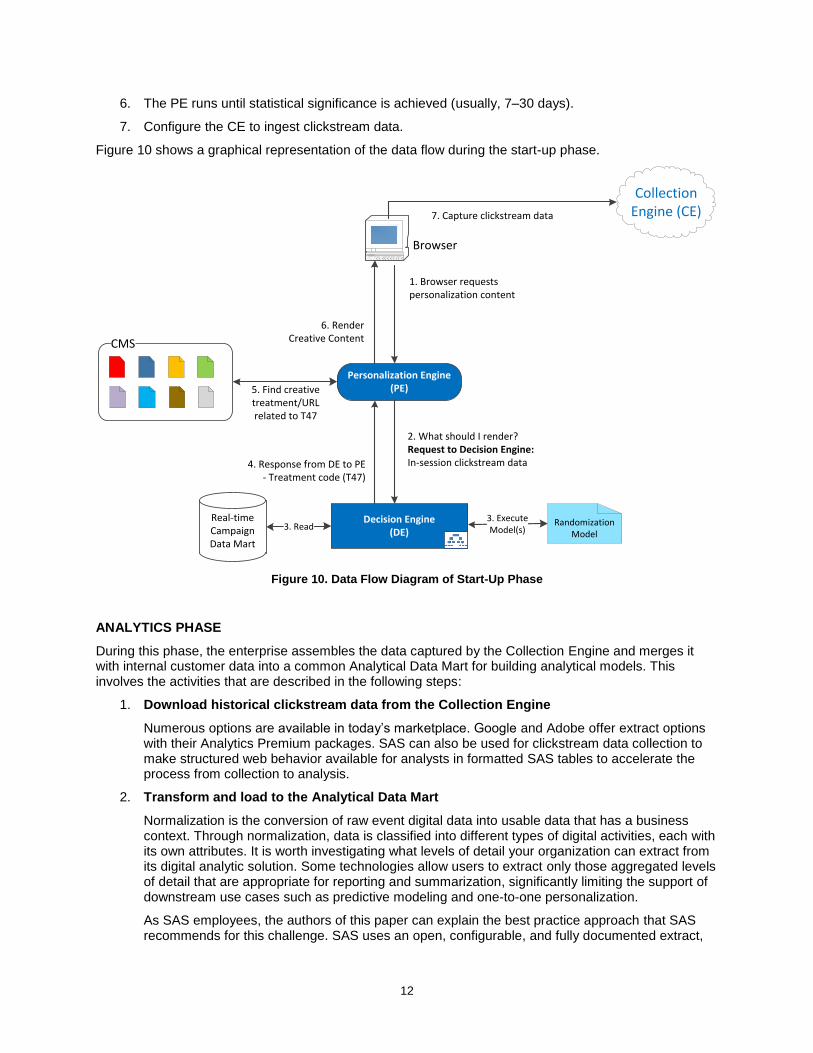
Figure 10 shows a graphical representation of the data flow during the start-up phase.
Collection Engine (CE)
Browser
7. Capture clickstream data
CMS
5. Find creative treatment/URL related to T47
1. Browser requests personalization content
6. Render Creative Content
3. Read 3. Execute Model(s)
Randomization Model
Decision Engine(DE)
2. What should I render? Request to Decision Engine: In-session clickstream data4. Response from DE to PE
- Treatment code (T47)
Personalization Engine (PE)
Real-time Campaign Data Mart
Figure 10. Data Flow Diagram of Start-Up Phase
ANALYTICS PHASE
During this phase, the enterprise assembles the data captured by the Collection Engine and merges it with internal customer data into a common Analytical Data Mart for building analytical models. This involves the activities that are described in the following steps:
1. Download historical clickstream data from the Collection Engine
Numerous options are available in today’s marketplace. Google and Adobe offer extract options with their Analytics Premium packages. SAS can also be used for clickstream data collection to make structured web behavior available for analysts in formatted SAS tables to accelerate the process from collection to analysis.
2. Transform and load to the Analytical Data Mart
Normalization is the conversion of raw event digital data into usable data that has a business context. Through normalization, data is classified into different types of digital activities, each with its own attributes. It is worth investigating what levels of detail your organization can extract from its digital analytic solution. Some technologies allow users to extract only those aggregated levels of detail that are appropriate for reporting and summarization, significantly limiting the support of downstream use cases such as predictive modeling and one-to-one personalization.
As SAS employees, the authors of this paper can explain the best practice approach that SAS recommends for this challenge. SAS uses an open, configurable, and fully documented extract,
13
transform, and load (ETL) data model, which includes 56 structured tables that highlight views at the hit (click), visit, visitor, and customer levels. The information is stored in a digital data mart that users can access by using any SAS tool (such as SAS® Visual Analytics, SAS® Enterprise Guide®, or SAS® Enterprise Miner™) for query, reporting, and predictive analysis.
Not only does the ETL digital data model reduce the time analysts must spend accessing and preparing data for downstream analytics and marketing, but it also provides the level of detail needed for predictive modeling. This approach for a digital data model enables analysts to combine customer-level digital data with any other source of internal or third-party data and to efficiently move through their workflow.
3. Build Predictive Models Using Data from the Analytical Data Mart
Predictive analytics and exploratory data mining thrive on detailed data. When your analytics team can bring together very granular digital data streams that highlight consumer behavior, join it with offline attributes, and feed that into predictive models, they can improve their approaches to segmentation, personalization, ad targeting, and customer experience management.
Use Case 1: Predictive Marketing and Analytic Segmentation Using Decision Trees for Targeted Personalization
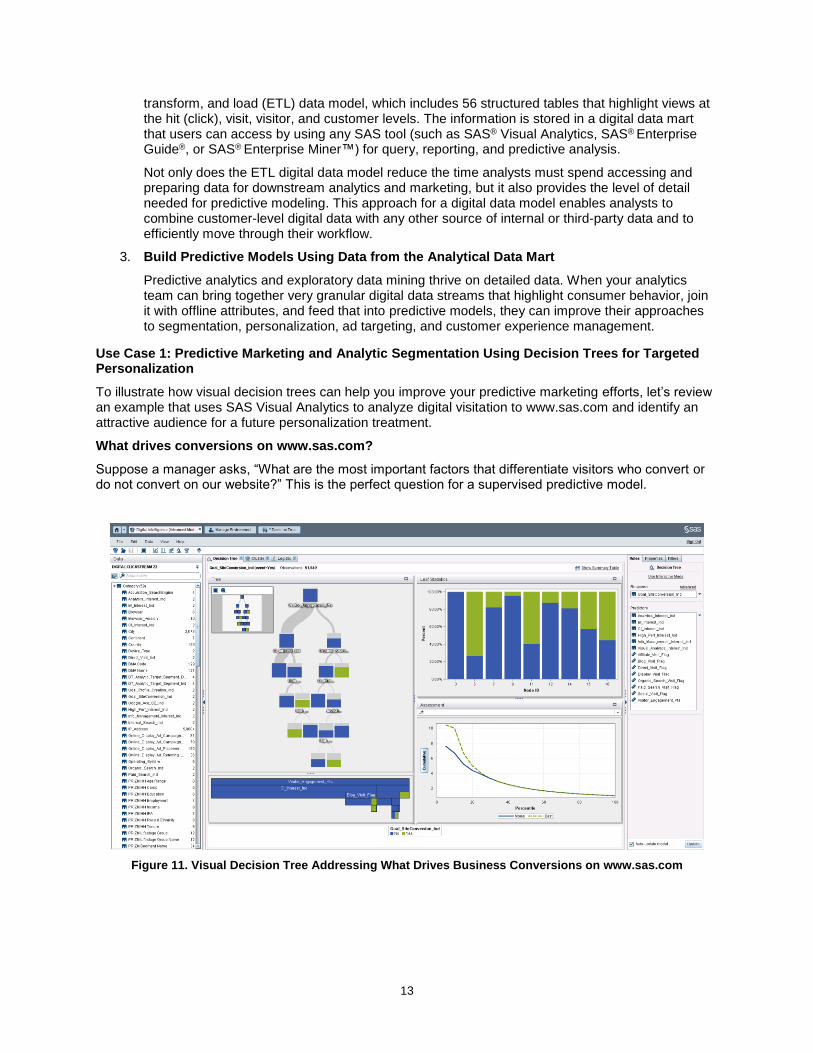
To illustrate how visual decision trees can help you improve your predictive marketing efforts, let’s review an example that uses SAS Visual Analytics to analyze digital visitation to www.sas.com and identify an attractive audience for a future personalization treatment.
What drives conversions on www.sas.com?
Suppose a manager asks, “What are the most important factors that differentiate visitors who convert or do not convert on our website?” This is the perfect question for a supervised predictive model.
Figure 11. Visual Decision Tree Addressing What Drives Business Conversions on www.sas.com

14
After the target variable has been added in Figure 11, we observe that 90% of visitors did not convert and 10% of visitors did convert in the past month. After selecting predictors that are associated with visitor website product interests, referring traffic sources, and engagement metrics, Figure 12 showcases the decision tree algorithm’s ability to identify unique characteristics of higher- and lower-value audience segments.
The in-memory processing power of SAS Visual Analytics enables you to apply sophisticated math (such as decision trees, clustering, or logistic regression) to large digital data and get nearly real-time responses. This is tremendously beneficial for improving targeting precision for personalization, because you can use algorithmic data-driven support to quickly identify attractive audiences.
Figure 12. Selecting a Segment for Personalization
Figure 12 provides one example of how the decision tree analyzed the parent population (that is, the marketable universe) of digital visitors and delivered insights into important behaviors that help explain why this unique segment is attractive. Specifically, visitors to www.sas.com who show high scores of engagement and originate from an organic search display higher likelihoods of converting when you compare them to peers who displayed other behaviors. It is the interaction of these two characteristics that drives this result. The next logical step is to take action on this insight. Figure 12 also highlights how in a single-click you can export the attractive segments to create an audience table.

15
Figure 13. Audience Table Available for Delivery to Decision Engine
Figure 13 shows an audience table that is made up of the three audience segments that were identified from the decision tree analysis. After you add attributes that are associated with this audience to the table, it is ready to be delivered to the Decision Engine. This is empowering, because no programming or coding is required and the intelligence of the algorithm is being exploited in the selection of the audience for downstream personalization.
Suppose that instead of exporting an audience table to a Decision Engine, you want to use the decision tree model’s score code to run against a new, prospective (or future) audience for a personalization scenario that would benefit from real-time, dynamic scoring. Figure 14 and Figure 15 present the steps to prepare for this process.
Figure 14. Export Score Code for Real-Time Scoring in Decision Engine

16
Figure 15. Example of Exported Score Code
Use Case 2: Group-By Predictive Marketing and Microsegmentation Using Logistic Regression for Targeted Personalization
The previous example illustrates how visual decision trees can be applied to analyzing digital visitation to www.sas.com to identify an attractive audience for a future personalization treatment. This example uses visual logistic regression to take things up a level for an analyst who wants to optimize predictive marketing models.
What drives conversions by channel on www.sas.com?
Suppose a manager asks, “What are the most important factors that differentiate visitors who convert or do not convert on our website?” In addition, the manager would like a unique predictive model for each channel from which visitors originate. This is a great question for using the group-by functionality of visual logistic regression.
Figure 16. Using Group-By Functionality, Seven Logistic Regressions Are Built For Each Traffic Source
17
Similar to the first use case (which uses decision trees), after the target variable has been added in Figure 16, we observe that 90% of visitors did not convert and 10% of visitors did convert in the past month. After selecting predictors that are associated with visitor website product interests and engagement metrics, we add the variable for visitor traffic source to the group-by role. SAS Visual Analytics immediately runs a unique predictive model for each traffic channel (that is, referral source) from which visitors originate—social media, organic search, paid search, display, blogs, affiliate, and direct. In a single step, we were immediately able to apply a micro-segmentation analytic approach to our business question. Consider other ideas about how you could exploit this powerful functionality from a micro-segmentation perspective. You could experiment and test with variables such as geographic state, user digital device type, segmentation classifications from a clustering analysis, and more.
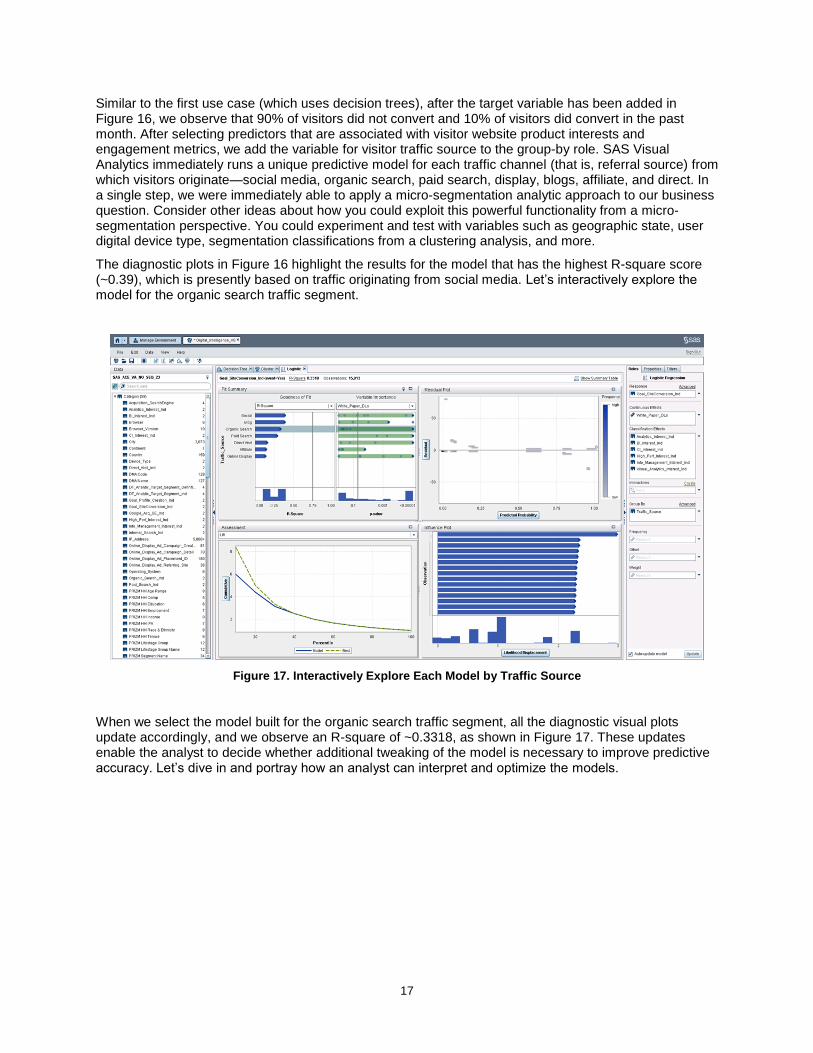
The diagnostic plots in Figure 16 highlight the results for the model that has the highest R-square score (~0.39), which is presently based on traffic originating from social media. Let’s interactively explore the model for the organic search traffic segment.
Figure 17. Interactively Explore Each Model by Traffic Source
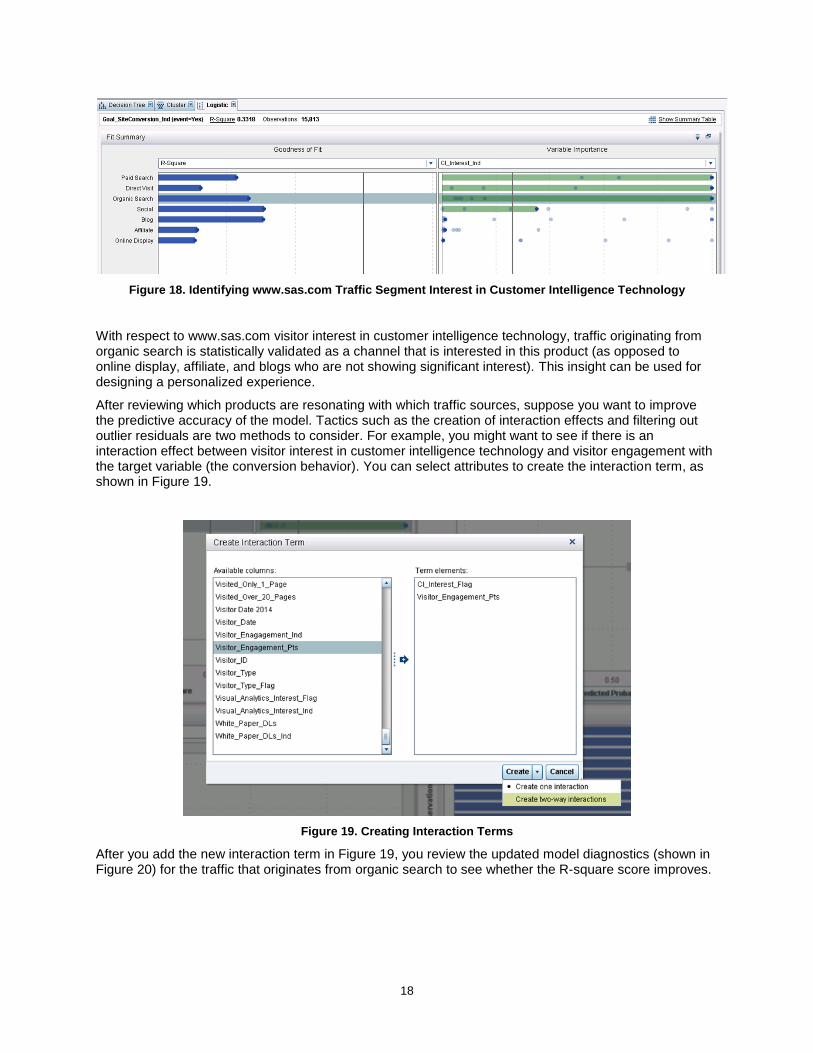
When we select the model built for the organic search traffic segment, all the diagnostic visual plots update accordingly, and we observe an R-square of ~0.3318, as shown in Figure 17. These updates enable the analyst to decide whether additional tweaking of the model is necessary to improve predictive accuracy. Let’s dive in and portray how an analyst can interpret and optimize the models.
18
Figure 18. Identifying www.sas.com Traffic Segment Interest in Customer Intelligence Technology
With respect to www.sas.com visitor interest in customer intelligence technology, traffic originating from organic search is statistically validated as a channel that is interested in this product (as opposed to online display, affiliate, and blogs who are not showing significant interest). This insight can be used for designing a personalized experience.
After reviewing which products are resonating with which traffic sources, suppose you want to improve the predictive accuracy of the model. Tactics such as the creation of interaction effects and filtering out outlier residuals are two methods to consider. For example, you might want to see if there is an interaction effect between visitor interest in customer intelligence technology and visitor engagement with the target variable (the conversion behavior). You can select attributes to create the interaction term, as shown in Figure 19.
Figure 19. Creating Interaction Terms
After you add the new interaction term in Figure 19, you review the updated model diagnostics (shown in Figure 20) for the traffic that originates from organic search to see whether the R-square score improves.

19
Figure 20. Model Diagnostics after Adding Interaction Terms
You note that the interaction term has a small positive effect in improving the model performance (the R-square is now 0.3337). The top assessment plot also enables you to interpret that the top 20% of your population shows a 4.40 lift as compared to the overall population average, and the bottom assessment plot displays a Kolmogorov–Smirnov (KS) statistic of 0.7844 (the closer to 1, the better).
Now you can turn your attention to outlier residuals that might be effecting our model’s accuracy. Figure 21 shows how you can determine what effect eliminating the residual outliers would have on model diagnostics.

20
Figure 21. Interactively Exclude Outlier Observations from Residual Plot
Figure 22 shows a minor improvement again in the model diagnostics. The R-square is now 0.3359, you interpret from the top assessment plot the top 20% of your population has a 4.43 times lift as compared to the overall population average, and you interpret from the bottom assessment plot that the KS statistic is 0.7862 (closer to 1 than it was in Figure 20).
Figure 22. Model Diagnostics after Removing Residual Outliers
You can choose to select models for other traffic segments (display media, paid search, and so on) and use the proposed model optimization techniques to improve accuracy scoring. When you are satisfied, you can export the scoring code that is highlighted in Figure 23 to be applied to future visitors within the Decision Engine to be leveraged for dynamic, real-time scoring across personalization campaign treatments.

21
Figure 23. Exporting Predictive Model Score Code for Each Traffic Segment
In conclusion, two predictive marketing approaches have been shared to highlight how advanced analytics can be used to support a Decision Engine and a Personalization Engine. Let’s explore how these types of models can be deployed.
DEPLOY MODELS TO REAL-TIME DECISION ENGINE
The final stage of the Analytics phase is the deployment of models to the real-time Decision Engine. This allows the engine to apply a hybrid decision framework of predictive analytics and business rules to present the optimal treatments to the Personalization Engine.
Figure 24. Decision Engine User Interface—Populate Business Rule and Analytic Targeting Criteria
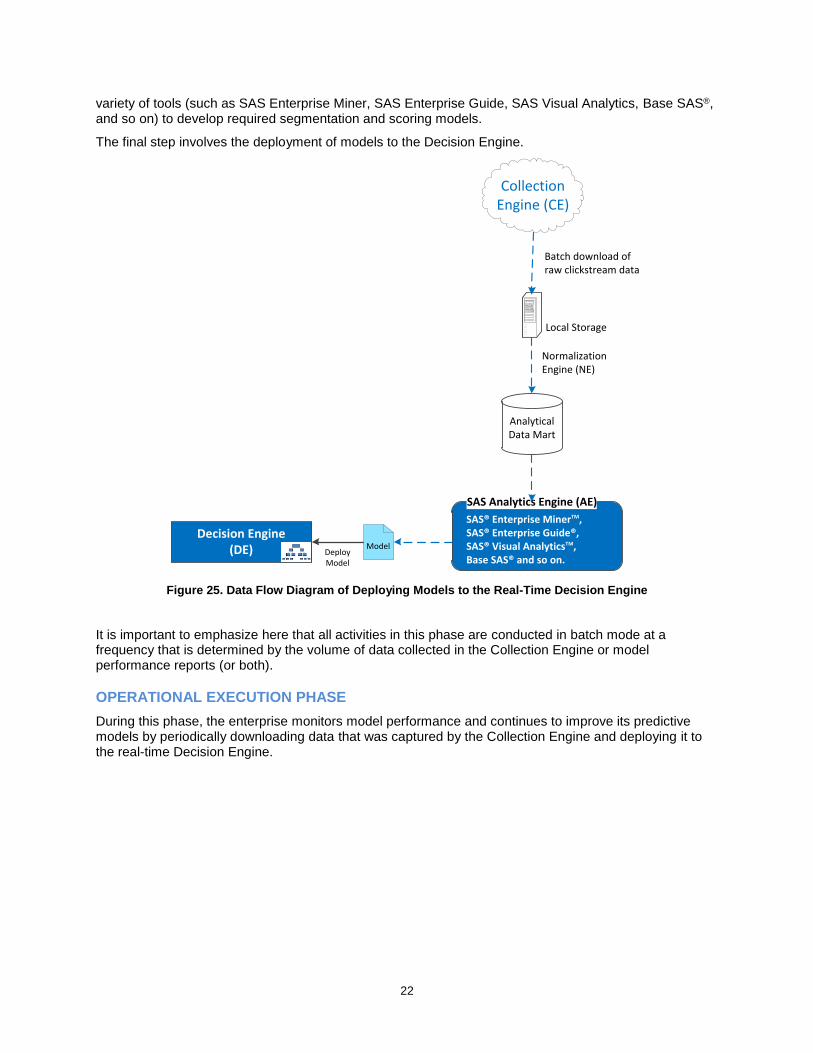
Figure 25 shows the periodic/batch data flow of raw clickstream data from the Collection Engine’s repository to the Analytical Data Mart. The Normalization Engine transforms the raw clickstream data into normalized format and loads it into the Analytical Data Mart for easier analysis. The mart can also be populated with data from several sources (customer data, segmentation data, third-party demographic data, user response history, and more). At this point, the enterprise Analytics team has the choice of a
22
variety of tools (such as SAS Enterprise Miner, SAS Enterprise Guide, SAS Visual Analytics, Base SAS®, and so on) to develop required segmentation and scoring models.
The final step involves the deployment of models to the Decision Engine.
Collection Engine (CE)
Analytical Data Mart
Local Storage
Normalization Engine (NE)
Batch download of raw clickstream data
SAS Analytics Engine (AE)
SAS® Enterprise MinerTM,SAS® Enterprise Guide®, SAS® Visual AnalyticsTM, Base SAS® and so on.
ModelDeploy Model
Decision Engine(DE)
Figure 25. Data Flow Diagram of Deploying Models to the Real-Time Decision Engine
It is important to emphasize here that all activities in this phase are conducted in batch mode at a frequency that is determined by the volume of data collected in the Collection Engine or model performance reports (or both).
OPERATIONAL EXECUTION PHASE
During this phase, the enterprise monitors model performance and continues to improve its predictive models by periodically downloading data that was captured by the Collection Engine and deploying it to the real-time Decision Engine.
23
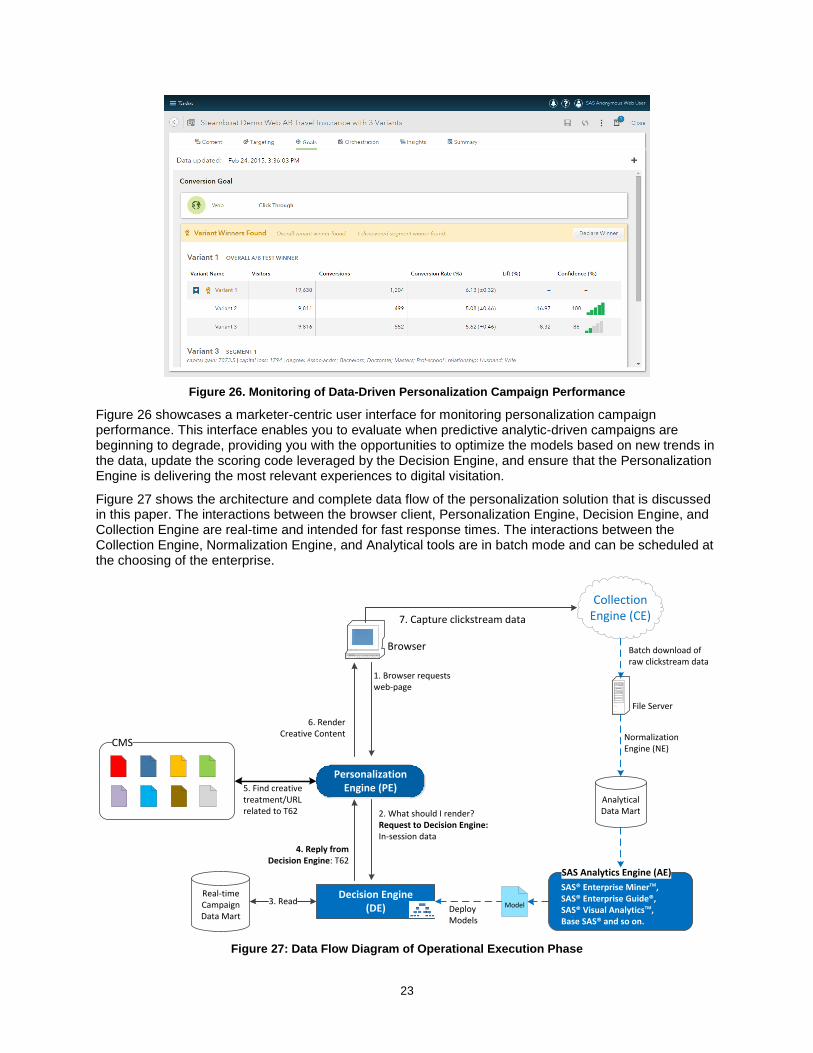
Figure 26. Monitoring of Data-Driven Personalization Campaign Performance
Figure 26 showcases a marketer-centric user interface for monitoring personalization campaign performance. This interface enables you to evaluate when predictive analytic-driven campaigns are beginning to degrade, providing you with the opportunities to optimize the models based on new trends in the data, update the scoring code leveraged by the Decision Engine, and ensure that the Personalization Engine is delivering the most relevant experiences to digital visitation.
Figure 27 shows the architecture and complete data flow of the personalization solution that is discussed in this paper. The interactions between the browser client, Personalization Engine, Decision Engine, and Collection Engine are real-time and intended for fast response times. The interactions between the Collection Engine, Normalization Engine, and Analytical tools are in batch mode and can be scheduled at the choosing of the enterprise.
Collection Engine (CE)
Browser
7. Capture clickstream data
CMS
5. Find creative treatment/URL related to T62
Analytical Data Mart
File Server
Normalization Engine (NE)
Batch download of raw clickstream data
Model
1. Browser requests web-page
6. Render Creative Content
Real-time Campaign Data Mart
3. Read Deploy Models
Decision Engine(DE)
Personalization Engine (PE)
2. What should I render? Request to Decision Engine: In-session data
4. Reply from Decision Engine: T62
SAS Analytics Engine (AE)
SAS® Enterprise MinerTM,SAS® Enterprise Guide®, SAS® Visual AnalyticsTM, Base SAS® and so on.
Figure 27: Data Flow Diagram of Operational Execution Phase

24
CONCLUSION
This paper analyzes and evaluates a technical approach to provide web content personalization by merging cloud-collected clickstream data with an organization’s on-premises customer data. We discuss the different analytical approaches that are available to enterprises using robust industry-standard SAS products. We also consider the common architectural considerations and options for hosting the different components that make up a robust web personalization solution.
REFERENCES
Franks, B., and Bucnis, R. 2011. “Taking Your Analytics Up a Notch by Integrating Clickstream Data.” Proceedings of the 2011 SAS Global Forum Conference. Cary, NC: SAS Institute Inc. http://support.sas.com/resources/papers/proceedings11/127-2011.pdf.
Kelly, D., and Lucas, B. 2013. Design of Experiments for Direct and Internet Marketing. SAS Education Course Notes. Cary, NC: SAS Institute Inc.
Krutsick, R. 2012. “Finding the Winning Combination: An Application of Multivariate Testing from Digital Marketing.” Proceedings of the 2012 SAS Global Forum Conference. Cary, NC: SAS Institute Inc. http://support.sas.com/resources/papers/proceedings12/206-2012.pdf.
Sietsema, C. 2014. “Ode to Taguchi.” Teach to Fish Digital. http://teachtofishdigital.com/ode-to-taguchi/.
Sukhwani, S., Garla, S., and Chakraborty, G. 2012. “Analysis of Clickstream Data Using SAS.” Proceedings of the 2012 SAS Global Forum Conference. Cary, NC: SAS Institute Inc. http://support.sas.com/resources/papers/proceedings12/100-2012.pdf.
Yakkundi, A., and Curran, R. 2015. “You Can't Personalize Digital Experiences without Predictive.” Forrester Research. https://www.forrester.com/.
CONTACT INFORMATION
Mahesh Subramanian Senior Solutions Architect, SAS Institute Inc. Email: [email protected] LinkedIn: www.linkedin.com/in/maheshsub00
Suneel Grover, MBA, MS Principal Solutions Architect, SAS Institute Inc. Adjunct Professor, Department of Decision Sciences, The George Washington University Email: [email protected] LinkedIn: www.linkedin.com/in/suneelgrover/en Twitter: @suneelgrover
SAS and all other SAS Institute Inc. product or service names are registered trademarks or trademarks of SAS Institute Inc. in the USA and other countries. ® indicates USA registration.
Other brand and product names are trademarks of their respective companies.