Paper prepared for the ICSEI conference in Malm ö, January 2012 WIM VAN DE GRIFT MICHELLE...
26
Paper prepared for the ICSEI conference in Malmö, January 2012 WIM VAN DE GRIFT MICHELLE HELMS-LORENZ University of Groningen The Netherlands CLASSROOM PRACTICE IN SECONDARY SCHOOLS
-
Upload
derek-gallagher -
Category
Documents
-
view
216 -
download
1
Transcript of Paper prepared for the ICSEI conference in Malm ö, January 2012 WIM VAN DE GRIFT MICHELLE...

Paper prepared for the ICSEI conference in Malmö, January 2012
WIM VAN DE GRIFT MICHELLE HELMS-LORENZ
University of GroningenThe Netherlands
CLASSROOM PRACTICE IN SECONDARY SCHOOLS

1. Theory and prior empirical research
2. Research questions
3. Sample
4. Method
5. Psychometric quality
6. Results
7. Conclusions
AGENDA

Linear models:
Fuller (1969,1970);
Dreyfus & Dreyfus (1986);
Berliner (1994, 2001);
Steffy & Wolfe (2001)
THEORIES OF PROFESSIONEL DEVELOPMENT (1)

LINEAIR GROWTH OF BOYS AND GIRLS
0
20
40
60
80
100
120
140
160
180
200
boys 76,6 88,9 98,1 105,8 113,1 120,1 126,6 132,8 138,3 143,2 148,2 154 160,9 168,2 174,4 178,7 181,3 182,6 183,2 183,6 184
girls 75,1 87,5 96,7 104,5 111,8 118,7 125,2 131,5 137,5 143,3 149,2 155,3 160,8 164,7 167,1 168,6 169,3 169,8 170,2 170,5 170,6
1 2 3 4 5 6 7 8 9 10 11 12 13 14 15 16 17 18 19 20 21

Parabolic models:
Burke, Christensen, Fessler & Price (1987); Lynn (2002);
Day (2008);
Gonçalves (2009);Van de Grift, Van der Wal & Torenbeek (2011)
THEORIES OF PROFESSIONEL DEVELOPMENT (2)

PARABOLIC DEVELOPMENT OF GERMAN TEACHERS IN PRIMARY EDUCATION
-2,14
-1,64
-1,14
-0,64
-0,14
0,36
0,86
1,36
1,86
ξp -1,15 0,73 0,85 0,51 0,65 0,39 0,34 0,28
0 1 t/m 5 6 t/m 10 11 t/m 15 16 t/m 20 21 t/m 25 26 t/m 30 > 30

PRIOR EMPIRICAL STUDIES
Hargreaves (2005); Holloway (2003); Huberman (1989); Rosenholtz & Simpson (1990); Van de Grift, Van der Wal & Torenbeek (2011) found indications that teachers in the middle of their career experience serious problems

Lineair or parabolic development?
• Do teachers have higher teaching qualities the more years of experience they have?
or,
• Do teachers show a dip in teaching abilities around the middle of their career?
RESEARCH QUESTIONS

• Cross sectional research on 1604 teachers in 138 secondary schools
• 950 teachers licenced for lower secondary education
• 169 teachers licenced for upper secondary education
SAMPLE

• Independent classroom observations done by specially trained teachers using the ICALT observation instrument
• Scheffé test on 8 groups of teacher with different job experience
METHOD

RELIABILITY
Creating a safe and stimulating learning climate
4 3.3 .54 .84 .62 **
Efficient lesorganization 4 3.2 .55 .80 .65 **
Clear and structured instruction 7 3.1 .51 .85 .67 **
Activating lessons 7 2.8 .56 .84 .61 **
Teaching learning strategies 6 2.5 .65 .87 .47 **
Taking individual needs into account in instructions
4 2.3 .64 .81 .45 **
Student involvement 3 3.0 .65 .86
# items
M sd
Cron-bach’alpha
R with student involvement
PSYCHOMETRIC QUALITY
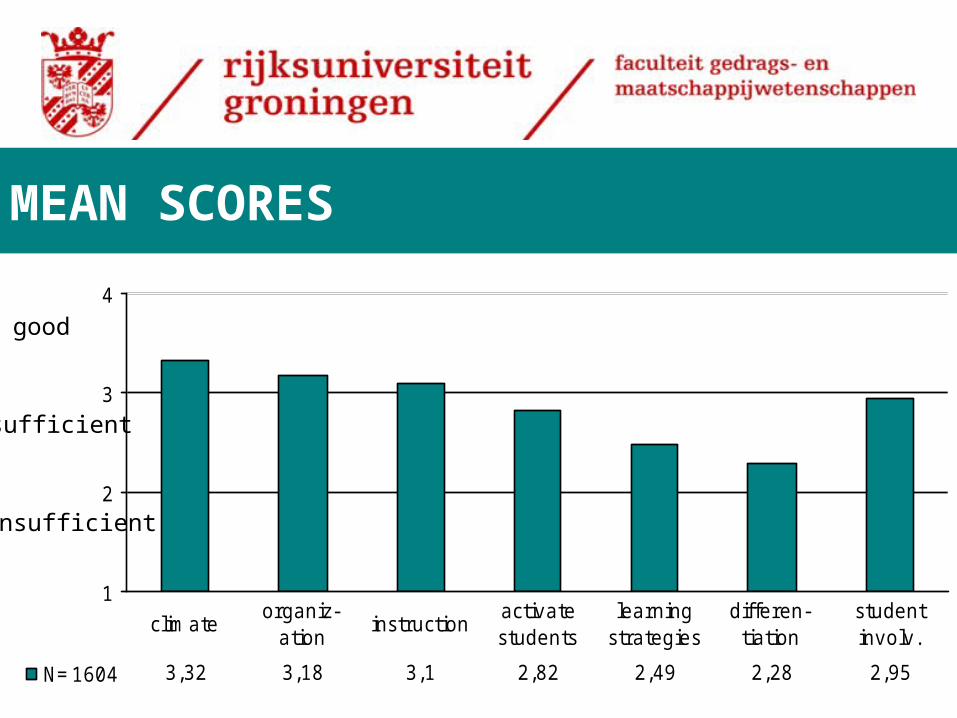
MEAN SCORES
1
2
3
4
N=1604 3,32 3,18 3,1 2,82 2,49 2,28 2,95
climateorganiz-
ationinstruction
activate students
learning strategies
differen-tiation
student involv.
insufficient
sufficient
good

GENDER
1
2
3
4
male (536) 3,27 3,12 3,02 2,76 2,47 2,22 2,91
female (616) 3,38 3,24 3,14 2,87 2,49 2,38 3
significant ** ** ** ** ** *
climateorganiz-
ationinstruction
activate students
learning strategies
differen-tiation
student involv.
good
sufficient
insufficient
.20 .24.21
.17
.25
.14

LICENCED FOR LOWER OR UPPER SECOND. EDUCATION
1
2
3
4
lower (950) 3,28 3,17 3,07 2,79 2,45 2,27 2,91
upper (169) 3,36 3,16 3,1 2,85 2,61 2,23 2,92
significant ** **
climateorganiz-
ationinstruction
activate students
learning strategies
differen-tiation
student involv.
good
sufficient
insufficient
.25
.22

TEACHING SUBJECT
1
2
3
4
dutch (450) 3,37 3,28 3,14 2,87 2,57 2,39 2,98
eng (48) 3,4 2,97 3,15 2,73 2,32 2,13 2,9
f g s (46) 3,18 3,01 2,86 2,57 2,24 2,09 2,86
math (69) 3,36 3,21 3,15 2,89 2,7 2,36 3,05
science (39) 3,16 2,98 3,06 2,76 2,51 2,14 2,77
geog (79) 3,41 3,33 3,16 2,96 2,56 2,32 3,14
hist (134) 3,22 3,11 3,03 2,76 2,45 2,07 2,9
bio (70) 3,2 3,1 3 2,8 2,28 2,19 2,86
soc (101) 3,28 3,2 3,06 2,78 2,38 2,13 2,85
eco (38) 3,3 3,24 3,15 2,73 2,61 2,37 2,96
proj (45) 3,06 3,11 2,96 2,61 2,49 2,23 2,77
clim org instr act l strat diff s involve
good
sufficient
insufficient
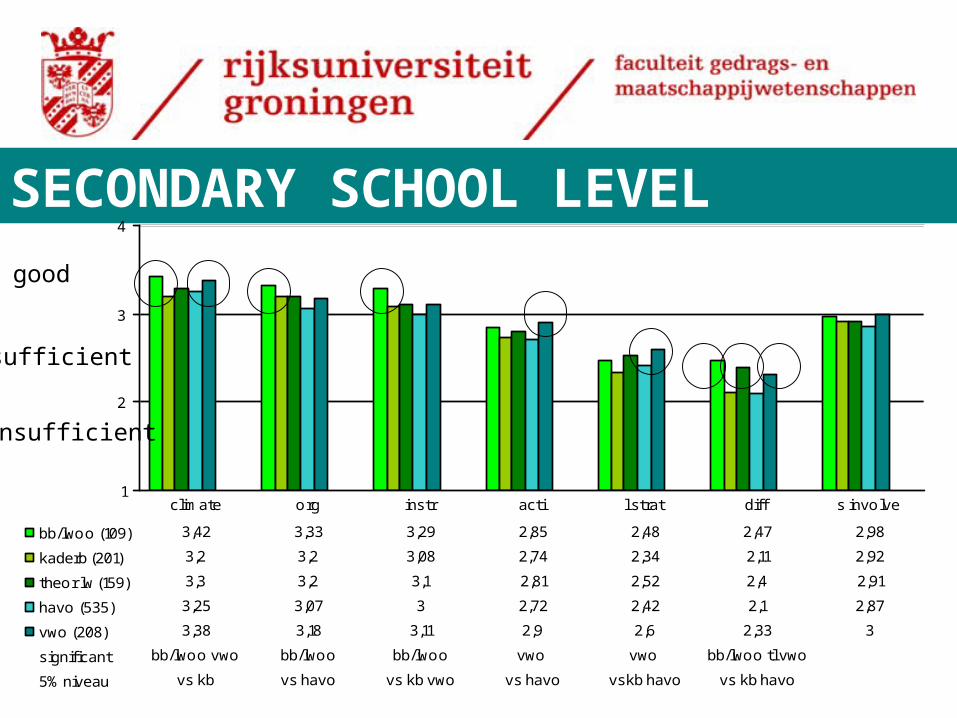
SECONDARY SCHOOL LEVEL
1
2
3
4
bb/lwoo (109) 3,42 3,33 3,29 2,85 2,48 2,47 2,98
kaderb (201) 3,2 3,2 3,08 2,74 2,34 2,11 2,92
theor lw (159) 3,3 3,2 3,1 2,81 2,52 2,4 2,91
havo (535) 3,25 3,07 3 2,72 2,42 2,1 2,87
vwo (208) 3,38 3,18 3,11 2,9 2,6 2,33 3
significant bb/lwoo vwo bb/lwoo bb/lwoo vwo vwo bb/lwoo tl vwo
5% niveau vs kb vs havo vs kb vwo vs havo vskb havo vs kb havo
climate org instr acti l strat diff s involve
good
sufficient
insufficient

YEAR (STUDENT AGE)
1
2
3
4
1 (485) 3,31 3,25 3,13 2,81 2,48 2,34 2,96
2 (123) 3,17 3,09 3,08 2,72 2,27 2,17 2,88
3 (206) 3,27 3,08 2,98 2,78 2,47 2,19 2,87
4 (221) 3,32 3,12 3,03 2,77 2,54 2,17 2,85
5 6 (39) 3,51 3,31 3,24 3,16 2,95 2,54 3,24
significant 56 vs 2 56 vs 2 56 vs 1234 56 vs 1234 56 vs 4
climate org instr act l strat diff s involve
good
suffcient
insufficient

CLASSROOM SIZE
1
2
3
4
<15 (118) 3,34 3,2 3,09 2,86 2,41 2,39 3,05
15 20 (232) 3,35 3,32 3,21 2,85 2,57 2,43 2,92
20 25 (341) 3,28 3,13 3,03 2,78 2,42 2,2 2,91
25 30 (329) 3,35 3,16 3,05 2,79 2,46 2,22 2,95
>30 (48) 3,22 3,13 3,01 2,64 2,45 2,34 2,96
significant 15 20 vs 20 25 15 20 vs 20 25 15 20 vs 20 25
5% level and 25 30 and 25 30 and 25 30
climate org instr act l strat diff s involve
good
sufficient
insufficient
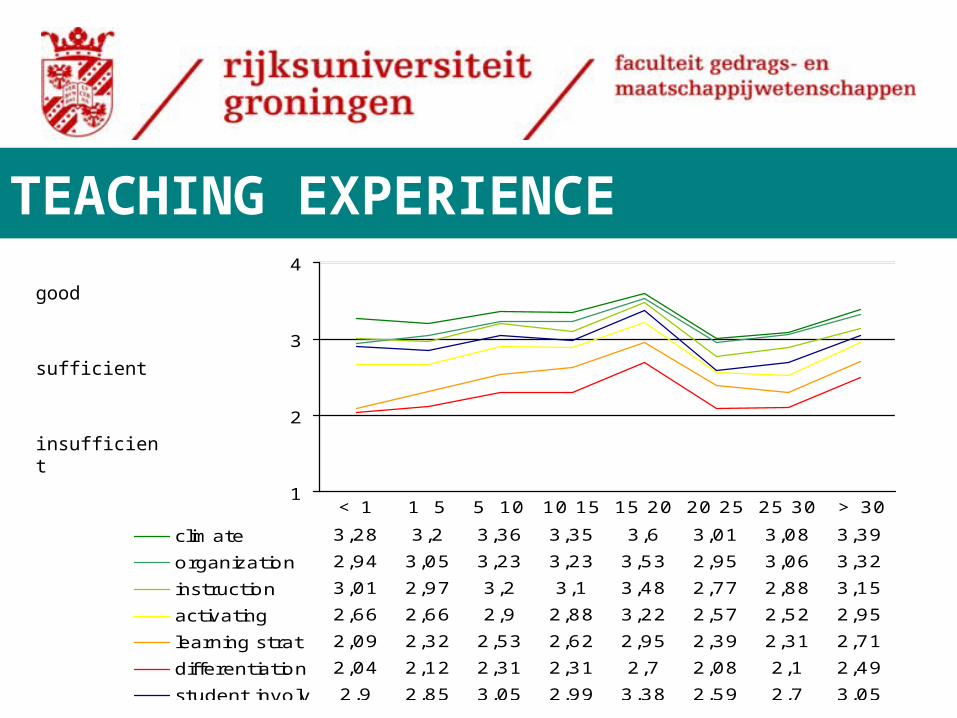
TEACHING EXPERIENCE
1
2
3
4
climate 3,28 3,2 3,36 3,35 3,6 3,01 3,08 3,39
organization 2,94 3,05 3,23 3,23 3,53 2,95 3,06 3,32
instruction 3,01 2,97 3,2 3,1 3,48 2,77 2,88 3,15
activating 2,66 2,66 2,9 2,88 3,22 2,57 2,52 2,95
learning strat 2,09 2,32 2,53 2,62 2,95 2,39 2,31 2,71
differentiation 2,04 2,12 2,31 2,31 2,7 2,08 2,1 2,49
student involv 2,9 2,85 3,05 2,99 3,38 2,59 2,7 3,05
< 1 1 5 5 10 10 15 15 20 20 25 25 30 > 30
sufficient
insufficient
good

TEACHING EXP. WITH CORR.
1
2
3
4
climate 3,17 3,15 3,35 3,32 3,56 3,26 3,26 3,37
organization 2,83 3,05 3,2 3,18 3,51 3,12 3,2 3,31
instruction 3 2,94 3,21 3,06 3,38 2,97 3,04 3,13
activating 2,59 2,65 2,9 2,83 3,09 2,73 2,68 2,91
learning strat 2,02 2,38 2,55 2,52 2,73 2,54 2,53 2,65
differentiation 1,9 2,09 2,29 2,25 2,51 2,19 2,22 2,46
student involv 2,76 2,81 3,02 2,93 3,37 2,73 2,85 3,03
< 1 1 5 5 10 10 15 15 20 20 25 25 30 > 30
sufficient
insufficient
good

RELIABILITY
Creating a safe and stimul. learn. climate 22.0Efficient lesorganization 14.3Clear and structured instruction 12.6Activating lessons 13.2Teaching learning strategies 21.2Taking individual needs into account 15.8
Average 16.5
% TEACHERS WITH 20-30 YEARS OF EXPERIENCE STILL SCORING ON THE HIGH SIDE

Bèta covariates w. experience
clim org ins act stra act bet
Gender .09* .13* .13* .13* .08 .14* .10*
Licence .15* .09 .15* .07 .00 .01 .06
Subject -.01 .00 .00 .00 -.01 .00 .00
Year -.02 -.02 -.04 .00 .05 -.04 -.06
School level -.01 -.02 -.03 .00 .01 .02 .04
Class size .00 .00 .00 .00 .00 -.01 .00

EXPERIENCED vs NOVICE TEACHERS
1
2
3
4
experienced (906) 3,3 3,2 3,09 2,82 2,53 2,3 2,96
novice (131) 3,28 2,94 3,01 2,66 2,09 2,04 2,9
significant ** ** ** **
climateorganiz-
ationinstruc-
tionactivate students
learning strategies
differen-tiation
student involv.
insufficient
sufficient
good
.47
.41
.29.68
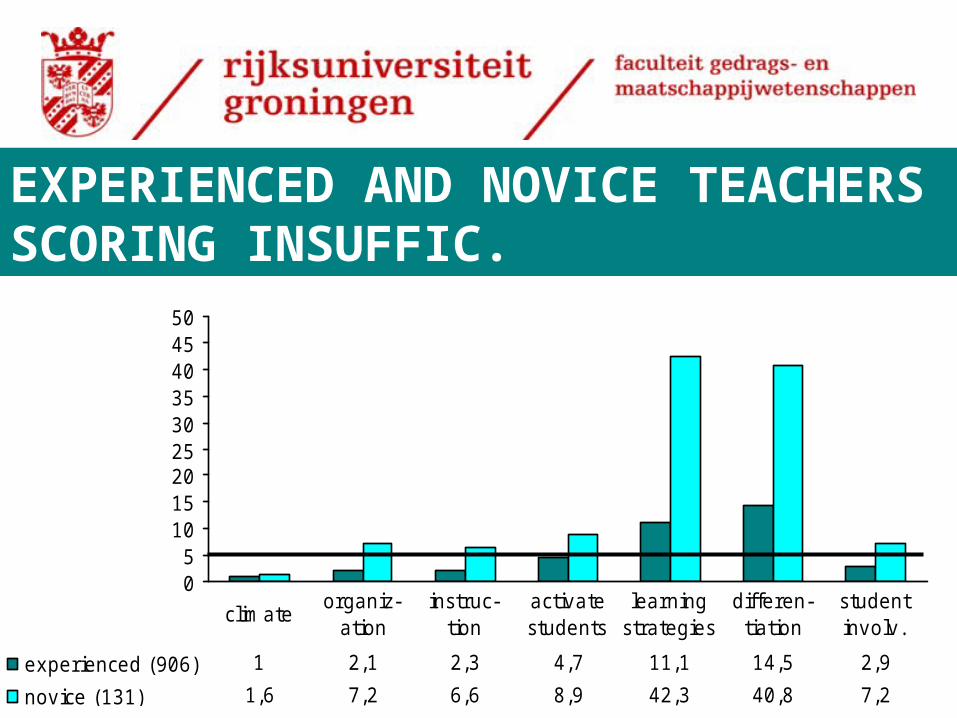
EXPERIENCED AND NOVICE TEACHERS SCORING INSUFFIC.
05
101520253035404550
experienced (906) 1 2,1 2,3 4,7 11,1 14,5 2,9
novice (131) 1,6 7,2 6,6 8,9 42,3 40,8 7,2
climateorganiz-
ationinstruc-
tionactivate students
learning strategies
differen-tiation
student involv.

80-85% of the teachers with 20-30 years of experience seem to have
a serious dip in their teaching abilities
Part of the explanation is the relatively large group of male teachers with a licence for lower secondary education only
MAIN CONCLUSIONS (1)
Before we might hint to longitudinal explanations (mid life crisis) we should explore:
* Mobility to other positions like school management, inspector, teacher trainer
* Quality of teacher training institutes about 25 years ago (NLO started between 1970-1980)
* Dramatic changes in teacher salaries in 1985 (HOS)
MAIN CONCLUSIONS (2)