Paper No. 08466 - Institute for Corrosion and Multiphase
15
Copyright ©2008 by NACE International. Requests for permission to publish this manuscript in any form, in part or in whole must be in writing to NACE International, Copyright Division, 1440 South creek Drive, Houston, Texas 777084. The material presented and the views expressed in this paper are solely those of the author(s) and are not necessarily endorsed by the Association. Printed in the U.S.A. A Study of the Chemical Composition and Corrosivity of the Condensate in Top of the Line Corrosion Dezra Hinkson* 1 , Marc Singer, Ziru Zhang, Srdjan Nesic Institute for Corrosion and Multiphase Technology Ohio University 342 West State St Athens, Ohio 45701 ABSTRACT The three key aspects of the top of the line corrosion process are condensation, chemical speciation and corrosion. The focus of this study is on the condensate speciation through a thermodynamic approach. Specifically, the aim of this study is to determine the concentration of acetic acid in the condensate. The presence of acetic acid tends to increase the corrosion rate and to promote localized corrosion. The results of this study show that the concentration of free acetic acid in the condensate is determined predominantly by the pH of the liquid phase, which is changed by the corrosion process. The concentration of total acetic acid seems to decrease as the condensation rate increases. The understanding and results gained from this study will lead to the creation of a complete predictive model for top of the line corrosion. Keywords: top of the line corrosion, condensation, acetic acid. INTRODUCTION Top of the line corrosion is mutually influenced by three factors. Firstly, the amount of water present on the metal surface at the top of the line is determined by the condensation rate. Secondly, the composition and distribution of chemical species in the condensate influences the corrosivity of the condensate. Thirdly, the corrosion process in turn influences the condensate chemistry by introducing corrosion products (ferrous ions) and altering the pH and the pH-dependent equilibria. The desire to 1 * Current Address: Occidental Petroleum Corporation, 28590 Highway 119, P.O. Box 1001, Tupman, CA 93276-1001. 1 Paper No. 08466
Transcript of Paper No. 08466 - Institute for Corrosion and Multiphase

Copyright ©2008 by NACE International. Requests for permission to publish this manuscript in any form, in part or in whole must be in writing to NACE International, Copyright Division, 1440 South creek Drive, Houston, Texas 777084. The material presented and the views expressed in this paper are solely those of the author(s) and are not necessarily endorsed by the Association. Printed in the U.S.A.
A Study of the Chemical Composition and Corrosivity of the Condensate in Top of the Line Corrosion
Dezra Hinkson*1, Marc Singer, Ziru Zhang, Srdjan Nesic Institute for Corrosion and Multiphase Technology
Ohio University 342 West State St
Athens, Ohio 45701
ABSTRACT
The three key aspects of the top of the line corrosion process are condensation, chemical speciation and corrosion. The focus of this study is on the condensate speciation through a thermodynamic approach. Specifically, the aim of this study is to determine the concentration of acetic acid in the condensate. The presence of acetic acid tends to increase the corrosion rate and to promote localized corrosion. The results of this study show that the concentration of free acetic acid in the condensate is determined predominantly by the pH of the liquid phase, which is changed by the corrosion process. The concentration of total acetic acid seems to decrease as the condensation rate increases. The understanding and results gained from this study will lead to the creation of a complete predictive model for top of the line corrosion. Keywords: top of the line corrosion, condensation, acetic acid.
INTRODUCTION
Top of the line corrosion is mutually influenced by three factors. Firstly, the amount of water present on the metal surface at the top of the line is determined by the condensation rate. Secondly, the composition and distribution of chemical species in the condensate influences the corrosivity of the condensate. Thirdly, the corrosion process in turn influences the condensate chemistry by introducing corrosion products (ferrous ions) and altering the pH and the pH-dependent equilibria. The desire to
1* Current Address: Occidental Petroleum Corporation, 28590 Highway 119, P.O. Box 1001, Tupman, CA 93276-1001.
1
Paper No.
08466

better describe the mechanistic interaction of these three factors on the top of the line corrosion have motivated the present research work.
In wet gas pipelines, the main corrosive species are CO2, H2S and organic acids. All of these species can be found in both the gas phase and the liquid phase. From bottom of the line corrosion studies1, organic acids are known to increase the risk of corrosion. Since organic acids are volatile, they can be a potential cause of corrosion in the condensed liquid at the top of the line. This begs several questions: What is the concentration of organic acids at the top of the line? What is the distribution of organic acids between the corrosive, undissociated form and the dissociated form which is not related to metal loss? How can the concentration and chemical speciation at the top of the line be predicted?
To answer these questions, acetic acid was chosen as being a representative organic acid. The corrosive and volatile behavior of acetic acid is valid for the low molecular weight organic acids of concern to oil and gas operations, specifically C1 through C4 (that is, formic acid, acetic acid, propionic acid and butyric acid). The acid dissociation values of propionic and butyric acids are similar to that of acetic acid2. The acid dissociation constant of formic acid is ten times larger (or the pKa of formic acid is one log unit less) than that of acetic acid3. Despite this, equivalent concentrations of undissociated acetic acid and undissociated formic acid lead to a similar corrosive rate4. Additionally, in most oil and gas fields, acetic acid is the predominant type of organic acid present.
Organic acids can affect the corrosion rate in three ways: (i) by increasing the cathodic reaction rate – Organic acids, for example, acetic acid (CH3COOH, here represented as, HAc), can increase the cathodic reaction rate by acting as a source of protons (Equation 1) which can then be reduced (Equation 2).
HAc H+ + Ac- (1)
H+ + e- ½ H2 (2) or by being directly reduced (Equation 3).
2 HAc + 2 e- H2 + 2 Ac- (3) (ii) by inhibiting the anodic dissolution reaction – Crolet et al.5 found that acetic acid has a slight inhibiting effect on the anodic dissolution of iron. Sercombe et al.6 also observed inhibition of the corrosion rate by acetic acid at low temperatures (25 – 40 ºC), possibly due to a film-forming effect. (iii) by changing the solubility and protectiveness of the corrosion product films – Crolet and Bonis2 suggest that acetic acid prevents the precipitation of protective iron carbonate by favoring the soluble iron acetate. On the contrary, Nafday and Nesic7 argued that free acetic acid increases the corrosion rate by lowering the pH and not by providing a more soluble corrosion product. More recently, Fajardo et al4 demonstrated that organic acids increase the amount of time required to form a protective iron carbonate film, thereby lengthening the time during which high corrosion rates can be sustained.
2

Regardless of the mechanism, it is accepted that the corrosion rate increases as the concentration of acetic acid increases even at the same pH. Specific to the top of the line, Singer et al.8 observed that as little as 18 ppm of free acetic acid is sufficient to almost double the corrosion rate at the top of the line in short term tests.
Because of the ability of organic acids to increase the corrosion rate, the composition and distribution of organic acids in the condensate at the top of the line was investigated experimentally. A thermodynamic modeling approach was developed to predict the concentration of acetic acid at the top of the line.
EXPERIMENTAL WORK
The interaction between condensation, chemical speciation and corrosion was studied in two
series of experiments. In the first series, experiments were performed in non-corroding systems to characterize the influences of condensation and chemical speciation on the resulting condensate chemistry. The second series of experiments went a step further by including the corrosion aspect. Series I: Non-corroding systems
The non-corroding system studied was CO2/HAc/H2O. The objective here was to understand the vapor/liquid partitioning of these species at different condensing conditions, that is, for different condensation rates.
The condensation process supplies the undissociated acetic acid to the condensate according to the vapor/liquid equilibrium.
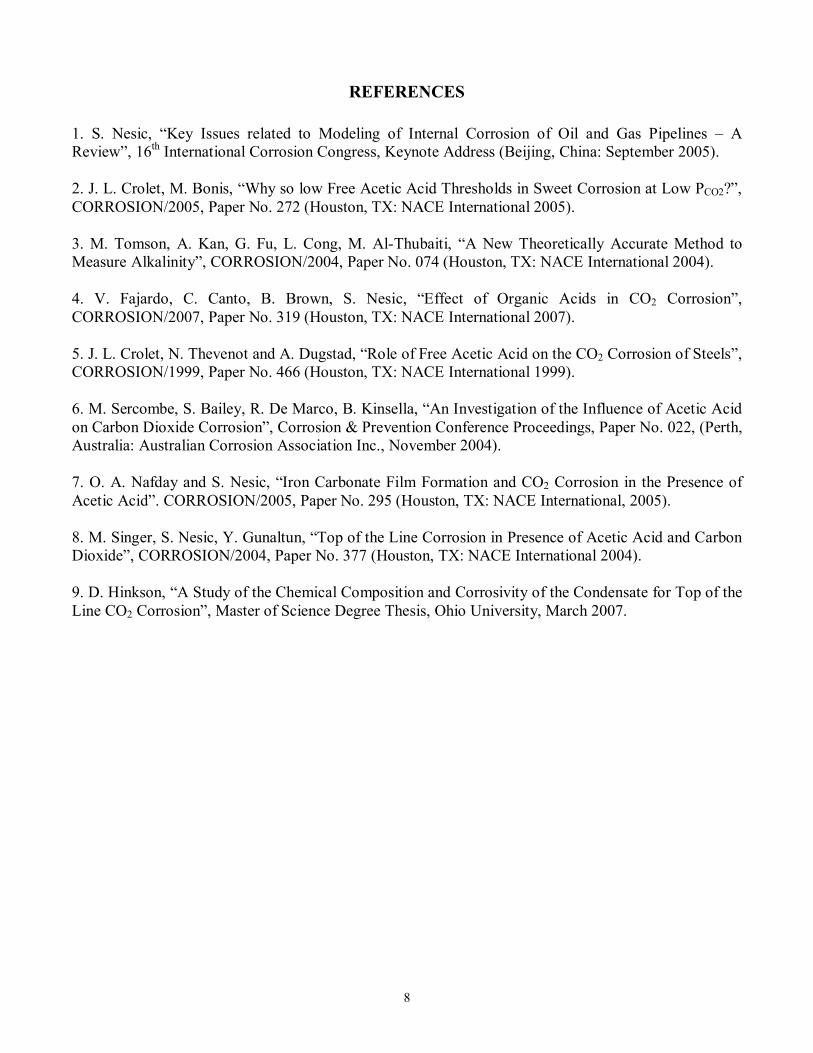
HAc (g) HAc (aq) (4) The condensation of acidic species (organic acids plus dissolved CO2) leads to a pH decrease as described by Equation 1. Series I: Non-corroding systems – Experimental. The experimental setup for this series of tests consisted of a modified distillation apparatus (Figure 1). Two flasks were filled with solutions containing the same concentration of acetic acid. The first flask served as a “prebubbler”. This prebubbler was used to saturate the gas phase with acetic acid and thereby prevent stripping of acetic acid from the second flask, labeled as the “tank”. The “tank” simulated the source of acetic acid to the gas phase which in a pipeline scenario would be the bottom of the line. The carrier gas, carbon dioxide, was bubbled through the “prebubbler”, then the “tank”, and finally allowed to cool down and partly condense in the condenser before being vented. Either CO2 or water was used as the coolant in the condenser depending on the desired temperature drop that needed to be achieved. The condensed liquid was collected and its organic acid concentration was analyzed by ion chromatography. The test parameters are given in Table 1.The temperatures (liquid, vapor and condensate), gas flow rates (carrier gas and cooling gas) and the concentration of acetic acid (tank liquid and condensate) were all measured and recorded. Series I: Non-corroding systems – Results. The variation of concentration of total acetic acid in the condensate versus the temperature drop over which condensation occurred is shown in Figure 2. It was observed that the concentration of total acetic acid in the condensate decreased as the temperature drop
3

for condensation increased, that is, as the condensation rate increased. Since these results are for freshly condensing liquid in the absence of corrosion, the condensate pH was low (~ 3.5) and there was minimal dissociation of acetic acid to give acetate. Series II: Corroding systems
The chemical composition of the condensate is also influenced by the corrosion process (Figure 3). The corrosion process tends to lead to an increase of pH as H+ ions are consumed by the cathodic reaction (Equation 2).
In a related study9, the change in concentration of free acetic acid in the condensate was found to be predominantly influenced by the liquid equilibrium. The liquid equilibrium refers to the acid dissociation equilibria in the liquid. The liquid equilibrium is achieved 8 – 10 orders of magnitude faster than the vapor/liquid equilibrium. Series II: Corroding systems – Experimental. The experimental setup shown in Figure 1 was modified for testing the distribution of organic acids in a corroding system (Figure 4). A carbon steel tube was inserted into the condenser such that condensation occurred directly on the inside surface of the steel tube. Thus, the condensation and corrosion processes were studied together.
As in Series I, the condensation rate was controlled by adjusting the flow rate of the coolant (here, water) and measuring the temperature drop over which condensation occurred. The test matrix is given in Table 2. The condensate was analyzed for the concentration of total acetic acid (by ion chromatography), the concentration of dissolved iron (by spectrophotometry) and the concentration of hydrogen ions (by pH measurement). Series II: Corroding systems – Results. As with the non-corroding system (Figure 2), it was observed that the concentration of total acetic acid in the corroding system decreased as the temperature drop for condensation increased (Figure 5). The explanation for this behavior is presented in the following section on thermodynamic modeling.
The dissolved iron concentration showed a slightly increasing trend although there was some
scatter in the data (Figure 6). Each of these tests lasted for 2 hours but the actual time of contact between the condensing liquid and the corroding steel was much shorter than this. Thus, the vapor/liquid equilibrium was not maintained accurately in these tests. Consequently, the increase of pH due to the release of ferrous ions by corrosion resulted in dissociation of acetic acid in the condensate. Because the concentration of dissolved iron (and the pH) increased with the temperature drop, the concentration of free acetic acid decreased (Figure 7). It is postulated that in the pipeline scenario, the relatively short droplet residence time means that a similar situation to this series of tests develops: that the vapor/liquid equilibrium is not sustained and the concentration of free organic acid in the condensate is determined by the pH change due to corrosion.
THERMODYNAMIC MODELING
The system was modeled using a thermodynamic approach wherein steady state or equilibrium conditions were assumed. Firstly, the modeling of non-corroding systems is presented. The vapor/liquid equilibrium can be described by Henry’s law for acetic acid and Antoine’s equation for water. In the liquid, the equilibria among aqueous species were described by the acid dissociation expressions. In order to solve for the concentration of species, the set of equations was completed by applying the
4

conservation of mass (species mass balances) and the conservation of charge (electroneutrality condition). The calculation scheme is given below.
Nomenclature:
• Tgas,in and Tgas,out - the inlet and outlet gas temperature of the pipeline section • pH2O(Tgas) (bar) - the partial pressure of water at the specified gas temperature, Tgas as calculated
by Antoine’s equation • Vliq (L) - the total volume of water that condensed out (assuming condensation rate is given by
the dominant species, water only) • [HAc,free]tank (mol/L) - the amount of undissociated acetic acid in the tank • [HAc,free]cond (mol/L) - the amount of undissociated acetic acid in the condensate • HHAc(Tgas) (mol/L/bar) -the Henry’s law constant calculated at the specified gas temperature, Tgzs • pHAc(Tgas) (bar) - the partial pressure of acetic acid at the specified gas temperature, Tgas • pCO2(Tgas) (bar) - the partial pressure of carbon dioxide • ngas,in - the number of moles of acetic acid (or CO2) present in the gas entering the pipe section,
calculated using ideal gas assumption at the inlet gas temperature, Tgas,in • ngas,out - the number of moles of acetic acid (or CO2) present in the gas leaving the pipe section,
calculated using ideal gas assumption at the exit gas temperature, Tgas,out • nliq,cond - the number of moles of acetic acid (or CO2) that condenses out into the liquid phase • KHAc,dissoc - the dissociation constant of acetic acid. This is only a function of temperature.
The results of the thermodynamic calculations showed that as the temperature drop for
condensation increased, the concentration of acetic acid in the condensate decreased. The agreement between these theoretical predictions and the results of the experiments done in a non-corroding system (Series I) validates the model (Figure 8). Translating the model prediction for a non-corroding system to a pipeline scenario gives the profile for freshly condensing liquid before the onset of corrosion (Figure 9).
In Figure 9,a simulation was done where it was assumed that the concentration at the bottom of the line (BOL) is constant. Each “droplet” at the top of the line is in equilibrium with the bottom of the line considering a temperature drop from 70 ºC to 69 ºC, 70 ºC to 68 ºC, and so on. Thus, the third
5

“droplet” shows the concentration of total acetic acid expected at the top of the line if the gas were to be condensed from 70 ºC to 67 ºC. Simple reasoning based on the fact that the boiling point of acetic acid is slightly above that of water may lead one to conclude that the concentration of acetic acid should increase as the temperature drop (or the condensation rate) is increased. However, the observed behavior was contrary to this. This is best explained by considering that the amount of acetic acid in the condensate is related to the change in partial pressure of acetic acid in the gas. For a given drop in temperature, the loss in partial pressure of water is larger than the loss in partial pressure of acetic acid (Figure 10). Figure 10 was constructed using Antoine’s equation for water and Henry’s law for acetic acid concentration, considering an acetic acid concentration of 1000 ppm in the initial liquid phase.
This relationship between the change in partial pressure of acetic acid versus that of water around 70 ºC is further confirmed by the behavior of the vapor/liquid equilibrium at the boundary conditions. If there is only a minor temperature drop, then the concentration of acetic acid of the condensate at the top of the line more closely compares with the concentration in the source liquid at the bottom of the line. From Figure 9, a bottom of the line free acetic acid concentration of 970 ppm corresponds with a top of the line acetic acid concentration of 965 ppm for a temperature drop of 1 ºC (from 70 ºC to 69 ºC). At the other extreme, if the gas is completely condensed, then the concentration of acetic acid in the condensate is comparable with the concentration of acetic acid in the gas phase. A bottom of the line free acetic acid concentration of 970 ppm is in equilibrium with ~ 670 ppm of acetic acid in the vapor phase (at 70 ºC). If all this vapor was completely condensed, the concentration of acetic acid in the condensate would be equal to the concentration in the gas phase, that is, ~ 670 ppm. Between these two extremes, there is a decrease in concentration of acetic acid in the condensate with increasing temperature drop which is approximately linear (see theoretical results in Figure 8).
The experimental work and calculations described above have led to two important conclusions which can be used as the starting point to determine the distribution of chemical species in a corroding system. Firstly, the above experiments prove that the thermodynamic approach can be successfully used to predict the concentration of species in freshly condensed liquid. Secondly, the distribution of species in the condensate is influenced predominantly by the liquid equilibrium and more specifically, the pH. These findings will be used as the assumptions when considering the corroding system.
For the corroding system, the calculation scheme given earlier in this section was used to obtain
the concentration of total organic acid in the condensate. The acid dissociation in the condensate was then evaluated based on modifying the charge balance to include ferrous ions (Equation 5).
[H+] + 2[Fe2+] = [OH-] + [Ac-] + [HCO3-] + 2[CO3
2-] (5)
A concentration of ferrous ions was introduced into the model and the concentration of all species was recalculated to restore equilibrium. The concentration of ferrous iron was then increased incrementally to simulate what would happen as the steel corroded. Reiterations were done until the condensate was supersaturated with iron carbonate. The model developed and tested with benchtop apparatus was then extended to model the condensate chemistry in a corroding pipeline.
6

MODELING THE CONDENSATE COMPOSITION IN A PIPELINE
For the pipeline scenario (Figure 11), typically, the gas temperature and gas flow rate are known. In order to calculate the concentration of species in the top of the line condensate, it is necessary to know the pH and concentration of volatile species in the bottom of the line. The thermodynamic modeling approach described in this paper was applied using the baseline conditions shown in Table 3. The model predictions gave the evolution of the concentration of species with time (Figure 12). Initially, at time = 0 hours, the acetic species exist almost completely as undissociated acid. This is because the initial pH is low (~ 3.3). However, as the time increases, ferrous ions are released into solution by the corroding steel and the pH increases. This results in an increase in the acetate concentration accompanied by a proportionate decrease in free acetic acid concentration. The concentrations of total acetic acid and of dissolved CO2 are constant because of the assumption that the time needed to achieve and maintain vapor/liquid equilibrium is too slow relative to the droplet residence time. The concentration and distribution of all chemical species are thus defined.
CONCLUSIONS
From this study on acetic acid concentration in non-corroding and corroding condensate systems, the following conclusions regarding top of the line corrosion can be drawn:
• The concentration of total organic acid in the condensate at the top of the line can be predicted by a thermodynamic consideration of the vapor/liquid equilibrium.
• The distribution of organic acid in the condensate between dissociated and undissociated forms is predominantly influenced by the pH of the condensate as determined by the increase in dissolved ferrous concentration due to corrosion.
• As the condensation rate increases, the concentration of organic acid in the condensate decreases. That is, a low condensation rate would present a more concentrated solution of the organic acids at the top of the line than a higher condensation rate would.
• This thermodynamic approach can be applied to other volatile species which are known to be problematic from a corrosion point of view, such as CO2 and H2S.
The above methodology for the prediction of the concentration of corrosive species in the
condensate allows the corrosion rate at the top of the line to be accurately determined from mechanistically sound principles.
ACKNOWLEDGEMENTS
The author is grateful for the technical support of the staff at the Institute for Corrosion and Multiphase Technology, Ohio University and for organic acid analysis provided by Dr James Thompsen, ConocoPhillips. This work was made possible through the financial support and guidance of the following companies: ConocoPhillips, Total, ENI and BP.
7
REFERENCES 1. S. Nesic, “Key Issues related to Modeling of Internal Corrosion of Oil and Gas Pipelines – A Review”, 16th International Corrosion Congress, Keynote Address (Beijing, China: September 2005). 2. J. L. Crolet, M. Bonis, “Why so low Free Acetic Acid Thresholds in Sweet Corrosion at Low PCO2?”, CORROSION/2005, Paper No. 272 (Houston, TX: NACE International 2005). 3. M. Tomson, A. Kan, G. Fu, L. Cong, M. Al-Thubaiti, “A New Theoretically Accurate Method to Measure Alkalinity”, CORROSION/2004, Paper No. 074 (Houston, TX: NACE International 2004). 4. V. Fajardo, C. Canto, B. Brown, S. Nesic, “Effect of Organic Acids in CO2 Corrosion”, CORROSION/2007, Paper No. 319 (Houston, TX: NACE International 2007). 5. J. L. Crolet, N. Thevenot and A. Dugstad, “Role of Free Acetic Acid on the CO2 Corrosion of Steels”, CORROSION/1999, Paper No. 466 (Houston, TX: NACE International 1999). 6. M. Sercombe, S. Bailey, R. De Marco, B. Kinsella, “An Investigation of the Influence of Acetic Acid on Carbon Dioxide Corrosion”, Corrosion & Prevention Conference Proceedings, Paper No. 022, (Perth, Australia: Australian Corrosion Association Inc., November 2004). 7. O. A. Nafday and S. Nesic, “Iron Carbonate Film Formation and CO2 Corrosion in the Presence of Acetic Acid”. CORROSION/2005, Paper No. 295 (Houston, TX: NACE International, 2005). 8. M. Singer, S. Nesic, Y. Gunaltun, “Top of the Line Corrosion in Presence of Acetic Acid and Carbon Dioxide”, CORROSION/2004, Paper No. 377 (Houston, TX: NACE International 2004). 9. D. Hinkson, “A Study of the Chemical Composition and Corrosivity of the Condensate for Top of the Line CO2 Corrosion”, Master of Science Degree Thesis, Ohio University, March 2007.
8

Table 1: Test parameters for Series I: non-corroding experiments.
Series I: Non-corroding system
Temperature, Tgas,in 68 ºC (Ttank,liq set at 70 ºC)
Temperature difference condensation rate 5, 10, 20, 30, 40 ºC
Pressure 1 atm
[HAc, total]tank 1000 ppm
Table 2: Test parameters for Series II: corroding experiments.
Series II: Corroding system
Temperature, Tgas,in 68 ºC (Ttank,liq set at 70 ºC)
Temperature difference condensation rate 4 – 16 ºC
Pressure 1 atm
[HAc, total]tank 1200 ppm
Table 3: Input parameters for model simulation of the condensate chemistry in a corroding pipeline..
Parameter Description Baseline Value Tgas,in Gas temperature entering the pipe section 70 ºC
Tgas,out Gas temperature leaving the pipe section Calculated based on the condensation rate
Tgas,avg Average gas temperature in the pipe section Calculated based on the condensation rate
Ptotal Total pressure 3 bar pCO2 Partial pressure of carbon dioxide 2 bar Cond.rate Condensation rate 0.25 mL/m2/s CRTOL Corrosion rate at the top of the line 0.25 mm/y
[HAc total]BOL Concentration of total acetic acid at the bottom of the line 100 ppm
pHBOL pH at the bottom of the line 4 vgas Gas flowrate 5 m/s Pipe ID Pipe internal diameter 4 inches L Pipe length 1 m r Droplet radius 5 mm t Maximum residence time of a droplet 100 min
9
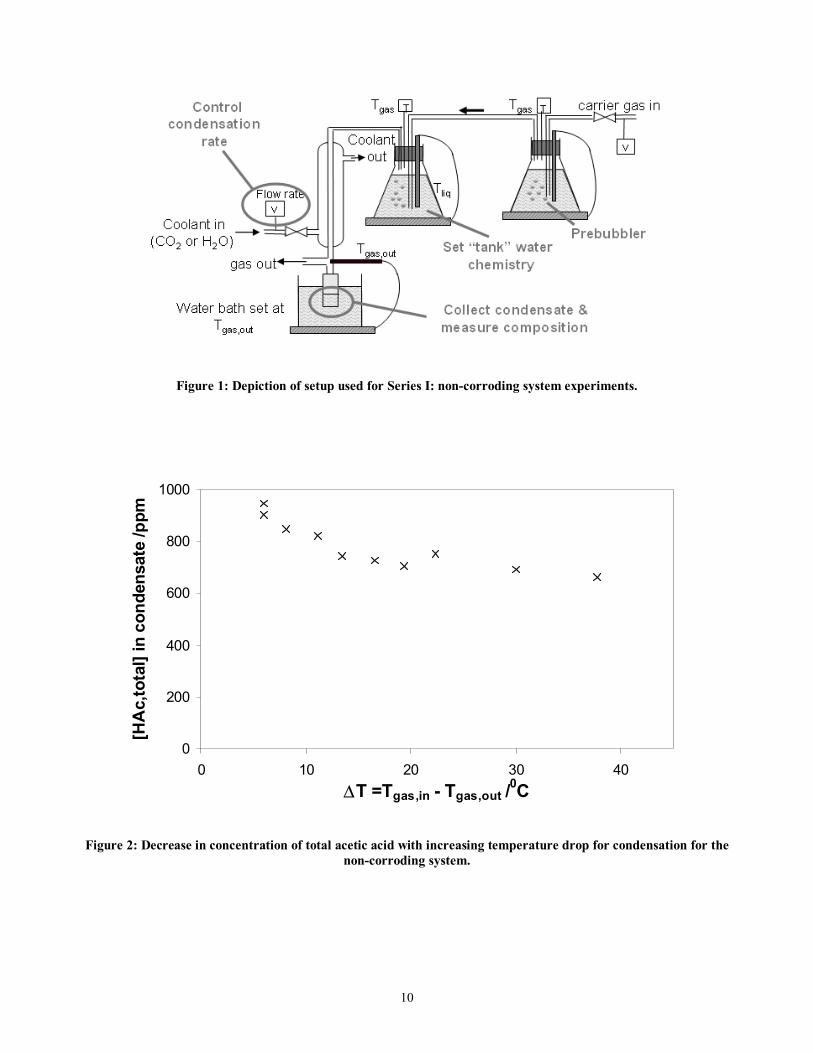
Figure 1: Depiction of setup used for Series I: non-corroding system experiments.
0
200
400
600
800
1000
0 10 20 30 40∆T =Tgas,in - Tgas,out /
0C
[HA
c,to
tal]
in c
onde
nsat
e /p
pm
Figure 2: Decrease in concentration of total acetic acid with increasing temperature drop for condensation for the non-corroding system.
10

Figure 3: Schematic of the key processes influencing the chemical speciation in a droplet.
Figure 4: Depiction of setup used for Series II: corroding system experiments.
11

Figure 5: Slight decrease in concentration of total acetic acid as the temperature drop for condensation increased.
Figure 6: Increase of dissolved iron in the condensate as the temperature drop for condensation increased.
12

Figure 7: Decrease in concentration of free acetic acid in the condensate as the temperature drop for condensation
increased.
Figure 8: Comparison of experimental and theoretical results for Series I: non-corroding system.
13

Figure 9: Schematic of acetic acid concentration in freshly condensed liquid along a pipeline.
Figure 10: Variation of partial pressures of water and acetic acid with temperature.
14
Figure 11: Schematic of the model parameters for a pipeline scenario.
(BOL: bottom of the line; TOL: top of the line)
Figure 12: Evolution of concentration profiles within a droplet.
15