Paper No. 01-0177 - Missouri University of Science and ...web.mst.edu/~norbert/pdf/010177.pdf ·...
14
1 Paper No. 01-0177 Duplication for publication or sale is strictly prohibited without prior written permission of the Transportation Research Board Title: Measurement of Flat and Elongation of Coarse Aggregate Using Digital Image Processing Authors: Norbert H. Maerz, Department of Geological Engineering, University of Missouri-Rolla, 1006 Kingshighway, Rolla MO, 65409, USA. Tel: (573) 341-6714, Fax: (573) 341-4368, e-mail: [email protected]. Mike Lusher, Department of Civil Engineering, University of Missouri- Rolla, 111 Bultler-Carlton Hall, Rolla MO, 65409-0660, USA. Tel: (573) 341-4457, Fax: (573) 341-4729, e-mail: [email protected]. Transportation Research Board 80 th Annual Meeting January 7-11, 2001 Washington, D.C.
Transcript of Paper No. 01-0177 - Missouri University of Science and ...web.mst.edu/~norbert/pdf/010177.pdf ·...
1
Paper No. 01-0177
Duplication for publication or sale is strictly prohibited without prior written permission
of the Transportation Research Board
Title: Measurement of Flat and Elongation of Coarse Aggregate Using Digital Image Processing
Authors: Norbert H. Maerz, Department of Geological Engineering, University of
Missouri-Rolla, 1006 Kingshighway, Rolla MO, 65409, USA. Tel: (573) 341-6714, Fax: (573) 341-4368, e-mail: [email protected].
Mike Lusher, Department of Civil Engineering, University of Missouri-Rolla, 111 Bultler-Carlton Hall, Rolla MO, 65409-0660, USA. Tel: (573) 341-4457, Fax: (573) 341-4729, e-mail: [email protected].
Transportation Research Board 80th Annual Meeting January 7-11, 2001 Washington, D.C.

2
Measurement of Flat and Elongation of Coarse Aggregate Using Digital Image Processing
Norbert H. Maerz, Department of Geological Engineering, University of Missouri-Rolla, 1006 Kingshighway, Rolla MO, 65409, USA. Tel: (573) 341-6714, Fax: (573) 341-4368, e-mail: [email protected]. Mike Lusher, Department of Civil Engineering, University of Missouri-Rolla, 111 Bultler-Carlton Hall, Rolla MO, 65409-0660, USA. Tel: (573) 341-4457, Fax: (573) 341-4729, e-mail: [email protected].
ABSTRACT
Coarse aggregate shape (flat and elongated) and angularity are important issues in the highway industry. Elongated aggregates tend to break down during the asphalt emplacement process, or align themselves, resulting in anisotropic pavements. The use of angular aggregate results in a greater interlock and strength of the asphalt product. Measurement of particle shape is a tedious subjective procedure, resulting in a great deal of uncertainty about the results, and indeed of the ability of the tests to reasonably characterize the population of aggregates being produced. Digital image processing is a new approach to measuring these characteristics of aggregates. A new measuring system called WipShape has recently been developed. It images each particle separately, and from two views. A mini-conveyor system has been developed to parade individual fragments past two orthogonally oriented synchronized cameras, fed by aggregates from a hopper. This system designed for continuous automated operation, measures flat and elongated aggregates at ratios of 5:1, 4:1, 3:1, and 2:1. It also has the potential to report various shape factors, including principal axis ratios, roundness, sphericity and angularity. Simultaneously it will produce size distribution curves, and shape measurement summaries by size classes. Research will be conducted to determine if the percentage of fractured faces can also be measured.
KEYWORDS
Flat and elongated, Coarse aggregate angularity, Digital image processing, Automated measurements
INTRODUCTION
Crushed stone, gravel and sand encompass the bulk of the materials used in highway construction, whether for flexible asphalt, rigid concrete, or unbound pavements. Careful selection of these materials ensures that the pavements will perform as designed, and that the pavements will not suffer from premature deterioration.
Aggregates consequently must pass a stringent series of mechanical, chemical and physical tests in order to demonstrate that they will perform satisfactorily, and meet or exceed specifications. Examples of such mechanical tests include abrasion resistance, durability, and resistance to polishing. Chemical tests include sulfate soundness and organic content. Physical tests include aggregate grading (determination of size distributions), aggregate shape, and angularity, sphericity, roundness and surface texture. Coarse aggregate shape (flat and elongated) and angularity are important issues in the highway industry. Elongated aggregates tend to break down during the asphalt emplacement process. Flat aggregates tend to lay flat, imparting anisotropic properties to the finished product. The new Superpave guidelines call for no more than 10% of coarse aggregates to have aspect ratios greater than 5:1, and there is a possibility of a new standard at 3:1. High coarse aggregate angularity (percentage of coarse aggregate with one or two or more fractured faces) results in a greater interlock and strength of the asphalt product. Superpave guidelines call for up to 100% with two or more fractured faces, depending on traffic density.

3
Figure 1, Left: Proportional Caliper for measuring flat and elongated particles. Figure 2, Right: University of Illinois flat and elongated measurement device. The importance of aggregate shape measurements like flat and elongation, fine aggregate angularity and coarse aggregate angularity in concrete and asphalt pavements is only now being realized, most notably in flexible pavement. This new understanding is reflected in the new Superpave (Superior Performing Asphalt Pavements) guidelines developed as a product of the Strategic Highway Research Program (SHRP). D’Angelo (1) summarized these concepts:
1. It is well known that the stability of pavement mixtures increases with increased angularity of the coarse aggregate materials comprising the 80-85% fraction of flexible asphalt pavements. Rounded aggregate provides minimal aggregate interlock, and will easily roll over one another allowing movement with the mix, and deep rutting in the long term performance.
2. Increasing fine aggregate angularity will increase the VMA (voids in mineral aggregate) thereby reducing durability of the pavement.
3. Flat and elongated particles will tend to lie flat during the compaction phase of emplacement, resulting in anisotropic properties and slip planes, and reducing aggregate interlock.
4. Flat and elongated particles will tend to break during the compaction phase of emplacement, changing the design gradation characteristics of the aggregate part of the mix. In some cases the deterioration could drive the gradation curve into the so-called “restricted zone”, a zone through which the gradation is not allowed to pass.
The test procedures for many aggregate tests have been well established and are specified, for example, by ASTM standards, AASHTO standards, or Superpave guidelines. In most cases the methods of testing is well accepted by the industry. However, physical testing, such as aggregate grading and aggregate shape has always been a time-consuming, tedious and labor-intensive process. Consequently these types of tests are often performed reluctantly and infrequently, resulting in test results that are perhaps not statistically representative. Currently manual measurements using calipers are employed for flat and elongated (2) (Figure 1). These measurements are not only slow and laborious, but are also highly subjective. Because they are so inefficient and expensive, there tend not to be enough measurements to produce a statistically valid sample. New technologies, such as image processing, promise to increase the efficiency and productivity of such tests. Technologies for generating gradations from images of aggregate material are now commercially available. Technologies for measuring aggregate shape and related parameters are in the process of being developed.
Manual Measurements
The potential impact of using image analysis for characterizing aggregate size and shape is immense, in terms of time and cost savings and better characterization of the aggregates. Taking for example the current methodology for measuring flat and elongated particles, as per ASTM specification D 4791-95 (2). This involves first obtaining a sample and screening it into the various size fractions. Each piece then needs to be manually handled, by first passing it through one side of the proportional caliper (Figure 1), then rotating it and passing it through the other side. Based on whether the

4
piece passes through the caliper or not it is placed in a separate pile. Each pile, for each size fraction needs to be weighed, and tabulated. If more than one aspect ratio is required, then this procedure must be repeated for each aspect ratio to be measured (3:1, 5:1). If flatness and/or elongation are to be measured individually, the entire task has to be repeated. This task is tedious, and consequently there is a potential for poor implementation and poor results. Because it is labor intensive and time consuming, it is costly. A typical sample may take up to an hour for analysis, and results may not be available for several hours, during which 100’s of tons of material may be produced that do not meet specifications. For all these reasons the test is typically underutilized by the industry. The impacts of a successful image based methodology are numerous:
1. Test results, removed from human subjectivity, will be much more reliable. No longer will the test results vary between operators, or vary based on the disposition of an operator.
2. A greater number of tests will be performed. Faster testing, and the low per unit cost of
incremental tests, will result in an increased amount of tests being conducted, allowing better and more statistically valid characterization.
3. Run time adjustments to crushing, screening and other processing equipment will be possible.
Because the analysis is quick, a significant reduction of off-specification material can be achieved, and there will be less incentive to pass off-specification material.
New imaging technologies
Image analysis techniques can and are being applied to geological materials such as rock. Examples include the use of video gradation techniques for the explosives, mining, and materials handling techniques (3,4,5,6). Two dimensional shape analyses are possible using such systems as WipFrag (4) or the VDG-40 (7), systems that were originally designed for granulometry rather than for shape measurement. The problem with this approach is that particles tend to lay flat, consequently it is usually the most critical dimension of the particle that is not measured. This approach has been rejected by the industry as being inadequate. Several laboratories have developed methods by which particles are stacked in a plexiglass holder, and imaged using two orthogonal cameras, or using a single camera but rotating the holder (8,9). While these methods clearly provide the capability for true 3 dimensional measurements, they are still limited because they still rely heavily upon manual intervention to load and reload the holders. Since they are not automated, they are neither quick nor reduce the need for a full time operator. In addition they may suffer from imaging difficulties because the fragments at the ends of the tray are imaged at different angles and different lighting conditions than those in the center of the tray. The University of Illinois has recently developed a three-D method that uses three mutually orthogonal cameras to measure aggregate volume (10) (Figure 2). While this method shows promising results, the apparatus is large and cumbersome, and the method is clearly some distance away from being commercially viable. The method currently under development, and the subject of this paper, uses a miniature-moving conveyor to present individual fragments to two cameras (6,11), (Figure 3). When fully developed, this system will be widely used to replace time-consuming subjective manual measurement for aggregate characterization and testing, for completely automated objective measurements. It will result in reduced cost, greater objectivity, real time results, and the ability to easily measure enough samples to get statistically valid results.
NEW WIPSHAPE SYSTEM
The new method uses a conveyor belt to transport each individual aggregate piece past two orthogonally mounted cameras, typically with the flattest size down (figure 3). Each particle is imaged in exactly the same position by both cameras as it passes a precise location. The speed of processing is currently in the order of 1 sample per second, allowing a typical sample of about 1200 pieces to be processed in 20 minutes. The size range is between #4 sieve and 1” (intermediate diameter), although finer materials can be imaged by increasing the magnification on the cameras.

5
Figure 3. WipShape mini-conveyor.
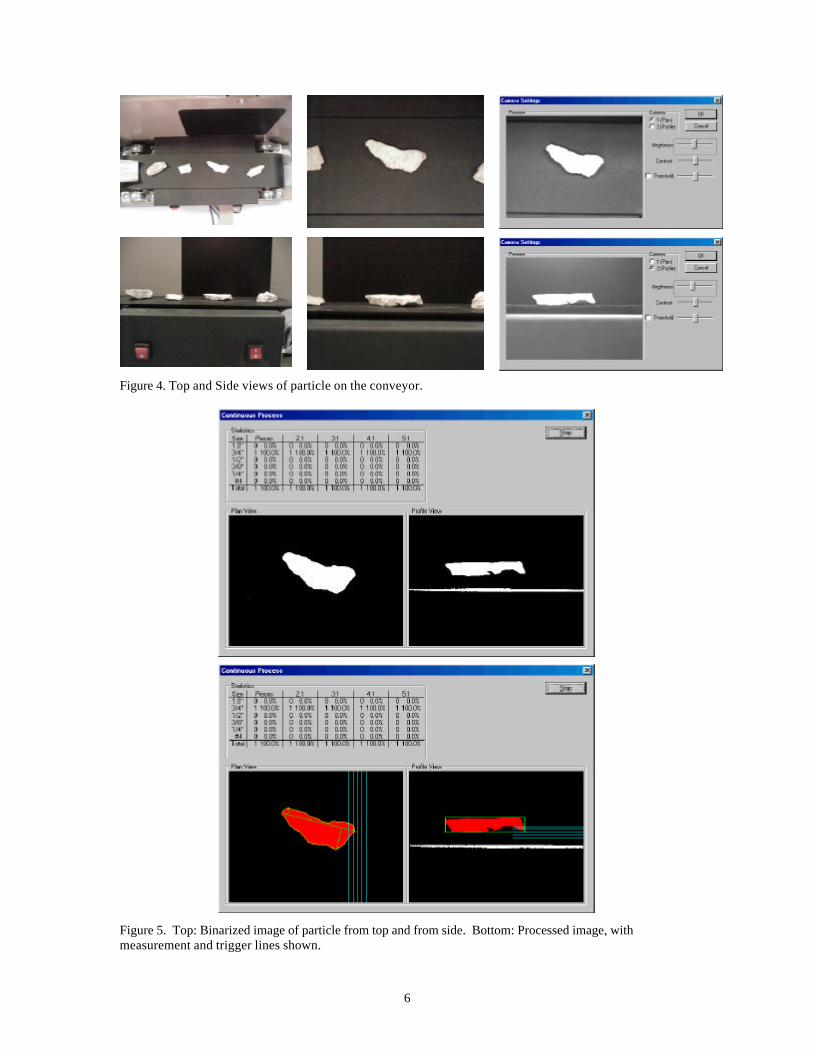
The system images each particle separately, and from two views. The mini-conveyor system has been developed to parade individual fragments with a nominal spacing between each piece (Figure 4). The cameras are synchronized to image the particle from two views at the same time. The belt is fed from a vibrating ramp feeder, and eventually the belt fed by aggregates from an automated hopper. Image processing is used first to detect the presence of a particle in the field of view, and then to analyze the image. Image processing techniques are used to measure the volume, perimeter and major and intermediate axis in the plan view, and the height and minor axis in the profile view. From these measurements, the flatness, elongation, and flatness and elongation are calculated, as well as the volume of the particle. A mass density is assigned to the material, allowing individual fragment weights to be calculated. The data is then tabulated and sorted by both size and aspect ratio (Figure 5). This system, designed for continuous automated operation, measures and sorts flat and elongated aggregates at ratios of 5:1, 4:1, 3:1, and 2:1, and also sorts by size. It also has the potential to report various shape factors, including principal axis ratios, roundness, sphericity and angularity.
6
Figure 4. Top and Side views of particle on the conveyor.
Figure 5. Top: Binarized image of particle from top and from side. Bottom: Processed image, with measurement and trigger lines shown.
7
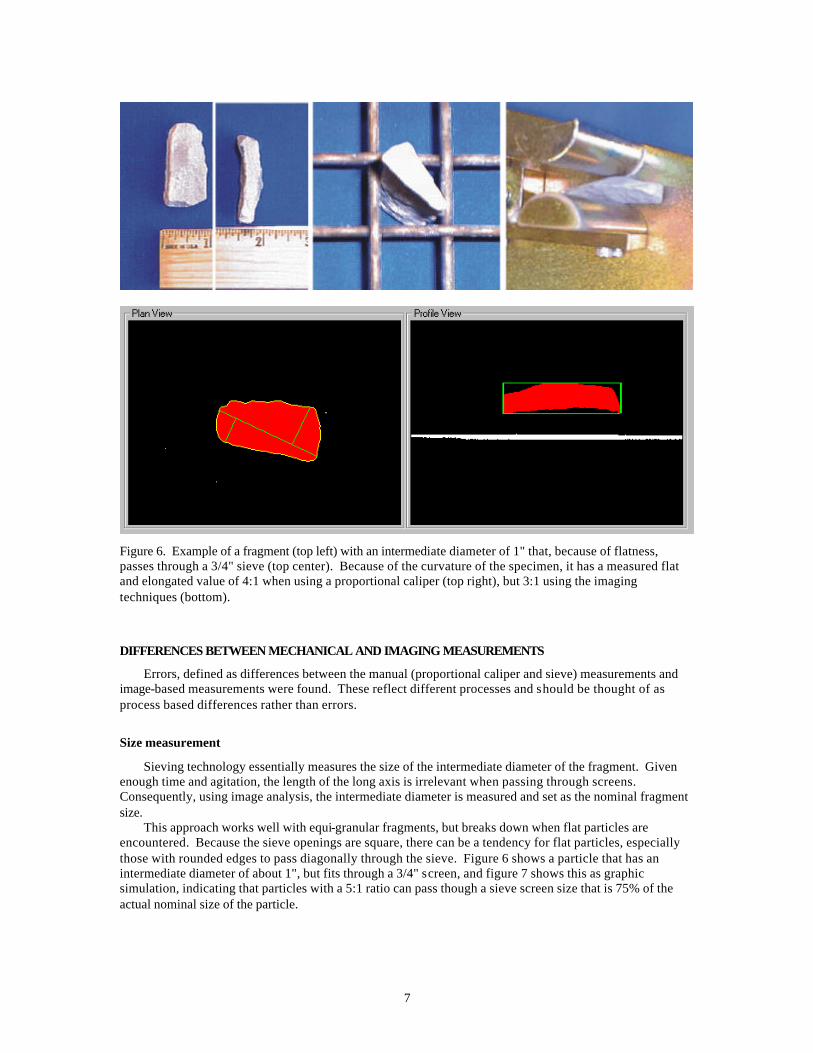
Figure 6. Example of a fragment (top left) with an intermediate diameter of 1" that, because of flatness, passes through a 3/4" sieve (top center). Because of the curvature of the specimen, it has a measured flat and elongated value of 4:1 when using a proportional caliper (top right), but 3:1 using the imaging techniques (bottom).
DIFFERENCES BETWEEN MECHANICAL AND IMAGING MEASUREMENTS
Errors, defined as differences between the manual (proportional caliper and sieve) measurements and image-based measurements were found. These reflect different processes and should be thought of as process based differences rather than errors.
Size measurement
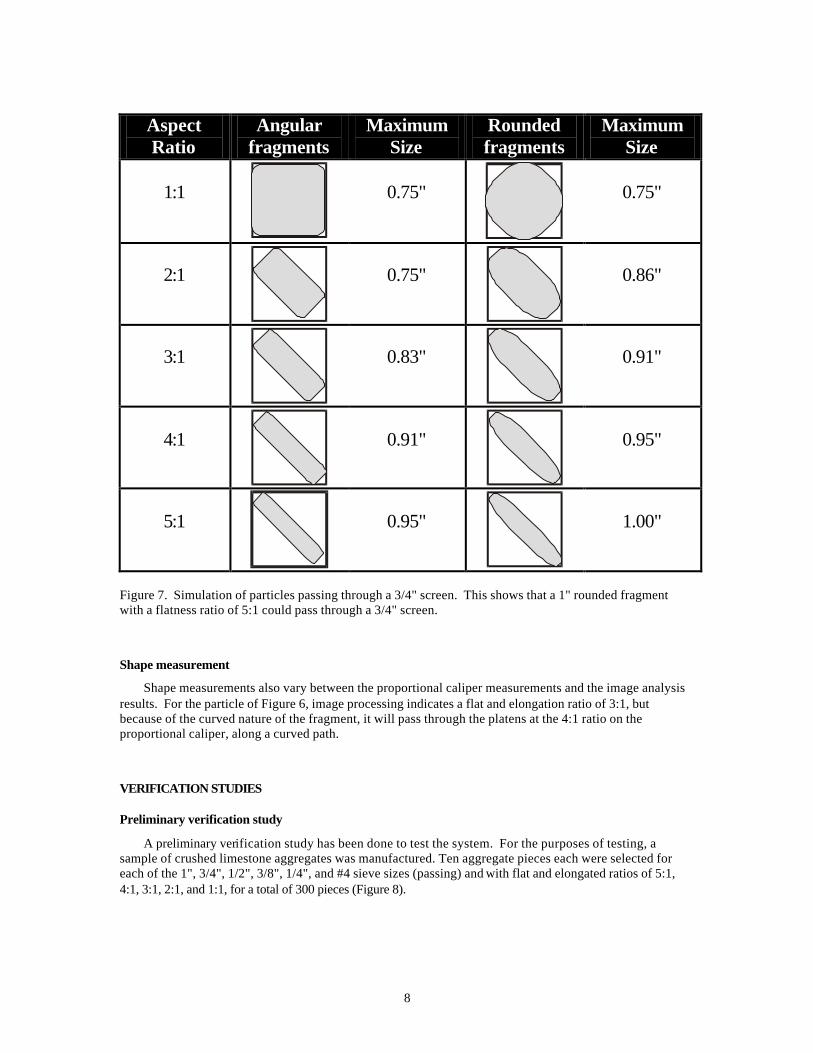
Sieving technology essentially measures the size of the intermediate diameter of the fragment. Given enough time and agitation, the length of the long axis is irrelevant when passing through screens. Consequently, using image analysis, the intermediate diameter is measured and set as the nominal fragment size. This approach works well with equi-granular fragments, but breaks down when flat particles are encountered. Because the sieve openings are square, there can be a tendency for flat particles, especially those with rounded edges to pass diagonally through the sieve. Figure 6 shows a particle that has an intermediate diameter of about 1", but fits through a 3/4" screen, and figure 7 shows this as graphic simulation, indicating that particles with a 5:1 ratio can pass though a sieve screen size that is 75% of the actual nominal size of the particle.
8
Aspect Ratio
Angular fragments
Maximum Size
Rounded fragments
Maximum Size
1:1
0.75"
0.75"
2:1
0.75"
0.86"
3:1
0.83"
0.91"
4:1
0.91"
0.95"
5:1
0.95"
1.00"
Figure 7. Simulation of particles passing through a 3/4" screen. This shows that a 1" rounded fragment with a flatness ratio of 5:1 could pass through a 3/4" screen.
Shape measurement
Shape measurements also vary between the proportional caliper measurements and the image analysis results. For the particle of Figure 6, image processing indicates a flat and elongation ratio of 3:1, but because of the curved nature of the fragment, it will pass through the platens at the 4:1 ratio on the proportional caliper, along a curved path.
VERIFICATION STUDIES
Preliminary verification study
A preliminary verification study has been done to test the system. For the purposes of testing, a sample of crushed limestone aggregates was manufactured. Ten aggregate pieces each were selected for each of the 1", 3/4", 1/2", 3/8", 1/4", and #4 sieve sizes (passing) and with flat and elongated ratios of 5:1, 4:1, 3:1, 2:1, and 1:1, for a total of 300 pieces (Figure 8).
9
Size/Shape 1:1 2:1 3:1 4:1 5:1
1" 10, 111.70 g 10, 141.94 g 10, 135.88 g 10, 188.81 g 10, 168.74 g 3/4" 10, 79.93 g 10, 76.16 g 10, 58.07 g 10, 96.73 g 10, 82.98 g 1/2" 10, 26.50 g 10, 21.63 g 10, 22.30 g 10, 24.20 g 10, 29.91 g 3/8" 10, 9.86 g 10, 14.76 g 10, 14.34 g 10, 11.17 g 10, 9.38 g 1/4" 10, 1.47 g 10, 4.00 g 10, 2.68 g 10, 4.60 g 10, 4.71 g #4 10, 1.15 g 10, 1.58 g 10, 1.32 g 10, 2.44 g 10, 1.89 g
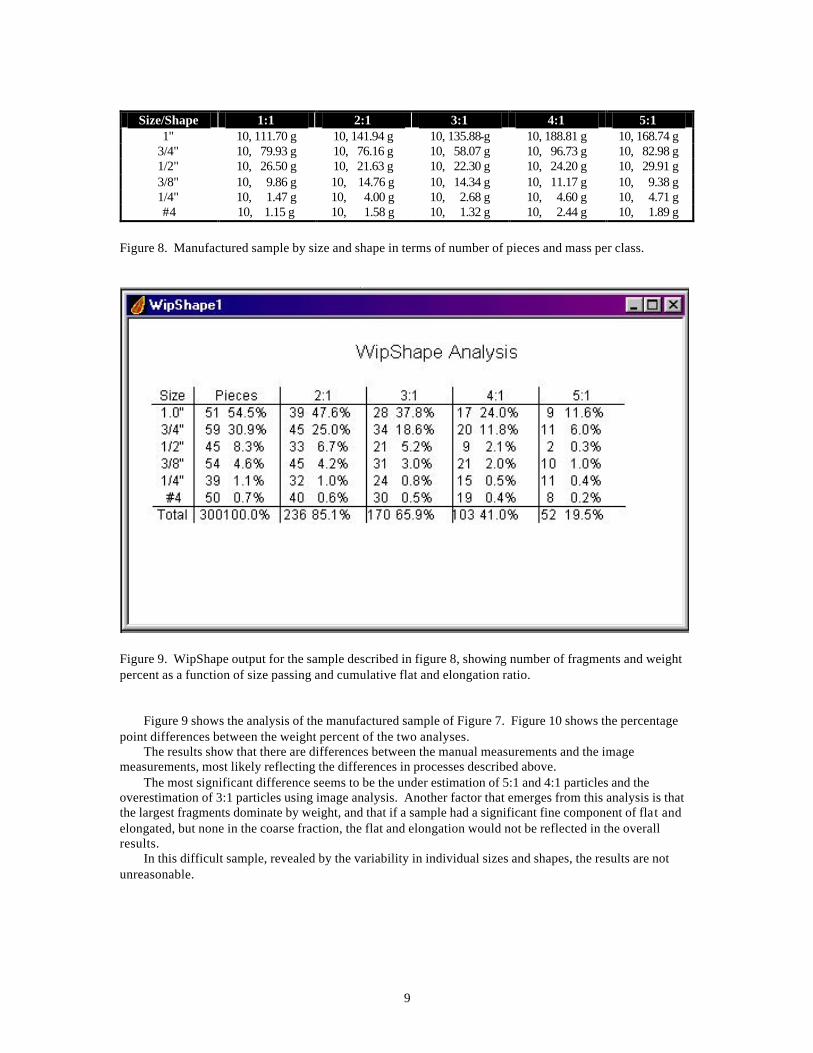
Figure 8. Manufactured sample by size and shape in terms of number of pieces and mass per class.
Figure 9. WipShape output for the sample described in figure 8, showing number of fragments and weight percent as a function of size passing and cumulative flat and elongation ratio.
Figure 9 shows the analysis of the manufactured sample of Figure 7. Figure 10 shows the percentage point differences between the weight percent of the two analyses. The results show that there are differences between the manual measurements and the image measurements, most likely reflecting the differences in processes described above. The most significant difference seems to be the under estimation of 5:1 and 4:1 particles and the overestimation of 3:1 particles using image analysis. Another factor that emerges from this analysis is that the largest fragments dominate by weight, and that if a sample had a significant fine component of flat and elongated, but none in the coarse fraction, the flat and elongation would not be reflected in the overall results. In this difficult sample, revealed by the variability in individual sizes and shapes, the results are not unreasonable.

10
Size/Shape 1:1 2:1 3:1 4:1 5:1
1 8.27 10.51 10.06 13.98 12.49 3/4 5.92 5.64 4.30 7.16 6.14 1/2 1.96 1.60 1.65 1.79 2.21 3/8 0.73 1.09 1.06 0.83 0.69 1/4 0.11 0.30 0.20 0.34 0.35 #4 0.09 0.12 0.10 0.18 0.14
total 17.07 19.25 17.37 24.28 22.03
Size/Shape 1:1 2:1 3:1 4:1 5:1 1 6.90 9.80 13.80 12.40 11.60
3/4 5.90 6.40 6.80 5.80 6.00 1/2 1.60 1.50 3.10 1.80 0.30 3/8 0.30 1.30 1.00 1.00 1.00 1/4 0.10 0.20 0.30 0.10 0.40 #4 0.10 0.10 0.10 0.20 0.20
total 14.90 19.30 25.10 21.30 19.50
Size/Shape 1:1 2:1 3:1 4:1 5:1 1 1.37 0.71 -3.74 1.58 0.89
3/4 0.02 -0.76 -2.50 1.36 0.14 1/2 0.36 0.10 -1.45 -0.01 1.91 3/8 0.43 -0.21 0.06 -0.17 -0.31 1/4 0.01 0.10 -0.10 0.24 -0.05 #4 -0.01 0.02 0.00 -0.02 -0.06
total 2.17 -0.05 -7.73 2.98 2.53
Figure 10. Summary of the measurement results. Top: Manual caliper results, percentage by weight. Middle: Image analysis results, percentage by weight. Bottom: Difference in percentage points.
U of Illinois study
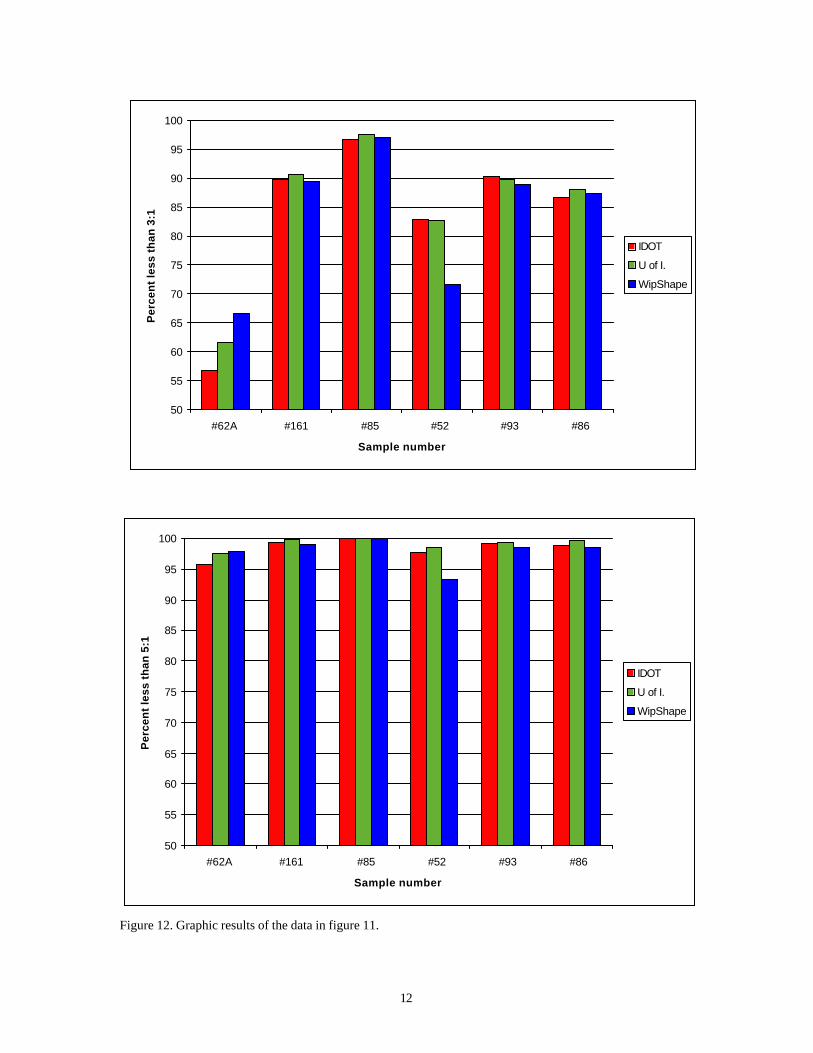
In a study recently completed by the University of Illinois, samples of rock composed of 9231 fragments with a total mass of 10,647.8 g, supplied by the Illinois Department of Transport (IDOT) were analyzed using the WipShape imaging system. Aggregate pieces were laid down on the belt manually at an average rate of about one fragment every 1.6 seconds. The samples had been previously measured for flat and elongation using the proportional caliper, both by University of Illinois personnel and by IDOT personnel. The results in Figures 11,12 show that the imaging system results are very close to the results from the manual measurements, especially at the 3:1 ratio. One sample, #52 showed greater error than the rest. This sample contained significant amounts of very dark rock that proved difficult to resolve on the image analysis system. Another sample, #62 showed progressively less flat and elongated in each subsequent test. This is perhaps an indication that breakage of the flat or elongated pieces is occurring, resulting in less flat and elongated.

11
Sample # # of particles Total weight
#62A 1036 1891.4 g #161 1020 2791.9 #85 739 2596.9 #52 2868 1218.7 #93 1804 1016.5 #86 1764 1132.4
Sample # IDOT
weight % U. of Ill.
weight % WipShape weight %
U. of Ill. count %
WipShape count %
#62A <3:1 56.7 61.5 66.5 54.5 66.1 <5:1 95.7 97.5 97.9 95.7 96.3 #161 <3:1 89.8 90.7 89.4 83.6 84.1 <5:1 99.4 99.8 99.0 99.5 95.9 #85 <3:1 96.7 97.6 97.1 95.5 94.5 <5:1 100.0 100.0 100.0 100.0 98.2 #52 <3:1 82.9 82.7 71.5 76.2 71.5 <5:1 97.7 98.6 93.4 97.5 91.3 #93 <3:1 90.3 89.8 89.0 83.5 86.4 <5:1 99.2 99.4 98.5 98.9 96.3 #86 <3:1 86.8 88.1 87.5 80.9 84.7 <5:1 98.9 99.6 98.6 99.3 98.0 Figure 11. Top: Size of IDOT samples. Bottom: Comparison of IDOT, University of Illinois, and WipShape flat and elongated measurements for <3:1, and <5:1 in terms of weight percentage and count percentage.
Reproducibility Study
A small reproducibility study was conducted. Three students were given an aggregate sample of 310 pieces, and asked to measure flat and elongation using the proportional calipers and using WipShape. In each case the sample was measured twice. The students were fully trained in the use of the proportional caliper. No training was required for WipFrag. The test results were interpreted in terms of repeatability and reproducibility. Repeatability, or single-operator precision, can be defined as, “…an estimate of the difference that may be expected between duplicate measurements made on the same material in the same laboratory by the same operator using the same apparatus within a time span of a few days”(12), and can be calculated by (13):
1296.1 σ=r [1]
where σ1 is the is the single operator standard deviation. Reproducibility, or between-laboratory precision, can be defined as,”…an estimate of the difference that may be expected between measurements made on the same material in two different laboratories”(11), and can be calculated as follows (12):
12
50
55
60
65
70
75
80
85
90
95
100
#62A #161 #85 #52 #93 #86
Sample number
Per
cen
t le
ss t
han
5:1
IDOT
U of I.
WipShape
Figure 12. Graphic results of the data in figure 11.
50
55
60
65
70
75
80
85
90
95
100
#62A #161 #85 #52 #93 #86
Sample number
Per
cen
t le
ss t
han
3:1
IDOT
U of I.
WipShape
13
Proportional Caliper Device WipShape Sieve Size (passing)
Operator Trial #1
(%) Trial #2
(%) Repeat.
(%) Trial #1
(%) Trial #2
(%) Repeat.
(%) 19.0 mm (3/4”)
ML 9.2 10.0 1.64 12.3 11.5 1.57
12.5 mm (1/2”) ML 8.9 9.3 0.74 4.7 5.9 2.35
19.0 mm (1/2”) YPH 6.1 5.4 1.39 9.1 8.9 0.39
12.5 mm (3/4”)
YPH 5.4 5.7 0.67 4.9 5.3 0.78
19.0 mm (1/2”) SJ 4.2 3.7 1.14 9.7 9.5 0.39
12.5 mm (3/4”) SJ 5.1 5.4 0.74 4.5 4.3 0.39
Proportional Caliper Device WipShape Sieve Size
(passing) Operator
Reprod. (%)
Reprod. (%)
19.0 mm (3/4”) ALL 8.18 4.64
12.5 mm (1/2”) ALL 6.01 1.30
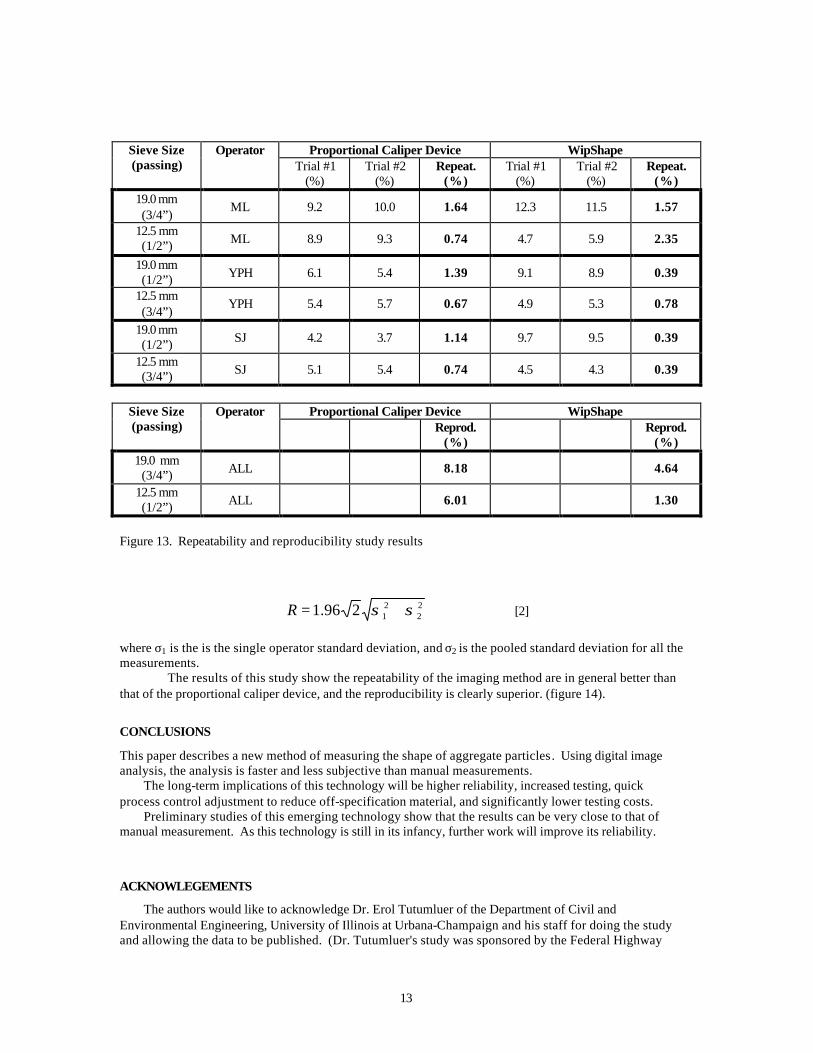
Figure 13. Repeatability and reproducibility study results
22
21296.1 σσ +=R [2]
where σ1 is the is the single operator standard deviation, and σ2 is the pooled standard deviation for all the measurements. The results of this study show the repeatability of the imaging method are in general better than that of the proportional caliper device, and the reproducibility is clearly superior. (figure 14).
CONCLUSIONS
This paper describes a new method of measuring the shape of aggregate particles. Using digital image analysis, the analysis is faster and less subjective than manual measurements. The long-term implications of this technology will be higher reliability, increased testing, quick process control adjustment to reduce off-specification material, and significantly lower testing costs. Preliminary studies of this emerging technology show that the results can be very close to that of manual measurement. As this technology is still in its infancy, further work will improve its reliability.
ACKNOWLEGEMENTS
The authors would like to acknowledge Dr. Erol Tutumluer of the Department of Civil and Environmental Engineering, University of Illinois at Urbana-Champaign and his staff for doing the study and allowing the data to be published. (Dr. Tutumluer's study was sponsored by the Federal Highway
14
Administration and by the Illinois Department of Transportation). The authors would also like to thank the Illinois DOT for providing the samples along with manual flat and elongated measurements. Thanks to Joseph Stefanski for his diligent work in placing the aggregates on the belt, one piece at a time, and Kristen Erbach for duplicate flat and elongated measurements. Thanks also to Mr. Steven Jackson and Mr. Yuh-Puu Han for their participation in the reproducibility study.
REFERENCES
(1) D’Angelo, J. A. Superpave and aggregate properties: Where did they come from and where are they going. In Center For Aggregates Research, 4 th Annual Symposium, April, 1996, pp. 1-10 (2) ASTM (American Society for Testing and Materials). Standard test method for flat particles, elongated particles, or flat and elongated particles in coarse aggregate, ASTM Designation 4791-89, 1995, 3 pp. (3) Franklin, J. A., Kemeny, J. M., and Girdner, K. K. Evolution of measuring systems: A review. In Proceedings of the FRAGBLAST 5 Workshop on Measurement of Blast Fragmentation, Montreal, Quebec, Canada. Franklin, J. A, and Katsabanis, T., (ed.). A. A. Balkema, 1996, pp. 47-52. (4) Maerz, N. H., Palangio, T. C., and Franklin, J. A. WipFrag image based granulometry system. In Proceedings of the FRAGBLAST 5 Workshop on Measurement of Blast Fragmentation, Montreal, Quebec, Canada. Franklin, J. A, and Katsabanis, T., (ed.). A. A. Balkema, 1996, pp. 91-99. (5) Maerz, N. H., and Zhou.. Optical digital fragmentation measuring systems - inherent sources of error. In FRAGBLAST, The International Journal for Blasting and Fragmentation, Vol. 2, No. 4, 1998, pp. 415-431. (6) Maerz, N. H. Aggregate sizing and shape determination using digital image processing. In Center For Aggregates Research, 4 th Annual Symposium, 1998, pp. 195-203. (7) Weingart, R. L., and Prowell, B. D. Flat and elongated aggregate tests: Can the VDG-40 videograder deliver the needed precision and be economically viable? In Center For Aggregates Research (ICAR) Sixth Annual Symposium Proceedings, 1996, pp. 219-232. (8) Frost, J. D., and Lai, J. S. Digital analysis of aggregate particle shape. In Center For Aggregates Research (ICAR) Fourth Annual Symposium Proceedings, 1996, 10 pp. (9) Kou, C.Y., Rollings, R. S., and Lynch, L. N. Morphological study of coarse aggregates using image analysis. In Journal of Materials in Civil Engineering, 1998. (10) Rao, C., and Tutumluer, E. A new image analysis approach for determination of volume of aggregates. In Transportation Research Board, 79th Annual Meeting, 2000. (11) Maerz, N. H., and Zhou, W. Flat and elongated: Advances using digital image analysis . In Center For Aggregates Research (ICAR) Seventh Annual Symposium Proceedings, 1999, pp. B1-4-1 to B1-4-12. (12) ASTM (American Society for Testing and Materials). Standard practice for conducting an interlaboratory test program to determine the precision of test methods for construction materials. ASTM C 802-96, 2000, 17 pp. (13) Mandel, J. Repeatability and Reproducibility. In: Materials Research and Standards, American Society of Testing and Materials, ASTM,1971, pp 8-15..