Paper and Paperboard Quarterly Special report€¦ · 9Globally, paper industry remained marginally...
26
Paper and Paperboard Quarterly Special report June 2014 June 2014 1
Transcript of Paper and Paperboard Quarterly Special report€¦ · 9Globally, paper industry remained marginally...

Paper and Paperboard Quarterly Special report
June 2014June 2014
1

Price Trends – Kraft Paper
Ruby Macons (22 BF 150 GSM) Siddeshwari (22 BF 150 GSM)
DateBasic rate Change Net change, Basic rate Change Net change,Date
(INR per kg)g
(M-o-M)g ,
since Jan’14 (INR per kg)g
(M-o-M)g ,
since Jan’14
Dec'13 31.70 -0.75 NA 30.00 -0.50 NA
Jan'14 31.70 0.00 0.00 30.00 0.00 0.00
Feb'14 31.70 0.00 0.00 30.50 0.50 0.50
Mar'14 31.70 0.00 0.00 30.50 0.00 0.50
Apr'14 33.20 1.50 1.50 32.50 2.00 2.50
May'14 33.20 0.00 1.50 32.50 0.00 2.50
Jun'14 33.20 0.00 1.50 32.50 0.00 2.50
Driven by the higher cost of production due to ongoing power crisis paper pricesDriven by the higher cost of production due to ongoing power crisis, paper pricesremained in firm tone.
Paper prices dependent on wood pulp have been supported by the due to steady risein its costs and lower supply
© TransGraph Consulting Pvt Ltd Slide 2
in its costs and lower supply
Weaker INR vs USD keeping raw material import prices higher.
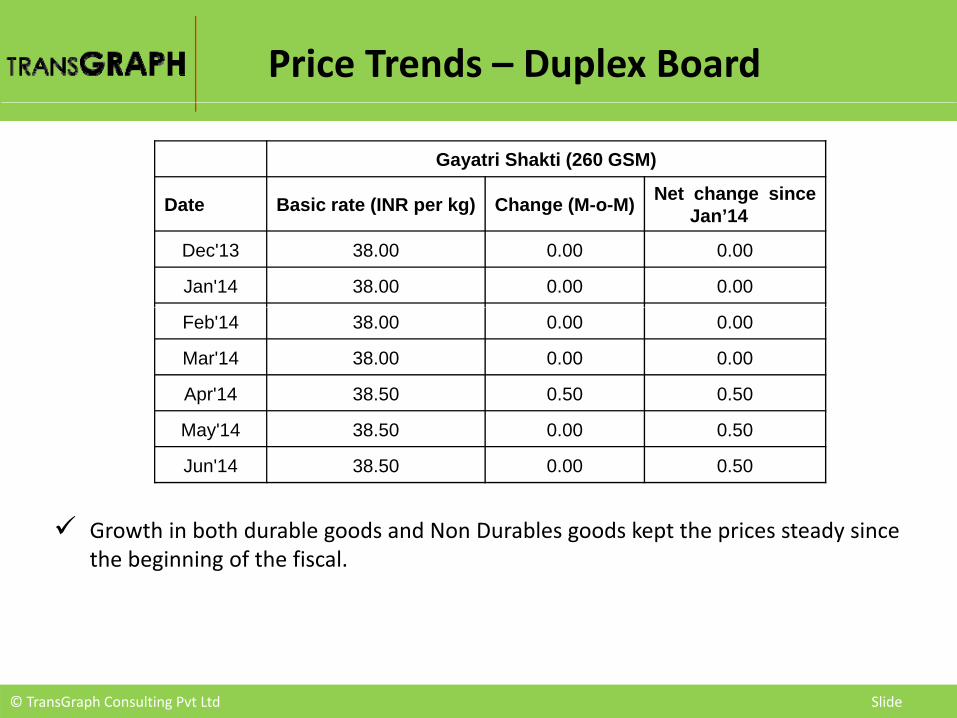
Price Trends – Duplex Board
Gayatri Shakti (260 GSM)
Date Basic rate (INR per kg) Change (M-o-M) Net change sinceDate Basic rate (INR per kg) Change (M-o-M) Jan’14
Dec'13 38.00 0.00 0.00
Jan'14 38.00 0.00 0.00
Feb'14 38.00 0.00 0.00
Mar'14 38.00 0.00 0.00
Apr'14 38.50 0.50 0.50
May'14 38.50 0.00 0.50
Jun'14 38.50 0.00 0.50
Growth in both durable goods and Non Durables goods kept the prices steady sincethe beginning of the fiscal.
© TransGraph Consulting Pvt Ltd Slide

Factors affecting pulp and paper prices in April – June 2014p
Globally, paper industry remained marginally weak due to weather condition stilldisturbed paper industry production and deliveries in North America. Shipments in andto the developing countries continued to grow due to muted demand in Europeto the developing countries continued to grow due to muted demand in Europe
Recycled paper global demand has seen a decline in recent past amidst slowdown inChinese economy. Prices for bulk grades of RCF paper have been pretty much flat inNorth America and Western Europe, the largest two recovered paper suppliers to ChinaNorth America and Western Europe, the largest two recovered paper suppliers to China
In softwood, prices remained high due to the shortages in the volumes of softwoodcompared to demand. However, hardwood prices remained lower due to higherinventories and demand concerns
At the Indian front, sharp rise in raw material prices due to supply shortage of sugarbagasse and wheat straw which climbed to year high level have made paper prices torise in major Mills in India
Free trade agreements with south‐east countries like Thailand, Malaysia and Indonesiahave been impacting the profitability of the Indian paper industry significantly. Duty‐freeimport of paper from these Southeast Asian countries, which are around Rs 3000 per tonh tti I di fi hi h h b bl t hik i
© TransGraph Consulting Pvt Ltd Slide 4
cheaper, putting pressure on Indian paper firms which have been unable to hike pricesthough they have been incurring losses due to high input costs

Economy updates
US
After recording 10 quarters of consecutive economic growth, contraction in Q1 wasaggravated by the harsh winter this year. Q2 numbers such as IP, employment and retailsales indicate close to 3% growth and the US economy remains on firm foot among thedeveloped economies at present.
St l t th f 200 th d th d l i t f QEStrong employment growth of over 200 thousand a month and low impact of QEtapering (indicated by increase in inflation to 2.1% against target of 2%) indicatingeconomy withstanding tightening monetary policy.
Although US Fed is likely to increase interest rates by next year – comments from FedAlthough, US Fed is likely to increase interest rates by next year – comments from FedChairwoman and US treasury yields signals a prolonged period of loose monetary policy.
EUEU
Mixed picture of growth
Recent business surveys and PMI numbers point to improvement in business conditionsh
© TransGraph Consulting Pvt Ltd Slide 5
across the region.
Nascent recovery remains uneven with growing threat of deflation.

Economy updates
China
China represents a large portion of global demand for several key energy, metals, andi lt l ditiagricultural commodities.
Credit crisis‐induced China slowdown would have a sizeable negative impact on demandfor commodities and the (mostly emerging market) economies that produce them.
India
High foreign funds inflow (USD 12.7 bn) in AMJ 2014 and election results helped in rupeeappreciation during AMJ 2014. FII’s poured in USD 12.7 billion with USD 5.3 billion in debtsegment and USD 7.4 billion in equities. This is comparable to USD 5.5 billion in debt andUSD 3.8 billion in equity during JFM 2014 indicating strong equity driven INRappreciationappreciation.
Fiscal spending remains key post budget for the new government and is likely to keeprupee appreciation limited from the current levels.
Rising Crude oil and gold prices pose a threat of renewal of CAD concerns in the short
© TransGraph Consulting Pvt Ltd Slide 6
Rising Crude oil and gold prices pose a threat of renewal of CAD concerns in the short‐term.

US Economic Indicators – at a glance
Quarterly Forecasts for Economic Indicators
Real GDP (%) Unemployment Payrolls Consumer Price Real GDP (%) Rate (%) (000s/month) Index (%)Previous (Mar‐14)
New (Jun‐14) Previous New Previous New Previous New
2014:Q2 3.0 3.2 6.6 6.4 193.5 232.0 1.7 1.9
2014:Q3 2.8 3.5 6.4 6.3 195.2 214.7 1.9 1.9
2014:Q4 2.7 2.7 6.3 6.2 215.0 197.9 2.0 2.0Q
Source: Federal Reserve Bank of Philadelphia and TG Estimates
The outlook for growth over the next three quarters looks stronger now than it did threemonths ago according to the Federal Reserve Bank of Philadelphiamonths ago according to the Federal Reserve Bank of Philadelphia.
Improved outlook for unemployment and inflation are likely to fuel volatility and mightalso alter the Forward Guidance by the Federal Reserve.
R i i i fl ti i ht l h i ht d l d t ti i ti f f t
© TransGraph Consulting Pvt Ltd Slide 7
Reviving inflationary concerns might also heighten and lead to anticipation of fasterincrease in interest rates by mid 2015.

US economy remains on firm foot of recoveryy
4.10%
3.20% 3.50%
US GDP growth (Q-o-Q annualized)After witnessing a first quarter lag, US GDP isexpected to grow by 3.2% in AMJ‐14 backed by
2.60%3.20%
2.70% reviving fixed asset investments and healing labormarket.
In 2014, US GDP is forecasted to grow by 2.4% in
-1.00%Sep-13 Dec-13 Mar-14 Jun-14 Sep-14 Dec-14
line with the Fed, IMF and the World Bank’sexpectations.
Improving personal income and spending backed
17.2
8.510
17
24Gross Private Domestic Investment (%
Change Q/Q)by gradual fall in business inventories should signaluptick in economic activity.
Private investments are expected to peak in theJAS 14 t b k d b F d2.5 4.6 3.9
-11
-4
3
10 JAS‐14 quarter backed by concerns over Fedraising interest rates.
Concisely, the US economy is likely to witnessstable economic growth but concerns of inflation
© TransGraph Consulting Pvt Ltd Slide 8
-11.7-18
Sep-13 Dec-13 Mar-14 Jun-14 Sep-14 Dec-14
stable economic growth but concerns of inflationand Fed increasing rates might dent confidence.

Euro‐zone – gradually overcoming headwinds
The recovery in the Euro zone is ongoing and it is
progressing at varying speeds and strength across1 1%
1.4%1 2%
EU GDP growth (% Change Y/Y)
the region.
Although private credit growth remained anemic,0.6%
0.9%1.1% 1.2%
recent rate cut by the ECB and targeted long term
refinancing operation is likely to broaden GDP
growth in H2 2014.
-0.3%Sep-13 Dec-13 Mar-14 Jun-14 Sep-14 Dec-14
0.8%
1.0% 1.0%EU CPI (% Change Y/Y)
Inflation is also likely to pick up gradually but is
expected to remain well below the ECB’s long term
f
0.2% 0.2%
target of 2%.
Consumption and investments will increase,
making the Euro zone recovery less dependent on
© TransGraph Consulting Pvt Ltd Slide 9
Dec-13 Mar-14 Jun-14 Sep-14 Dec-14
g y p
international markets.

China – a tough balancing act
7.8%7.7%
China GDP growth (% Change Y/Y) Shift of the economic growth engine from
export based to consumption based is likely7.7%
7.4%7.3%
7.6%
7.4%
export based to consumption based is likely
to weigh on Chinese GDP in 2014.
Economic slowdown continues to raise
Sep-13 Dec-13 Mar-14 Jun-14 Sep-14 Dec-14
doubt over the Government’s policies and
pro‐growth reforms might shrug‐off any
0.4%
0.1%0.3%
0.2%
China CPI (% Change Q/Q) severe weakness in H2 2014.
Since the slowdown has been brought about
-0.1%
by weakness overseas as well as a tightening
of credit market conditions by the Chinese
authorities going ahead we might continue
© TransGraph Consulting Pvt Ltd Slide 10
-0.6%
Sep-13 Dec-13 Mar-14 Jun-14 Sep-14 Dec-14
authorities, going ahead we might continue
to witness PBOC to remain market friendly.

Global Pulp and paper price trends
20
25
130
140Global recovered paper prices
100
110
1000
1050Global Pulp prices
5
10
15
110
120
70
80
90
850
900
950
0100Apr‐13 Jun‐13 Aug‐13 Oct‐13 Dec‐13 Feb‐14 Apr‐14 Jun‐14
OCC (Euro/ton) ONP (Euro/ton) ONP‐OCC (Euro/ton)Source: FOEX
60800Mar‐13 May‐13 Jul‐13 Sep‐13 Nov‐13 Jan‐14 Mar‐14 May‐14
EU NBSK (USD/ton) US NBSK (USD/ton)US‐EU diff (USD/Ton) Source: FOEX
32000
32500
33000
33500
120
125
130
135 Impact of global prices on Indian paper prices
31 000
33,000
35,000
37,000 Indian Paper Price Trends
30000
30500
31000
31500
32000
100
105
110
115
120
25,000
27,000
29,000
31,000
3 3 3 3 3 3 3 3 3 3 3 3 4 4 4 4 4 4
Source: CRISIL
© TransGraph Consulting Pvt Ltd Slide 11
30000100Apr‐13 Jun‐13 Aug‐13 Oct‐13 Dec‐13 Feb‐14 Apr‐14 Jun‐14OCC (Euro/ton) ONP (Euro/ton) Indian Kraft paper (22BF) (INR/ton)
Jan‐13
Feb‐13
Mar‐13
Apr‐13
May‐13
Jun‐13
Jul‐1
3
Aug‐13
Sep‐13
Oct‐13
Nov‐13
Dec‐13
Jan‐14
Feb‐14
Mar‐14
Apr‐14
May‐14
Jun‐14
14 BF (Kraft Paper) Duplex Board (200‐284 GSM)

Codex – input cost trend
140
150CoDex
110
120
130
80
90
100
0 0 0 0 1 1 1 1 2 2 2 2 3 3 3 3 4 4
Source: WICMA
CoDex is the cost index for the corrugated boxes include costs of paper, adhesives,
1‐Jan‐10
1‐Ap
r‐1
1‐Jul‐1
1‐Oct‐1
1‐Jan‐1
1‐Ap
r‐1
1‐Jul‐1
1‐Oct‐1
1‐Jan‐1
1‐Ap
r‐1
1‐Jul‐1
1‐Oct‐1
1‐Jan‐1
1‐Ap
r‐1
1‐Jul‐1
1‐Oct‐1
1‐Jan‐14
1‐Ap
r‐1
CoDex is the cost index for the corrugated boxes include costs of paper, adhesives,printing, stitching, energy, transport, labour, interest and establishment costs andoverheads
During the last quarter input cost fluctuations due to energy crisis has contributed to
© TransGraph Consulting Pvt Ltd Slide 12
increase in Codex to 144.73 from 142.10 in the earlier quarter
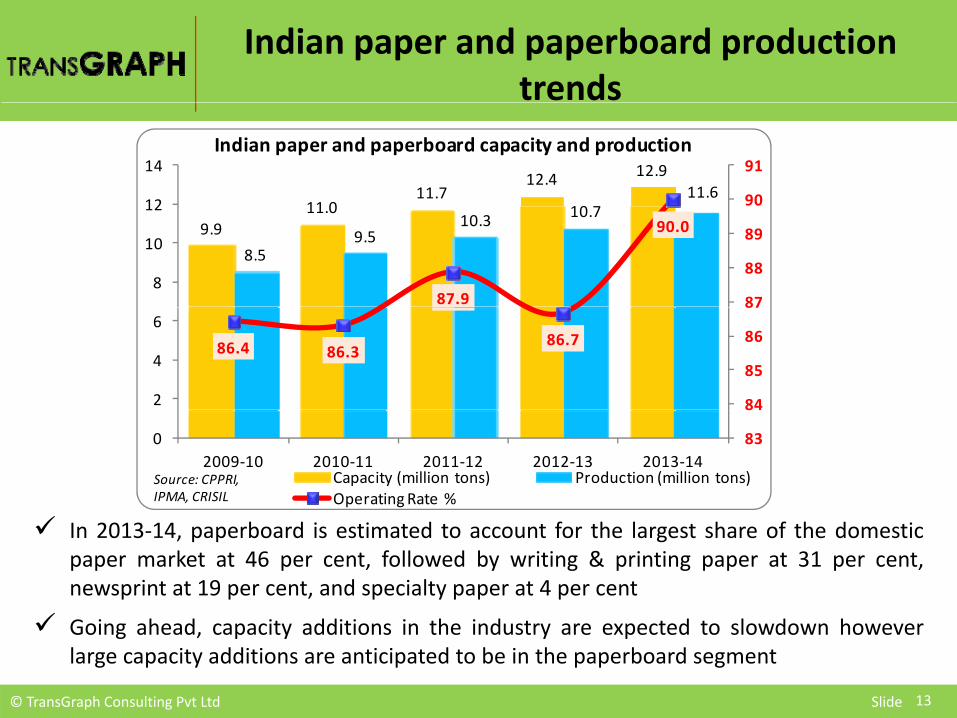
Indian paper and paperboard production trends
11 011.7
12.4 12.911.6 90
91
12
14Indian paper and paperboard capacity and production
9.911.0
8.59.5
10.3 10.7
87.9
90.0
87
88
89
90
8
10
12
86.4 86.386.7
84
85
86
87
2
4
6
83
8
02009‐10 2010‐11 2011‐12 2012‐13 2013‐14
Capacity (million tons) Production (million tons)Operating Rate %
Source: CPPRI, IPMA, CRISIL
In 2013‐14, paperboard is estimated to account for the largest share of the domesticpaper market at 46 per cent, followed by writing & printing paper at 31 per cent,newsprint at 19 per cent, and specialty paper at 4 per cent
© TransGraph Consulting Pvt Ltd Slide 13
Going ahead, capacity additions in the industry are expected to slowdown howeverlarge capacity additions are anticipated to be in the paperboard segment

Indian paper and paperboard production trends
290
300
310
housands
Month-wise Production of Kraft Paper in tons
3.1
ousand
s
Month-wise Production of Corrugated boxes in tons
240
250
260
270
280Th
2.5
2.7
2.9Tho
220
230
Jan‐12
Mar‐12
May‐12
Jul‐1
2
Sep‐12
Nov‐12
Jan‐13
Mar‐13
May‐13
Jul‐1
3
Sep‐13
Nov‐13
Jan‐14
Mar‐14
May‐14
2.1
2.3
Jan‐12
Mar‐12
May‐12
Jul‐1
2
Sep‐12
Nov‐12
Jan‐13
Mar‐13
May‐13
Jul‐1
3
Sep‐13
Nov‐13
Jan‐14
Mar‐14
May‐14
460
480
500
520
Thou
sand
s
Month-wise Production of Paper Board in tons
Since the beginning of the year, paper
production remained higher.
360
380
400
420
440
Going ahead, we expect the production
numbers are likely to decline with the on‐
© TransGraph Consulting Pvt Ltd Slide 14
340
Jan‐12
Mar‐12
May‐12
Jul‐1
2
Sep‐12
Nov‐12
Jan‐13
Mar‐13
May‐13
Jul‐1
3
Sep‐13
Nov‐13
Jan‐14
Mar‐14
May‐14 set of monsoon.

Indian waste paper imports
1.912.12
1.90
2.30 2.27
2.61
13359
1428913000
14000
15000
2.00
2.50
3.00 Indian waste paper imports
Indian waste paper imports
10187
9304
12520
1335912903
9000
10000
11000
12000
0.50
1.00
1.50
2.00
increased sharply in 2013‐14due to lower availability aswell as cheaper imports 9304
80000.002008‐09 2009‐10 2010‐11 2011‐12 2012‐13 2013‐14
Waste paper imports (million tons)
Average import price (INR per ton)Source: DGFT
compared to Indian wastepaper prices.
Going ahead, waste paperimports are expected toi f th th 1.91
2.121.90
2.30 2.272.6111% 21%
15%
5%
10%
15%
20%
25%
1 50
2.00
2.50
3.00Indian waste paper imports
increase further as themonsoon season is expectedto reduce the collectionti it
8%
‐10%
‐1%
‐15%
‐10%
‐5%
0%
5%
0.00
0.50
1.00
1.50
2008 09 2009 10 2010 11 2011 12 2012 13 2013 14
© TransGraph Consulting Pvt Ltd Slide 15
activity. 2008‐09 2009‐10 2010‐11 2011‐12 2012‐13 2013‐14
Waste paper imports (million tons)
Average import price % changeSource: DGFT

Inflation outlook amidst fears of El‐Nino
El‐Nino Years Drought % Decline in rainfall % fall in Kharif Production1972‐73 Yes 24% 6.9%
1982‐83 No ‐ ‐
1986‐87 Yes 13% 5.9%
1991‐92 No ‐ ‐
1994‐95 No ‐ ‐
1997‐98 No ‐ ‐
2002‐03 Yes 19% 19.1%
2004‐05 No ‐ ‐
2006‐07 No ‐ ‐
2009‐10 Yes 23% 12%
From the above study, we conclude that an intense El‐Nino has not always been accompanied by adrought of equal intensity.
h ( ) d h h lf f bl f d h
Source: IMD and Ministry of Agricultural
© TransGraph Consulting Pvt Ltd Slide
In the past 130 years (1880‐2010) it is witnessed that half of Ei‐Nino events are responsible for droughtconditions. Hence, incase the El‐Nino situation in 2014 leads to drought, we expect higher food pricesmight contribute to increasing inflation outlook and might limit the appreciation of the rupee.

El Nino
© TransGraph Consulting Pvt Ltd Slide 17
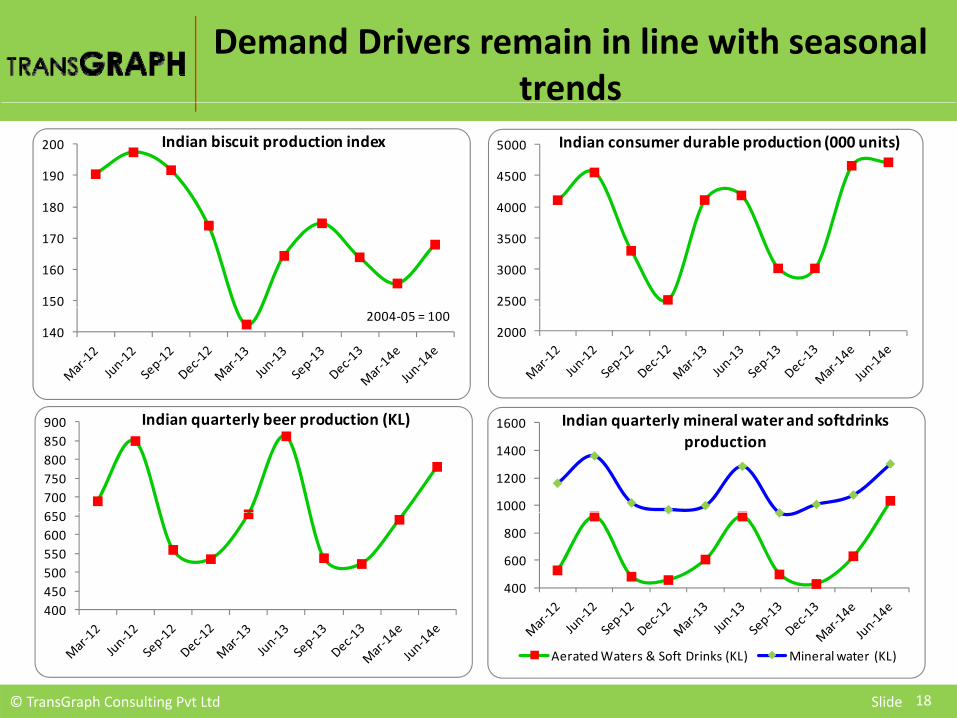
Demand Drivers remain in line with seasonal trends
180
190
200 Indian biscuit production index
4000
4500
5000 Indian consumer durable production (000 units)
150
160
170
180
2500
3000
3500
4000
1402004‐05 = 100
2000
650700750800850900 Indian quarterly beer production (KL)
1000
1200
1400
1600 Indian quarterly mineral water and softdrinks production
400450500550600650
400
600
800
© TransGraph Consulting Pvt Ltd Slide 18
Aerated Waters & Soft Drinks (KL) Mineral water (KL)

Indian paper demand growth vs. GDP and IP growthg
15
17
14
16IP Growth Vs. growth in Paper demand - India
9
10
14
16GDP Growth Vs. growth in Paper demand - India
7
9
11
13
6
8
10
12
5
6
7
8
6
8
10
12
-1
1
3
5
0
2
4
6
2005-06 2007-08 2009-10 2011-12 2013-14P
Consumption growth (%) IP growth (%)2
3
4
5
0
2
4
6
2003-04 2005-06 2007-08 2009-10 2011-12 2013-14P
Consumption growth (%)
GDP growth (%)
2005 06 2007 08 2009 10 2011 12 2013 14P2003 04 2005 06 2007 08 2009 10 2011 12 2013 14P
Paper consumption during past year witnessed a strong recoveryafter the slump in earlier years supported the positive growthafter the slump in earlier years supported the positive growthrate in GDPDespite the weakness in industrial sector, growth in consumer
l d hi h i i d d
© TransGraph Consulting Pvt Ltd Slide 19
sector led to higher consumption in paper demand

Indian Paper and paperboard supply and demand
Attribute 2010‐11 2011‐12 2012‐13 2013‐14
Number of mills 610 605 666 750
Capacity 10.95 11.70 12.40 12.85p y
Production 9.45 10.28 10.75 11.56
Imports 0.68 0.75 0.86 0.91
Exports 0.34 0.34 0.37 0.35
Apparent Consumption 9.79 10.69 11.24 12.12
S CPPRI IPMA CRISIL TG E ti t All it i illi t
© TransGraph Consulting Pvt Ltd Slide 20
Source: CPPRI, IPMA, CRISIL, TG Estimates, All units in million tons

Indian Kraft paper supply and demand
Attribute 2010‐11 2011‐12 2012‐13 2013‐14
Production 2605.00 2810.00 2935.75 3082.40
% Ch 6 98% 7 87% 4 48% 5 00%% Change 6.98% 7.87% 4.48% 5.00%
Imports 156.00 180.00 190.25 202.60
E t 0 00 0 00 0 00 0 00Exports 0.00 0.00 0.00 0.00
Apparent Consumption 2761.00 2990.00 3126.00 3285.00
% Ch 7 26% 8 29% 4 55% 5 09%% Change 7.26% 8.29% 4.55% 5.09%
Source: CPPRI, IPMA, CRISIL, TG Estimates, All units in thousand tons
© TransGraph Consulting Pvt Ltd Slide 21

Indian duplex board supply and demand
Attribute 2010‐11 2011‐12 2012‐13 2013‐14
Production 1819.00 1960.00 2105.00 2231.00
% Change 7.82% 7.75% 7.40% 5.99%
Imports 71.00 80.00 90.27 98.12
Exports 0.00 0.00 0.00 0.00
Apparent Consumption 1890.00 2040.00 2195.00 2330.00
% Change 8.00% 7.94% 7.60% 6.15%
Source: CPPRI, IPMA, CRISIL, TG Estimates, All units in thousand tons
© TransGraph Consulting Pvt Ltd Slide 22

Supply Demand Analysis
Region Demand Supply
Grim demand growth outlook due tod li i i d t i l ti it t Chi f t
Additional paperboard Capacities in Europed N th A i d t d li i fit bilit
Global
declining industrial activity at Chinese frontand slowdown in Euro zone economicgrowth
Revival in US industrial production after
and North America due to declining profitabilityin printing paper sector likely to keep globalsupply higher in the coming year
Muted demand along with economic growthwinter season expected to boost demand incoming months
expected to result in higher wood pulpinventories
Expectation of robust performance byIndian industrial sector to propel demand forduplex boards
Growing number of Export ‐ oriented
Obsolescence of technology and shortage ofraw material being a major hindrance at supplyside. Government ignoring industry demand forinterest subsidy under Technology Upgradation
( )India
g pindustries
Strong demographic factors likepopulation growth and increase in literacylevels
Fund (TUF) Scheme
Lack of government initiatives to providewaste land for plantation
Not much new capacity coming on stream for
© TransGraph Consulting Pvt Ltd Slide 23
levels Not much new capacity coming on‐stream forDuplex board – A long term issues yet to betackled

Price outlook summary
Region 2‐3 months More than 4 monthsKraft paper West India (Recycled paper based) +600 ‐250Kraft paper West India (Recycled paper based) +600 250Kraft paper North India (Bagasse based) +500 ‐450Duplex Board West India +300 ‐100Duplex board North India +300 ‐100pChromo paper West India +400 +100
Indian Kraft paper and Duplex board prices are expected toIndian Kraft paper and Duplex board prices are expected toremain supported by higher raw material prices in the near term.However, slowing global demand and delay in pick up of exportsd t d l d ld d d d ti tdue to delayed monsoon could dampen demand sentiments overthe medium term leading to price decline in the coming 3‐4months
© TransGraph Consulting Pvt Ltd Slide 24

Thanking you for your attention.
+91‐40‐33404040 [email protected] @t h www.transgraph.com
WWW
TransGraph Consulting Private Limited6‐3‐655 / 2 / 1 A P Civil Supplies Bhavan Lane Somajiguda
6‐3‐655 / 2 / 1, A.P. Civil Supplies Bhavan Lane, Somajiguda,Hyderabad ‐ 500 082, India.

LEGAL INFORMATION
This document is the whole property of Transgraph Consulting Private Limited, Hyderabad, India (hereafter “TransGraph”).
The following acts are strictly prohibited:Reproduction and/or forwarding for sale or any other usesReproduction and/or forwarding for sale or any other usesPosting on any communication mediumTransmittal via the Internet
Terms of usageUpon receipt of this document either directly or indirectly, it is understood that the user will and must fully comply with the other terms and conditions ofTransGraph By accepting this document the user agrees to be bound by the foregoing limitationsTransGraph. By accepting this document the user agrees to be bound by the foregoing limitations.
This publication is prepared by TransGraph and protected by copyright laws. Unless otherwise noted in the Service Agreement, the entire contents of thispublication are copyrighted by TransGraph, and may not be reproduced, stored in another retrieval system, posted on any communication medium, ortransmitted in any form or by any means without prior written consent of TransGraph. Unauthorized reproduction or distribution of this publication, or anyportion of it, may result in severe civil and criminal penalties, and will be prosecuted to the maximum extent necessary to protect the rights of TransGraph.
The information and opinions contained in this report have been obtained from sources TransGraph believed to be reliable, but no representation orwarranty, express or implied, is made that such information is accurate or complete and it should not be relied upon as such.
This report does not constitute a prospectus or other offering document or an offer or solicitation to buy or sell any assets (commodities, currencies, etc) orother investment. Information and opinions contained in the report are published for the assistance of recipients, but are not to be relied upon asauthoritative or taken in substitution for the exercise of judgment by any recipient; they are subject to change without any notice and not intended to providethe sole basis of any evaluation of the instruments discussed herein. Any views expressed reflect the current views of the analysts, which do not necessarilycorrespond to the opinions of TransGraph or its affiliates. Opinions expressed may differ from views set out in other documents, including research, publishedby TransGraph.
Any reference to past performance should not be taken as an indication of future performance. No member in the public related to TransGraph accepts anyliability whatsoever for any direct or consequential loss arising from any use of material contained in this report.
Analyst CertificationEach analyst responsible for the preparation of this report certifies that (i) all views expressed in this report accurately reflect the analyst's views about anyand all of the factors and assets (commodities, currencies, etc) named in this report, and (ii) no part of the analyst's compensation is directly or indirectly,related to the execution of the specific recommendations or views expressed herein.related to the execution of the specific recommendations or views expressed herein.
Copyright © TransGraph Consulting Private Limited, Hyderabad, India.
Prepared by Consulting Team – TransGraphRegistered Office: 6‐3‐655/2/1, AP Civil Supplies Bhavan Lane, Somajiguda, Hyderabad – 500082 INDIAPhone: +91‐40‐33404040| E‐mail: services@transgraph com | Internet: www transgraph com
26