PAPER 8: FINANCIAL MANAGEMENT AND ECONOMICS FOR...
24
PAPER – 8: FINANCIAL MANAGEMENT AND ECONOMICS FOR FINANCE SECTION A: FINANCIAL MANAGEMENT QUESTIONS Ratio Analysis 1. The following is the Profit and loss account and Balance sheet of KLM LLP. Trading and Profit & Loss Account Particulars Amount (` ) Particulars Amount (` ) To Opening stock 12,46,000 By Sales 1,96,56,000 To Purchases 1,56,20,000 By Closing stock 14,28,000 To Gross profit c/d 42,18,000 2,10,84,000 2,10,84,000 By Gross profit b/d 42,18,000 To Administrative expenses 18,40,000 By Interest on investment 24,600 To Selling & distribution expenses 7,56,000 By Dividend received 22,000 To Interest on loan 2,60,000 To Net profit 14,08,600 42,64,600 42,64,600 Balance Sheet as on………. Capital & Liabilities Amount (` ) Assets Amount (` ) Capital 20,00,000 Plant & machinery 24,00,000 Retained earnings 42,00,000 Building 42,00,000 General reserve 12,00,000 Furniture 12,00,000 Term loan from bank 26,00,000 Sundry receivables 13,50,000 Sundry Payables 7,20,000 Inventory 14,28,000 Other liabilities 2,80,000 Cash & Bank balance 4,22,000 1,10,00,000 1,10,00,000 You are required to COMPUTE: (i) Gross profit ratio (ii) Net profit ratio (iii) Operating cost ratio (iv) Operating profit ratio (v) Inventory turnover ratio (vi) Current ratio (vii) Quick ratio (viii) Interest coverage ratio (ix) Return on capital employed © The Institute of Chartered Accountants of India
Transcript of PAPER 8: FINANCIAL MANAGEMENT AND ECONOMICS FOR...

PAPER – 8: FINANCIAL MANAGEMENT AND ECONOMICS FOR FINANCE
SECTION A: FINANCIAL MANAGEMENT
QUESTIONS
Ratio Analysis
1. The following is the Profit and loss account and Balance sheet of KLM LLP.
Trading and Profit & Loss Account
Particulars Amount (` ) Particulars Amount (` )
To Opening stock 12,46,000 By Sales 1,96,56,000
To Purchases 1,56,20,000 By Closing stock 14,28,000
To Gross profit c/d 42,18,000
2,10,84,000 2,10,84,000
By Gross profit b/d 42,18,000
To Administrative expenses 18,40,000 By Interest on investment 24,600
To Selling & distribution expenses
7,56,000 By Dividend received 22,000
To Interest on loan 2,60,000
To Net profit 14,08,600
42,64,600 42,64,600
Balance Sheet as on……….
Capital & Liabilities Amount (` ) Assets Amount (` )
Capital 20,00,000 Plant & machinery 24,00,000
Retained earnings 42,00,000 Building 42,00,000
General reserve 12,00,000 Furniture 12,00,000
Term loan from bank 26,00,000 Sundry receivables 13,50,000
Sundry Payables 7,20,000 Inventory 14,28,000
Other liabilities 2,80,000 Cash & Bank balance 4,22,000
1,10,00,000 1,10,00,000
You are required to COMPUTE:
(i) Gross profit ratio (ii) Net profit ratio (iii) Operating cost ratio
(iv) Operating profit ratio (v) Inventory turnover ratio (vi) Current ratio
(vii) Quick ratio (viii) Interest coverage ratio (ix) Return on capital employed
© The Institute of Chartered Accountants of India

PAPER – 8: FINANCIAL MANAGEMENT AND ECONOMICS FOR FINANCE 91
(x) Debt to assets ratio.
Cost of Capital
2. KM Ltd. has the following capital structure on September 30, 2019:
Sources of capital (` )
Equity Share Capital (40,00,000 Shares of ` 10 each) 4,00,00,000
Reserves & Surplus 4,00,00,000
12% Preference Shares 2,00,00,000
9% Debentures 6,00,00,000
16,00,00,000
The market price of equity share is `60. It is expected that the company will pay next year
a dividend of `6 per share, which will grow at 10% forever. Assume 40% income tax rate.
You are required to COMPUTE weighted average cost of capital using market value
weights.
Capital Structure
3. The management of RT Ltd. wants to raise its funds from market to meet out the financial demands of its long-term projects. The company has various combinations of proposals to raise its funds. You are given the following proposals of the company:
Proposal Equity shares (%) Debts (%) Preference shares (%)
P 100 - -
Q 50 50 -
R 50 - 50
(i) Cost of debt and preference shares is 12% each.
(ii) Tax rate –40%
(iii) Equity shares of the face value of `10 each will be issued at a premium of `10 per share.
(iv) Total investment to be raised `8,00,00,000.
(v) Expected earnings before interest and tax `3,60,00,000.
From the above proposals the management wants to take advice from you for appropriate plan after computing the following:
• Earnings per share
• Financial break-even-point
COMPUTE the EBIT range among the plans for indifference.
© The Institute of Chartered Accountants of India

92 INTERMEDIATE (NEW) EXAMINATION: NOVEMBER, 2019
Leverage
4. The following summarises the percentage changes in operating income, percentage
changes in revenues, and betas for four listed firms.
Firm Change in revenue
Change in operating income Beta
A Ltd. 35% 22% 1.00
B Ltd. 24% 35% 1.65
C Ltd. 29% 26% 1.15
D Ltd. 32% 30% 1.20
Required:
(i) CALCULATE the degree of operating leverage for each of these firms. Comment
also.
(ii) Use the operating leverage to EXPLAIN why these firms have different beta.
Capital Budgeting
5. MTR Limited is considering buying a new machine which would have a useful economic life of
five years, at a cost of `25,00,000 and a scrap value of `3,00,000, with 80 per cent of the cost
being payable at the start of the project and 20 per cent at the end of the first year. The machine
would produce 75,000 units per annum of a new product with an estimated selling price of `300
per unit. Direct costs would be `285 per unit and annual fixed costs, including depreciation
calculated on a straight- line basis, would be ̀ 8,40,000 per annum.
In the first year and the second year, special sales promotion expenditure, not included in the
above costs, would be incurred, amounting to ̀ 1,00,000 and ̀ 1,50,000 respectively.
EVALUATE the project using the NPV method of investment appraisal, assuming the
company’s cost of capital to be 15 percent.
Risk Analysis in Capital Budgeting
6. SL Ltd. has invested `1,000 lakhs in a project. The risk-free rate of return is 5%. Risk premium expected by the Management is 10%. The life of the project is 5 years. Following
are the cash flows that are estimated over the life of the project.
Year Cash flows (` in lakhs)
1 125
2 300
3 375
4 400
5 325
© The Institute of Chartered Accountants of India

PAPER – 8: FINANCIAL MANAGEMENT AND ECONOMICS FOR FINANCE 93
CALCULATE Net Present Value of the project based on Risk free rate and also on the basis of Risks adjusted discount rate.
Dividend Decision
7. The following information pertains to SD Ltd.
Earnings of the Company ` 50,00,000
Dividend Payout ratio 60%
No. of shares outstanding 10,00,000
Equity capitalization rate 12%
Rate of return on investment 15%
(i) COMPUTE the market value per share as per Walter’s model?
(ii) COMPUTE the optimum dividend payout ratio according to Walter’s model and the
market value of Company’s share at that payout ratio?
Management of Working Capital
8. Following are cost information of KG Ltd., which has commenced a new project for an
annual production of 24,000 units which is the full capacity:
Costs per unit (` )
Materials 80.00
Direct labour and variable expenses 40.00
Fixed manufacturing expenses 12.00
Depreciation 20.00
Fixed administration expenses 8.00
160.00
The selling price per unit is expected to be `192 and the selling expenses `10 per unit,
80% of which is variable.
In the first two years of operations, production and sales are expected to be as follows:
Year Production (No. of units) Sales (No. of units)
1 12,000 10,000
2 18,000 17,000
To assess the working capital requirements, the following additional information is
available:
(a) Stock of materials 2 months’ average consumption
© The Institute of Chartered Accountants of India

94 INTERMEDIATE (NEW) EXAMINATION: NOVEMBER, 2019
(b) Work-in-process Nil
(c) Debtors 2 month’s average sales.
(d) Cash balance ` 1,00,000
(e) Creditors for supply of materials
1 month’s average purchase during the year.
(f) Creditors for expenses 1 month’s average of all expenses during the year.
PREPARE, for the two years:
(i) A projected statement of Profit/Loss (Ignoring taxation); and
(ii) A projected statement of working capital requirements
Management of Working Capital
9. A regular customer of your company has approached to you for extension of credit facility
for purchasing of goods. On analysis of past performance and on the basis of information
supplied, the following pattern of payment schedule emerges:
Pattern of Payment Schedule
At the end of 30 days 20% of the bill
At the end of 60 days 30% of the bill.
At the end of 90 days 30% of the bill.
At the end of 100 days 18% of the bill.
Non-recovery 2% of the bill.
The customer wants to enter into a firm commitment for purchase of goods of `30 lakhs in
2019, deliveries to be made in equal quantities on the first day of each quarter in the
calendar year. The price per unit of commodity is `300 on which a profit of `10 per unit is
expected to be made. It is anticipated that taking up of this contract would mean an extra
recurring expenditure of `10,000 per annum. If the opportunity cost is 18% per annum,
would you as the finance manager of the company RECOMMEND the grant of credit to the
customer? Assume 1 year = 360 days.
Miscellaneous
10. Write short notes on the following:
(a) STATE the meaning of Payback Reciprocal.
(b) STATE the functions of treasury department.
(c) DESCRIBE the Inter relationship between investment, financing and dividend
decisions.
© The Institute of Chartered Accountants of India

PAPER – 8: FINANCIAL MANAGEMENT AND ECONOMICS FOR FINANCE 95
SUGGESTED HINTS/ANSWERS
1. (i) Gross profit ratio = Grossprofit
100Sales
= 42,18,000
1001,96,56,000
`
` = 21.46%
(ii) Net profit ratio = Net profit
100Sales
= 14,08,600
1001,96,56,000
`
`= 7.17%
(iii) Operating ratio = Operatingcos t
100Sales
Operating cost = Cost of goods sold + Operating expenses
Cost of goods sold = Sales – Gross profit
= 1,96,56,000 - 42,18,000 = 1,54,38,000
Operating expenses = Administrative expenses + Selling & distribution expenses
= 18,40,000 + 7,56,000 = 25,96,000
Therefore, Operating ratio = 1,54,38,000 25,96,000
1001,96,56,000
= 1,80,34,000
1001,96,56,000
= 91.75%
(iv) Operating profit ratio = 100 – Operating cost ratio
= 100 – 91.75% = 8.25%
(v) Inventory turnover ratio = Cost of goodssold
Averagestock
= (14,28,000 1
1,54,38,000
2,46,000) / 2
= 1,54,38,000
13,37,000= 11.55 times
(vi) Current ratio = Current assets
Current liablities
Current assets = Sundry receivables + Inventory + Cash & Bank balance
= 13,50,000 + 14,28,000 + 4,22,000 = 32,00,000
Current liabilities = Sundry Payables + Other liabilities
© The Institute of Chartered Accountants of India

96 INTERMEDIATE (NEW) EXAMINATION: NOVEMBER, 2019
= 7,20,000 + 2,80,000 = 10,00,000
Current ratio = 32,00,000
10,00,000= 3.2 times
(vii) Quick Ratio = Current assets Inventories
Current liablities
= 32,00,000 14,28,000
10,00,000
=1.77 times
(viii) Interest coverage ratio = EBIDT
Interest=
Net profit Interest
Interest
= 2,60,0014,08,600
2,6
0
0,000
= 6.42 times
(ix) Return on capital employed (ROCE) = EBIT100
Capitalemployed
Capital employed = Capital + Retained earnings + General reserve + Term loan
= 20,00,000 + 42,00,000 + 12,00,000 + 26,00,000
= 1,00,00,000
Therefore, ROCE = 16,68,600
1001,00,00,000
= 16.69%
(x) Debt to assets ratio = Debts100
Totalassets =
26,00,000100
1,10,00,000 =23.64%
2. Workings:
(i) Cost of Equity (Ke) = =6
60
`
` + 0.10 = 0.20 = 20%
(ii) Cost of Debentures (Kd) = I (1 - t) = 0.09 (1 - 0.4) = 0.054 or 5.4%
Computation of Weighted Average Cost of Capital (WACC using market value
weights)
Source of capital Market Value of capital (` )
Weight Cost of capital (%)
WACC (%)
9% Debentures 6,00,00,000 0.1875 5.40 1.01
12% Preference Shares 2,00,00,000 0.0625 12.00 0.75
Equity Share Capital
(`60 × 40,00,000 shares)
24,00,00,000 0.7500 20.00 15.00
1
0
Dg
P
© The Institute of Chartered Accountants of India

PAPER – 8: FINANCIAL MANAGEMENT AND ECONOMICS FOR FINANCE 97
Total 32,00,00,000 1.00 16.76
3. (i) Computation of Earnings per Share (EPS)
Plans P (` ) Q (` ) R (` )
Earnings before interest & tax (EBIT) 3,60,00,000 3,60,00,000 3,60,00,000
Less: Interest charges -- (48,00,000) --
Earnings before tax (EBT) 3,60,00,000 3,12,00,000 3,60,00,000
Less : Tax @ 40% (1,44,00,000) (1,24,80,000) (1,44,00,000)
Earnings after tax (EAT) 2,16,00,000 1,87,20,000 2,16,00,000
Less : Preference share dividend -- -- (48,00,000)
Earnings available for equity
shareholders 2,16,00,000 1,87,20,000 1,68,00,000
No. of equity shares 40,00,000 20,00,000 20,00,000
E.P.S 5.40 9.36 8.40
(ii) Computation of Financial Break-even Points
Proposal ‘P’ = 0
Proposal ‘Q’ = `48,00,000 (Interest charges)
Proposal ‘R’ = Earnings required for payment of preference share dividend
i.e. `48,00,000 0.6 = `80,00,000
(iii) Computation of Indifference Point between the Proposals
Combination of Proposals
(a) Indifference point where EBIT of proposal “P” and proposal ‘Q’ is equal
EBIT(1- 0.4)
40,00,000shares = (EBIT - 48,00,000)(1- 0.4)
20,00,000shares
`
0.6 EBIT = 1.2 EBIT – `57,60,000
EBIT = `96,00,000
(b) Indifference point where EBIT of proposal ‘P’ and proposal ‘R’ is equal:
EBIT(1- 0.40) EBIT(1- 0.40) 48,00,000=
40,00,000shares 20,00,000shares
`
0.6EBIT
40,00,000shares= 0.6EBIT - 48,00,000
20,00,000shares
`
0.30 EBIT = 0.6 EBIT – `48,00,000
© The Institute of Chartered Accountants of India

98 INTERMEDIATE (NEW) EXAMINATION: NOVEMBER, 2019
EBIT = 48,00,000
0.30
`=`1,60,00,000
(c) Indifference point where EBIT of proposal ‘Q’ and proposal ‘R’ are equal
(EBIT - 48,00,000)(1- 0.4)
20,00,000shares
` = EBIT(1- 0.4) - 48,00,000
20,00,000shares
`
There is no indifference point between proposal ‘Q’ and proposal ‘R’
4. (i) Degree of operating leverage = % Change in Operating income
% Change in Revenues
A Ltd. = 0.22 / 0.35 = 0.63
B Ltd. = 0.35 / 0.24 = 1.46
C Ltd. = 0.26 / 0.29 = 0.90
D Ltd. = 0.30 / 0.32 = 0.94
It is level specific.
(ii) High operating leverage leads to high beta. So when operating leverage is lowest i.e.
0.63, Beta is minimum (1) and when operating leverage is maximum i.e. 1.46, beta is
highest i.e. 1.65
5. Calculation of Net Cash flows
Contribution = (300 – 285) 75,000 = `11,25,000
Fixed costs = 8,40,000 – [(25,00,000 – 3,00,000)/5] = `4,00,000
Year Capital (` ) Contribution
(` )
Fixed costs
(` )
Adverts
(` )
Net cash
flow (` )
0 (20,00,000) (20,00,000)
1 (5,00,000) 11,25,000 (4,00,000) (1,00,000) 1,25,000
2 11,25,000 (4,00,000) (1,50,000) 5,75,000
3 11,25,000 (4,00,000) 7,25,000
4 11,25,000 (4,00,000) 7,25,000
5 3,00,000 11,25,000 (4,00,000) 10,25,000
Calculation of Net Present Value
Year Net cash flow (` ) 12% discount factor Present value (` )
© The Institute of Chartered Accountants of India

PAPER – 8: FINANCIAL MANAGEMENT AND ECONOMICS FOR FINANCE 99
0 (20,00,000) 1.000 (20,00,000)
1 1,25,000 0.892 1,11,500
2 5,75,000 0.797 4,58,275
3 7,25,000 0.711 5,15,475
4 7,25,000 0.635 4,60,375
5 10,25,000 0.567 5,81,175
1,26,800
The net present value of the project is `1,26,800.
6. The Present Value of the Cash Flows for all the years by discounting the cash flow at 5% is
calculated as below:
Year Cash flows
` in lakhs
Discounting Factor @5%
Present value of Cash Flows ` In Lakhs
1 125 0.952 119.00
2 300 0.907 272.10
3 375 0.863 323.62
4 400 0.822 328.80
5 325 0.783 254.47
Total of present value of Cash flow 1,297.99
Less: Initial investment 1,000.00
Net Present Value (NPV) 297.99
Now when the risk-free rate is 5% and the risk premium expected by the Management is 10%. So the risk adjusted discount rate is 5% + 10% =15%.
Discounting the above cash flows using the Risk Adjusted Discount Rate would be as below:
Year Cash flows
` in Lakhs
Discounting
Factor@15%
Present Value of Cash
Flows
` in lakhs
1 125 0.869 108.62
2 300 0.756 226.80
3 375 0.657 246.37
4 400 0.571 228.40
5 325 0.497 161.52
© The Institute of Chartered Accountants of India

100 INTERMEDIATE (NEW) EXAMINATION: NOVEMBER, 2019
Total of present value of Cash flow 971.71
Initial investment 1,000.00
Net present value (NPV) (28.29)
7. (i) Walter’s model is given by
e
e
rD + (E - D)
KP = K
Where
P = Market price per share.
E = Earnings per share = ` 5
D = Dividend per share = ` 3
R = Return earned on investment = 15%
Ke = Cost of equity capital = 12%
0.153 + (5 - 3)
0.12P = 0.12
= ` 45.83
(ii) According to Walter’s model when the return on investment is more than the cost of equity capital, the price per share increases as the dividend pay-out ratio decreases.
Hence, the optimum dividend pay-out ratio in this case is nil.
So, at a pay-out ratio of zero, the market value of the company’s share will be:
0.150 + (5 - 0)
0.12P = 0.12
= `52.08
8. (i) Projected Statement of Profit / Loss
(Ignoring Taxation)
Year 1 Year 2
Production (Units) 12,000 18,000
Sales (Units) 10,000 17,000
(` ) (` )
Sales revenue (A)
(Sales unit × `192)
19,20,000 32,64,000
© The Institute of Chartered Accountants of India

PAPER – 8: FINANCIAL MANAGEMENT AND ECONOMICS FOR FINANCE 101
Cost of production:
Materials cost
(Units produced × `80)
9,60,000 14,40,000
Direct labour and variable expenses
(Units produced × `40)
4,80,000 7,20,000
Fixed manufacturing expenses
(Production Capacity: 24,000 units × `12)
2,88,000 2,88,000
Depreciation
(Production Capacity : 24,000 units × `20)
4,80,000 4,80,000
Fixed administration expenses
(Production Capacity : 24,000 units × `8)
1,92,000 1,92,000
Total Costs of Production 24,00,000 31,20,000
Add: Opening stock of finished goods
(Year 1 : Nil; Year 2 : 2,000 units)
--- 4,00,000
Cost of Goods available for sale
(Year 1: 12,000 units; Year 2: 20,000 units)
24,00,000 35,20,000
Less: Closing stock of finished goods at average
cost (year 1: 2000 units, year 2 : 3000 units)
(Cost of Production × Closing stock/ units produced)
(4,00,000) (5,28,000)
Cost of Goods Sold 20,00,000 29,92,000
Add: Selling expenses – Variable (Sales unit ×
`8) 80,000 1,36,000
Add: Selling expenses -Fixed (24,000 units × `2) 48,000 48,000
Cost of Sales : (B) 21,28,000 31,76,000
Profit (+) / Loss (-): (A - B) (-) 2,08,000 (+) 88,000
Working Notes:
1. Calculation of creditors for supply of materials:
Year 1 (` )
Year 2 (` )
Materials consumed during the year 9,60,000 14,40,000
Add: Closing stock (2 month’s average consumption) 1,60,000 2,40,000
11,20,000 16,80,000
Less: Opening Stock --- 1,60,000
© The Institute of Chartered Accountants of India

102 INTERMEDIATE (NEW) EXAMINATION: NOVEMBER, 2019
Purchases during the year 11,20,000 15,20,000
Average purchases per month (Creditors) 93,333 1,26,667
2. Creditors for expenses:
Year 1 (` ) Year 2 (` )
Direct labour and variable expenses 4,80,000 7,20,000
Fixed manufacturing expenses 2,88,000 2,88,000
Fixed administration expenses 1,92,000 1,92,000
Selling expenses (variable + fixed) 1,28,000 1,84,000
Total 10,88,000 13,84,000
Average per month 90,667 1,15,333
(ii) Projected Statement of Working Capital requirements
Year 1 (` ) Year 2 (` )
Current Assets:
Inventories:
- Stock of materials
(2 month’s average consumption)
1,60,000 2,40,000
- Finished goods 4,00,000 5,28,000
Debtors (2 month’s average sales) (including profit) 3,20,000 5,44,000
Cash 1,00,000 1,00,000
Total Current Assets/ Gross working capital (A) 9,80,000 14,12,000
Current Liabilities:
Creditors for supply of materials
(Refer to working note 1)
93,333 1,26,667
Creditors for expenses
(Refer to working note 2)
90,667 1,15,333
Total Current Liabilities: (B) 1,84,000
2,42,000
Estimated Working Capital Requirements: (A-B) 7,96,000 11,70,000
9. Statement showing the Evaluation of credit Policies
Particulars Proposed Policy ̀
© The Institute of Chartered Accountants of India

PAPER – 8: FINANCIAL MANAGEMENT AND ECONOMICS FOR FINANCE 103
A. Expected Profit:
(a) Credit Sales 30,00,000
(b) Total Cost
(i) Variable Costs 29,00,000
(ii) Recurring Costs 10,000
29,10,000
(c) Bad Debts 60,000
(d) Expected Profit [(a) – (b) – (c)] 30,000
B. Opportunity Cost of Investments in Receivables 1,00,395
C. Net Benefits (A – B) (70,395)
Recommendation: The Proposed Policy should not be adopted since the net benefits under
this policy are negative
Working Note: Calculation of Opportunity Cost of Average Investments
Opportunity Cost = Total Cost × Collection period Rate of Return
360 100
Particulars 20% 30% 30% 18% Total
A. Total Cost 5,82,000 8,73,000 8,73,000 5,23,800 28,51,800
B. Collection period 30/360 60/360 90/360 100/360
C. Required Rate of Return 18% 18% 18% 18%
D. Opportunity Cost
(A × B × C) 8,730 26,190 39,285 26,190 1,00,395
10. (a) As the name indicates it is the reciprocal of payback period. A major drawback of the
payback period method of capital budgeting is that it does not indicate any cut off
period for the purpose of investment decision. It is, however, argued that the
reciprocal of the payback would be a close approximation of the Internal Rate of
Return (later discussed in detail) if the life of the project is at least twice the payback
period and the project generates equal amount of the annual cash inflows. In
practice, the payback reciprocal is a helpful tool for quick estimation of rate of return
of a project provided its life is at least twice the payback period.
The payback reciprocal can be calculated as follows:
© The Institute of Chartered Accountants of India

104 INTERMEDIATE (NEW) EXAMINATION: NOVEMBER, 2019
Payback Reciprocal = Average annual cash in flow
Initial investment
(b) 1. Cash Management: It involves efficient cash collection process and managing
payment of cash both inside the organisation and to third parties.
There may be complete centralization within a group treasury or the treasury may simply advise subsidiaries and divisions on policy matter viz., collection/payment periods, discounts, etc.
T reasury will also manage surplus funds in an investment portfolio. Investment policy will consider future needs for liquid funds and acceptable levels of risk as determined by company policy.
2. Currency Management: The treasury department manages the foreign currency risk exposure of the company. In a large multinational company (MNC) the first step will usually be to set off intra-group indebtedness. The use of matching receipts and payments in the same currency will save transaction costs. T reasury might advise on the currency to be used when invoicing overseas sales.
The treasury will manage any net exchange exposures in accordance with company policy. If risks are to be minimized then forward contracts can be used either to buy or sell currency forward.
3. Fund Management: Treasury department is responsible for planning and sourcing the company’s short, medium and long-term cash needs. T reasury department will also participate in the decision on capital structure and forecast future interest and foreign currency rates.
4. Banking: It is important that a company maintains a good relationship with its bankers. T reasury department carry out negotiations with bankers and act as the initial point of contact with them. Short-term finance can come in the form of bank loans or through the sale of commercial paper in the money market.
5. Corporate Finance: T reasury department is involved with both acquisition and divestment activities within the group. In addition, it will often have responsibili ty for investor relations. The latter activity has assumed increased importance in markets where share-price performance is regarded as crucial and may affect the company’s ability to undertake acquisition activity or, if the price falls drastically, render it vulnerable to a hostile bid.
(c) Inter-relationship between Investment, Financing and Dividend Decisions: The finance functions are divided into three major decisions, viz., investment, financing
and dividend decisions. It is correct to say that these decisions are inter-related because the underlying objective of these three decisions is the same, i.e. maximisation of shareholders’ wealth. Since investment, financing and dividend
decisions are all interrelated, one has to consider the joint impact of these decisions on the market price of the company’s shares and these decisions should also be solved jointly. The decision to invest in a new project needs the finance for the
© The Institute of Chartered Accountants of India

PAPER – 8: FINANCIAL MANAGEMENT AND ECONOMICS FOR FINANCE 105
investment. The financing decision, in turn, is influenced by and influences dividend decision because retained earnings used in internal financing deprive shareholders
of their dividends. An efficient financial management can ensure optimal joint decisions. This is possible by evaluating each decision in relation to its effect on the
shareholders’ wealth.
The above three decisions are briefly examined below in the light of their inter-
relationship and to see how they can help in maximising the shareholders’ wealth i.e.
market price of the company’s shares.
Investment decision: The investment of long term funds is made after a careful assessment of the various projects through capital budgeting and uncertainty
analysis. However, only that investment proposal is to be accepted which is expected to yield at least so much return as is adequate to meet its cost of financing. This have
an influence on the profitability of the company and ultimately on its wealth.
Financing decision: Funds can be raised from various sources. Each source of
funds involves different issues. The finance manager has to maintain a proper balance between long-term and short-term funds. With the total volume of long-term funds, he has to ensure a proper mix of loan funds and owner’s funds. The optimum
financing mix will increase return to equity shareholders and thus maximise their
wealth.
Dividend decision: The finance manager is also concerned with the decision to pay or declare dividend. He assists the top management in deciding as to what portion of
the profit should be paid to the shareholders by way of dividends and what portion should be retained in the business. An optimal dividend pay-out ratio maximises
shareholders’ wealth.
The above discussion makes it clear that investment, financing and dividend
decisions are interrelated and are to be taken jointly keeping in view their joint effect
on the shareholders’ wealth
© The Institute of Chartered Accountants of India

106 INTERMEDIATE (NEW) EXAMINATION: NOVEMBER, 2019
PAPER – 8: FINANCIAL MANAGEMENT AND ECONOMICS FOR FINANCE
SECTION: B: ECONOMICS FOR FINANCE
QUESTIONS
1. (a) Explain few important points which one needs to bear in mind while calculating
National Income.
(b) Calculate Net Domestic Product at Factor Cost from the following data:
Particulars In Crore
Wages 7142
Mixed income 450
Rent 541
Salaries 8912
Interest 1013
Profit 714
(c) Calculate Personal Income from the following data:
Particulars In Crore
Undistributed profits of corporation 50
Net domestic product accruing to private sector 700
Corporation tax 65
Net factor income from abroad 10
Net current transfer from rest of the world 20
Net current transfer from the government 25
Interest on national debt 40
2. (a) Explain the concept of circular flow in two sector economy model?
(b) i. Find out the MPC, when in an economy total income increases by ` 7500 crore due to increase in investment by ` 2500 crore?
ii Assume that the consumption function in an economy is specified by the
equation C = 200 + 0.9Y
With the help of an example show that in this economy as income increases MPC
remains constant.
3. How can the government influence the resource allocation in an economy?
4. When price of certain essential goods rises excessively, how does the government intervene to control the price? Explain with the help of an example and with suitable
diagram.
© The Institute of Chartered Accountants of India

PAPER – 8: FINANCIAL MANAGEMENT AND ECONOMICS FOR FINANCE 107
5. (a) Is cable television an example of impure public good? Verify your answer.
(b) Is production of steel a demerit good? Give reason.
6. (a) Explain the classical version of quantity theory of demand for money.
(b) Why empirical analysis of money supply is important?
7. (a) Calculate the narrow money from the following information.
Components in Million (`)
Currency with the public 15473.2
Demand deposits of banks 6943.1
Saving deposits with post office saving banks 978.1
Other deposits of the RBI 501.2
(b) What is high powered money? Calculate it from the following data:
Components in Million (`)
Net RBI Credit to the Government 41561.2
RBI credit to the Commercial sector 18459.3
RBI’s net non-monetary liabilities 24981.2
RBI’s claims on banks 31456.2
RBI’s Net foreign assets 10456.1
Government’s currency liabilities to the pub lic 21417.1
8. (a) The table below shows the output of Wheat and Rice by using one hour of labour time
in country A and country B -
Goods Country A Country B
Wheat (Quintal /hour) 10 5
Rice (Quintal/hour) 5 10
Which country has an absolute advantage over other country in production of wheat
and rice and which good they obtain through international trade?
(b) Define custom duties? What are their main goals?
9. (a) Is prohibition of import of poultry from countries affected by avian flu, m eat and poultry processing standards to reduce pathogens, residue limits for pesticides in foods etc.
an example of Sanitary and Phytosanitary (SPS) measure? How?
(b) Food Laws, Quality Standards and Industrial Standards are examples of which type
of non-tariff measures? Give Comments.
10. (a) Distinguish between horizontal and vertical Foreign Direct Investment.
© The Institute of Chartered Accountants of India

108 INTERMEDIATE (NEW) EXAMINATION: NOVEMBER, 2019
(b) Assume that ` 70 is needed to buy one US dollar in foreign exchange market (i.e. the nominal exchange rate is ` 70/ US $). Suppose that a price index of standardized
basket of goods and services is ` 200 in India and US $ 100 in United States, find out the real exchange rate? (Treat India as a domestic country and United States as
a foreign country)
SUGGESTIONS ANSWERS/ HINTS
1. (a) Few important points which one needs to bear in mind while calculating National
Income are -
(i) The value of only final goods and services or only the value added by the
production process would be included in GDP. By ‘value added’ we mean the
difference between value of output and purchase of intermediate goods.
(ii) Intermediate consumption consists of the value of the goods and services consumed as inputs by a process of production, excluding fixed assets whose
consumption is recorded as consumption of fixed capital. Intermediate goods used to produce other goods rather than being sold to final purchasers are not
counted as it would involve double counting.
(iii) Gross Domestic Product (GDP) is a measure of production activity which covers
all production activities recognized by SNA called the ‘production boundary’.
(iv) Economic activities include all human activities which create goods and services that are exchanged in a market and valued at market price. On the other hand, Non-economic activities are those which produce goods and services, but since
these are not exchanged in a market transaction they do not command any market value; for e.g. hobbies, housekeeping and child rearing services of home
makers and services of family members that are done out of love and affection.
(v) National income is a ‘flow’ measure of output per time period—for example, per
year—and includes only those goods and services produced in the current period i.e. produced during the time interval under consideration. The value of market transactions such as exchange of goods which already exist or are
previously produced, do not enter into the calculation of national income. Therefore, the value of assets such as stocks and bonds which are exchanged during the pertinent period are not included in national income as these do not
directly involve current production of goods and services.
(vi) Two types of goods used in the production process are counted in GDP namely, capital goods (business plant and equipment purchases) and inventory investment—the net change in inventories of final goods awaiting sale or of
materials used in the production which may be positive or negative.
© The Institute of Chartered Accountants of India

PAPER – 8: FINANCIAL MANAGEMENT AND ECONOMICS FOR FINANCE 109
(b) Net Domestic Product at Factor Cost = Compensation of Employees (wages and
salaries) + operating surplus (rent, interest and profit) + mixed income
= 7142+8912+541+1013+714+450
= 18772 crores.
(c) Personal Income = Net domestic product accruing to private sector + Net factor
income from abroad + Net current transfers from government + Net current transfers from rest of the world + interest on National debt – Corporation tax – Undistributed
profits of corporations
= 700+10+25+20+40-65-50
= 680 Crores
2. (a) The two sector economy model assumes that there are only two sectors in the
economy viz., households and firms, with only consumption and investment outlays. Households own all factors of production and they sell their factor services to earn factor incomes which are entirely spent to consume all final goods and services
produced by business firms. The business firms are assumed to hire factors of production from the households; they produce and sell goods and services to the households and they do not save. There are no corporations, corporate savings or
retained earnings. The total income produced, Y, accrues to the households and equals their disposable personal income Yd i.e., Y = Yd. All prices (including factor prices), supply of capital and technology remain constant. The government sector
does not exist and therefore, there are no taxes, government expenditure or transfer payments. The economy is a closed economy, i.e., foreign trade does not exist; there are no exports and imports and external inflows and outflows. All investment outlay
is autonomous (not determined either by the level of income or the rate of interest); all investment is net and, therefore, national income equals the net national product. The circular flow of income and expenditure which presents the working of the two-
sector economy should be illustrated diagrammatically. There are no injections into or leakages from the system. Since the whole of household income is spent on goods and services produced by firms, household expenditures equal the total receipts of
firms which equal value of output.
(b) i. Given,
Increase in income= 7500 crore
Increase in investment= 2500 crore
Therefore,
Investment multiplier (k)= ∆Y/∆I or
∆Y/∆I=1/1-mpc
7500/2500=1/1-mpc
© The Institute of Chartered Accountants of India

110 INTERMEDIATE (NEW) EXAMINATION: NOVEMBER, 2019
mpc= 0.66
ii. Suppose assume that income is 1000, 2000 and 3000
Then consumption is C= 200+0.9(1000) =1100
C= 200+0.9(2000) = 2000
C= 200+0.9(3000) = 2900
Thus:
Y C MPC (∆C/∆Y)
1000 1100 -
2000 2000 900/1000=0.9
3000 2900 900/1000=0.9
So we see as income increases from ` 1000 to ` 2000 and from ` 2000 to ` 3000, marginal propensity to consume remains constant i.e., 0.9.
3. A variety of allocation instruments are available by which governments can influence
resource allocation in the economy. They are -
i. government may directly produce the economic good (for example, electricity and
public transportation services)
ii. government may influence private allocation through incentives and disincentives (for example, tax concessions and subsidies may be given for the production of goods
that promote social welfare and higher taxes may be imposed on goods such as
cigarettes and alcohol)
iii. government may influence allocation through its competition policies, merger policies etc. which will affect the structure of industry and commerce (for example, the
Competition Act in India promotes competition and prevents anti -competitive
activities).
iv. governments’ regulatory activities such as licensing, controls, minimum wages, and
directives on location of industry influence resource allocation.
v. government sets legal and administrative frameworks, and
vi . any of a mixture of intermediate techniques may be adopted by governments.
4. When prices of certain essential commodities rise excessively, government may resort to
control in the form of price ceilings (also called maximum price) for making a resource or commodity available to all at reasonable prices. For example: maximum prices of food grains and essential items are set by government during times of scarcity. A price ceiling
which is set below the prevailing market clearing price will generate excess demand over
supply. (The students should draw the diagram in support of their answers)
© The Institute of Chartered Accountants of India

PAPER – 8: FINANCIAL MANAGEMENT AND ECONOMICS FOR FINANCE 111
With the objective of ensuring stability in prices and distribution, governments often intervene in grain markets through building and maintenance of buffer stocks. It involves
purchases from the market during good harvest and releasing stocks during periods when
production is below average.
5. (a) Yes, cable television is an example of impure public good. Impure public goods only partially satisfy two characteristics of public goods namely, non-rivalry in consumption
and non-excludability.
Cable television is non-rivalrous because the use of cable television by other individuals will in no way reduce your enjoyment of it. The good is excludable since the cable TV service providers can refuse connection if you do not pay for set top
box and recharge it regularly.
(b) Demerits goods are those goods which are believed to be socially undesirable. The consumption of these goods imposes significant negative externalities on the society
as a whole.
No. The production of steel is not essentially a demerit good. Though it causes
pollution and have negative externalities, it is not a socially undesirable good.
6. (a) According to Fisher, quantity theory of money demonstrate that there is strong relationship between money and price level and the quantity of money is the main determinant of the price level or the value of money. In other words, changes in the
general level of commodity prices or changes in the value or purchasing power of money are determined first and foremost by changes in the quantity of money in circulation. Fisher’s version, also termed as ‘equation of exchange’ or ‘transaction
approach’ is formally stated as follows:
MV = PT
Where, M= the total amount of money in circulation (on an average) in an economy V = transactions velocity of circulation i.e. the average number of times across all transactions a unit of money (say Rupee) is spent in purchasing goods and services
P = average price level (P= MV/T) T = the total number of transactions.
Later, Fisher extended the equation of exchange to include demand (bank) deposits (M’) and their velocity (V’) in the total supply of money. Thus, the expanded form of
the equation of exchange becomes:
MV + M'V' = PT
Where M’ = the total quantity of credit money V' = velocity of circulation of credit
money The total supply of money in the community consists of the quantity of actual money (M) and its velocity of circulation (V). Velocity of money in circulation (V) and
the velocity of credit money (V') remain constant. T is a function of national income.
Since full employment prevails, the volume of transactions T is fixed in the short run.
Briefly put, the total volume of transactions (T) multiplied by the price level (P)
© The Institute of Chartered Accountants of India
112 INTERMEDIATE (NEW) EXAMINATION: NOVEMBER, 2019
represents the demand for money. The demand for money (PT) is equal to the supply of money (MV + M'V)'. In any given period, the total value of transactions made is
equal to PT and the value of money flow is equal to MV+ M'V'.
Fisher did not specifically mention anything about the demand for money; but the same is embedded in his theory as dependent on the total value of transactions undertaken in the economy. Thus, there is an aggregate demand for money for
transactions purpose and more the number of transactions people want, greater will be the demand for money. T he total volume of transactions multiplied by the price
level (PT) represents the demand for money.
(b) Empirical analysis of money supply is important for two reasons:
1. It facilitates analysis of monetary developments in order to provide a deeper
understanding of the causes of money growth.
2. It is essential from a monetary policy perspective as it provides a framework to evaluate whether the stock of money in the economy is consistent with the standards for price stability and to understand the nature of deviations from this
standard. The central banks all over the world adopt monetary policy to stabilise price level and GDP growth by directly controlling the supply of money. This is achieved mainly by managing the quantity of monetary base. The succ ess of
monetary policy depends to a large extent on the controllability of money supply
and the monetary base.
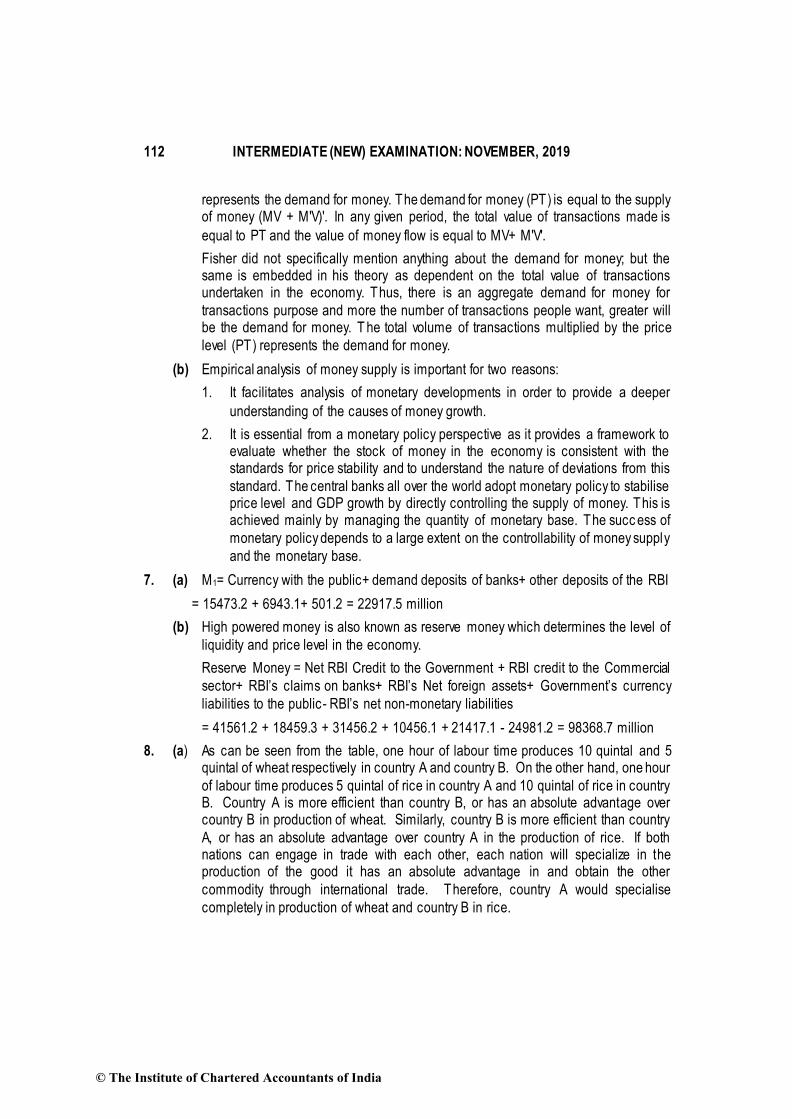
7. (a) M1= Currency with the public+ demand deposits of banks+ other deposits of the RBI
= 15473.2 + 6943.1+ 501.2 = 22917.5 million
(b) High powered money is also known as reserve money which determines the level of
liquidity and price level in the economy.
Reserve Money = Net RBI Credit to the Government + RBI credit to the Commercial
sector+ RBI’s claims on banks+ RBI’s Net foreign assets+ Government’s currency
liabilities to the public- RBI’s net non-monetary liabilities
= 41561.2 + 18459.3 + 31456.2 + 10456.1 + 21417.1 - 24981.2 = 98368.7 million
8. (a) As can be seen from the table, one hour of labour time produces 10 quintal and 5 quintal of wheat respectively in country A and country B. On the other hand, one hour
of labour time produces 5 quintal of rice in country A and 10 quintal of rice in country B. Country A is more efficient than country B, or has an absolute advantage over country B in production of wheat. Similarly, country B is more efficient than country
A, or has an absolute advantage over country A in the production of rice. If both nations can engage in trade with each other, each nation will specialize in the production of the good it has an absolute advantage in and obtain the other
commodity through international trade. Therefore, country A would specialise
completely in production of wheat and country B in rice.
© The Institute of Chartered Accountants of India

PAPER – 8: FINANCIAL MANAGEMENT AND ECONOMICS FOR FINANCE 113
(b) Customs duties are basically taxes or duties imposed on goods and services which are imported or exported. It is defined as a financial charge in the form of a tax,
imposed at the border on goods going from one customs territory to another. They are the most visible and universally used trade measures that determine market access for goods. Import duties being pervasive than export duties, custom duties
are often identified with import duties. Custom duties are aimed at altering the relative prices of goods and services imported, so as to contract the domestic demand and thus regulate the volume of their imports. Custom duties leave the world market price
of the goods unaffected; while raising their prices in the domestic market. The main goals of custom duties are to raise revenue for the government, and more importantly
to protect the domestic import-competing industries.
9. (a) Yes, prohibition of import of poultry from countries affected by avian flu, meat and
poultry processing standards to reduce pathogens, residue limits for pesticides in foods etc. are the examples of Sanitary and Phytosanitary (SPS) measures. These measures are applied to protect human, animal or plant life from risks arising from
additives, pests, contaminants, toxins or disease-causing organisms and to protect biodiversity. These include ban or prohibition of import of certain goods, all measures governing quality and hygienic requirements, production processes, and associated
compliance assessments.
(b) Food laws, quality standards, industrial standards are some of the examples of Technical Barriers to Trade (TBT), which cover both food and non-food traded products. Technical Barriers to Trade refer to mandatory ‘Standards and Technical Regulations’
that define the specific characteristics that a product should have, such as its size, shape, design, labelling/marking/packaging, functionality or performance and
production methods, excluding measures covered by the SPS Agreement.
10. (a) A horizontal direct investment is one under which the investor establishes the same type
of business operation in a foreign country as it operates in its home country, for example, a cell phone service provider based in the United States moving to India to provide the same service. On the other hand, vertical investment is one under which the investor
establishes or acquires a business activity in a foreign country which is different from the investor’s main business activity yet in some way supplements its major activity. For example; an automobile manufacturing company may acquire an interest in a foreign
company that supplies parts or raw materials required for the company.
(b) Real Exchange Rate = Nominal exchange rate*Domestic price index/ Foreign price
index
= 70*200/100
=140
© The Institute of Chartered Accountants of India