
Paper-6 a Novel Neural Cluster Approach to Select the Most Efficient Feature Set in Digital...
10
International Journal of Computational Intellig ence and Information Security, October 2011 Vol. 2, No. 10 44 Abstract—Digital mammography is one of the most used and most famous for diagnosis of breast cancer. It’s the most suitable method for early detection of breast cancer. This method uses digital mammograms to find out suspicious areas, which may contain benign or/ and malignant microcalcifications. Although it’s a tough task to distinguish various areas in mammograms yet computer aided systems are playing remarkable role in detecting these features and playing second fiddle in work of radiologists. Every new day in this research field comes with some new features for classifying mammograms hence there is a dilemma inside the radiologist w hich feature or feature set is explaining the mammogram best and will most helpful in diagnosis. The research in this paper is a sequel of previous work done “Feature Extraction for Classification of Microcalcifications and Mass Lesions in Mammograms”. This research proposes a methodology for selecting the feature or feature set which describes the mammogram best. The main aim of this paper is to develop a neural cluster based approach and a suitable neural architecture for microcalcification classification. The result obtains by this approach produces a relatively easy and effective set of features for detecting breast cancer in any mammogram. Index Terms—Digital Mammography, Feature Selection, Neural Clusters, Neural Networks I. INTRODUCTION Breast Cancer is a nightmare for the women between the ages of 40 to 55. It’s the leading cause of death in women. Unfortunately there is certain prevention for breast cancer. There is just a single hope for minimizing the fatality of this disease and that is early detection of Breast Cancer, as early as possible. Early detection of breast cancer plays a significant role in its treatment and also increases the survival rate. Digital mammography is considered as the best method for early detection so far. Digital mammograms also produces a number of confusions as in early stages visual clues are subtle and varied in appearance. This makes diagnosis difficult even for specialists. The main problem in diagnosis so far is selection of relevant data selection. As per our previous work and on the basis of numerous work done in this field, it is very much clearer that there is a large number of features which are selected in any mammogram. Radiologist generally emphasizes only those features in which they have a strong hand. This approach sometime increases false negatives, as all mammograms doesn’t possess all features. The main aim of this paper is to give a set of features for any particular mammograms, which can define that best. By this reduced set of selected features radiologists can diagnose more accurately and can emphasize most visible features instead of all features as large number of features creates confusion. Previously we have worked on a feature extraction in our previous paper. We have used wavelet as extraction tool. We have extracted a number of features and studied the research done by other people, and then we conclude up to a number of features. Above fig.1 is giving a glimpse of the work done by us. We are using the results of CAD system for feature extraction and further processing those features as a vector in our Neural Cluster based system. This system is selecting most significant features or feature set. Then this selected feature set is further processed to Visual Display unit, which is used by radiologists or doctors. This set of features contain the features which are describing any mammograms best and after selecting these features it A novel neural cluster approach to select the most efficient feature set in digital mammograms Mr. Rabi Narayan Panda, Dr. Bijaya Ketan Panigrahi, Dr. Manas Ranjan Patra and, Mr. Chetan Vashistth
-
Upload
rachel-wheeler -
Category
Documents
-
view
220 -
download
0
Transcript of Paper-6 a Novel Neural Cluster Approach to Select the Most Efficient Feature Set in Digital...

8/3/2019 Paper-6 a Novel Neural Cluster Approach to Select the Most Efficient Feature Set in Digital Mammograms
http://slidepdf.com/reader/full/paper-6-a-novel-neural-cluster-approach-to-select-the-most-efficient-feature 1/10
International Journal of Computational Intelligence and Information Security, October 2011 Vol. 2, No. 10
44
Abstract—Digital mammography is one of the most used and most famous for diagnosis of breast cancer. It’s the most suitable
method for early detection of breast cancer. This method uses digital mammograms to find out suspicious areas, which may contain
benign or/ and malignant microcalcifications. Although it’s a tough task to distinguish various areas in mammograms yet computer
aided systems are playing remarkable role in detecting these features and playing second fiddle in work of radiologists. Every new day
in this research field comes with some new features for classifying mammograms hence there is a dilemma inside the radiologist which
feature or feature set is explaining the mammogram best and will most helpful in diagnosis. The research in this paper is a sequel of
previous work done “Feature Extraction for Classification of Microcalcifications and Mass Lesions in Mammograms”. This researchproposes a methodology for selecting the feature or feature set which describes the mammogram best. The main aim of this paper is to
develop a neural cluster based approach and a suitable neural architecture for microcalcification classification. The result obtains by
this approach produces a relatively easy and effective set of features for detecting breast cancer in any mammogram.
Index Terms—Digital Mammography, Feature Selection, Neural Clusters, Neural Networks
I. INTRODUCTION
Breast Cancer is a nightmare for the women between the ages of 40 to 55. It’s the leading cause of death in women.
Unfortunately there is certain prevention for breast cancer. There is just a single hope for minimizing the fatality of this disease
and that is early detection of Breast Cancer, as early as possible. Early detection of breast cancer plays a significant role in its
treatment and also increases the survival rate.
Digital mammography is considered as the best method for early detection so far. Digital mammograms also produces anumber of confusions as in early stages visual clues are subtle and varied in appearance. This makes diagnosis difficult even for
specialists. The main problem in diagnosis so far is selection of relevant data selection. As per our previous work and on the
basis of numerous work done in this field, it is very much clearer that there is a large number of features which are selected in
any mammogram. Radiologist generally emphasizes only those features in which they have a strong hand. This approach
sometime increases false negatives, as all mammograms doesn’t possess all features. The main aim of this paper is to give a set
of features for any particular mammograms, which can define that best. By this reduced set of selected features radiologists can
diagnose more accurately and can emphasize most visible features instead of all features as large number of features creates
confusion.
Previously we have worked on a feature extraction in our previous paper. We have used wavelet as extraction tool. We have
extracted a number of features and studied the research done by other people, and then we conclude up to a number of features.
Above fig.1 is giving a glimpse of the work done by us. We are using the results of CAD system for feature extraction and
further processing those features as a vector in our Neural Cluster based system. This system is selecting most significant
features or feature set. Then this selected feature set is further processed to Visual Display unit, which is used by radiologists or
doctors. This set of features contain the features which are describing any mammograms best and after selecting these features it
A novel neural cluster approach to select the
most efficient feature set in digital
mammograms
Mr. Rabi Narayan Panda, Dr. Bijaya Ketan Panigrahi, Dr. Manas Ranjan Patra and, Mr. Chetan
Vashistth
8/3/2019 Paper-6 a Novel Neural Cluster Approach to Select the Most Efficient Feature Set in Digital Mammograms
http://slidepdf.com/reader/full/paper-6-a-novel-neural-cluster-approach-to-select-the-most-efficient-feature 2/10
International Journal of Computational Intelligence and Information Security, October 2011 Vol. 2, No. 10
45
is even easier to diagnose.
In this process the output of previous system is working as an input to Neural System. The set of all extracted features is used
as input vector to system.
II. PREVIOUS WORK
We have reviewed a number of research work done by various researcher in this field. Our previous paper is also for
extracting various features from any Mammogram. There are a number of features described by various researchers. Every
research paper finds out some new features for studying the mammograms. In this scenario it is quite difficult to make a set of selected features for studying any mammogram. If we are taking general mathematics formula then it very much obvious that for
an N number of features there can 2^N subset of features. Hence there is a large search space in any condition for feature
selection. Researchers put tremendous efforts for selection of best set of features by using different approaches viz. Hill
Climbing and Best Fit search algorithm. Some of them used weighted approach by assigning real value to features. These
features selection techniques work remarkably well but with some limitations. Racz and Nieniewski [2], developed most
discriminative components analysis and a forward/backward selection strategy to reduce the input size from 189 to 46 for CAD
system based on analysis of microcalcifications. Some others [4-5] have explored randomized and population based heuristic
search techniques such as genetic algorithms to select feature subset for use with different classifiers.
After overall reviewing the literature, neural networks are best effective solution for exact tuning solution after a promising
ROI has been identified in search space. Chitre et al.[1] used Back Propagation Neural Network as an image structure classifier.
Though result is not promising, but it is better than the statistical classifiers.
The objective of this paper is to present a Neural Cluster based approach for selecting the set of best defining features by
which we can get the most significant result from mammograms. This set of selected features can help in effective diagnosisabnormalities as benign and malignant.
The rest of this paper is organized as follows: section 3 describes the proposed research methodology followed by the
implementation in section 4. The experimental results are presented in section 5. Section 6 discusses the obtained results by the
proposed technique. The discussion and future research are stated in the final section.
III. PROPOSED METHODOLOGY
Our proposed methodology is using Neural Clusters for the selection of features. After using an effective CAD system for
extracting various features from mammograms we transfer the results to our system for further processing. After selecting the
best feature set it is quite easy for a radiologist to classify the abnormalities in any mammogram. Fig.2 is giving an idea about
our complete procedure.III(a). Mammographic Database: in our current research we are using MIAS database UK for our screening of mammograms.
MIAS provides free database to all researchers and have a large sample of mammograms of all types. In MIAS database
mammograms are classified in different categories, which make study lot easier.
III(b). Feature Extraction: As stated earlier we have proposed a method in our previous paper for extraction of various features
in any mammogram. Instead of these features which are extracted by us we are not avoiding the features which are found by
other researchers. We are including all the well known features for making of our vectors. By including all the features our
selection will be more specific and more accurate.
After reviewing a lot of literature we conclude with a number of most generalized features for our application. These selected
features are given as input to our application and that will result in the most specific set of features.
The most commonly used features are histogram, average grey level, energy, entropy, number of pixels, standard deviation,
skew, average boundary grey level, difference and contrast. Formulae for every feature are described below: for each of the
formulae: T is total number of pixels, g an index value of image I, K total number of grey levels(i.e. 4096), j the grey level value
(i.e. 0-4095), I(g) the grey level value of pixel g in image I, N(j) the number of pixels with grey level j in image l, P(l(g)) theprobability of grey level value l(g) occurring in image I, P(g)=N(I(g))/T, and P(j) is the probability of grey level value j occurring
in image I, P(j)=N(j)/T:
Histogram = (1)
Average grey level = (2)
Number of pixels = count of the pixels in the extracted area (3)
Boundary grey level = count grey levels at boundary (4)

8/3/2019 Paper-6 a Novel Neural Cluster Approach to Select the Most Efficient Feature Set in Digital Mammograms
http://slidepdf.com/reader/full/paper-6-a-novel-neural-cluster-approach-to-select-the-most-efficient-feature 3/10
International Journal of Computational Intelligence and Information Security, October 2011 Vol. 2, No. 10
46
Difference = average grey – average boundary grey (5)
Contrast = (6)
Energy = (7)
Entropy = (8)
Standard deviation (σ) = (9)
Skew = (10)
For a clearer impact fig.2 can give the complete structure of methodology. The input for this system is digital mammograms.
We are using CAD system for feature extraction of features as an intermediate system for our complete application. The
extracted feature set is considered as input for our neural cluster. And after making clusters the desired output, the most efficient
set of features, got. These selected features are shown on a visual display device so that any radiologist or expert can easily
diagnose that case without any technical perfection on CADs.
III(c).Neural Clusters used in application: Here we are explaining the basics of clustering approach used in various
applications.
Fuzzy C-Means(FCM) : Fuzzy C-Means clustering model can be defined as follows:
min (11)
ST: (12)
where, is the degree of belonging of the data to the cluster, is the distance between the data and the
cluster center, m is the degree of fuzziness, c is the number of clusters, and N is the number of data.
Fuzzy clustering algorithm: Clustering, as a basic approach, on some unbalanced data set X = is
partitioning x into c subsets such that 1 < c < n. Each point in x is a vector in n-dimensional space. In most of the clustering
methods, each data point belongs to at most one cluster. We define c-partition of x as a c×n matrix representing memberships of
each data point to all clusters. We show the matrix as = , i=1…c, j=1….n. in k-means algorithm, U is defined by the

8/3/2019 Paper-6 a Novel Neural Cluster Approach to Select the Most Efficient Feature Set in Digital Mammograms
http://slidepdf.com/reader/full/paper-6-a-novel-neural-cluster-approach-to-select-the-most-efficient-feature 4/10
International Journal of Computational Intelligence and Information Security, October 2011 Vol. 2, No. 10
47
equation (13).
(13)
Possibilistic clustering approach: Possibilistic clustering approach named PCM was proposed to overcome the limitations of
FCM model. Instead of probabilistic memberships , the resulting partition of data can be interpreted as a possibilistic partition
and each membership value may be interpreted as possibility or degree of compatibility. Equation (14) represents definition of
matrix U based on possibilities.
(14)
By minimizing the objective function, update formulas for ui, j , βi(center for cluster i) are indicated in equations (16,17,18).
(15)
(16)
(17)
(18)
Cluster prototype leads us to an iterative computing which is shown in the equation below.
(19)
Where, is new center for cluster i. Iteration continues while < ɛ. For βi on the right side of the above
equation, values of previous iteration are used. A cluster is attracted by data assigned to it and repelled by the other clusters.
The neural network diagram for an 11 input cluster network is shown in fig.3 below.
Fig.3
We can also represent the modeling diagram for our application by presenting the simulink diagram for the neural netwok.
Fig.4, which is shown below describes the simulink diagram.

8/3/2019 Paper-6 a Novel Neural Cluster Approach to Select the Most Efficient Feature Set in Digital Mammograms
http://slidepdf.com/reader/full/paper-6-a-novel-neural-cluster-approach-to-select-the-most-efficient-feature 5/10
International Journal of Computational Intelligence and Information Security, October 2011 Vol. 2, No. 10
48
IV. IMPLEMENTATION
The implementation of the program is divided into three steps: (1) area extraction, (2) feature extraction and (3) neural cluster
algorithm for feature selection.
IV(a). Area extraction: the area extraction program is used for extraction of microcalcification area from the mammogram. We
are using MIAS database for testing and learning purpose of our application. This program reads images from that database and
extract ROI(region of interest) in any mammogram.
IV(b). Feature extraction program: Feature extraction program takes the output of previous program as input for it. Feature
extraction program extract feature which are described in section III of this paper. There are a lot of features which can be find
from any mammogram, but here we are emphasizing the most relevant features for our application.
IV(c). Neural Cluster algorithm for feature selection: this paper involves the clusters as described in above sections. We are
using possibilistic clusters for our application.
Our program reads the features in each mammogram in the form of vectors and on the basis of those vectors makes clusters
related to each feature.
The main implementation technique which is used here, is generally vectors are taken in linear form hence we take rows as
vector. Each row of matrix shows a different vector. Here we are taking columns for our consideration. Each column is specified
for a feature and by taking the relative distance of our test vector from affected mammogram’s clusters we can mark any feature
is working or not.
This can be elaborate well by following image. Fig. 5 explains this better.
8/3/2019 Paper-6 a Novel Neural Cluster Approach to Select the Most Efficient Feature Set in Digital Mammograms
http://slidepdf.com/reader/full/paper-6-a-novel-neural-cluster-approach-to-select-the-most-efficient-feature 6/10
International Journal of Computational Intelligence and Information Security, October 2011 Vol. 2, No. 10
49
By taking reference from above figure we can get a clear idea about the relative distances between various clusters. It is the
property of clusters that the cluster which has the same properties has relatively less distance then the other one.
Figure 6 above is showing the neighboring distances between various clusters.
V. EXPERIMENTAL RESULTS
Now we can move towards the testing phase of our application. We are using the data from CAD system in the form of
features from various mammograms. Our dataset contains the mammogram sample of all types namely: Benign cases, Malignant
Cases, Calcifications and Normal cases as well. This type of training data will help us finding most efficient feature set for
further use.
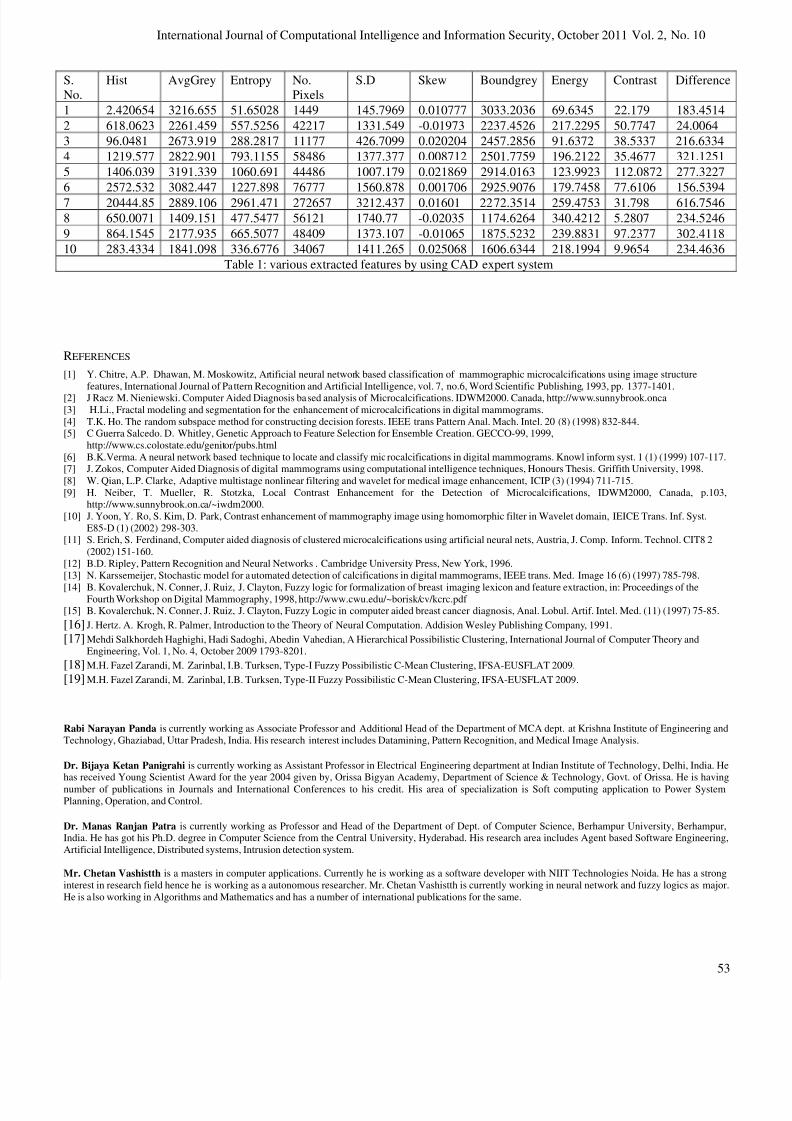
The table 1 is a demo table of table which is used for guiding our neural network after a number of phases in training our
network we are using a set of 50 sample data of mammograms. Having 15 malignant cases and 23 benign cases, 6 of them
showing simple calcification and rest six are without any abnormality. After proper training of our neural network whenever we
provide any new sample of mammogram then it check various features as separate vectors. Whenever we check any feature then
if it lies in clusters with respective less distance then that feature get selected otherwise we reject that feature.
Now we will discuss the various results got after training our network.
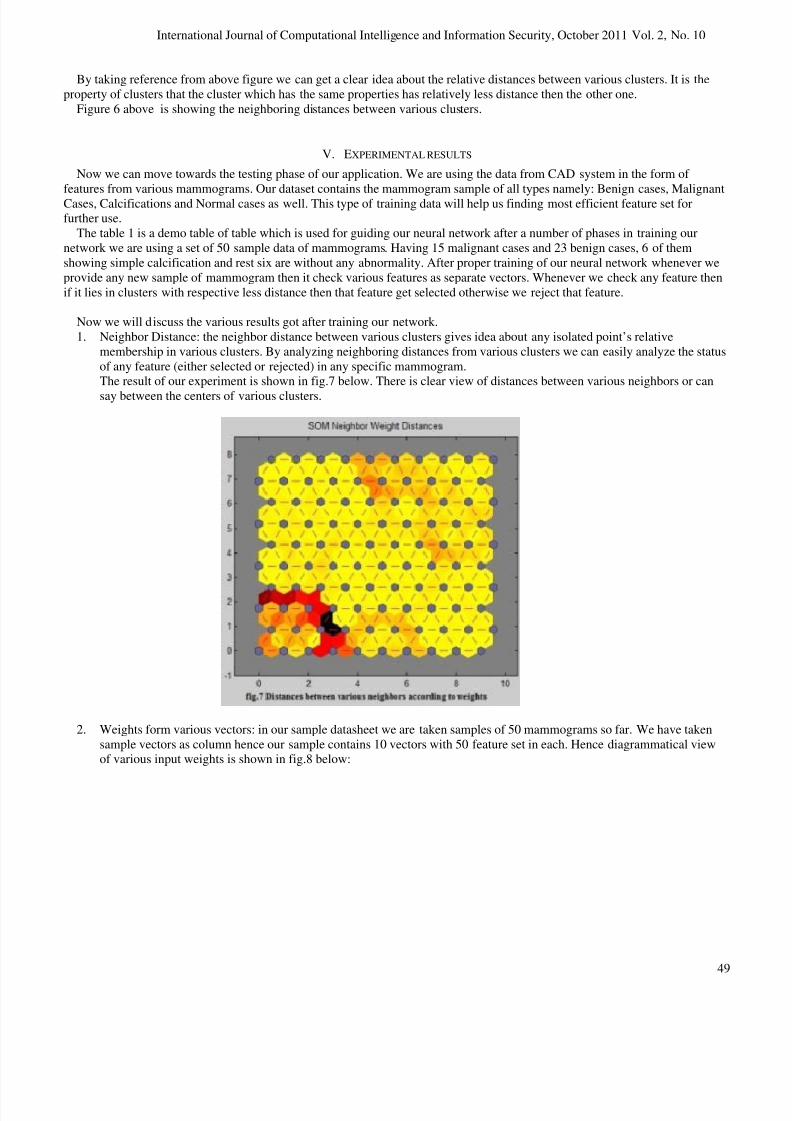
1. Neighbor Distance: the neighbor distance between various clusters gives idea about any isolated point’s relative
membership in various clusters. By analyzing neighboring distances from various clusters we can easily analyze the status
of any feature (either selected or rejected) in any specific mammogram.
The result of our experiment is shown in fig.7 below. There is clear view of distances between various neighbors or can
say between the centers of various clusters.
2. Weights form various vectors: in our sample datasheet we are taken samples of 50 mammograms so far. We have taken
sample vectors as column hence our sample contains 10 vectors with 50 feature set in each. Hence diagrammatical view
of various input weights is shown in fig.8 below:

8/3/2019 Paper-6 a Novel Neural Cluster Approach to Select the Most Efficient Feature Set in Digital Mammograms
http://slidepdf.com/reader/full/paper-6-a-novel-neural-cluster-approach-to-select-the-most-efficient-feature 7/10
International Journal of Computational Intelligence and Information Security, October 2011 Vol. 2, No. 10
50
3. Sample hits in different clusters: this result shows number of hits in various clusters based on their respective weight
positions. The experimental result is shown in figure 9. On the basis this sample hit we can easily determine the busiest
cluster in our sample data space.
4. SOM weight positions: if we take our all weights in two dimensions then we easily determine the most interested region.
Figure 10 giving the diagrammatical view of SOM positions.

8/3/2019 Paper-6 a Novel Neural Cluster Approach to Select the Most Efficient Feature Set in Digital Mammograms
http://slidepdf.com/reader/full/paper-6-a-novel-neural-cluster-approach-to-select-the-most-efficient-feature 8/10
International Journal of Computational Intelligence and Information Security, October 2011 Vol. 2, No. 10
51
The figures above are showing the results of our experiments very clear. The results are directly proportional to the relevancy
of data and the volume of data. It is contradictory in case of various applications but true in our application that voluminous data
gives more accurate results.
Here are some reusable scripts which can be used in matlab’s latest versions (which support neural network). The script to
import file to our workspace is:
function [newData1] = importfile(fileToRead1) %IMPORTFILE(FILETOREAD1) % Imports data from the specified file % FILETOREAD1: file to read
% Auto-generated by MATLAB on 05-Oct-2011 06:30:07
% Import the file sheetName='Sheet1'; [numbers, strings] = xlsread(fileToRead1, sheetName); if ~isempty(numbers)
newData1.data = numbers; end if ~isempty(strings)
newData1.textdata = strings; end
similarly the script for making clusters is given below:
% Solve a Clustering Problem with a Self-Organizing Map % Script generated by NCTOOL % Created Wed Oct 05 06:31:11 PDT 2011 %
% This script assumes these variables are defined: % % data - input data.
inputs = data';
% Create a Self-Organizing Map dimension1 = 10; dimension2 = 10; net = selforgmap([dimension1 dimension2]);
8/3/2019 Paper-6 a Novel Neural Cluster Approach to Select the Most Efficient Feature Set in Digital Mammograms
http://slidepdf.com/reader/full/paper-6-a-novel-neural-cluster-approach-to-select-the-most-efficient-feature 9/10
International Journal of Computational Intelligence and Information Security, October 2011 Vol. 2, No. 10
52
% Train the Network [net,tr] = train(net,inputs);
% Test the Network outputs = net(inputs);
% View the Network view(net)
% Plots % Uncomment these lines to enable various plots. %figure, plotsomtop(net) %figure, plotsomnc(net) %figure, plotsomnd(net) %figure, plotsomplanes(net) %figure, plotsomhits(net,inputs) %figure, plotsompos(net,inputs)
The script given above is for future use. This script is auto generated from GUI of matlab R2011 a. After seeing all the
above results it is satisfactory that it is working. Fig.8 is giving the weight positions of different features in all vectors which is
giving a pattern in of distribution in all mammograms. The feature which is showing more clustered area is working for that
mammogram and feature less clustered is not so much demanding in that specific mammogram.
VI. DISCUSSION AND ANALYSIS
The results generated from our application are shown above. After seeing all the results it is clearer that these results are
demanding. There is a clear view of weight clusters for selecting our features. The statistical tabular results are also available for
each phase for a numerical results or report. Hence this approach is working.
The error rate is remarkably less in our application. There are some researchers who says that malignant errors are more
serious than Benign errors, as they are more fatal. But in our view both errors have same seriousness as both lead cancers. Early
detection is only prevention that increases the importance of every result.
The main point here is this application is working remarkably well in case of large data space. Large data space provides large
data for guiding our neural net.
VII. CONCLUSION AND FUTURE SCOPE
Here we have proposed and implemented a novel approach for finding and selecting most efficient feature set in any
mammogram. This set of selected features helps in diagnosis of breast cancer. After conducting a lot of experiments and analysis
of results we conclude which is drawn below.
The resultant classification rate and feature set are very much promising. Our application is giving clear result in
diagrammatical view. Stastical results can also be generated for the same for a analytical approach. Now radiologist can
concentrate only on relevant data set of features which minimize the false positives and false negatives in diagnosis.
Our application is working on a large data set of samples hence the filtering or screening of mammograms is not provided
here. Screening is a general problem for radiologists and sometimes leads to false results. The problem of screening
mammograms is solved upto a great extent here.
In future we can modify complete application to classify cancer also. Neural network can be used for feeding the current data
set, and more accurate results can be obtained after implementing new approach for classifying benign and malignant. A bitintervention of experts can lead to more accurate and effective application for the diagnosis.
VIII. ACKNOWLEDGEMENTS
We heartily thankful the University of London for provides us the MIAS database for our research. Without their contribution
it is never possible. We also need to mention the thanks to staff of Guru Teg Bahadur Cancer Hospital, Sahadara for their
support. We also gives the special thanks to our colleagues for supporting us morally.
The sacrifice of our families can never be forgotten. Special thanks to our children for their sacrifice and patience.
8/3/2019 Paper-6 a Novel Neural Cluster Approach to Select the Most Efficient Feature Set in Digital Mammograms
http://slidepdf.com/reader/full/paper-6-a-novel-neural-cluster-approach-to-select-the-most-efficient-feature 10/10
International Journal of Computational Intelligence and Information Security, October 2011 Vol. 2, No. 10
53
S.
No.
Hist AvgGrey Entropy No.
Pixels
S.D Skew Boundgrey Energy Contrast Difference
1 2.420654 3216.655 51.65028 1449 145.7969 0.010777 3033.2036 69.6345 22.179 183.4514
2 618.0623 2261.459 557.5256 42217 1331.549 -0.01973 2237.4526 217.2295 50.7747 24.0064
3 96.0481 2673.919 288.2817 11177 426.7099 0.020204 2457.2856 91.6372 38.5337 216.6334
4 1219.577 2822.901 793.1155 58486 1377.377 0.008712 2501.7759 196.2122 35.4677 321.1251
5 1406.039 3191.339 1060.691 44486 1007.179 0.021869 2914.0163 123.9923 112.0872 277.3227
6 2572.532 3082.447 1227.898 76777 1560.878 0.001706 2925.9076 179.7458 77.6106 156.5394
7 20444.85 2889.106 2961.471 272657 3212.437 0.01601 2272.3514 259.4753 31.798 616.7546
8 650.0071 1409.151 477.5477 56121 1740.77 -0.02035 1174.6264 340.4212 5.2807 234.5246
9 864.1545 2177.935 665.5077 48409 1373.107 -0.01065 1875.5232 239.8831 97.2377 302.4118
10 283.4334 1841.098 336.6776 34067 1411.265 0.025068 1606.6344 218.1994 9.9654 234.4636
Table 1: various extracted features by using CAD expert system
REFERENCES
[1] Y. Chitre, A.P. Dhawan, M. Moskowitz, Artificial neural network based classification of mammographic microcalcifications using image structure
features, International Journal of Pattern Recognition and Artificial Intelligence, vol. 7, no.6, Word Scientific Publishing, 1993, pp. 1377-1401.[2] J Racz M. Nieniewski. Computer Aided Diagnosis based analysis of Microcalcifications. IDWM2000. Canada, http://www.sunnybrook.onca
[3] H.Li., Fractal modeling and segmentation for the enhancement of microcalcifications in digital mammograms.
[4] T.K. Ho. The random subspace method for constructing decision forests. IEEE trans Pattern Anal. Mach. Intel. 20 (8) (1998) 832-844.[5] C Guerra Salcedo. D. Whitley, Genetic Approach to Feature Selection for Ensemble Creation. GECCO-99, 1999,
http://www.cs.colostate.edu/genitor/pubs.html
[6] B.K.Verma. A neural network based technique to locate and classify microcalcifications in digital mammograms. Knowl inform syst. 1 (1) (1999) 107-117.[7] J. Zokos, Computer Aided Diagnosis of digital mammograms using computational intelligence techniques, Honours Thesis. Griffith University, 1998.
[8] W. Qian, L.P. Clarke, Adaptive multistage nonlinear filtering and wavelet for medical image enhancement, ICIP (3) (1994) 711-715.
[9] H. Neiber, T. Mueller, R. Stotzka, Local Contrast Enhancement for the Detection of Microcalcifications, IDWM2000, Canada, p.103,http://www.sunnybrook.on.ca/~iwdm2000.
[10] J. Yoon, Y. Ro, S. Kim, D. Park, Contrast enhancement of mammography image using homomorphic filter in Wavelet domain, IEICE Trans. Inf. Syst.
E85-D (1) (2002) 298-303.[11] S. Erich, S. Ferdinand, Computer aided diagnosis of clustered microcalcifications using artificial neural nets, Austria, J. Comp. Inform. Technol. CIT8 2
(2002) 151-160.
[12] B.D. Ripley, Pattern Recognition and Neural Networks . Cambridge University Press, New York, 1996.
[13] N. Karssemeijer, Stochastic model for automated detection of calcifications in digital mammograms, IEEE trans. Med. Image 16 (6) (1997) 785-798.
[14] B. Kovalerchuk, N. Conner, J. Ruiz, J. Clayton, Fuzzy logic for formalization of breast imaging lexicon and feature extraction, in: Proceedings of theFourth Workshop on Digital Mammography, 1998, http://www.cwu.edu/~borisk/cv/kcrc.pdf
[15] B. Kovalerchuk, N. Conner, J. Ruiz, J. Clayton, Fuzzy Logic in computer aided breast cancer diagnosis, Anal. Lobul. Artif. Intel. Med. (11) (1997) 75-85.
[16] J. Hertz. A. Krogh, R. Palmer, Introduction to the Theory of Neural Computation. Addision Wesley Publishing Company, 1991. [17] Mehdi Salkhordeh Haghighi, Hadi Sadoghi, Abedin Vahedian, A Hierarchical Possibilistic Clustering, International Journal of Computer Theory and
Engineering, Vol. 1, No. 4, October 2009 1793-8201. [18] M.H. Fazel Zarandi, M. Zarinbal, I.B. Turksen, Type-I Fuzzy Possibilistic C-Mean Clustering, IFSA-EUSFLAT 2009. [19] M.H. Fazel Zarandi, M. Zarinbal, I.B. Turksen, Type-II Fuzzy Possibilistic C-Mean Clustering, IFSA-EUSFLAT 2009.
Rabi Narayan Panda is currently working as Associate Professor and Additional Head of the Department of MCA dept. at Krishna Institute of Engineering and
Technology, Ghaziabad, Uttar Pradesh, India. His research interest includes Datamining, Pattern Recognition, and Medical Image Analysis.
Dr. Bijaya Ketan Panigrahi is currently working as Assistant Professor in Electrical Engineering department at Indian Institute of Technology, Delhi, India. Hehas received Young Scientist Award for the year 2004 given by, Orissa Bigyan Academy, Department of Science & Technology, Govt. of Orissa. He is having
number of publications in Journals and International Conferences to his credit. His area of specialization is Soft computing application to Power SystemPlanning, Operation, and Control.
Dr. Manas Ranjan Patra is currently working as Professor and Head of the Department of Dept. of Computer Science, Berhampur University, Berhampur,India. He has got his Ph.D. degree in Computer Science from the Central University, Hyderabad. His research area includes Agent based Software Engineering,
Artificial Intelligence, Distributed systems, Intrusion detection system.
Mr. Chetan Vashistth is a masters in computer applications. Currently he is working as a software developer with NIIT Technologies Noida. He has a strong
interest in research field hence he is working as a autonomous researcher. Mr. Chetan Vashistth is currently working in neural network and fuzzy logics as major.
He is also working in Algorithms and Mathematics and has a number of international publications for the same.