Paper 5: Rankings of International Research Institutes (Liu, Wenbin)
42
Evaluation and Ranking Evaluation and Ranking of National Research of National Research Institutes Institutes Project Group of National Research Institu te Ranking Institute of Policy and Management, Chines e Academy of Science Presented by Prof. WB Liu Kent Business School, University of Ke nt, UK
-
Upload
kent-business-school -
Category
Technology
-
view
1.046 -
download
0
description
Transcript of Paper 5: Rankings of International Research Institutes (Liu, Wenbin)

Evaluation and Ranking Evaluation and Ranking of National Research of National Research
InstitutesInstitutes
Evaluation and Ranking Evaluation and Ranking of National Research of National Research
InstitutesInstitutes
Project Group of National Research Institute Ranking
Institute of Policy and Management, Chinese Academy of Science
Presented by Prof. WB Liu
Kent Business School, University of Kent, UK2010-07-01 , Canterbury, UK

MotivationMotivation CAS, the largest independent research institutions in Chin
a , with almost 100 research institutions involving all the disciplines of natural sciences, about 30,000 permanent research staff
Quantitative expansion moved to qualitative improvement Crucial to enhance competitiveness and sustainability in i
nternational level Need to know the gap comparing with relevant institution
s in the word, relative positionStrength and weaknessHow to improve
Evaluation and rankingEvaluation and ranking

Evaluation and Ranking of National Evaluation and Ranking of National Research InstitutesResearch Institutes
CAS needs to compare its performance with those of leading national research institutes
There are international evaluation and ranking reports that contain R&D evaluations for a country or university
But there exist no reports tailor-made for national research institutes
Also these reports cannot be used to diagnose weakness of CAS

What is a national research institute? They are ( 1 ) Large multi-discipline research i
nstitutes adm and funded by a country ( 2 ) Research institutes adm. and fu
nded by ministries or public bodies ( 3 ) Research institutes adm. and fu
nded by local government or mixed

Evaluation and Ranking of National Evaluation and Ranking of National Research InstitutesResearch Institutes
Research of a national research institute often covers many different subjects’ areas and has multiple-purposes for basic research, applied research, and R&D.
The key issue is how to evaluate its overall capability and performance.
In 2006 this study first started in the Evaluation Centre of CAS, IPM, CAS. Then CAS Library joined.
A project group was formed –key members including Li X.X, Wei Meng, Ms Liu, Z.Y, Ms Fang Xu (Kent), Mr Y.G Yang Prof. WB Liu was in charge of methodology development
The project was finished in 2009.

What are their missions?
R&D Development need of a country This part is difficult to compare and evaluate Basic and applied scientific research For this part, it is possible to compare their perfo
rmance, at least by subject. We developed 3E measurement for this purpose:
E1 – Research Efficacy E2 – Research Efficiency E3 - Research Effectiveness

Evaluation and Ranking of National Evaluation and Ranking of National Research InstitutesResearch Institutes
Based on Soft System Methodology, we developed a methodology in building indicators system to measure efficacy, efficiency; effectiveness of a national research institute.
We have built the theoretical 3E indicators system for the overall capability and performance of national research institutes, based on the SSM models of basic research, applied research
We have developed evaluation methods to aggregate the data in order to produce ranks for the institutes 。

Hierarchical Structure of Indicator
Output or effectiveness were divided into several levels
Example: High quality Pub has Top0.1%,Top1%, Top10%, and SCI, with decreasing weights
SCI editorship is divided into 1% 、 Top5%,Top10%,
Awards were similarly divided. – cross subjects, subjects, sub-subjects
TOP10% Pub
TOP0.1%Pub
TOP1% Pub

Approach Samples Indicators Evaluation Method Case Further work – data reliability and
methodology robust International Discussion Group
Evaluation and Ranking of National Evaluation and Ranking of National Research InstitutesResearch Institutes

ApproachApproach Subject evaluation first -then cross subject evaluation
Theoretical base: SSM and 3E indicator theory
Research Output(E1), Reproach Efficiency (E2), Research Effectiveness (E3)
Overall by aggregating sub-rankings of subjects

ApproachApproachOverall
Subject 1 …Subject N
E1 output E2 efficiency E3 E2 E1
Subjects Ranking and then Overall Ranking
SSM ANALYSIS
E3 effectiveness

Ranking of RIsRanking of RIs
Overall performanceOverall performance
Functions analysisFunctions analysis
Single Single disciplinediscipline
Multi-Multi-disciplinesdisciplines
BasicBasic researchresearch
BasicBasic researchresearch
AppliedAppliedResearchResearchAppliedApplied
ResearchResearch
indicators
•Sample comparison, feedback and discussion Sample comparison, feedback and discussion •Define and select indicators, build indicators systemDefine and select indicators, build indicators system•Aggregating, preliminary calculation, further adjustingAggregating, preliminary calculation, further adjusting
indicators

Sample Selection - basic research Generating new knowledge Undertaking state projects or programme, contribute to h
igh-tech development, finally, social and economic development
Total publications in top 100
Total citations in top 100
Citations per article in top 100
Discipline
Based on ESI ( Essential Science Indicators), 20 disciplines, also EI,..
Selected 89 organization world-wide
Samples pool
Selected samples

Sample-Sample-Scale difference Scale difference
6, 10%
14, 23%
25, 42%
15, 25%
>20,000 10,000-20,000 1,000-9,999 <1,000

Sample-Sample- subjects distribution subjects distribution
USDA
50%
4%0%
2%
14%
2%
1%
0%
5%
0%
0%
1%
1%
1%19% 1 . BiS
ci2 . Chem3 . Comp4 . Eng5 . Envi6 . 地学7 . 材料8 . 数学9 . 医学10 . 神经11 . 物理12 . 社科13 . 多 学科14 . 免疫15 . 农业
CAS
11%
27%
2%6%
3%9%
10%
2%
2%
1%
24%
0%
2%
0%
1%
1 . BiSci2 . Che
m3 . Comp4 . Eng5 . Envi6 . 地学7 . 材料8 . 数学9 . 医学10 . 神经11 . 物理12 . 社科13 . 多 学科14 . 免疫15 . 农业

IndicatorsIndicatorsTitle Organization year
Chinese Statistic Year Book (CSY) Bureau of statistics, China 2003—2005
Chinese Science and Technology Year Book (CSSTY) MOST, China 2005
Chinese Science Technology Indicator (CSTY) MOST, China 2004
CAS Innovation Index (CASCCI) CAS 2006
World University Research competitiveness Index (WUSRCI) WuHan Univeristy 2005
Evaluation and Ranking of Chinese University (CUE)
WuHan UniversityResearch institute of Management Science, GuangDong,Graduates Development Centre in MOE,
2004-20061991-20011000-20042006
World Competitiveness Yearbook (WCY) Lausanne ( IMD) 2004
Main Science and Technology Indicators(MSTI) ( OECD) 2003
Global competition indicators( GCI) World Economic Forum (WEF) 2003
Science and Engineering Indicators-US (SEI) National Science Board( NSB) 2002-2006
New Science and Technology Indicators (NST) Economic and Social Commission for Western Asia ( ESCWA) 2003
Knowledge Science and Innovation( KSI) European Commission Office ( EC) 2000

Characteristics : Statistial-oriented indicators : (CSY 、 CSTY 、 SCTY, OECD(MSTI) )
Present overall national or local pictures in terms of R&D activities
Linkage with organizational function is weak, hard to use to evaluate research institutions directly
Satisfy specific assessment objective : (University ranking)
As least as possible to achieve evaluation objective More or less, lack of systemic inter-functional analysis
of research institutions Indicator definition and selection : expert experiences 、
questionnaire
Indicators comparisonIndicators comparison
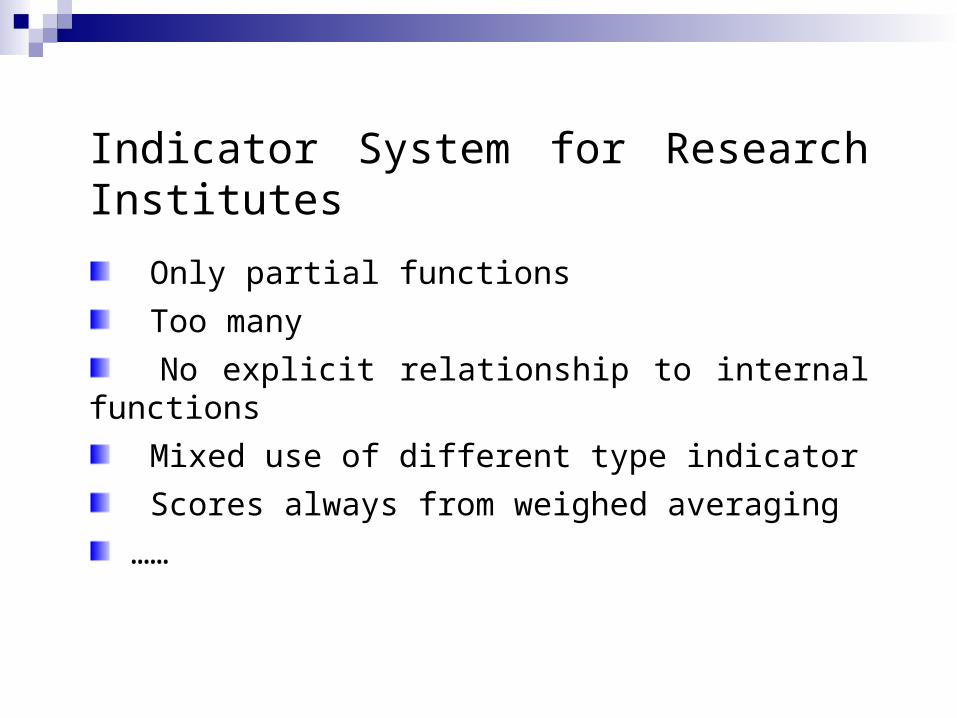
Indicator System for Research Institutes
Only partial functions
Too many
No explicit relationship to internal functions
Mixed use of different type indicator
Scores always from weighed averaging
……
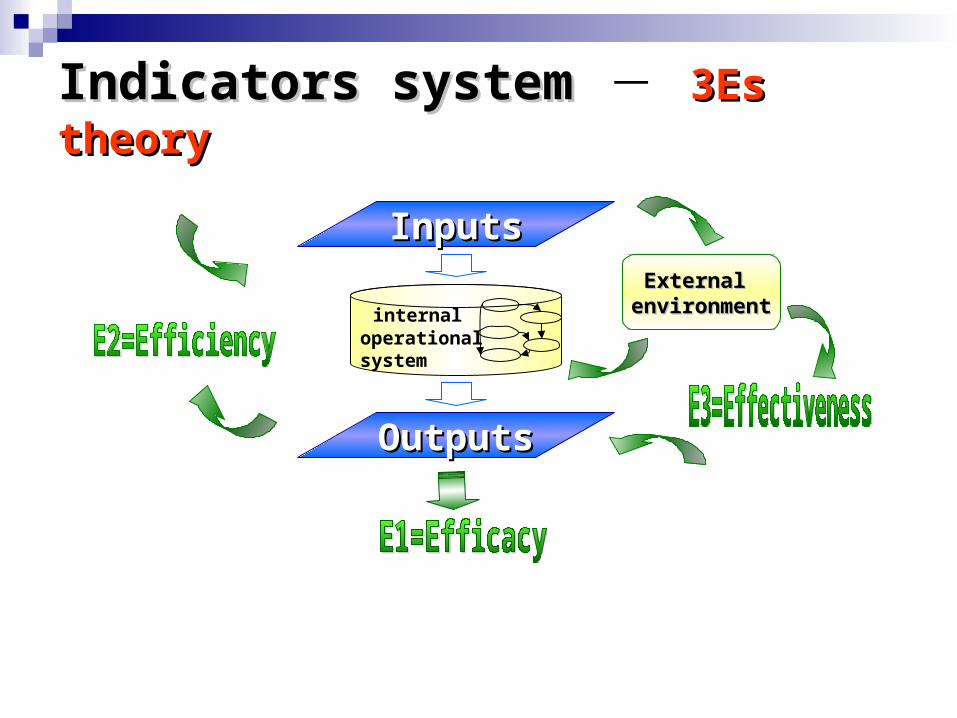
Indicators systemIndicators system 3Es theory3Es theory
InputsInputs
OutputsOutputs
internaloperationalsystem
External External environmentenvironment

Why needs system analysisWhy needs system analysisWhy needs system analysisWhy needs system analysis
How to build a complete 3E indicator system?
1. Complete indicator systems can only be based on good understanding of internal processes
2. A good SSM system analysis will not only bring good understanding of internal processes but also structured 3E indicator data-bases
3. Good combinations of existing techniques

SSM and 3EsSSM and 3Es
2.Express messy system
3.Build RD of 3.Build RD of relevant purposeful relevant purposeful
activity systemactivity system
1.Complex situation inspect
6.Debate with systematically desirable
and culture feasible
7.Take into actions to improve
5.Compare CM with 2
4.Formulate CM4.Formulate CM
Real worldReal world
system thingssystem things
Activities inmodel
Exist? How? Who? Comments
-Obtain-Understand-Determine–Decide-
RD1
RD2
RD3
The spirit of SSM is that any system can be analysed by answering three questions as:
1) What to do (P) - Efficacy relate, measures the outputs of the system
2) How to do (Q) - Efficiency relate, evaluates whether minimum resources are used.
3) Why to do (R) - Effectiveness relate, assesses whether the system outputs are meaningful or useful to higher level (wider) system.

Evaluation Framework:Evaluation Framework:System monitored and controlled by 3EsSystem monitored and controlled by 3EsEvaluation Framework:Evaluation Framework:System monitored and controlled by 3EsSystem monitored and controlled by 3Es
Based on 3E’ Efficacy
Outputs of a system, or value-add
Efficiency Outputs/resources, or value-add/resources
Effectiveness Desirable impact of Efficacy to aims of higher systems
Example:Example: A production-line can produce goods efficiently but make no profits. So
effectiveness is 0 for the company. Or it may make profits but with 0 effectiveness for the state.
4E’ or 5E’ …

Basic research evaluation in CASBasic research evaluation in CASBasic research evaluation in CASBasic research evaluation in CAS
Clients:
•CAS
•REC (PO)
Problem Owner (PO)
•institutes

A state-owned system to improve the originality, significance, reputation and sustainability of CAS basic research in the natural sciences by developing the research capabilities and infrastructure, and by improving resources utilisation of CAS in order to benefit Chinese social and economic development and to enrich human knowledge.
C: World scientific community A: CAS headquarters and institutesT: Improvement in significance, reputation and sustainabilityW: Goal of CAS is improvement in research outcomesO: Chinese state councilE: Economic and cultural constraints, current research infrastructure(R): Institutes, scientists, money, equipment
Basic research in CASBasic research in CAS— — CAS as a CAS as a wholewholeBasic research in CASBasic research in CAS— — CAS as a CAS as a wholewhole

A CAS-owned system to enrich the world’s knowledge in a particular scientific domain with original and significant research by identifying potential areas of discovery, developing the capabilities to undertake appropriate research, carrying out the research and disseminating it through prestigious channels in order to enhance the reputation, significance and sustainability of CAS and the Institute.
C: World scientific community in discipline, CAS (reputation)A: Institute personnelT: Generating significant new knowledgeW: Role of an Institute within CAS is to generate significant new knowledgeO: CASE: CAS procedures, funding(R): Scientists, other staff, funding, equipment
Basic research in CASBasic research in CAS——Generic Generic InstituteInstitute Basic research in CASBasic research in CAS——Generic Generic InstituteInstitute

Monitor
ControlCriteria forEfficacyEfficiency
Monitor
Control
Criteria forEffectiveness
OperationalControl
Strategic Control
1. Identify potentially significant areas of discovery
2. Appreciate current resources, capabilities and projects
3. Decide which opportunities to pursue
4. Obtain necessary resources
5. Conduct research
6. Disseminate results through prestigious channels
7. Contribute to the reputation,
resources and sustainability
Generic InstituteGeneric Institute Conceptual Model
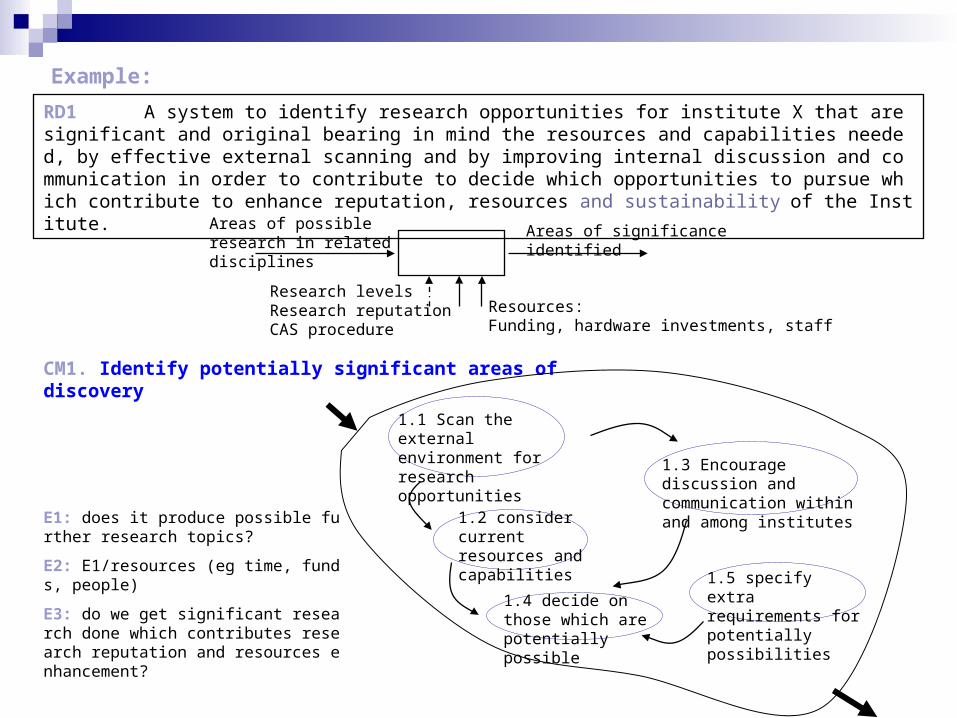
Example:
Areas of possible research in related disciplines
Areas of significance identified
RD1 A system to identify research opportunities for institute X that are significant and original bearing in mind the resources and capabilities needed, by effective external scanning and by improving internal discussion and communication in order to contribute to decide which opportunities to pursue which contribute to enhance reputation, resources and sustainability of the Institute.
Resources: Funding, hardware investments, staff
Research levelsResearch reputationCAS procedure
1.1 Scan the external environment for research opportunities
1.2 consider current resources and capabilities
1.3 Encourage discussion and communication within and among institutes
1.4 decide on those which are potentially possible
1.5 specify extra requirements for potentially possibilities
E1: does it produce possible further research topics?
E2: E1/resources (eg time, funds, people)
E3: do we get significant research done which contributes research reputation and resources enhancement?
CM1. Identify potentially significant areas of discovery

CM4 necessary resources obtaining system
4.1 Know possible research can be conducted
4.2 Appreciate to extra resources that will be needed•Human resources•Equipment•Competence•funds
4.3 Decide how that can be obtained by
4.5 Make appreciated application and proposal
4.6 Check that necessary resources are obtained
4.4 Provide institutional support
4.3.1 Human resources: 4.3.2 Equipment: by applying from headquarter based on current research capability and further development4.3.3 Funding: by applying for external research projects, or internal projects 4.3.4 Others: by applying for extra investment to improve research infrastructure, such as building, decoration

Primary extracted efficacy indicatorsPrimary extracted efficacy indicators Primary extracted efficacy indicatorsPrimary extracted efficacy indicators

3E indicators Comparisons
Indicators 3Es CSY CSSTY CSTY CASCCI WUSRCI CUE FUCY WCY MSTI GCI SEI NST KSI
Biblo-Metri
cs
SCI, SSCI papers E1 + + + + + * + +
SCI, SSCI cooperation papers E1 + + + +
SCI, SSCI total citations E3 + + + + +
SCI, SSCI cited times per papers E2 + + +
Top 0.1% papers E3 * * +
Top 1% papers E3 * +
Top10% papers E3 * +
Top papers based on megic-science infrastructure
E3
SCI, SSCI paper per staff E2 * * *
Top 0.1%-10% paper per staff E2 * *
Percentage of cooperation papers E2 *
Percentage of Top papers E2 *
SCI, SSCI papers/funding E2 *
patents
Number of patents application E1 * * * * + *
Number of patents awards E1 * * + + * + * * *
Core patens awards E3
Commercialized patens E3 * * * +
Award Patents per staff E2 * * * +
Financial
measure
Research expenditure E1 + + + + + + + +
Research funding per staff E2 + +
Competitive research funding E1 + +
Rate of capital asserts E1 + + + + *
Internal funding: external funding E2 * * *
Vendibility of owned company E1 *
Profit of owned company E2
impact
Awards E3 * * + * * *
Invited talks E3
Excellent scientists E3 * + * *
Awards per staff E2 *
Invited talks per staff E2
Rate of excellent scientist E2 *
others
Megic-science infrastructure E1
Exchange graduates E1 +
Joint-lab E1 +
Joint projects E1 + +
Graduate enrollment E1 + + + * *
High quality graduates E3 + *

E1 : Output (1/3) 1.1 SCI total (1/2) 1.2 Hi-publication Top0.1% Pub (1/6) Top1% Pub (1/6) Top10% Pub (1/6)
E2 : Efficiency (1/3)
2.1 SCI/head (1/2) 2.2 Hi-pub/head (1/2)
E3: Effectiveness (1/3)
3.1 Citation Total (1/6) Average (1/6)3.2 Position Post in Inter-Oragn ( 1/6 ) Editorship TOP1% editor (1/18) TOP5% editor (1/18) TOP10% editor (1/18)3.3 Award cross subject (1/6) subject +.. (1/6)
E3 Plan 1 :

E1 : Output (1/3)
1.1 SCI Total (1/2) 1.2 Hi-publication Top0.1% Pub (1/6) Top1% Pub (1/6) Top10% Pub (1/6)
E2 : Efficieny(1/3)
2.1 SCI/head (1/2) 2.2 Hi-pub/head (1/2)
E3 : (1/3) 3.1 Citation Total (1/6) Average (1/6)3.2 Editorship TOP1% editor (1/9) TOP5% editor (1/9) TOP10% editor (1/9)3.3 honor Awards – cross (1/12) subject+subject (1/12) Post in Inter Organ ( 1/6 )
E3 Plan 2

Random Sensitivity Analysis E3(Max)
Change (5%)
Change (10%)
NO. 机构名称 Plan1 Plan 2 Plan 1 Plan 2 Plan 1 Plan 2
Average Change 0.0978
0.0477
0.1363
0.0666
1 美国农业部 0.877238
0.8772
0 0 0 0
2 法国农业科学研究院 0.192529
0.2536
0.0257
0.0097
0.0247
0.0093
3 西班牙科学研究委员会 0.150366
0.1796
0.0317
0.0132
0.0324
0.0135
4 加拿大农业及农业食 0.110103
0.1493
0.0302
0.0111
0.0247
0.0091
5 日本农林水产省 0.050875
0.0518
0.0490
0.0240
0.0829
0.0407
6澳大利亚联邦科学与工
业研究组织0.11267
40.151
20.055
40.020
60.059
00.022
0
7 中国科学院 0.116528
0.1735
0.0235
0.0078
0.0482
0.0161
8 印度农业研究理事会 0.021313
0.0213
0.1763
0.0881
0.4217
0.2108
10 英国研究理事会 0.111147
0.1403
0.0426
0.0168
0.0572
0.0226
11 印度科学与工业研究理 0.051480.055
00.130
00.060
70.144
80.067
6

Weights and Aggregation Weights and Aggregation
Each of the subjects has the same importance
Using weighted average at all levels inside a subject. All the indicators at the same level have the same weights
Thus those with a fuller arrange of research subjects and good quality research will perform better
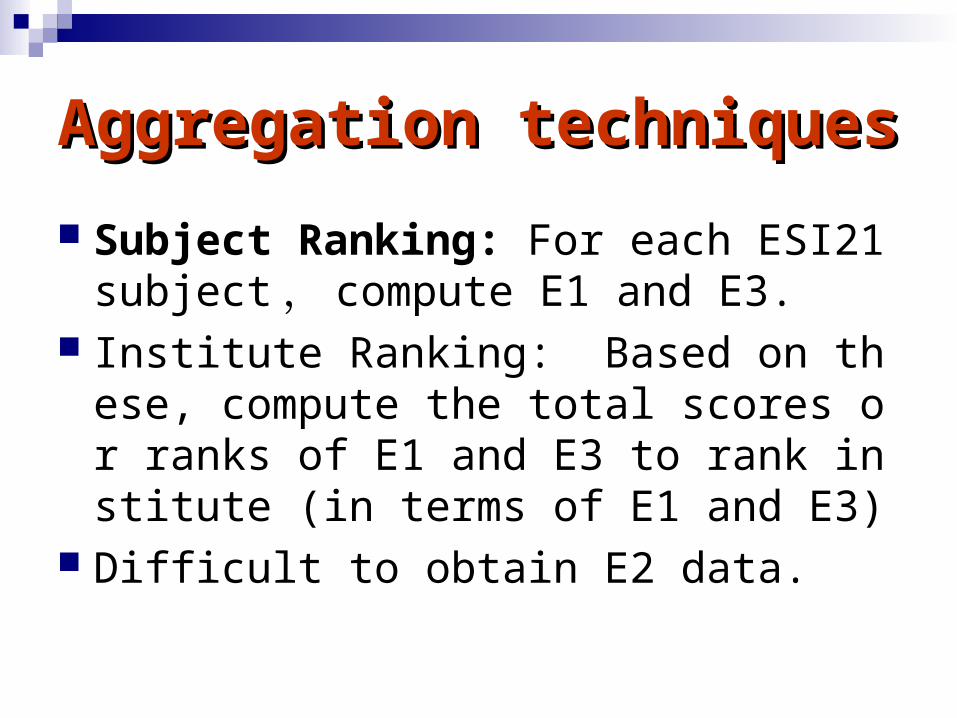
Aggregation techniquesAggregation techniques
Subject Ranking: For each ESI21 subject ,compute E1 and E3.
Institute Ranking: Based on these, compute the total scores or ranks of E1 and E3 to rank institute (in terms of E1 and E3)
Difficult to obtain E2 data.
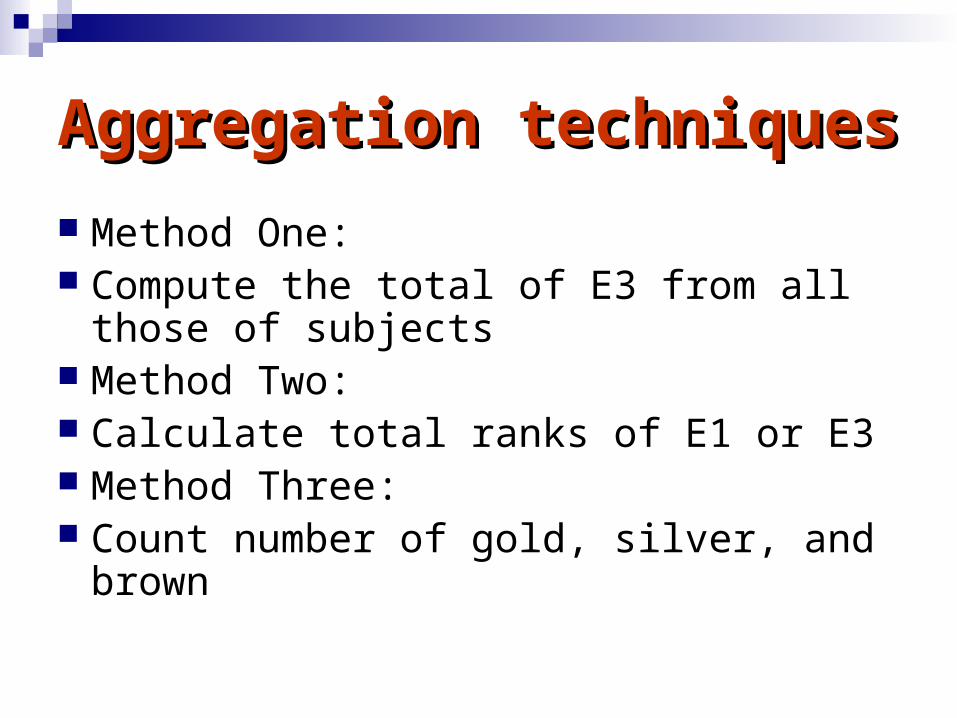
Aggregation techniquesAggregation techniques
Method One: Compute the total of E3 from all those of
subjects Method Two: Calculate total ranks of E1 or E3 Method Three: Count number of gold, silver, and brown

Aggregation techniquesAggregation techniques Based on each discipline, Normalization E1-E3 based on average value Each discipline are equally important Methods:
Rank-added method
Score-added method
13
1
( ), , , 1,...,54 k k kj j j j
k
R Rank E then R R j
13
1
, 1,...,54kj j
k
R E j
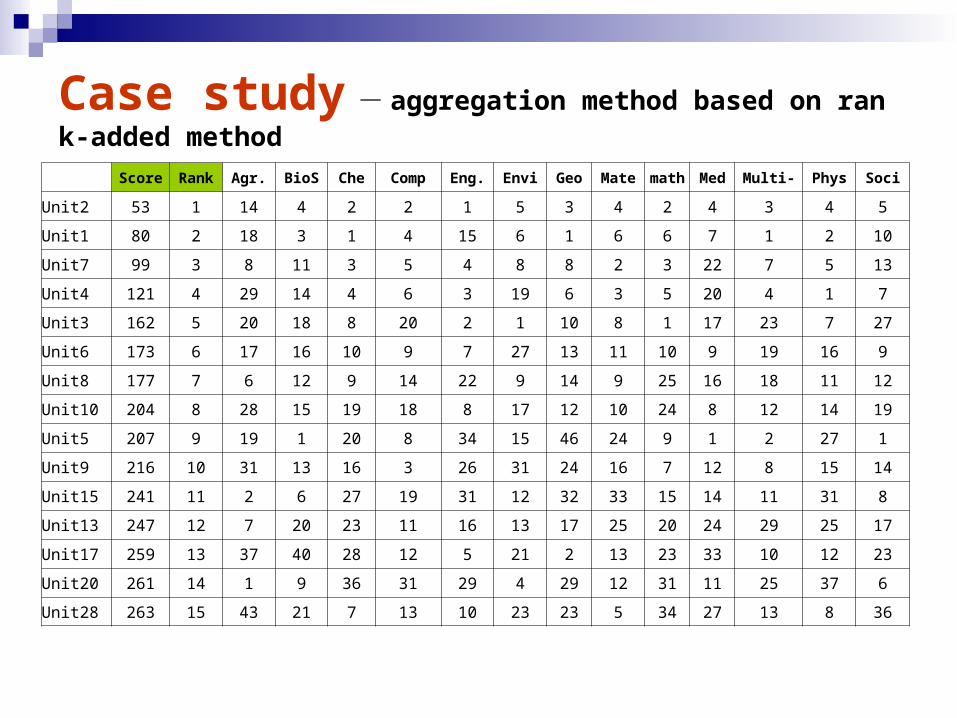
Case study - aggregation method based on rank-added method
Score Rank Agr. BioS Che Comp Eng. Envi Geo Mate math Med Multi- Phys Soci
Unit2 53 1 14 4 2 2 1 5 3 4 2 4 3 4 5
Unit1 80 2 18 3 1 4 15 6 1 6 6 7 1 2 10
Unit7 99 3 8 11 3 5 4 8 8 2 3 22 7 5 13
Unit4 121 4 29 14 4 6 3 19 6 3 5 20 4 1 7
Unit3 162 5 20 18 8 20 2 1 10 8 1 17 23 7 27
Unit6 173 6 17 16 10 9 7 27 13 11 10 9 19 16 9
Unit8 177 7 6 12 9 14 22 9 14 9 25 16 18 11 12
Unit10 204 8 28 15 19 18 8 17 12 10 24 8 12 14 19
Unit5 207 9 19 1 20 8 34 15 46 24 9 1 2 27 1
Unit9 216 10 31 13 16 3 26 31 24 16 7 12 8 15 14
Unit15 241 11 2 6 27 19 31 12 32 33 15 14 11 31 8
Unit13 247 12 7 20 23 11 16 13 17 25 20 24 29 25 17
Unit17 259 13 37 40 28 12 5 21 2 13 23 33 10 12 23
Unit20 261 14 1 9 36 31 29 4 29 12 31 11 25 37 6
Unit28 263 15 43 21 7 13 10 23 23 5 34 27 13 8 36

Case study - aggregation method based on score-added method
Score Rank Agr. BioS Che Comp Eng. Envi Geo Mate math Med Multi- Phys Soci
Unit2 52.1937 1 0.81 3.52 4.65 4.12 5.40 2.69 4.20 4.48 9.45 2.69 4.32 4.17 1.67
Unit1 45.4129 2 0.48 3.56 7.90 3.18 1.50 2.64 5.89 2.92 2.15 1.90 6.25 6.09 0.97
Unit5 41.5793 3 0.39 5.49 0.68 1.73 0.24 1.42 0.05 0.36 1.38 13.74 5.77 0.08 10.26
Unit7 37.7177 4 1.68 1.19 4.15 2.66 3.81 1.89 2.03 5.25 7.58 0.42 2.36 4.00 0.72
Unit4 35.0232 5 0.22 1.01 4.09 2.62 4.56 1.16 2.92 4.54 2.37 0.48 3.08 6.78 1.18
Unit3 33.4436 6 0.39 0.93 1.77 0.60 4.97 6.31 1.63 1.82 11.05 0.58 0.42 2.74 0.25
Unit20 18.657 7 8.78 1.83 0.12 0.26 0.34 2.80 0.24 1.30 0.09 1.13 0.41 0.04 1.32
Unit18 16.965 8 0.11 3.96 0.77 0.90 2.01 0.15 0.27 0.69 0.15 2.50 3.04 2.40 0.02
Unit11 16.9447 9 0.32 2.29 0.66 1.86 0.14 0.13 0.04 0.24 0.84 4.97 2.62 0.08 2.78
Unit8 15.926 10 2.87 1.13 1.55 0.99 0.72 1.88 1.15 1.44 0.28 0.72 0.68 1.78 0.74
Unit54 15.8998 11 0.00 0.12 0.04 9.68 1.55 0.05 0.02 0.00 4.16 0.04 0.01 0.07 0.15
Unit6 15.5748 12 0.49 0.99 1.54 1.68 2.11 0.47 1.25 1.33 1.29 1.34 0.66 1.38 1.03
Unit15 15.2697 13 5.18 2.78 0.32 0.73 0.32 1.56 0.20 0.09 0.89 0.84 1.24 0.06 1.06
Unit17 14.6666 14 0.13 0.14 0.25 1.08 2.40 1.05 4.58 1.26 0.40 0.14 1.24 1.68 0.31
MAX 8.78 5.49 7.90 9.68 5.40 6.31 5.89 5.25 11.05 13.74 6.25 6.78 10.26

Case Case studystudy 1.中国科学院
11%
27%
2%6%
3%9%
10%
2%
2%
1%
24%
0%
2%
0%
1%
1.生物2.化学3.计算机4.工程5.环境6.地学7.材料8.数学9.医学10.神经11.物理12.社科13.多学科14.免疫15.农业
2.亥姆霍兹研究联合会
15%
9%
1%
10%
4%
10%5%0%
18%
2%
24%
0%
1%
1%
0%
1.生物2.化学3.计算机4.工程5.环境6.地学7.材料8.数学9.医学10.神经11.物理12.社科13.多学科14.免疫15.农业
41.法国国家科研中心
19%
20%
3%
7%2%8%
6%
4%
7%
3%
19%
0%
1%
1%
0%
1.生物2.化学3.计算机4.工程5.环境6.地学7.材料8.数学9.医学10.神经11.物理12.社科13.多学科14.免疫15.农业
马普学会
20%
15%
2%
4%2%
14%
5%1%
6%
5%
22%
0%
3%
1%
0%
1.生物2.化学3.计算机4.工程5.环境6.地学7.材料8.数学9.医学10.神经11.物理12.社科13.多学科14.免疫15.农业
45.意大利国立研究委员会
18%
18%
4%
7%2%10%
5%
1%
13%
4%
15%
0%
1%
1%
1%
1.生物2.化学3.计算机4.工程5.环境6.地学7.材料8.数学9.医学10.神经11.物理12.社科13.多学科14.免疫15.农业
Unit 1Unit 2
Unit 7 Unit 10
Unit 6

Limitations
Some institutes’ main outputs are not publications
Some institutes concentrated on a few subjects so have lower total
Although indicators are developed from SSM, but not available
In applied research, many data are not easy to obtain