
Paper 3 Geographical Applications
83
Paper 3 – Geographical Applications Slides 2 – 14: Information on Paper 3 and example questions. Slides 15 – 28: Information on fieldwork section. Slides 29 – 59: Formby Fieldwork (Physical Fieldwork with some human interaction). Slides 60 - 83: St Helens Fieldwork (Human Fieldwork).
Transcript of Paper 3 Geographical Applications

Paper 3 – Geographical Applications
Slides 2 – 14: Information on Paper 3 and example questions.
Slides 15 – 28: Information on fieldwork section.
Slides 29 – 59: Formby Fieldwork (Physical Fieldwork with some human interaction).
Slides 60 - 83: St Helens Fieldwork (Human Fieldwork).

• You have 1 hour and 15 minutes for this paper.
• There are two sections in this paper.
• Section A – Issue Evaluation.
• Section B – Fieldwork.
• You must answer EVERY question.

Section A – Issue Evaluation• There are 37 marks in this section.
• All of the questions will relate to the booklet you have been studying in class. If aquestion asks you use the booklet you must include something to do with it in youranswer.
• You could get questions on the following;
• Skills (latitude and longitude, grid references…)
• Map reading
• Graph reading
• In some questions you will have to link your answers to what you have learnt inlesson throughout years 9, 10 and 11. When it wants you to do this it will saysomething like “…use figure 4 and your own understanding…”

• The following slides will show you some example questions andanswers.
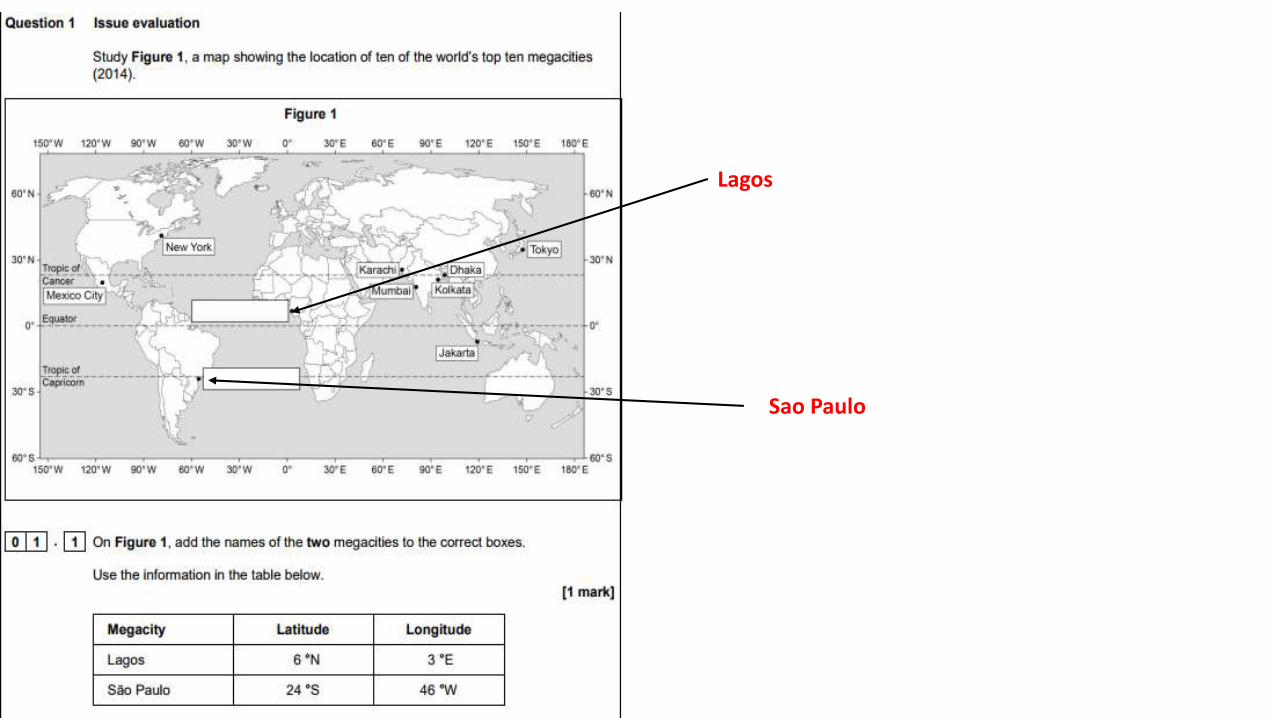
Lagos
Sao Paulo
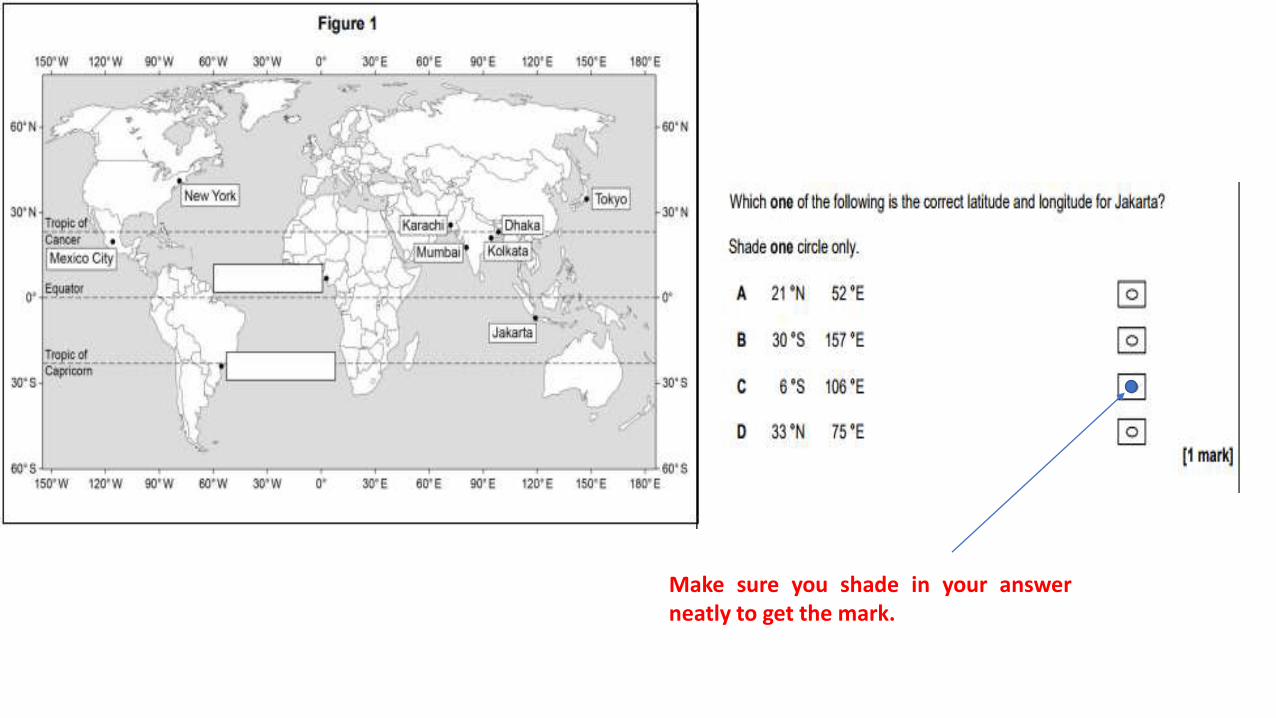
Make sure you shade in your answerneatly to get the mark.

LIC – Low Income CountryNEE – Newly Emerging Economy
This means you need to include some information from Figure 2 in the booklet.
Points to include in your answer:
Push and Pull Factors.
People who live in the countryside can earn more money in urban areas so they move to live there.
There are more job opportunities in the city than in the countryside, so people migrate to live in the city.
There are more hospitals and sanitation in the urban areas, this encourages people to live there.
It is difficult to farm in the countryside, crops might have been destroyed by drought (a lack of water).

Always check the key when looking at graphs!
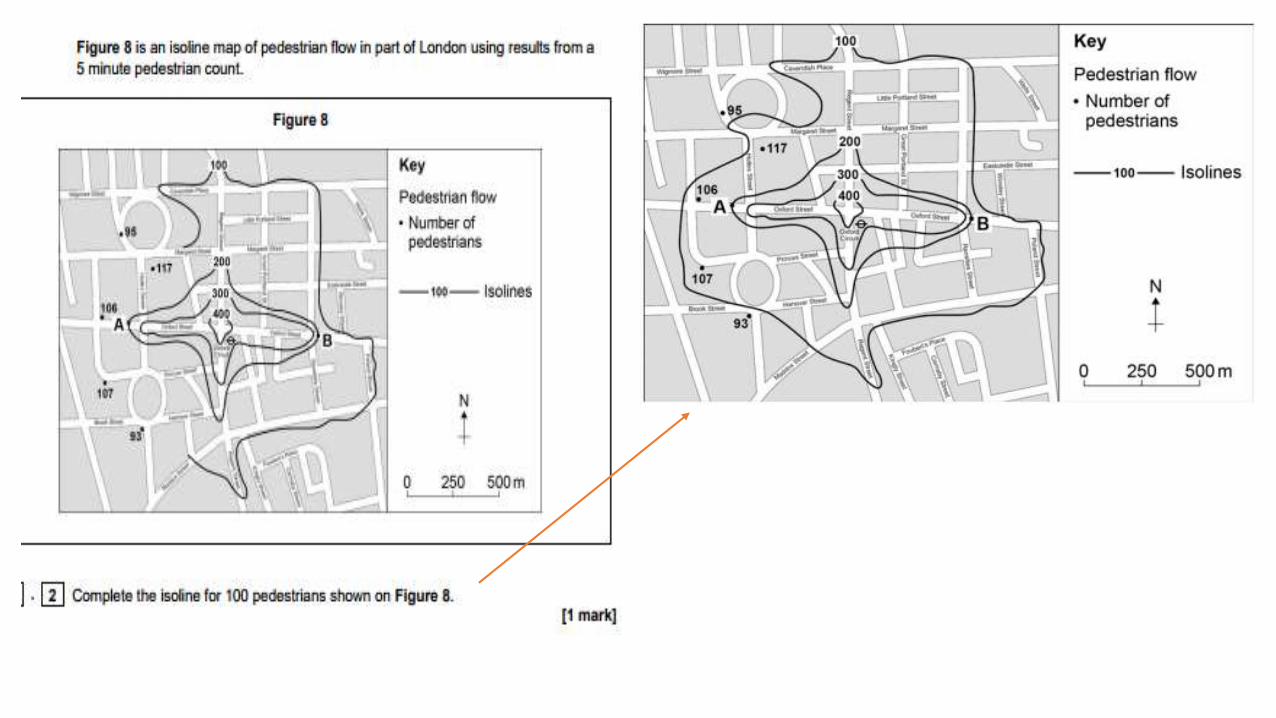
You needed to fill in the empty space with the lines as it shows you on the key using a ruler and pencil

Make sure you shade in your answer neatly to get the mark.

This means you need to include some information from Figure 4 in the booklet.
This means you need to include some knowledge you learnt in lesson.
In lesson you learnt about Nigeria:
Nigeria has about 5000 registered industrial plants and 10,000illegal small-scale industries. The fast and unregulated growth ofindustry has led to environmental problems.
• Industrial Growth• In Kano, Kaduna and Lagos, many harmful pollutants go directly into
open drains.• Industrial chimneys emit poisonous gases than cause breathing
problems in humans.• 70 – 80% of Nigeria's forests have been destroyed.
• Urban Growth• Squatter settlement are common in most cities.• Waste disposal is a problem as is traffic congestion.
• Mining and Oil Extraction• Tin mining led to soil erosion, local water supplies have also been
polluted with toxic chemicals.• Many oil spills in the Niger Delta have effected ecosystems.

You must use photograph A/B inyour answer.
Possible Answers:• River water appears to be dirty and polluted, which may
lead to the spread of disease.• Poorly constructed buildings may be at risk from collapse,
which could injure or kill people.• People living on the streets in filthy conditions may be at
greater risk of infection.

IMPORTANT INFORMATION
• In this section you will get a question worth 12 marks!
• 9 marks are for your answer.
• 3 are for spelling, punctuation and grammar.
• The question will be about reading information and making a decision.
• We do not know what the question will be on, but you can still learn the way to answer it.

You will be given different options to think about.• Best Practice for 9 markers:
• Range – analyse good/bad points, costs/benefits, positive/negative.
• Using evidence – using the data give in the booklet.
• Balance – seeing all sides in a people/environment issue and accepting that no solution is perfect for all.
• Counter argument – to be able to explain why some proposals have been rejected.
• Judgement/Decision - putting together a logical decision using the evidence.

The best way to answer the decision making question is like this…• M – make a decision
• A – advantages
• D – disadvantages
• A – alternative
• S – summary
You make a decision about which option you think is the best.
Say what advantages it has.
Say what disadvantages it has.
Suggest why one of the other options might be a good idea or why it is a bad idea.
Say again why your decision is the best!
You must use information in the booklet to help you!
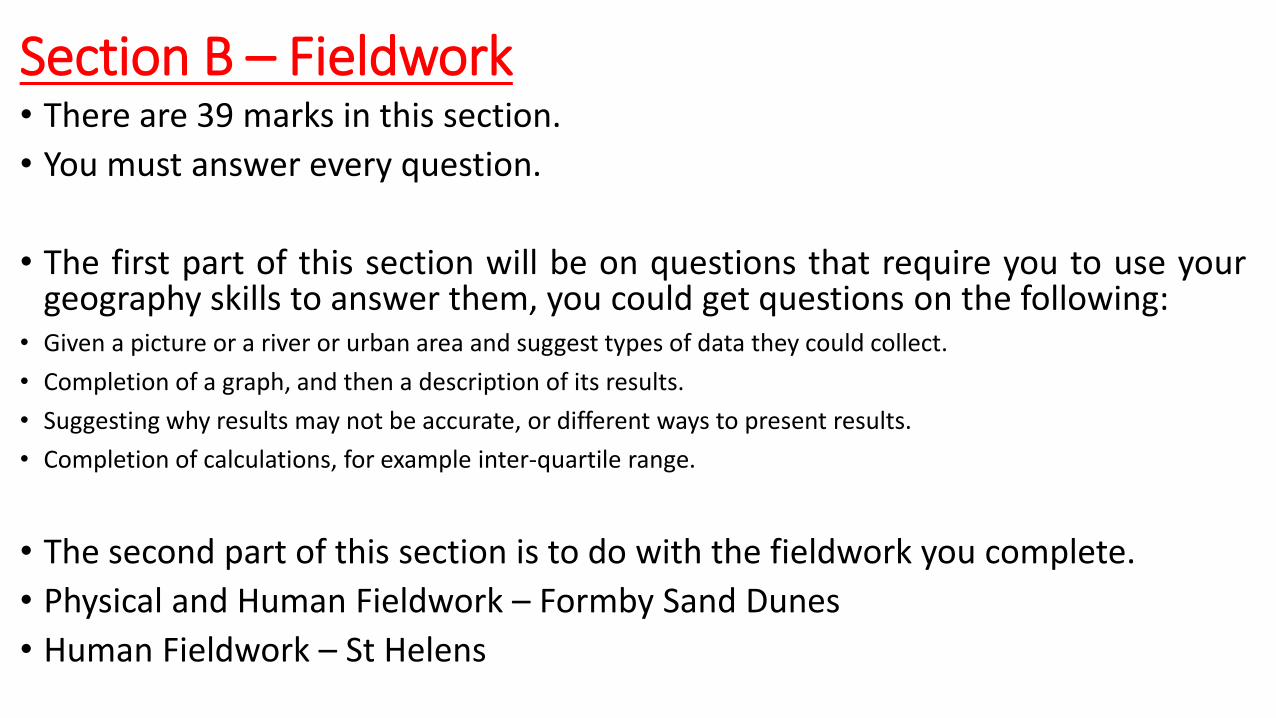
Section B – Fieldwork• There are 39 marks in this section.
• You must answer every question.
• The first part of this section will be on questions that require you to use yourgeography skills to answer them, you could get questions on the following:
• Given a picture or a river or urban area and suggest types of data they could collect.
• Completion of a graph, and then a description of its results.
• Suggesting why results may not be accurate, or different ways to present results.
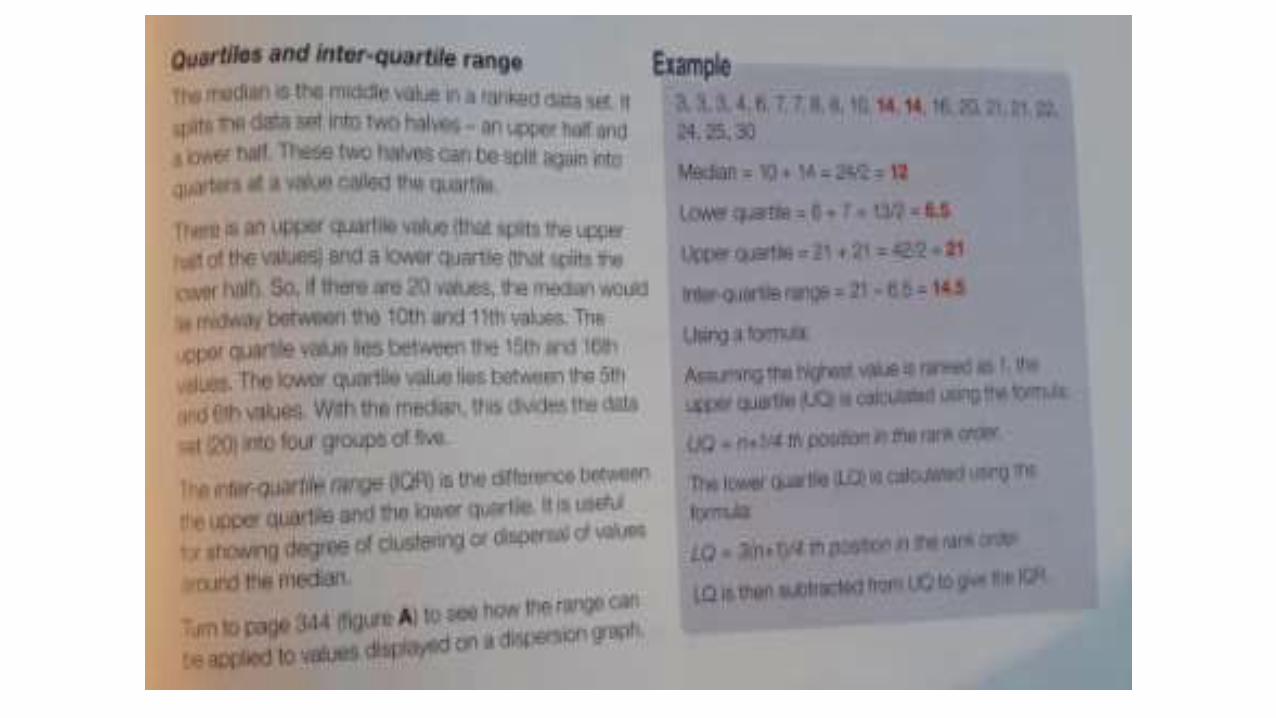
• Completion of calculations, for example inter-quartile range.
• The second part of this section is to do with the fieldwork you complete.
• Physical and Human Fieldwork – Formby Sand Dunes
• Human Fieldwork – St Helens

• The following slides will show you some example questions andanswers.

The question is asking what type of data you could collect inthe two different places.
River – techniques that address depth, width, wettedperimeter, velocity, gradient, sediment size and shape.
Urban – traffic counts, pedestrian counts, environmentalquality surveys, land use mapping, building heights,photographs, field sketches.
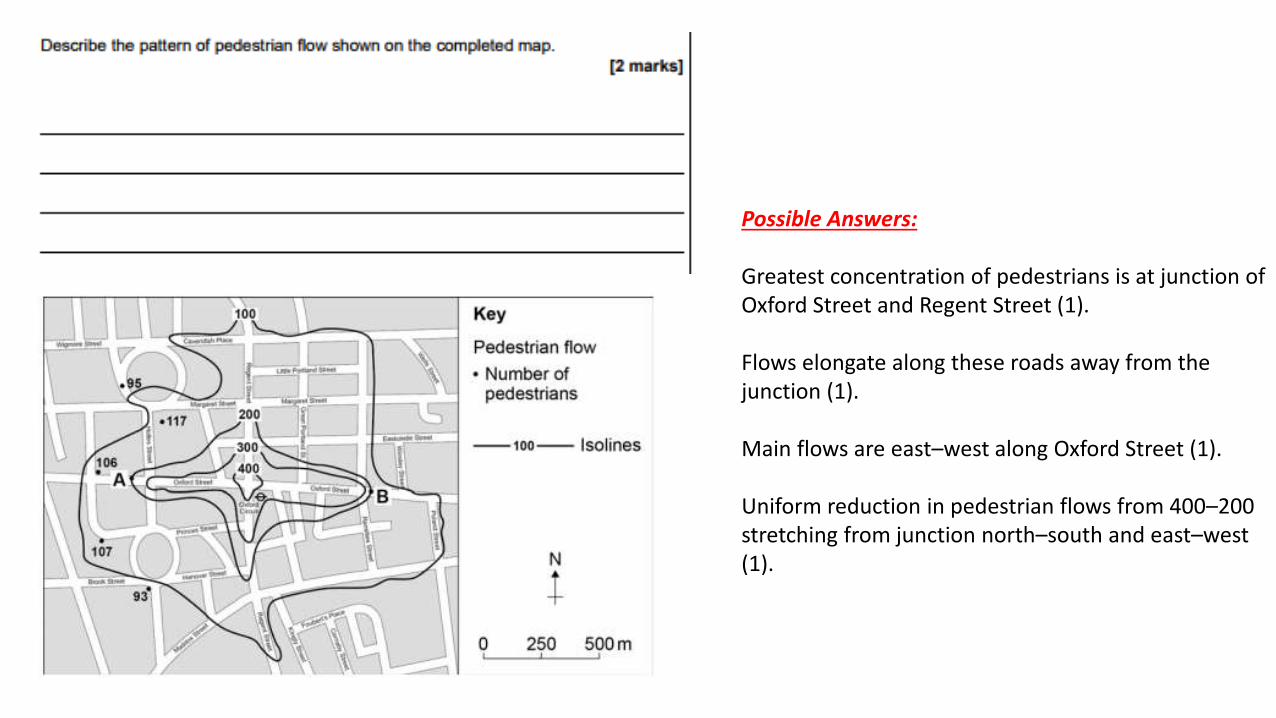
Possible Answers:
Greatest concentration of pedestrians is at junction of Oxford Street and Regent Street (1).
Flows elongate along these roads away from the junction (1).
Main flows are east–west along Oxford Street (1).
Uniform reduction in pedestrian flows from 400–200 stretching from junction north–south and east–west (1).
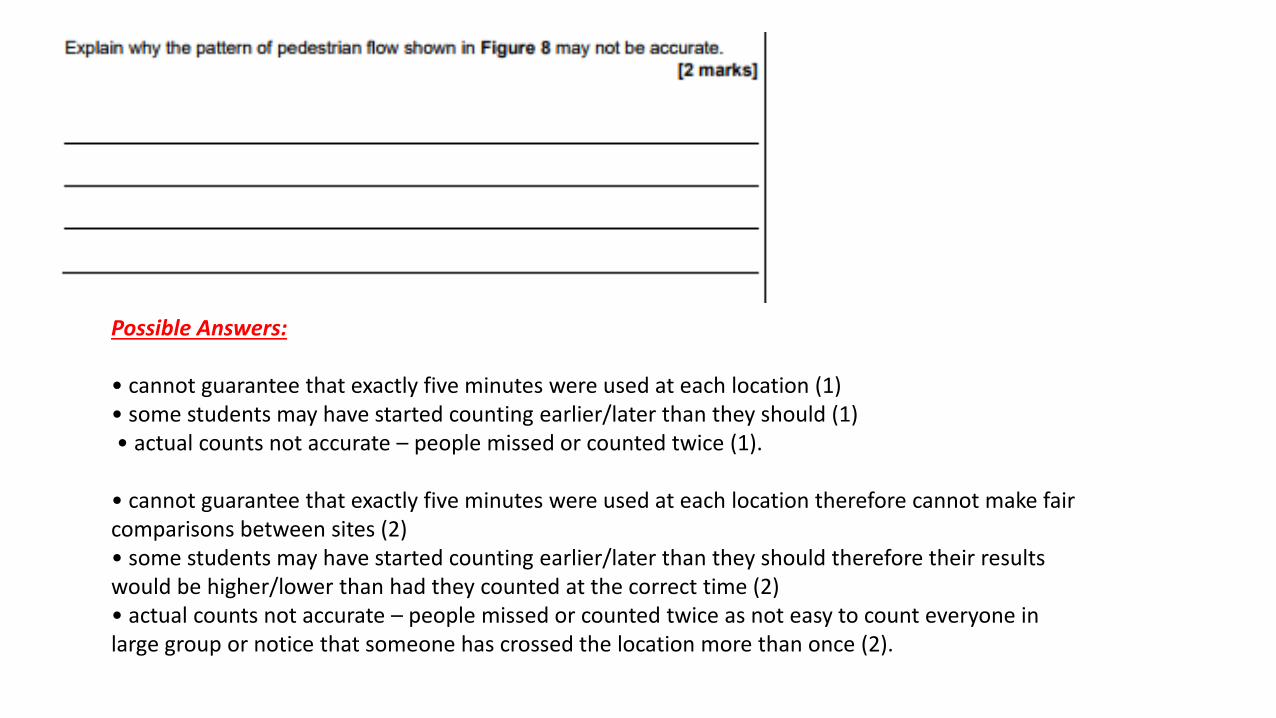
Possible Answers:
• cannot guarantee that exactly five minutes were used at each location (1) • some students may have started counting earlier/later than they should (1)• actual counts not accurate – people missed or counted twice (1).
• cannot guarantee that exactly five minutes were used at each location therefore cannot make fair comparisons between sites (2)• some students may have started counting earlier/later than they should therefore their results would be higher/lower than had they counted at the correct time (2) • actual counts not accurate – people missed or counted twice as not easy to count everyone in large group or notice that someone has crossed the location more than once (2).

You may get asked to complete a graph using datathat you have been given. Make sure you read thequestion carefully and plot the answer using apencil.
Possible Answers:
• measure more pebbles (1) • measure at different times of the year (1) • increase the number of locations (1).

You could be asked to work out the following statistical skills.• Mean (Average)
• Median
• Mode
• Range
• Quartile and Inter-Quartile Range
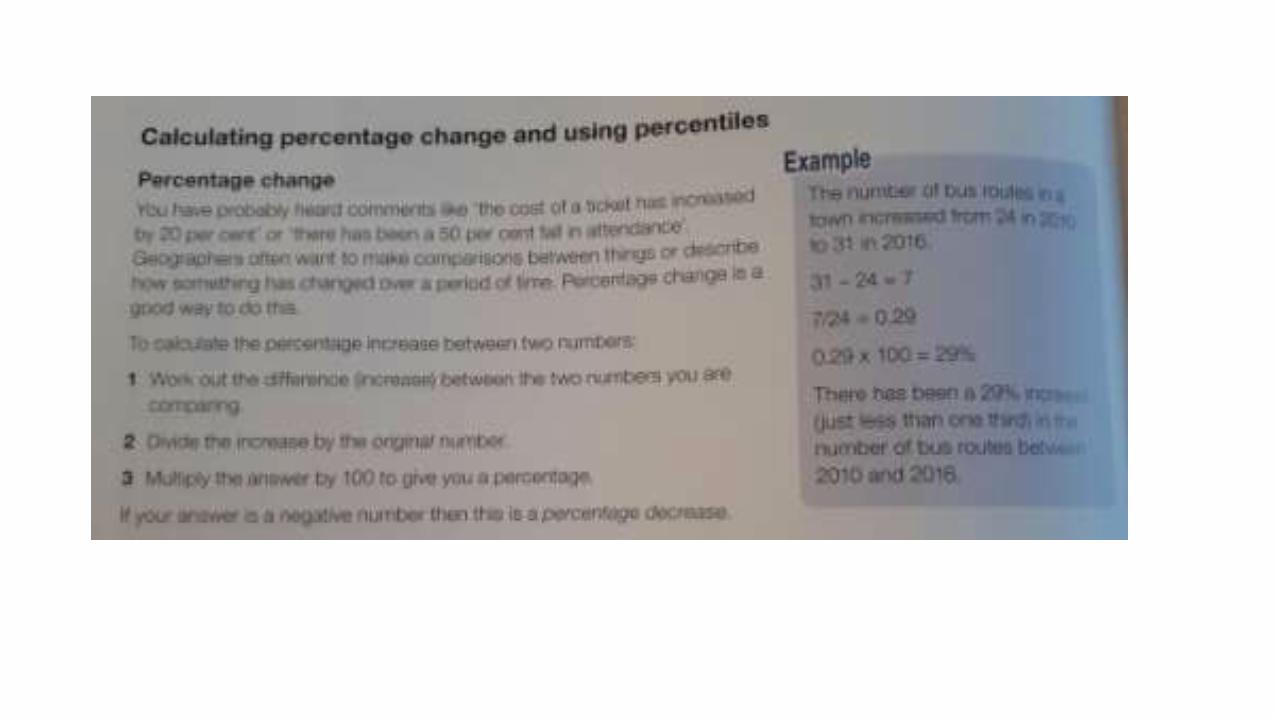
• Percentage increase/decrease.
• On the next few slides there are examples of how to do each skill!


You need to revise both of the fieldworkinvestigations you undertook in year 10 and 11.
• The following slides will have information about both fieldworks.
• This information if also in your geography books.

Physical fieldworkWith some human interaction

Physical fieldworkWith some human interaction
Title:
To investigate the effect of management strategies on the development of the sand dune ecosystems.
Fieldwork question:
Do managed sand dunes have more vegetation cover than unmanaged sand dunes?

The Geographical background underpinning the fieldwork.
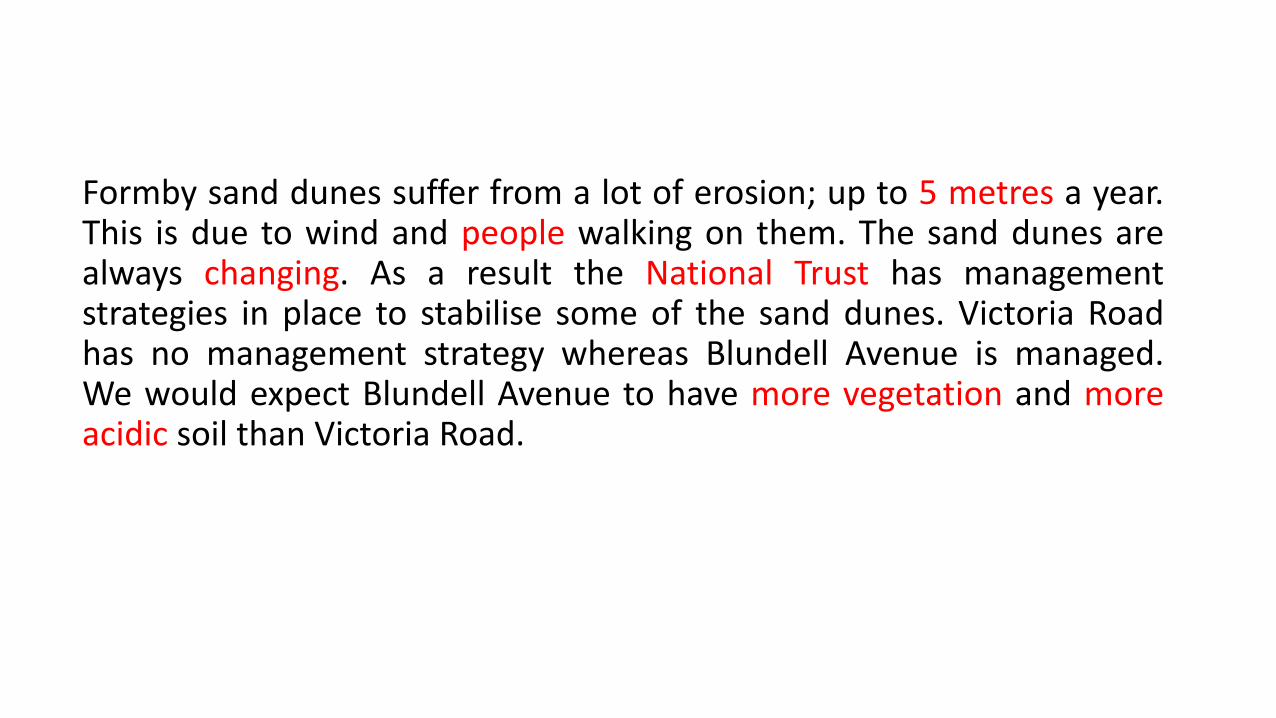
Formby sand dunes suffer from a lot of erosion; up to 5 metres a year.This is due to wind and people walking on them. The sand dunes arealways changing. As a result the National Trust has managementstrategies in place to stabilise some of the sand dunes. Victoria Roadhas no management strategy whereas Blundell Avenue is managed.We would expect Blundell Avenue to have more vegetation and moreacidic soil than Victoria Road.

Site 1
Site 2
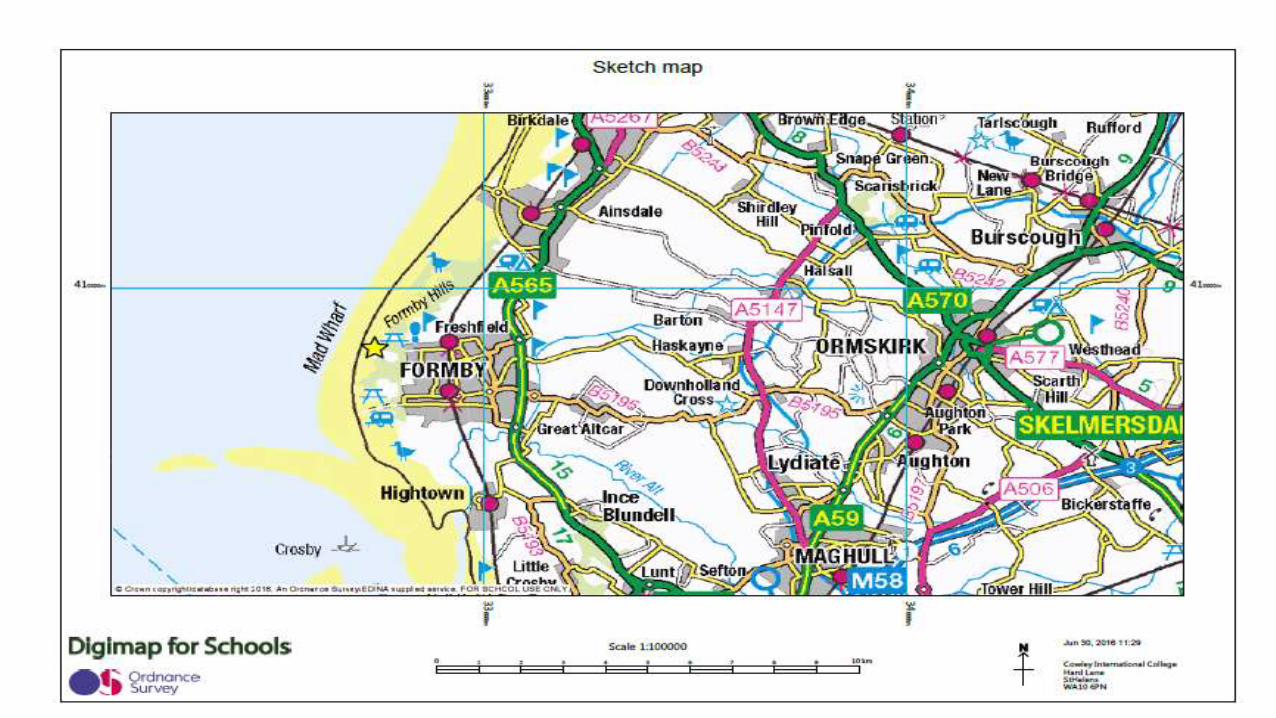
Formby Sand Dunes
Two sites:
• Victoria Road – site 1
• Blundell Avenue –site 2 Managed Site

Location of Fieldwork and why the location was chosen.
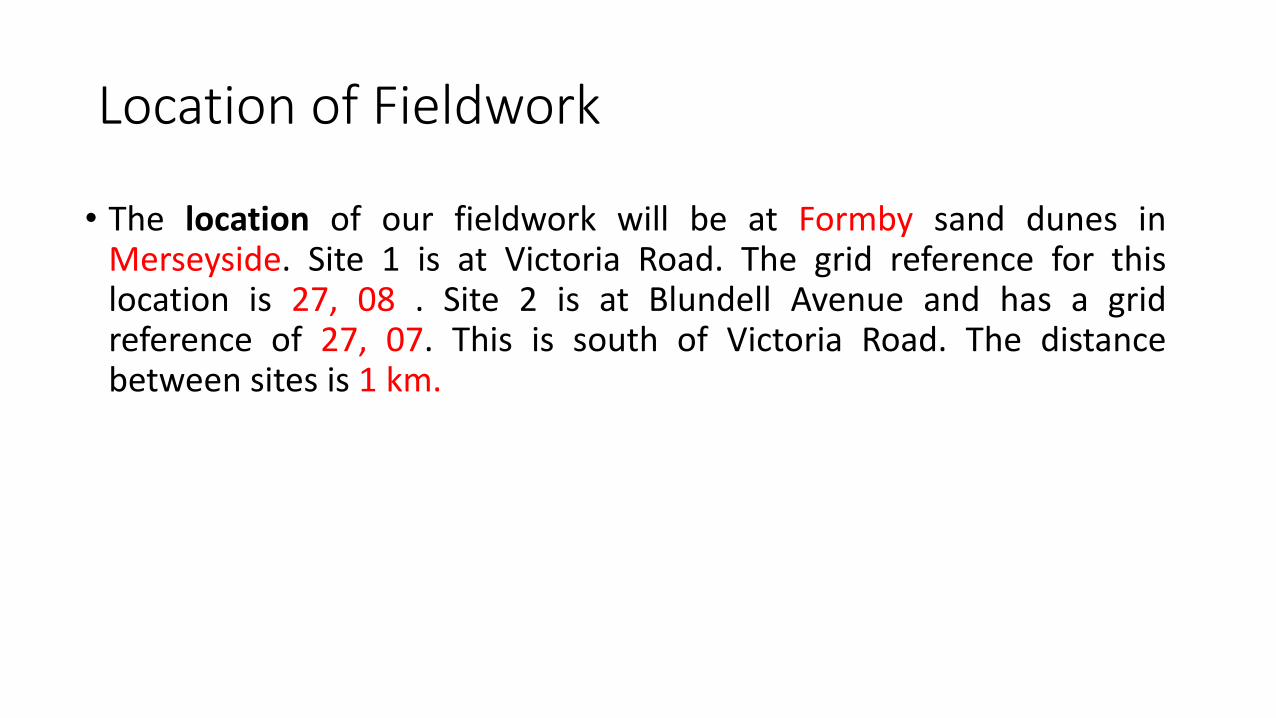
Location of Fieldwork
• The location of our fieldwork will be at Formby sand dunes inMerseyside. Site 1 is at Victoria Road. The grid reference for thislocation is 27, 08 . Site 2 is at Blundell Avenue and has a gridreference of 27, 07. This is south of Victoria Road. The distancebetween sites is 1 km.
Justification of the location
• Formby was selected for a range of different reasons;
• The site is owned by the National Trust and contains both managed andunmanaged sand dune areas. This allowed us to undertaken stratifiedsampling and compare the data of the managed and unmanaged sites.
• Formby was quite near to our school and therefore allowed us to completethe trip in less than a day and not waste time travelling to and from thesite.
• The location fitted our risk assessment that all staff and students hadcompleted. There were also trained national trust guides present at thesand dunes if required.

Method and Data Collection.

Collecting data
Primary data
Collected by you
Vegetation cover at site 1 (collecting physical geography data)
PH test at site 1 (physical geography data)
Fieldsketch at both sites
Secondary data
Collected by someone else
Vegetation cover for site 2
PH test at site 2
(physical geography data collected at a different site to look at human interaction)
Collecting data
• Qualitative data involves the collection of opinions, perspectives, thoughts and feelings. More subjective in nature.
• Quantitative data is numerical in form. More objective in nature.
Sampling
• Systematic sampling – sites chosen in regular intervals
• Random sampling – picked at random
• Stratified sampling – a site has been picked to represent something

Vegetation cover along a transect:
At Formby beach I went to site 1 at Victoria Road to collect data on the
percentage of vegetation cover to see if managed sand dunes had more
vegetation cover than unmanaged sand dunes. The Victoria Road sand dune
was chosen because it is unmanaged, this is stratified sampling. I measured
every 2 metres so that the distance I collected data was even, this was
systematic sampling. To collect the data a quadrat was placed down using
random sampling and carried out behind us to avoid bias. I then counted how
many squares had vegetation cover – there were 100 squares so this gave me a
percentage to use back in the classroom. I collected this data myself, it is
primary data.

pH value of soil:
At Formby beach I went to site 1 to collect data on the pH value of the soil to
see if managed sand dunes had more acidic soil than unmanaged sand dunes.
I measured every 2 metres so that the distance I collected data was even, this
was systematic sampling. To collect the data a quadrat was placed down using
random sampling and carried out behind us to avoid bias. I placed the pH
metre into the soil and left it there for 4 minutes. The pH value was then
checked. I collected this data myself, it is called primary data.
Field-sketch:
A field-sketch was drawn at both site 1 and site 2. To allow an accurate field-sketch
representation of the area we concentrated on one part of the view and drew it
accurately by drawing the main features first and then adding detail in later on.
After the main sketch was completed annotated labels were added to our
drawings. Two sketches were made to allow a comparison of the sites, this is
stratified sampling. Field sketches are qualitative data
• The secondary data I am using is the pH and % vegetation cover of the managed site, Blundell Avenue (Site 2). This was collected before our visit to the sand dunes.
• Qualitative data involves the collection of opinions, perspectives,thoughts and feelings. The qualitative data I collected was the fieldsketches at both of the different sites (Victoria Road and BlundellRoad)
• Quantitative data is numerical in form. The quantitative data Icollected was the pH value and % vegetation cover at site 1 VictoriaRoad.

Data Presentation

• All of your graphs and field-sketches are in your books.
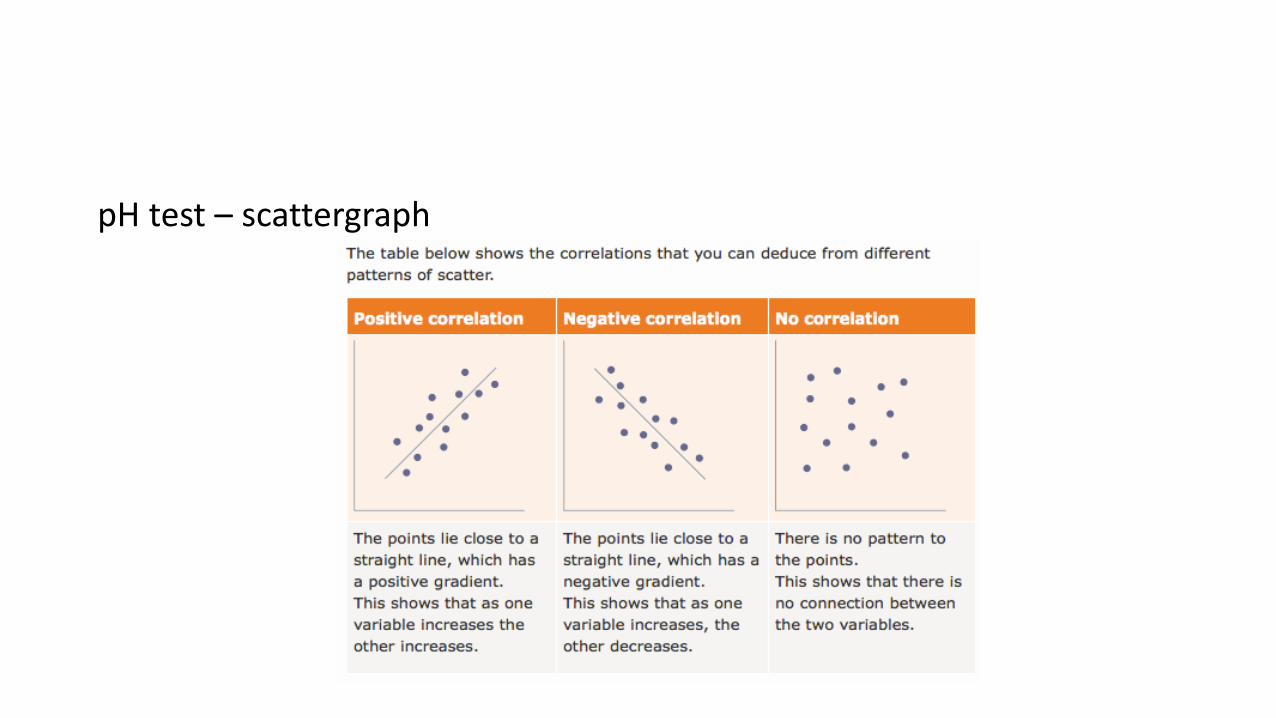
• pH test – scattergraph
• % vegetation cover – kite diagram
• You need to be able to suggest why we used these types of graphs.
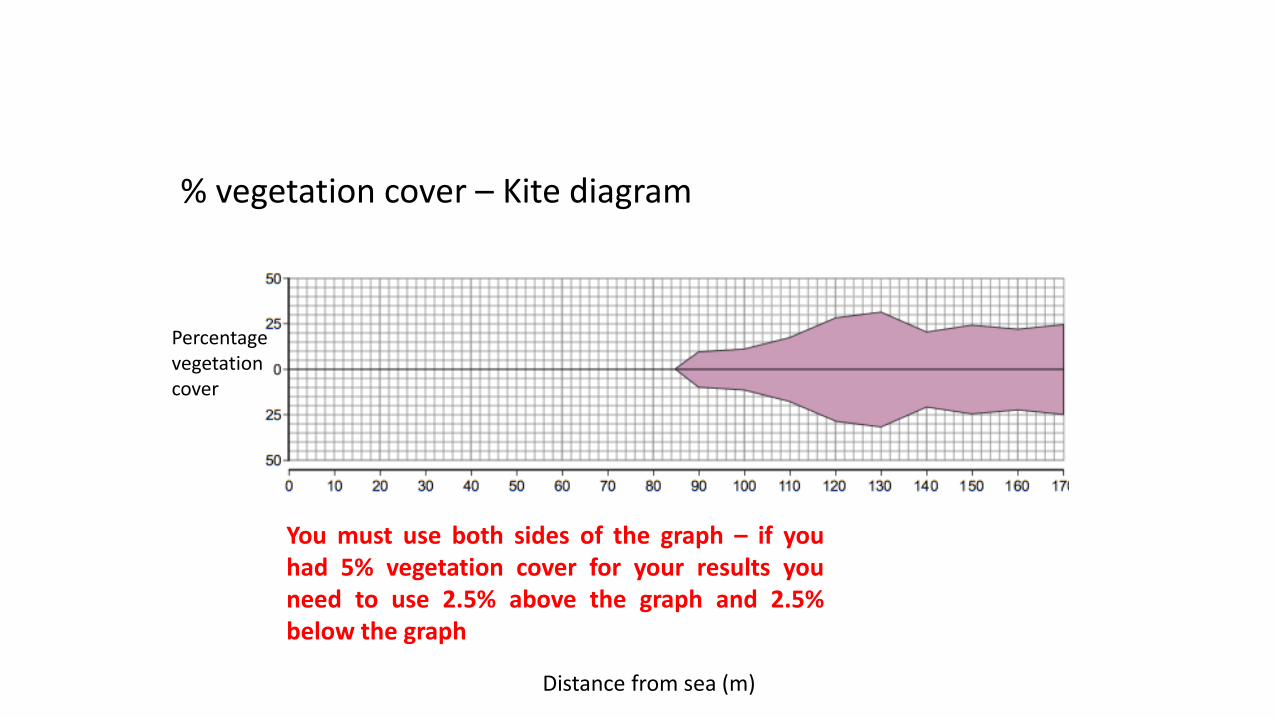
% vegetation cover – Kite diagram
Distance from sea (m)
Percentage vegetation cover
You must use both sides of the graph – if youhad 5% vegetation cover for your results youneed to use 2.5% above the graph and 2.5%below the graph

Data presentation - fieldsketch


• Kite Diagram:
• Advantages –
• Useful for displaying changes over distance
• Visually clear and easy to interpret one category from another
• Comparisons can be easily made
• Disadvantages –
• Visually subjective as the scale influences visual effect
• Only works with a specific range of data
• Time-consuming to construct by hand
• Scatter Graph:
• Advantages –
• It can help identify trends in the data by a positive correlation, negative correlation, or no correlation.
• Scatter plots show the minimum, maximum, and outlier(s) of the data set.
• Disadvantages –
• Although a scatter plot can help you seerelationships in the data, it is sometimes difficultto tell if the correlation is positive, negative, or ifthere isn’t one.
• Field Sketch:
• Advantages –
• Quick and easy to complete, can by very helpful if completed with annotations.
• Disadvantages –
• Only showing one view at one point in time, might not be accurate.

Describing, analysing and explaining fieldwork data and
Evaluation

• You will have described your results in your exercise books.
• You could be asked to describe them in your exam so make sure youknow what they look like.
• Remember, if you are asked to describe them, just say what resultsyou got.

• What is the link between the pH value and vegetation cover for site 1 – Victoria Road?
• Victoria Road was the unmanaged site. The pH value is of the soil higher (more alkaline) as there is less vegetation.
• What is the link between the pH value and vegetation cover for site 2 – Blundell Avenue?
• Blundell avenue was the managed site. The pH value is lower of the soil (more acidic) where there is more vegetation.

Explaining
Give reasons for your findings:• Why does site 1 have less vegetation cover? These sand dunes are not protected from people
walking on them and this does not give the vegetation time to grow and establish itself.
• Why does site 2 have more vegetation cover? There are fences to prevent the public walking onthe sand dunes and this allows the vegetation to grow overtime. There are also old Christmastrees placed within the soil to trap vegetation and sand in place and allow it grow.
• Why is the pH value of the soil at site 1 more alkaline? The lack of vegetation cover has meant that the soil is more alkaline.
• Why is the pH value of the soil at site 2 more acidic? The increased amount of vegetation cover because of the presence of fences and Christmas trees stabilising the dunes means the soil in more acidic.

Overall conclusion
Link to your fieldwork question:
Do managed sand dunes have more vegetation cover than unmanaged sand dunes?

Evaluation
Problems of data collection methods on the day
Limitations of data Other data that would have been useful…
Extent to which your conclusions are reliable
pH metre – did all groups time 2 mins?
No vegetation type, we don’t know the different species
Vegetation type The conclusion is valid tosome extent as we would expect managed dunes to have more vegetation cover.However our data was not totally accurate and if we repeated this we would need more data.
Problems with systematicsampling – may have missed an area of vegetation
Fieldsketch only a small section, does it represent the site?
Secondary data on wind speed and wind direction
Random sampling… Primary data – people count
pH metre may not have been stuck in the ground for 4 inches
Data also collected in Marchand August – compare results

Human Fieldwork

Human fieldwork
Title:
To investigate inequalities in housing and employment between two different wards of St Helens.
Fieldwork question:
Is there a link between the quality of housing and the level of unemployment in two different wards in St Helens?

The Geographical background underpinning the fieldwork.

• Greenfield Road is in Windle Ward, in the inner city of St Helens. This ward is closer to the centre of St Helens. These houses are poorer quality as they are old terraced houses. As a result the houses are cheaper to buy and many of them are rented. Higher unemployment would be expected here.
• Kiln Lane is in Eccleston Ward, in the suburbs of St Helens. This ward is further away from the centre of St Helens. Houses here are bigger, with many detached and semi-detached with gardens and garages. These houses are more expensive to buy. Lower unemployment would be expected here.
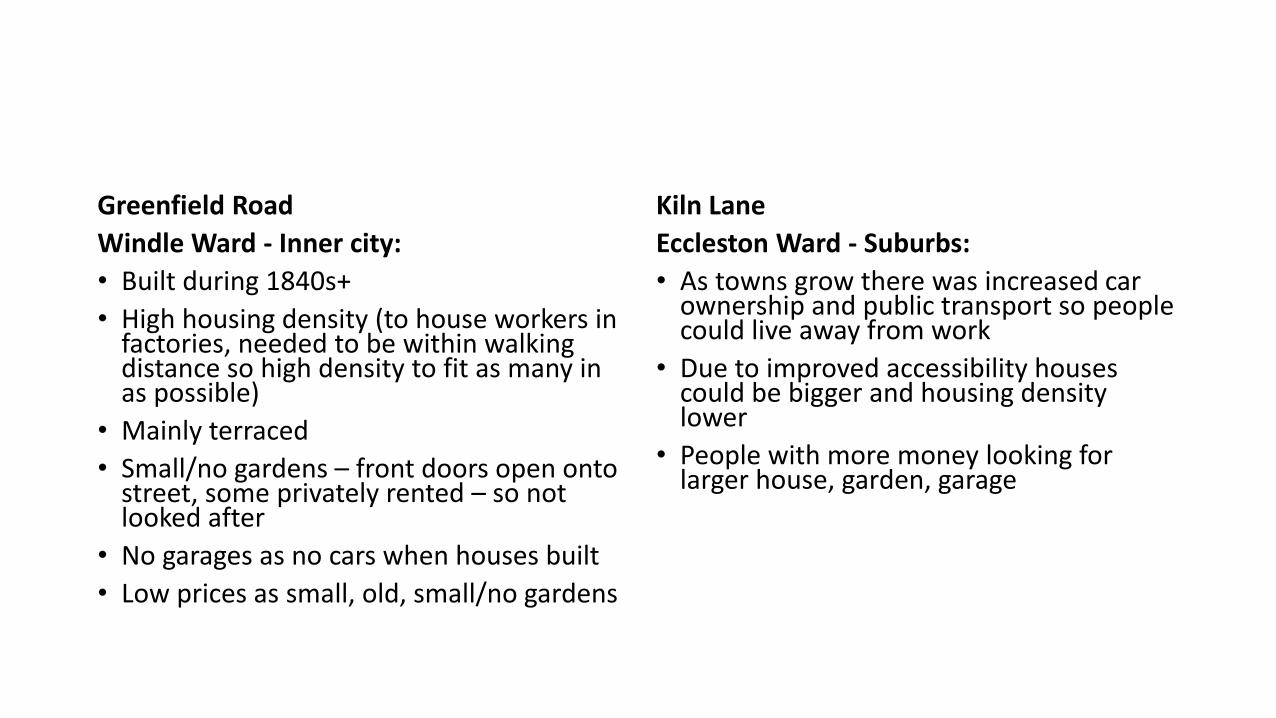
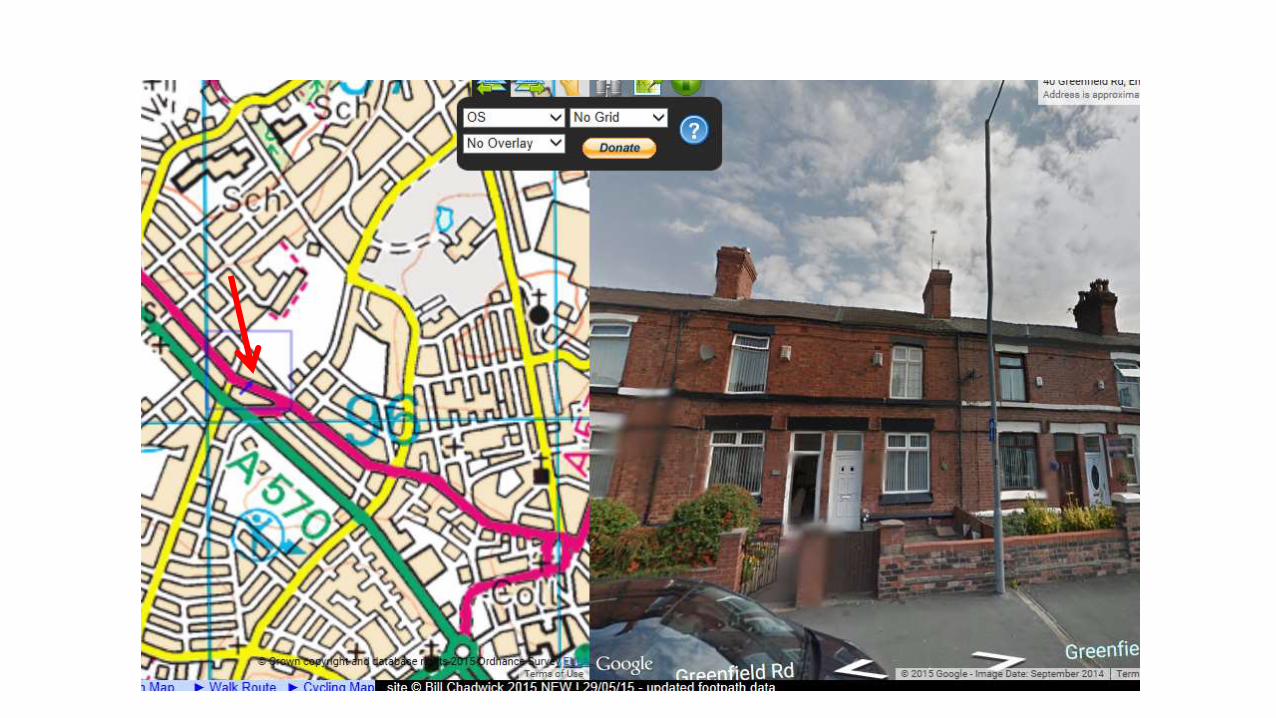
Greenfield Road
Windle Ward - Inner city:
• Built during 1840s+
• High housing density (to house workers in factories, needed to be within walking distance so high density to fit as many in as possible)
• Mainly terraced
• Small/no gardens – front doors open onto street, some privately rented – so not looked after
• No garages as no cars when houses built
• Low prices as small, old, small/no gardens
Kiln Lane
Eccleston Ward - Suburbs:
• As towns grow there was increased car ownership and public transport so people could live away from work
• Due to improved accessibility houses could be bigger and housing density lower
• People with more money looking for larger house, garden, garage

Location of Fieldwork and why the location was chosen.
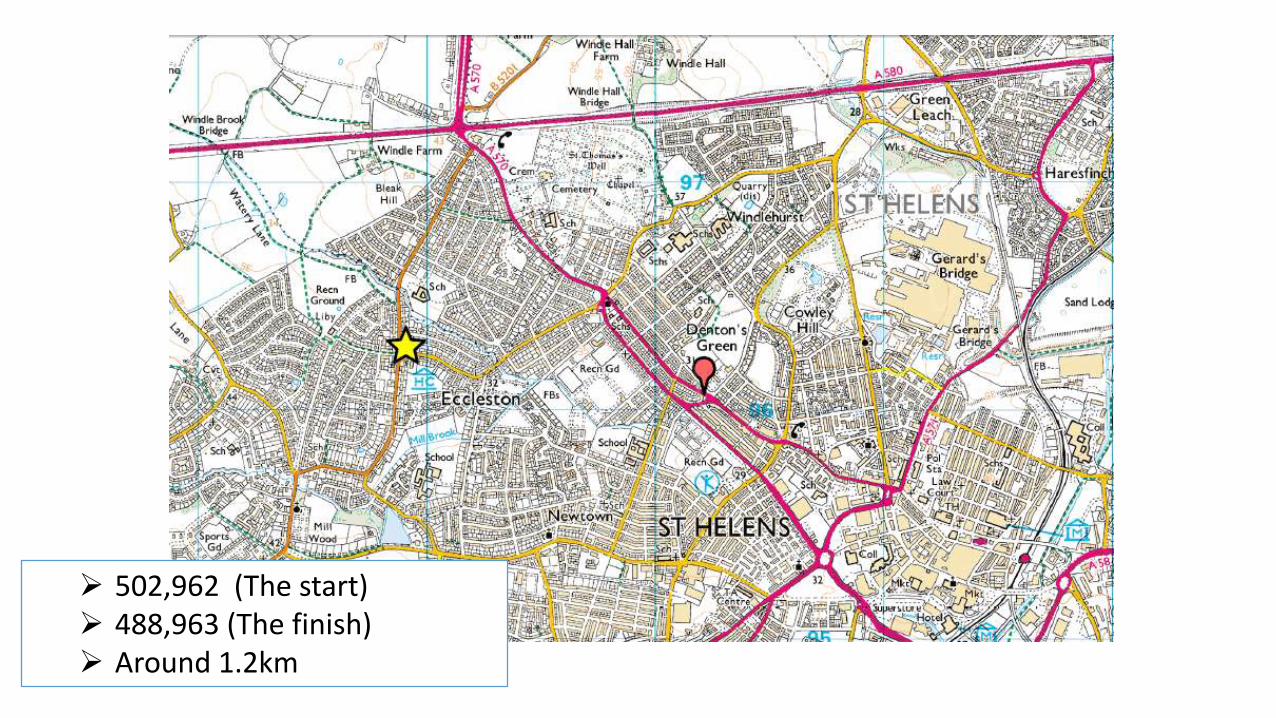
502,962 (The start) 488,963 (The finish) Around 1.2km
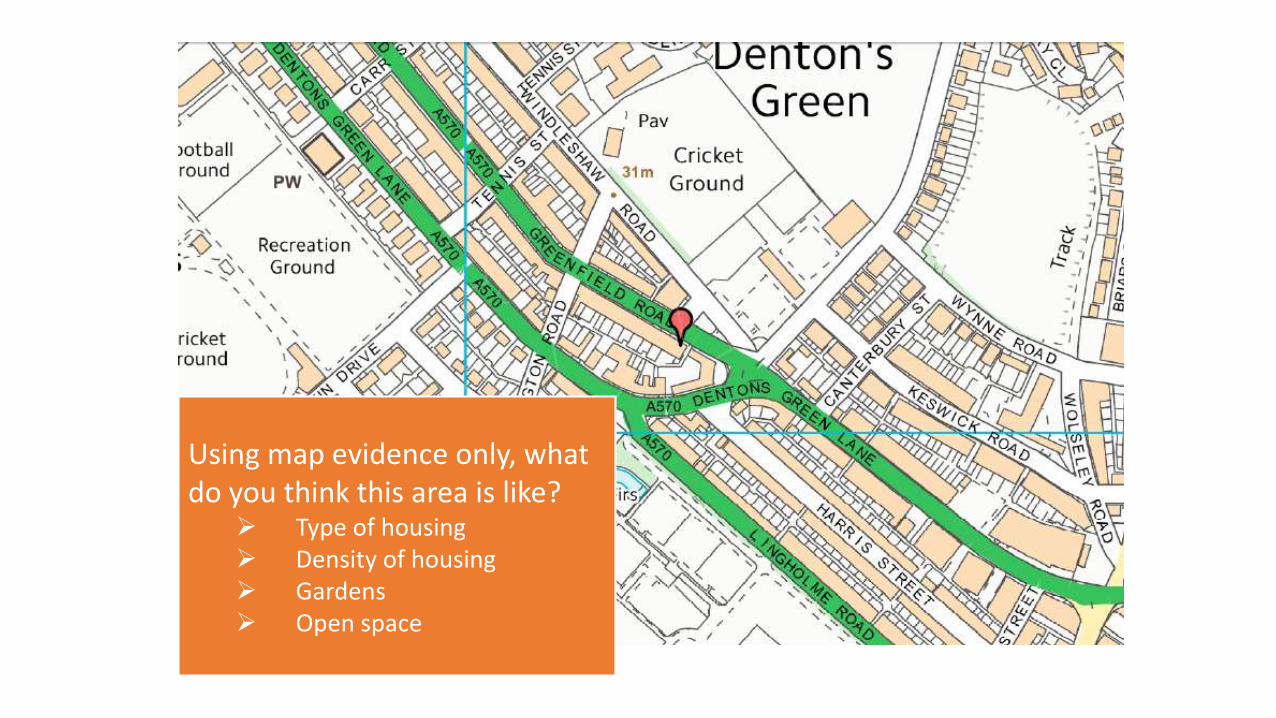
Using map evidence only, what do you think this area is like?
Type of housing Density of housing Gardens Open space

Using map evidence only, what do you think this area is like?
Type of housing Density of housing Gardens Open space


• The two sites were chosen as they are in two different wards (Windleand Eccleston), but are still close to each other and have differentrates of unemployment. This allowed us easily to compare thehousing in two different wards and their rates of unemployment.
• The location had been risk assessed and as it is was close to school itwas known well to both students and staff.
Risk assessment
• We will carry out primary data collection in good light to avoid risk of falling
• Wear sensible shoes to avoid slipping on wet leaves (if autumn)
• When crossing roads…
• We will work in pairs…
• We will take a mobile telephone…

Method and Data Collection.

Collecting data
Primary data
Collected by you
Housing quality survey
Fieldsketch
Secondary data
Collected by someone else
Data from a national database on:
Labour supply
• % employed and unemployed

• The primary data you collected was the housing quality survey (quantitative data) and the field sketch (qualitative data).
• The secondary data you used was the % of unemployed and employedpeople in those wards.
• Housing quality survey: I walked down Greenfield Road and stopped atevery second house. This is systematic sampling. At each house I recordedthings such as paint peeling. I gave every indicator a score out of 10. Thehigher the score the better the quality of house. I then did the Same forKiln Lane.

Data Presentation

• Pie charts were drawn to show the similarities and differences ofunemployment between the two wards.
• Windle Ward (near the inner city) had the higher unemployment rate.
• An example of a pie chart is below.
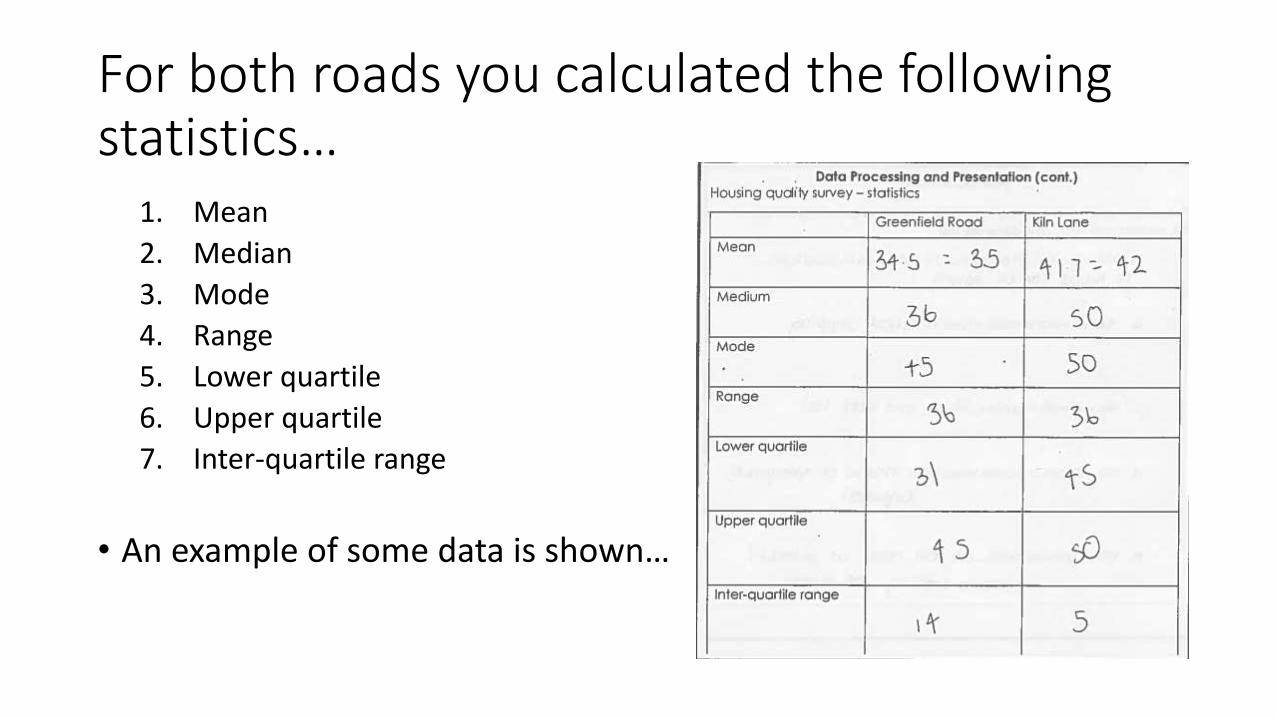
For both roads you calculated the following statistics…
1. Mean
2. Median
3. Mode
4. Range
5. Lower quartile
6. Upper quartile
7. Inter-quartile range
• An example of some data is shown…

Why do we use interquartile range?
• Understanding of range
• Compare central tendency with spread around central figure
• Idea about clustering of results or a large spread of results
Dispersion graphs – show the whole spread of data/results and their frequency

Describing, analysing and explaining fieldwork data and
Evaluation
• You need to look at the information on your A3 sheet to se your actual results.
• However most results showed that…
• The poorer quality housing was found along Greenfield Road. This is inWindle Ward and nearer the inner city with more unemployment. Thebetter quality housing was found along Kiln lane and nearer the suburbs ofSt Helens were there was less unemployment. This suggests there is a linkbetween unemployment and quality of housing.
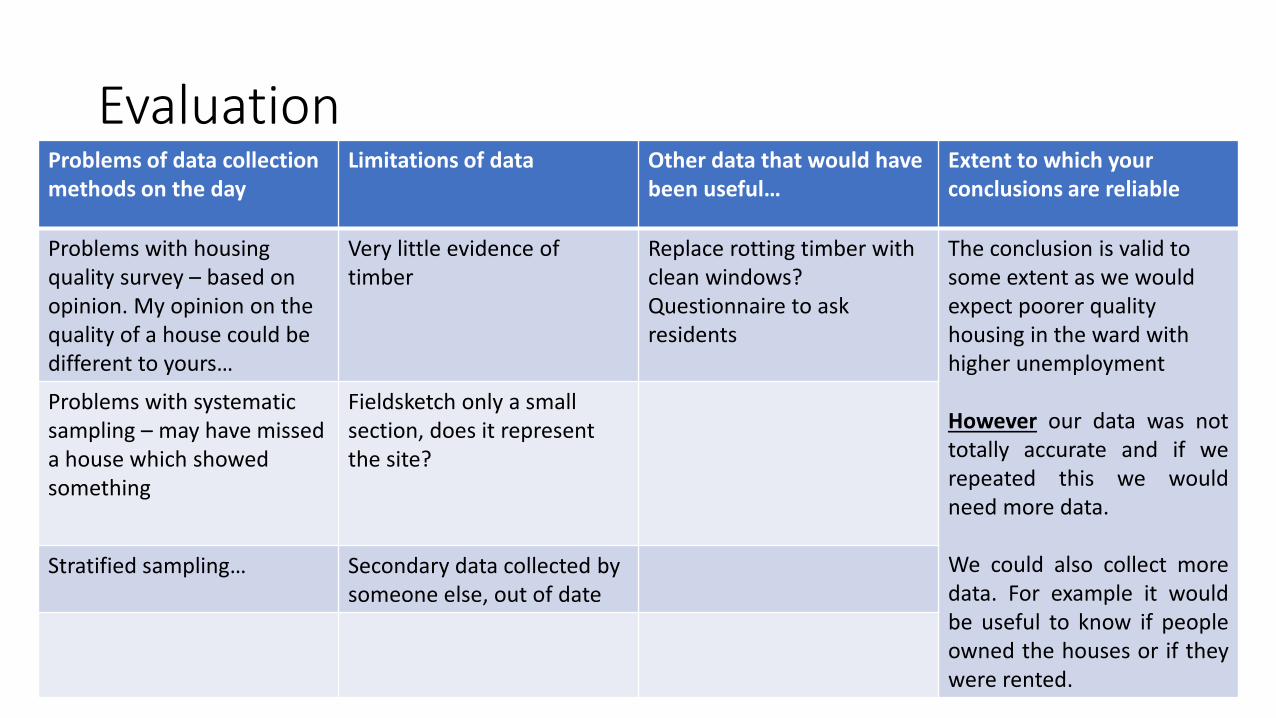
Evaluation Problems of data collection methods on the day
Limitations of data Other data that would have been useful…
Extent to which your conclusions are reliable
Problems with housing quality survey – based on opinion. My opinion on the quality of a house could be different to yours…
Very little evidence of timber
Replace rotting timber with clean windows?Questionnaire to ask residents
The conclusion is valid tosome extent as we would expect poorer quality housing in the ward with higher unemployment
However our data was nottotally accurate and if werepeated this we wouldneed more data.
We could also collect moredata. For example it wouldbe useful to know if peopleowned the houses or if theywere rented.
Problems with systematicsampling – may have missed a house which showed something
Fieldsketch only a small section, does it represent the site?
Stratified sampling… Secondary data collected by someone else, out of date