Evaluation of Participation in the Improving Lung Cancer ...

How to Increase School Enrollment, Participation
and Completion
Review of the Evidence Isaac Mbiti (SMU and J-PAL)

Conference Programme
Welcoming Address
Panel 1: What Have We Learned About Improving School Participation?
Panel 2: What Have We Learned About Enabling Learning?
Panel 3: Supportive Learning Through Technology
Panel 4: Teacher Characteristics, School Governance, and Incentives
Panel 5: Evidence Gaps: Secondary Education and Girls
Panel 6: Evidence Gaps: Early Childhood Education
Panel 7: From Evidence to Action: Next Step for Scaling Up Evidence
Concluding Remarks

A Critical Issue
• Between 1999 and 2006 enrollment rates in primary school increased
– from 54 percent to 70 percent in sub-Saharan Africa
– From 75 to 88 percent in East and South Asia
• Worldwide, the number of children of school age who were out of school fell from 103 million in 1999 to 73 million in 2006

A Critical Issue
• World Bank data show that in Sub-Saharan Africa
– Net enrollment in primary school 75% in 2009
– Primary completion rates were 67% in 2009
– In 2004, only 60% of students were able to progress to secondary school
– Net enrollment in secondary school 27% in 2008
– Gross enrollment in tertiary institutions was 6% in 2008
• Despite the improvements, the data show the region is still lagging in terms of human capital investment

Canonical Economic Framework
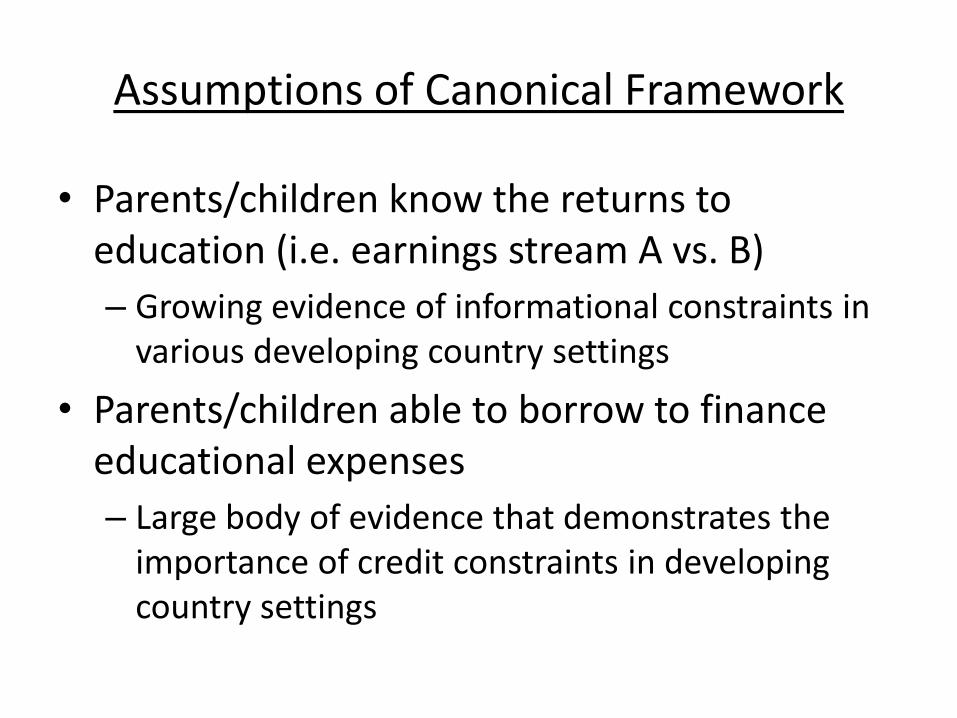
Assumptions of Canonical Framework
• Parents/children know the returns to education (i.e. earnings stream A vs. B)
– Growing evidence of informational constraints in various developing country settings
• Parents/children able to borrow to finance educational expenses
– Large body of evidence that demonstrates the importance of credit constraints in developing country settings

Economic Framework
Benefits
• Labor market returns (wages, employment)
• Non-labor market returns (e.g. better marriage prospects)
Costs
• Direct costs of schooling (fees, transport costs, uniforms)
• Opportunity costs of schooling (forgone earnings)
>

Implications of the Framework
• Educational investments may rise with: – Improvements in labor market conditions – Improvements in school quality – Improvements in complementary human capital
investments (e.g. health, early childhood investments) – Reductions in costs of schooling (fees, uniforms, distance
to school) – Reductions in returns to child labor – Alleviations of credit constraints – Reductions in poverty – Reduction in information barriers (if returns to education
are generally underestimated)

Implications of the Framework
• Other implications of the framework:
– With many children and limited resources it may be rational for parents to invest in children with the highest (perceived) chance of success at the expense of the others
– If returns to education (labor market and non-labor market) for boys > girls then parents may invest more in boys

Testing the Theoretical Implications
• Theoretical implications provide various policy prescriptions on increasing education investments (i.e. schooling enrollment, participation, completion)
• However the theory does not provide guidance on the efficacy of various policy options.
– What works? What works best?
– How cost-effective are various options?
• Only credible empirical evaluation can deliver this
– Randomization methods are the most credible

Evaluation Methodology
• Suppose we are interested in knowing the causal effect of a program that provided students with school uniforms
• Ideally, we want to know what would happen to the school enrollment of a student (Abhijit) under this program compared to the enrollment of the same student (Abhijit) without the program at the same time. – This is known as the counterfactual

Time
Pri
mar
y O
utc
om
e
Impact
Intervention
Evaluation Methodology: Impact Evaluation

Creating a counterfactual
• Non-randomized studies: argue that a certain excluded group mimics the counterfactual. The following strategies are examples of evaluation methods: – Simple Difference (or pre-post)
– Multivariate Regression
– Matching
– Differences-in-Differences
– Instrumental Variables
– Regression Discontinuity
• Randomized studies: use random assignment of the program to create a control group which mimics the counterfactual

Testing the Theoretical Implications
– Improvements in labor market conditions
– Improvements in school quality
– Improvements in complementary human capital investments (e.g. health, early childhood investments)
– Reductions in costs of schooling (fees, uniforms, distance to school)
– Reductions in the returns to child labor
– Alleviations of credit constraints
– Reductions in poverty
– Reduction in information barriers (if returns to education are generally underestimated)

Testing the Theoretical Implications
• Use various indicators or measures of educational investment
– Enrollment
– Participation (or daily attendance rates)
– Completion (years of school completed)
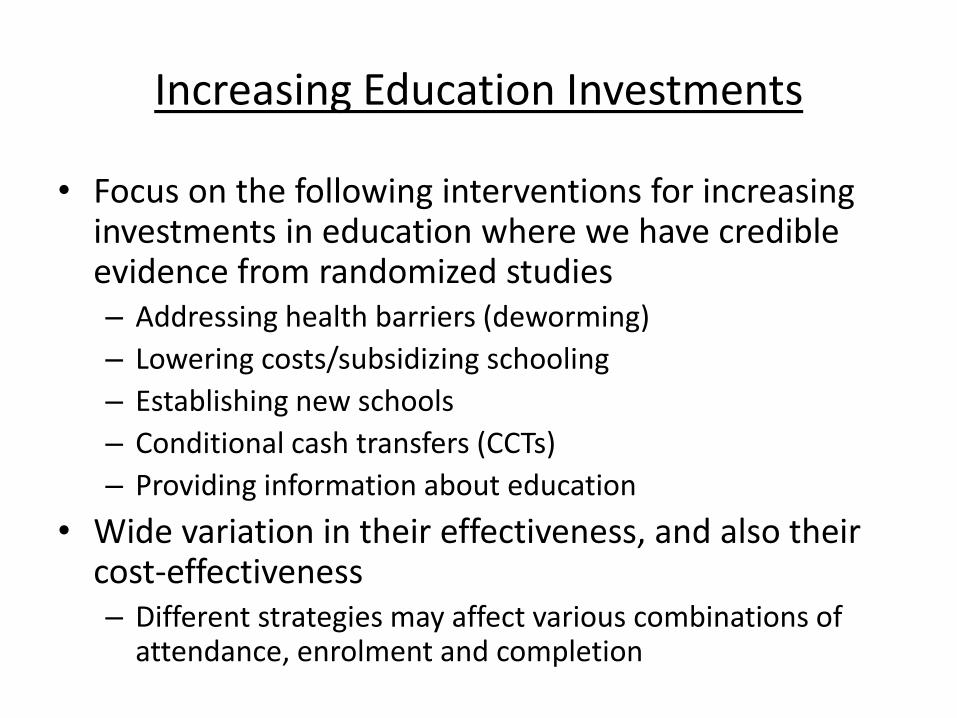
Increasing Education Investments
• Focus on the following interventions for increasing investments in education where we have credible evidence from randomized studies – Addressing health barriers (deworming)
– Lowering costs/subsidizing schooling
– Establishing new schools
– Conditional cash transfers (CCTs)
– Providing information about education
• Wide variation in their effectiveness, and also their cost-effectiveness – Different strategies may affect various combinations of
attendance, enrolment and completion

Health as a Barrier to Education
• Infectious diseases can hinder education access
• Hookworm, roundworm, whipworm, and schistosomiasis affect two billion people worldwide (WHO, 2005) and are particularly concentrated among school aged children.
• Intestinal worms can make children tired, malnourished, and anemic, keeping them from attending school
– Deworming drugs cost only a few cents per pill and can be delivered inexpensively through schools

Health as a Barrier to Education
• Treating Kenyan children for worms caused a 7 percentage point increase in school attendance
– Even kids who were not directly treated benefitted from the lower rates of infection in the community
– Programme is extremely cost-effective, buying around 14 additional years of education per $100 spent
• Limited (but growing) evidence on the importance of non-infectious diseases as impediments to schooling
– Eyeglasses
– Micronutrients

Lowering Costs/Subsidizing Schooling
• Programmes that reduce schooling costs are generally effective, and are fairly cost-effective
• Ancillary costs of education (e.g. school uniforms) continue to impede education access in Kenya – In 2003, school uniforms cost about 480Kshs
(approximately 2% of per capita GDP),
• In Kenya, a program that provided free uniforms to students increased their attendance by 6.4 percentage points, buying 0.71 additional years of education per $100
• Another Kenyan study showed that providing scholarships to cover school fees significantly increased attendance, causing 0.27 additional years of education per $100 spent

Establishing New Schools
• Growing evidence that distance reduces demand for services
• In Afghanistan, building of “village-based schools” reduced distance children had to travel from almost three miles to less than a quarter mile
– A 42 percentage point increase in enrolment
– Can’t know exactly what would happen in an area with more convenient schools or higher baseline enrolment
• Increase in convenience was particularly effective at improving girls’ enrolment
– Led to a 50 percentage point jump in girls’ enrolment

Conditional Cash Transfers
• Cash transfer programs that are targeted to the poor improve their consumption and well-being.
• From the theory outlined earlier we can view this as policy that addresses poverty and/or credit constraints
• Moreover, if child labor is a consequence of poverty then CCTs will also help address the prevalence of child labor
• Making cash transfers conditional on schooling improves attendance
• But as a purely educational intervention, CCTs are very expensive, because of the high costs of targeting activities, and the transfers

Conditional Cash Transfers
• In Malawi, researchers varied the size of cash transfers to see whether people would change behavior as much for smaller amounts of money – Found no difference in impact between giving the average
transfer ($10/month), and the smallest transfer ($5/month)
• Also tested the efficacy of unconditional cash transfers- grants with no strings attached – Unconditional transfers had a smaller effect than
conditional transfers, but they were most effective for the poorest students

Conditional Cash Transfers
• Evidence from Colombia suggests that simple design changes to CCTs (that do not affect overall benefit levels) can have large impacts on educational attainment
– Conditioning payments on graduation rather than enrollment
– Helping families circumvent the difficulties of saving money by shifting some of the benefits to coincide with the timing of school fees

Information on Returns to Education
• Families can be unaware of how much more children could earn with more schooling
– 8th graders in Dominican Republic underestimated the earnings difference between primary and secondary school graduates by 75 percent.
– Parents in Madagascar tend to believe that returns to primary education are low, and returns to higher education higher
• Programs that provided parents (Madagascar) or children (Dominican Republic) with information on the returns to education were very effective at boosting enrollment – Both programs were very cost-effective. – Madagascar program 20 additional years of education for every $100
spent

Cost-Effectiveness
Figure 1: Additional Years of Education per $100 Spent

Conclusion
• While the region has made significant strides in increasing educational attainment much work still needs to be done
• Evidence from randomized studies can provide the most credible evidence on what works
• Important caveat: – Results mostly drawn from “small-scale” programs – Large scale programs may generate additional effects or responses
(e.g. a supply of education response)
• Despite the growing rigorous evidence, there are many gaps in our knowledge – Much of the evidence focuses on primary schooling. More research is
needed in secondary and tertiary schooling – Critical need for further randomized studies that seek innovative and
cost-effective ways to boost enrollment, participation and completion – An important way forward may be investigating the efficacy of small
design changes in various programs.

Increasing Participation: Kenya’s National School-Based
Deworming Programme
Dr. Stewart Kabaka Programme Manager, School Health
Ministry of Public Health and Sanitation
Mrs. Leah Rotich Director, Basic Education
Ministry of Education

Primary Education in Kenya
• Adoption of Free Primary Education in 2003
• Dramatically increased school enrolment – 5.9 million in 2003 to over 9 million in 2012
But…
Absenteeism remains a problem Net attendance ratio of 72% for boys, 75% for girls

Improving participation
• Need to address the causes of absenteeism
• Why are children missing school?
• Need for cost-effective solutions that can be implemented at scale

School-Based Deworming: A Solution
• Research in Kenya showed that
School-Based Deworming reduced
absenteeism by 25%
• This equates to an average 28 extra
days schooling per year child
treated.
• Additional benefits to health,
cognition and future earnings.

School-based deworming: Building on existing infrastructure
• Schools are the best place to efficiently reach large numbers of children – especially since the introduction of FPE.
• There are more schools than health clinics and more teachers than health personnel.
• Administering deworming tablets can be done by teachers.
• School-based deworming is cost-effective because it uses existing infrastructure.
5

2009: first roll-out of National School-Based Deworming Programme in Kenya

Achievements: 2009
7
• Roll-out in 2009 successfully reached all 45 targeted districts
• Over 1,000 district and division personnel trained (MoE, MoPHS, KEMRI)
• Over 16,000 teachers trained
Over 3.6 million children in over 8,200 schools were dewormed!
The cost of the programme was only USD $0.36 per child treated

2009-2011: Transitional period

2012 and beyond
• IPA’s Deworm the World Initiative led the effort to find new resources for Kenya’s School Based Deworming Programme
• Identified a donor willing to support a five year programme
• Programme set to launch in the next month

Kenya’s National School-Based Deworming Programme
• The program targets
5 million children every year for the next 5 years
• 4 Provinces
• 66 Districts
• Over 11,000 schools

Background: The National School Health Policy and Guidelines
• Signed and launched in May 2009
• Policy developed by Ministry of Education, Ministry of Public Health and Sanitation, various partners and stakeholders.
• The policy provides:
– A legal framework
– Clear cut leadership for ownership and sustainability
– A guide to program implementation

National School Health Policy
School-based mass deworming adopted as an effective preventative and treatment measure; policy instructs that:
“Treatment shall be administered to all school-age children, including those out of school, based on the prevalence and intensity of worms and bilharzias in the area.”
- GoK Nat’l School Health Policy, p. 32

Why School Based Deworming? • Children have the worst
infection because:
– Often barefoot
– Less hand washing
– Often latrines not available
– Often swimming and playing
• Children with worms are less likely to attend schools or to concentrate when they are there.
Graph Showing Intensity of
Infection by Age

The School-Based Deworming Cascade
Head Teachers, Teachers Parents
Students Community
Division Public Health Officer Area Education Officers
TAC Tutors, Nurses Etc.
DMOH, DEO, Education Officers, District Clinical Officer, Public Health Officer, Nutritionist, etc.
Master Trainers
District #1
District #2
District #3
District #X
Division A
Division B
Division C
Division D
School
School School School
School School
District #1
District #2

Deworming day: record-keeping
15

Deworming day – washing hands
16

Deworming!
17
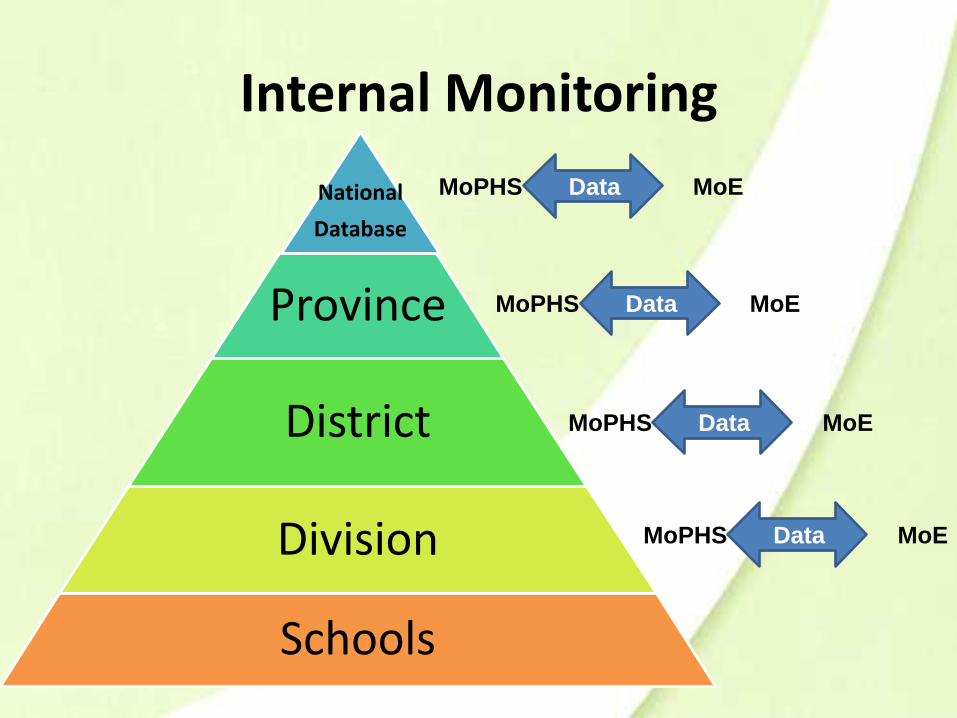
Internal Monitoring
National
Database
Province
District
Division
Schools
Data MoPHS MoE
Data MoPHS MoE
Data MoPHS MoE
Data MoPHS MoE

19
The National School-Based Deworming Programme: Improving the Health and Education of Kenya’s Children