Pandemics, Global Supply Chains, and Local Labor Demand ...
30
Working Paper October 2020 reap.fsi.stanford.edu November 2020 Pandemics, Global Supply Chains, and Local Labor Demand: Evidence from 100 Million Posted Jobs in China Hanming Fang, Chunmian Ge, Hanwei Huang & Hongbin Li Abstract This paper studies how the COVID-19 pandemic has affected labor demand using over 100 million posted jobs on one of the largest online platforms in China. Our data reveals that, due to the effects of the pandemic both in China and abroad, the number of newly posted jobs within the first 13 weeks after the Wuhan lockdown on January 23, 2020 was about one third lower than that of the same lunar calendar weeks in 2018 and 2019. Using econometric methods, we show that, via the global supply chain, COVID-19 cases abroad and in particular pandemic-control policies by foreign governments reduced new job creations in China by 11.7%. We also find that Chinese firms most exposed to international trade outperformed other firms at the beginning of the pandemic but underperformed during recovery as the Novel Coronavirus spread throughout the world.
Transcript of Pandemics, Global Supply Chains, and Local Labor Demand ...

Working Paper October 2020
reap.fsi.stanford.edu
November 2020
Pandemics, Global Supply Chains, and Local Labor Demand:
Evidence from 100 Million Posted Jobs in China
Hanming Fang, Chunmian Ge, Hanwei Huang & Hongbin Li
Abstract
This paper studies how the COVID-19 pandemic has affected labor demand using over 100 million
posted jobs on one of the largest online platforms in China. Our data reveals that, due to the effects of
the pandemic both in China and abroad, the number of newly posted jobs within the first 13 weeks after
the Wuhan lockdown on January 23, 2020 was about one third lower than that of the same lunar
calendar weeks in 2018 and 2019. Using econometric methods, we show that, via the global supply
chain, COVID-19 cases abroad and in particular pandemic-control policies by foreign governments
reduced new job creations in China by 11.7%. We also find that Chinese firms most exposed to
international trade outperformed other firms at the beginning of the pandemic but underperformed
during recovery as the Novel Coronavirus spread throughout the world.

NBER WORKING PAPER SERIES
PANDEMICS, GLOBAL SUPPLY CHAINS, AND LOCAL LABOR DEMAND:EVIDENCE FROM 100 MILLION POSTED JOBS IN CHINA
Hanming FangChunmian GeHanwei Huang
Hongbin Li
Working Paper 28072http://www.nber.org/papers/w28072
NATIONAL BUREAU OF ECONOMIC RESEARCH1050 Massachusetts Avenue
Cambridge, MA 02138November 2020
For helpful comments and suggestions, we would like to thank Frank Pisch, Scott Rozelle and Bernard Yeung. Chunmian Ge gratefully acknowledges funding support from the National Natural Science Foundation of China (Grant 71872065) and Natural Science Foundation of Guangdong Province for Distinguished Young Scholar (Grant 2019B151502027) and GDUPS (2019). We are responsible for all remaining errors. The views expressed herein are those of the authors and do not necessarily reflect the views of the National Bureau of Economic Research.
NBER working papers are circulated for discussion and comment purposes. They have not been peer-reviewed or been subject to the review by the NBER Board of Directors that accompanies official NBER publications.
© 2020 by Hanming Fang, Chunmian Ge, Hanwei Huang, and Hongbin Li. All rights reserved. Short sections of text, not to exceed two paragraphs, may be quoted without explicit permission provided that full credit, including © notice, is given to the source.

Pandemics, Global Supply Chains, and Local Labor Demand: Evidence from 100 MillionPosted Jobs in ChinaHanming Fang, Chunmian Ge, Hanwei Huang, and Hongbin LiNBER Working Paper No. 28072November 2020JEL No. F16,J2
ABSTRACT
This paper studies how the COVID-19 pandemic has affected labor demand using over 100 million posted jobs on one of the largest online platforms in China. Our data reveals that, due to the effects of the pandemic both in China and abroad, the number of newly posted jobs within the first 13 weeks after the Wuhan lockdown on January 23, 2020 was about one third lower than that of the same lunar calendar weeks in 2018 and 2019. Using econometric methods, we show that, via the global supply chain, COVID-19 cases abroad and in particular pandemic-control policies by foreign governments reduced new job creations in China by 11.7%. We also find that Chinese firms most exposed to international trade outperformed other firms at the beginning of the pandemic but underperformed during recovery as the Novel Coronavirus spread throughout the world.
Hanming FangDepartment of EconomicsRonald O. Perelman Centerfor Political Science and Economics133 South 36th StreetSuite 150Philadelphia, PA 19104and [email protected]
Chunmian GeDepartment of Financial ManagementSchool of Business AdministrationSouth China University of TechnologyGuangzhou, Guangdong [email protected]
Hanwei HuangCity University of Hong Kong 10-282, Lau Ming Wai Academic Building Hong Kongand Centre for Economic Performance [email protected]
Hongbin LiStanford Institute for Economic Policy Research 366 Galvez StStanfordStanford, CA [email protected]

Introduction
The novel coronavirus pandemic (COVID-19) has resulted in an enormous loss oflives around the world. Measures taken by governments to contain the virus haveflattened the epidemic curve and slowed the spread of the disease (1, 2, 3) butalso have resulted in the loss of hundreds of millions of jobs and thrown the globaleconomy into a deep recession. In an age in which most goods are “Made in theWorld” (4), there are worries that COVID-19 and pandemic-control policies couldgenerate shock waves, transmitted via global supply chains, and impose economiccosts that bypass national borders (5, 6, 7).
Two emerging strands of literature attempt to estimate the economic impactof the COVID-19 pandemic. On the empirical side, studies have shown that newjob postings online dropped by about 40% in countries such as the United States(8, 9) and Sweden (10). There also are strong correlations between the drop injob postings and exposure to COVID-19 by state or county in the United States(8, 9). In addition, tradable sectors can better withstand the pandemic (8). Onthe theoretical side, macroeconomic models have been used to simulate the impactof the pandemic on employment and other outcomes (6, 7, 11). These studies allhighlight the possibility of COVID-19 shocks as propagating through the globalproduction network, and neither strand of literature has provided direct evidenceon whether and how global supply chains have played a role in transmitting theCOVID-19 shocks and policy across borders.
In this paper, we attempt to understand the nexus between COVID-19, gov-ernment pandemic-control policies, international trade, and Chinas labor marketby exploring over 100 million jobs posted on a leading Chinese online employmentplatform. China, the country where COVID-19 first broke out, also has been thelargest trading nation in the world since 2013. In the first quarter of 2020, asCOVID-19 cases peaked in China, total Chinese exports fell by 9.3% quarter-on-quarter, the largest fall in a decade.1 At the same time, according to our data,in the first 14 weeks after the lockdown on January 23, 2020 of Wuhan City—thefirst epicenter of COVID-19—the number of newly posted jobs dropped by about31%, or 3.8 million, relative to the same lunar calendar period in 2018 and 2019.2
Our empirical model correlates, at the city-week level, the creation of new jobswith exposure to the pandemic in the city, in other parts of China, and to foreign
1Source: the Federal Reserve Bank of St. Louis.2The urban unemployment rate went up by about one percentage point to 5.9%, the highest
level and largest month-to-month increase of this statistic since it was officially published inJanuary 2018. Source: National Bureau of Statistics of China. This official unemployment ratepercentage likely does not fully reflect true unemployment in China because the survey does notcover most of the 300 million migrant workers, who are more likely to be unemployed during thepandemic.
2

countries through supply chains. Similar to other recent studies (8, 9), we firstexamine the impact of new COVID-19 cases in the local city on local job creation.Different from these studies, we also separately identify the impact of COVID-19in other parts of China by using a distance-weighted pandemic exposure measure.
We also test whether the pandemic has an impact on job creation through theglobal supply chain. To the best of our knowledge, we are the first to exploit cross-city variations in their exposure to the global pandemic and virus-containmentpolicies through their differential trade linkages with other countries. Specifically,we create trade-weighted measures of exposure to the global pandemic by usingChinese Customs data to generate weights and to estimate their effects on jobcreation in a Chinese city. Thus, the variations come from the change of globalpandemic and containment policies over time and a citys exposures to trade withdifferent countries. Further, we follow Campello et al. (8) to test whether the tradesector fares differently from other firms at different stages of the global pandemic.Empirically, we identify trade intermediary firms by examining whether the namesof firms contain Chinese terms related to trade.
We establish three main findings. First, we find that COVID-19 cases in thelocal city and other parts of China have large negative impacts on job creationin a Chinese city, and the elasticity of job creation with respect to the latter isslightly larger in magnitude. Our back-of-the-envelope calculation implies that jobcreation was down by 9.6% due to local city COVID-19 cases but by 10.7% due tocases in other parts of China in the 14 weeks after the Wuhan lockdown. Second,foreign COVID-19 shocks transmitted via global supply chains also reduced jobcreation in China. This impact came mainly from the decline of export demanddue to the policy responses by foreign governments to COVID-19. In the same 14weeks, foreign COVID-19 shocks reduced job creation in China by another 11.0%,which weakened the recovery of the labor market. Finally, we find, as a pieceof direct evidence for the role of international trade in transmitting the COVID-19 shock, that Chinese firms that rely more on international trade outperformedother types of firms in withstanding the COVID-19 shock when the epicenter wasin China but underperformed during the recovery as the epicenter moved to therest of the world.
In addition to the recent economic literature on COVID-19 cited above, ourpaper also is related to the literature on the propagation of shocks through input-output linkages and global supply chains. The propagation of a local shocks hittingone or few regions by examining natural disasters in the U.S., the SARS epidemic,and the 2011 east Japan earthquake have been, respectively, studied (12), (13),and (14). The COVID-19 pandemic is a global shock and, thus, differs from theselocal shocks. Like the pandemic itself, which may have multiple waves (15), theCOVID-19 shock may hit local economies multiple times via global supply chains.
3

Understanding the transmission mechanism through domestic and interna-tional linkages is crucial for policymaking to, on the one hand, contain the pan-demic and, on the other hand, speed up the recovery of the global economy. Do-mestically, we find that the effect of COVID-19 cases in other parts of China issimilar to that in the local city. This suggests that, for large countries with com-plex domestic supply chains, such as China, the United States, Brazil, and India,a nationally coordinated strategy is important for controlling both the pandemicand economic recovery. With the pandemic under control in China, the impacts ofthe global pandemic through trade and pandemic-mitigation policies have becomemore prominent over time. As evident from our data, seven weeks after the Wuhanlockdown, 78.0% of the loss of new jobs was due to foreign pandemic shocks viathe global supply chain. According to our data, over the entire 14-week period,foreign shocks accounted for slightly more than a third of the 3.8 million “lost newjobs. These findings suggest that an open economy cannot fully recover unless thepandemic is well under control among all of its major trading partners, and, thus,international coordination in pandemic control is crucial.
Our findings also have implications for Chinas future trade and job creationbeyond COVID-19. The current pandemic will likely pass within a year, whenvaccines and more effective therapeutics are developed (16, 17, 18). With dete-riorating relations between China and the United States as well as other majorwestern countries, however, economic decoupling of China from the rest of theworld or a sudden drop in Chinas trade volume is becoming a real possibility. Inlight of this, the unprecedented COVID-19 pandemic and the subsequent virusmitigating border control policies adopted by foreign governments could serve asa natural “simulation and be used as a rare opportunity to test how an abruptsevering of the global supply chain might affect job creation in China. We findlarge negative impacts of trade shocks, in particular, of the drop of foreign demanddue to border control policies. Economic decoupling of China from the rest of theworld will likely cause job losses in China in a similar manner, except that themagnitude of such a shock will likely be much larger (6).
Data and Methods
Data
We use several data sources for our analysis. Our job posting data come from oneof the largest online platforms that provide hiring services in China.3 We ran a
3According to iResearch, a leading online market research company in China, the platformwe scraped our data from has a stable market share before and during the pandemic. Thus, itis unlikely that the loss in their posted job ads is due to a platform-specific downward trend.
4

web-scraping algorithm that collected job ads posted on the platform from January1, 2018, to April 30, 2020. For each ad, we know the basic characteristics of thejob, including the job location, the number of vacancies, and some information onthe firm, including the firm name, size, and industry classification. In total, wecollected roughly 20 million job ads, with 104.9 million posted vacancies by morethan 700,000 firms during our sample period.4 We aggregate the post-level jobvacancies to the city-week level, which is the unit of our analysis. The data samplecovers 334 cities and 122 weeks, and, thus, we have 40,414 city-week observationsin total. As shown in Table 1, a city posted an average of about 500 job ads withabout 2,541 vacancies on the platform each week.
Our job posting data do not include whether a firm trades with foreign coun-tries. We follow Ahn et al. (20) to identify trade intermediaries by firm names.Specifically, we define firms as trade intermediaries if their names contain Chinesecharacters that mean “importer,” “exporter,” or “trading companies.”5 Using thismethod, we define 3.8% of the firms in our sample as trade intermediaries.
Our primary COVID-19 data source is DXY, the largest online platform run bythe community of Chinese medical professionals. The platform publishes COVID-19 epidemic data for each Chinese city, and for each foreign country or region, inalmost real time.6 DXY started to publish the data only after the Wuhan lockdownon January 23, 2020. For epidemic data from earlier dates, we use data from theHarvard Dataverse. DXY reports the cumulative number of confirmed cases foreach region, from which we calculate the number of newly confirmed cases in eachweek, which is the focus of our analysis.7
We use the Oxford COVID-19 Government Response Tracker (OxCGRT) toobtain data on policies adopted by governments in response to the pandemic. Ox-CGRT collects comprehensive and consistent worldwide data on policy responsesto COVID-19, including containment and closure, testing, and monetary and fiscalpolicies (22). Given our interest in the global supply chain, we focus on the inter-national aspect of these policies, which include border control measures that can
Inevitably, online posted jobs are biased toward the urban areas in China. Wang et al. (19)examine the impact of COVID-19 in rural China.
4The numbers of vacancies are 44.4 million in 2018, 50.5 million in 2019, and 10.1 million inthe first four months of 2020.
5The list of Chinese words are “mao4yi4” (trade), “jin4kou4” (import), “chu1kou3” (export),“jin4chu1kou3” (import and export), “ke1mao4” (science and trade), “wai4mao4” (foreign trade),and “wai4jing1” (foreign economic).
6DXY is also the primary data source of the online interactive dashboard run by the Centerfor Systems Science and Engineering at Johns Hopkins University (21). If there are missing datain DXY, we complement it using OxCGRT, which also reports the number of confirmed casesby country.
7Results are robust using other COVID-19 measures such as the cumulative number of cases.
5

generate friction to international trade.8 The tracker classifies such measures intofive levels of stringency, ranging from no measure at all to total border closure.9
We also use Chinese Customs data, which cover export and import transactions byChinese firms to measure the trade linkages of each Chinese city with the rest ofthe world. We aggregate these transactions to calculate, for each city, its importsfrom and exports to other countries/regions.
To examine how foreign COVID-19 shocks affect job creation in China, we alsoconstruct several trade-weighted pandemic and policy response variables. Thevariable expCovid (and, respectively, impCovid) is the weighted average of thenumber of new cases in all countries, for which the weights are a citys relativeshare of export to (and, respectively, import from) each foreign country in theyear 2012, which are the latest customs data available to us.10 Similarly, the trade-weighted policy response measures expBorderControl and impBorderControl arethe border control policies imposed by each foreign country, weighted by a citysrelative share of exports to and imports from each country/region, respectively.To measure the exposure of local labor markets to shocks from other domesticcities, we construct a distance-weighted measure of new cases in each domesticcity, using the inverse city-pair distance as the weight. All technical definitionsof these constructed measures are in the Appendix S1.1. Table 1 presents thesummary statistics of the key variables.
Methods
Formally, we study the impact of COVID-19 on job creation by estimating thefollowing equation:
ln(jobsit) = a1 ln(localCovidit) + a2 ln(domCovidit)
+ a3 ln(expCovidit) + a4 ln(impCovidit)
+ a5expBorderControlit + a6impBorderControlit
+Mt + Springt + Autumnt + CityY earit + εit, (1)
where the subscripts i and t represent city and week, respectively. We define weeksusing the lunar calendar, starting from the Chinese New Year, as it coincides with
8As a robustness check, we also use a policy index developed by OxCGRT, which capturesdifferent policies DIMITRI.
9The five levels of border controls are 0 = no measures, 1 = screening, 2 = quarantine arrivalsfrom high-risk regions, 3 = ban on arrivals from some regions, 4 = total border closure. In theappendix, we show that we obtain a similar result by using a general policy stringency indexthat covers other aspects of containment and closure, including lockdown.
10In the appendix, we also present results using measures that are scaled by total exports orimports divided by GDP for each city. This does not change our results qualitatively.
6

the week of the Wuhan lockdown (January 23, 2020) and is the start of the Chineselabor market cycle.11 The dependent variable jobsit is the number of posted jobsin city i at week t. The two variables localCovid and domCovid are the number ofnewly confirmed cases in the city and other cities in China, respectively, capturingthe severity of the pandemic in China. The two trade variables expCovidit andimpCovidit are used to estimate the effects of pandemic outbreaks in trading part-ners on job creation in Chinese cities through export and import channels, respec-tively. To disentangle pandemic effects from the effects of policies in response tothe pandemic, we include the trade weighted policy variables expBorderControlitand impBorderControlit. Below, we report the estimation results from variationsof Eq. (1) as we gradually include more explanatory variables in the regressions.
All estimated models include the following control variables. We include Mt,dummies of the month to capture the seasonal movements in job creation. Inaddition, we include Springt and Autumnt, dummies for spring and autumn hiringseasons. In Appendix Figure S1, we plot the aggregate number of job postings foreach week, which features two major peaks, the spring and autumn hiring seasonsin each year. The spring season is usually right after the Spring Festival, andthe autumn season typically falls in October or November. We construct thesedummies to capture these hot seasons in the job market. CityY earit is a city byyear fixed effect which captures city and year shocks specific to the local labormarket.
Results
In this section, we present the effects on job creation of domestic COVID-19 casesand those of the global pandemic through the supply chain. For the global sup-ply chain effects, we disentangle direct COVID-19 trade effects from pandemic-mitigation policy effects. We also examine whether trade intermediaries fareddifferently from other firms.
Overall Job Losses The COVID-19 pandemic had a large impact on job cre-ation in China. Figure 1 presents a plot of the fall in the number of posted jobsfor each week, compared to the average of the same lunar calendar week in theyears 2018 and 2019.12 At the trough of the line, which is two weeks after the
11Most workers take a vacation of between one to four weeks during the Chinese New Yearand start to search for jobs immediately after. Correspondingly, there is normally a spike of jobpostings right after the Chinese New Year.
12The week that follows the Wuhan lockdown is the Spring Festival holiday in China. TheSpring Festival is based on the lunar calendar and falls on different dates on the Gregoriancalendar in different years. For the years 2018 and 2019, the job posting numbers are those
7

week that follows the Wuhan lockdown on January 23, 2020, which we refer to as“week zero,” the number of posted jobs fell by as many as 1.85 million, or 89% rel-ative to the same lunar period of the previous two years. As the virus subsided inChina and hit the rest of the world six weeks later, Chinas labor demand graduallyrebounded. It stayed below pre-pandemic levels, however, due partly to foreignCOVID-19 shocks. In the 14 weeks after the Wuhan lockdown, the total numberof jobs posted on the platform was 8.36 million, down 31.2% from the average levelin the same period of 2018 and 2019 (about 12.15 million).
Domestic COVID-19 Cases The results from estimating Eq. (1) show thatdomestic COVID-19 cases indeed have a large negative effect on job creation. Asshown in Table 2, the coefficient on ln(localCovid) is negative and statisticallysignificant at the 1% level, suggesting that fewer jobs were created as the numberof new local COVID-19 cases increased. The magnitude of this effect is large. Asseen in column (4), if the number of local newly confirmed cases increases by 1%,job numbers fall by about 0.18%.
The results presented in Table 2 also indicate that the pandemic in other partsof China influences local labor demand. In Columns (2) - (4), the coefficient ofthe variable that captures the pandemic in other domestic regions ln(domCovid)is negative and significant at the 1% level. Therefore, if the novel coronavirus hitother domestic regions badly, the local job market will suffer, capturing importantdomestic cross-city economic linkages. Moreover, comparing the estimated coeffi-cients in a given city, we can see that the magnitude of the effect in other regionsis similar to that of the local city. We summarize these results into the followingfact.
Fact 1: In a given Chinese city, COVID-19 cases in both the local city andother parts of China have large negative impacts on job creation.
Global Supply Chain The severity of the pandemic abroad also reduced locallabor demand through both the direct trade linkage and the pandemic-controlpolicies. In Column (3) of Table 2, we include variables that measure exposure toforeign COVID-19 shocks via export demand (ln(expCovid)) and import supply(ln(impCovid)) channels. Both trade-weighted measures have negative coefficientsand are significant at least at the 10% level. The magnitude of the export-weightedpandemic variable almost doubles that of the import-weighted variable, suggestingthat the impact of export demand is relatively more important.
The variation among all trade-weighted pandemic and mitigation policy vari-ables suggests that border-control policies through the foreign export demand
posted during the three months after the Spring Festival in each year.
8

channel have the largest impact on job creation in China. In Column (4), wefurther include variables that capture the exposure to foreign policies created inresponse to COVID-19. We find that the trade-weighted pandemic variables them-selves become small and statistically insignificant. Although the import-weighedpolicy variable is also small and insignificant, the export-weighted policy variable(expBorderControl) is large and statistically significant with a magnitude similarto those of the domestic pandemic variables. These results suggest that the impactof the pandemic abroad on local labor demand in Chinese cities is mainly a resultof foreign government policy responses to COVID-19. We summarize the findingsinto the following fact.
Fact 2: Global supply chains transmitted foreign COVID-19 shocks and reducedjob creation in China mostly via policy responses to the pandemic on export de-mand.
Economic Magnitude of the Effects We use our estimated model (Column(4)) to disentangle the loss in job creation from each of the pandemic shocks:local COVID-19, COVID-19 in other domestic cities, foreign COVID-19 shockson export and import, and foreign policy shocks on export and import. For eachweek, we compute the implied reduction in the number of jobs according to theestimated coefficients and the observed shock. We then compute the share of thereduction in job creation attributable to each shock by dividing the implied jobposting reduction from each shock (calculated from the estimated coefficients) bythe total implied reduction. As can be seen in Figure 2, when the epicenter was inChina (Weeks -2 to 6), the negative impact on job creation in a given city was duemostly to COVID-19 shocks in the local city and other domestic cities.13 As thepandemic was on the wane in China and surged in the rest of the world (Weeks7 to 13), the impact of foreign policy responses on export demand loomed largeand became the primary shocks on Chinese local labor demand (78.0% of the totalimpact). Out of the 3.79 million new jobs lost in the entire 14-week period of ourstudy, the contributions to job losses from each source in a given city are 31.0%(1.16 million jobs) from the local city, 34.0% (1.30 million jobs) from other Chinesecities, and another 35.0% (1.33 million jobs) from foreign countries, including theeffects of both the pandemic itself and policy responses.
Trading Firms In this subsection, we examine whether the pandemic and re-lated trade policies affect trade intermediaries differently from other firms. Tradeintermediaries are arguably more exposed to international trade because their main
13We define the epicenter to be in China when the total number of confirmed cases in Chinawas higher than the rest of the world.
9

business is to be middlemen between foreign buyers/sellers and domestic firms.14
As documented by Ahn et al. (20), trade intermediaries handled 22% of Chineseexports and 18% of imports in 2005.
Empirically, we first split firms in a city into two groups, trade intermediariesand other firms, and then aggregate the job postings by group for each city andeach week. We estimate a slightly varied version of Eq. (1), with a dummy variablethat indicates whether it is a trade intermediary group and its interactions withthe trade and policy variables. The results reported in Table 3 show that both thepandemic and related policies abroad hurt trade intermediaries more than otherfirms. In Columns (1)(4), we report only the interaction terms between the tradeintermediary dummy and other variables. The interaction terms are all negativeand significant, meaning that foreign COVID-19 shocks have a larger impact onthe labor demand of trade intermediaries than other firms.
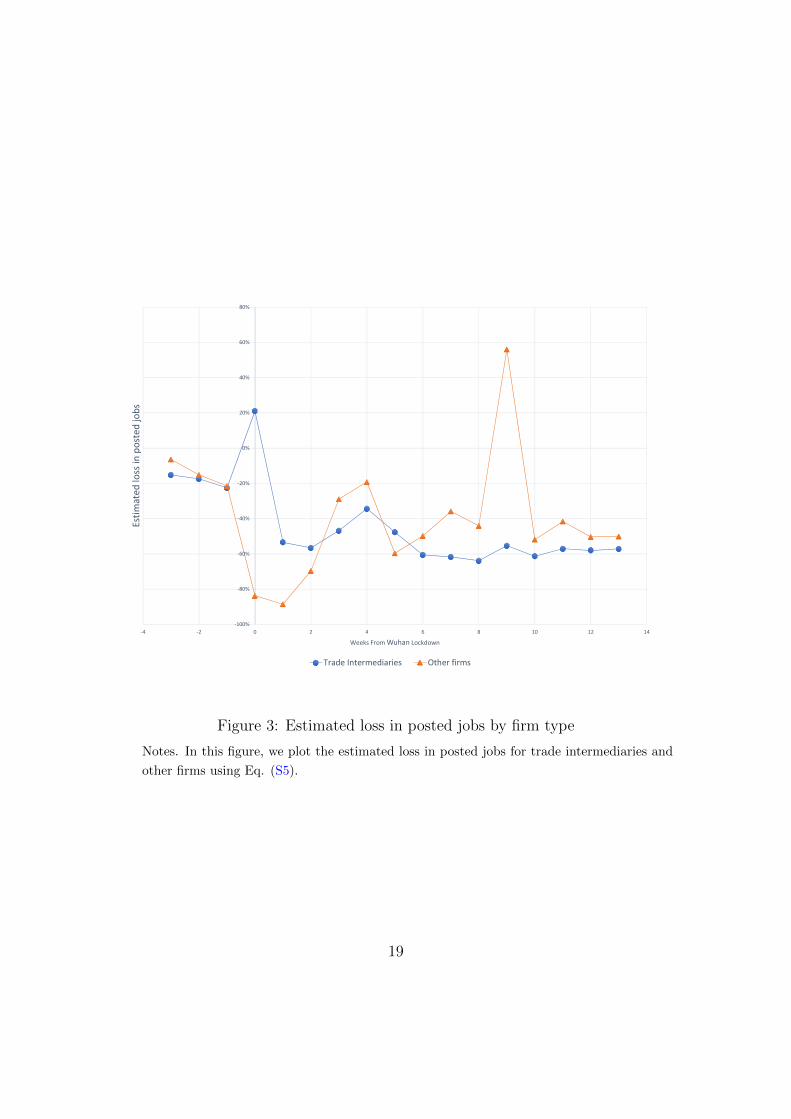
We also can examine the impacts of the global supply chain at different timesthroughout the COVID-19 outbreak. We expect trade intermediaries to be lessexposed to COVID-19 than other firms when the pandemic first broke out in Chinaand domestic demand was depressed. When the epicenter moved to the rest ofthe world and foreign governments started to impose pandemic mitigation policies,however, trade intermediaries in China would be expected to suffer more than doother firms that rely less on the foreign market. To test this, we estimate thechange of job postings for both trade intermediary and other firms for each weeksince the outbreak. The change is relative to the normal level in the previous twoyears.15 We plot the implied percentage reduction in job loss for both types offirms in Figure 3.
As we can see from the figure, before the Wuhan lockdown, the labor demandsof trade intermediaries and other firms followed parallel trends.16 At the beginningof the outbreak (Weeks 0 to 2), the number of jobs posted by trade intermediariesfell by a lesser degree than other firms (60% versus 80%). Trade intermediaries,however, underperformed compared to other firms when the virus started to hitthe rest of the world; in particular, trade intermediaries missed the large recoveryspike of other firms that occurred in Week 9. Overall, job postings by trade
14Firms that export directly typically sell both at home and abroad, but exports capture onlya small share of total sales. According to Bernard et al. (23), 18% of U.S. manufacturing firmsexported in 2002, but exports made up 14% of total sales.
15See Eq. S5 in the appendix.16We formally tested the difference between trade intermediaries and other firms by estimating
a difference-in-differences model. The coefficients that capture the difference between the twotypes of firms over time are shown in Figure S2. Instead of looking at the difference week-by-week, we have also done a robustness check which divides the sample into 3 periods: pre-pandemic, epicenter in China, and epicenter outside China; then, we compare the performanceof trade intermediaries versus other firms. We also use an alternative method to identify tradeintermediaries. Overall, we find similar patterns. The results are in appendix S4.
10

intermediaries remained 60% lower than pre-pandemic levels, while job postingsby other firms gradually outperformed trade intermediaries. To summarize, wepresent the following fact.
Fact 3: Trade intermediaries, which were more exposed to foreign COVID-19 shocks, outperformed other firms when the epicenter was in China but under-performed as the epicenter moved out of China.
Conclusion
Using big data collected from 100 million posted jobs in China, we empiricallydemonstrate that the effect of the COVID-19 pandemic can be transmitted alongglobal supply chains. We show that, via the global supply chain, COVID-19 casesabroad and, in particular, pandemic-control policies by foreign governments re-duced new job creation in China by 11.0%. We also find that Chinese firms mostexposed to international trade outperformed other firms at the beginning of thepandemic but underperformed during the recovery as the novel coronavirus spreadthroughout the world. Our findings regarding the importance of global supplychains in the transmission of the COVID-19 shock across national borders suggestthe importance of global cooperation in the fight against the pandemic and thespread of the novel coronavirus. As long as the pandemic is still raging in someparts of the world, there is a chance for a second or even third wave of infectionsin some parts of the world. As such, our results suggest that, for the global econ-omy to recover as quickly as possible from the deep pandemic-induced recession,countries need to work together due to the close linkages of global production.Recoveries in other countries will serve as a force that pulls the rest of the worldout of the recession, whereas “beggar-thy-neighbor” policies will only prolong therecession.
References
[1] Hanming Fang, Long Wang, and Yang Yang. Human mobility restrictionsand the spread of the novel coronavirus (2019-ncov) in China. Forthcoming.Journal of Public Economics, 2020.
[2] Solomon Hsiang, Daniel Allen, Sebastien Annan-Phan, Kendon Bell, Ian Bol-liger, Trinetta Chong, Hannah Druckenmiller, Luna Yue Huang, Andrew Hult-gren, Emma Krasovich, et al. The effect of large-scale anti-contagion policieson the COVID-19 pandemic. Nature, 584(7820):262–267, 2020.
11

[3] Benjamin F Maier and Dirk Brockmann. Effective containment explainssubexponential growth in recent confirmed COVID-19 cases in China. Science,368(6492):742–746, 2020.
[4] Pol Antras. Global production: Firms, contracts, and trade structure. Prince-ton University Press, 2015.
[5] R Baldwin and R Freeman. The COVID concussion and supply-chain conta-gion waves. VoxEU. org, 1, 2020.
[6] Barthelemy Bonadio, Zhen Huo, Andrei A Levchenko, and Nitya Pandalai-Nayar. Global supply chains in the pandemic. Technical report, NationalBureau of Economic Research, 2020.
[7] Alessandro Sforza and Marina Steininger. Globalization in the time ofCOVID-19. 2020.
[8] Murillo Campello, Gaurav Kankanhalli, and Pradeep Muthukrishnan. Cor-porate hiring under covid-19: Labor market concentration, downskilling, andincome inequality. Technical report, National Bureau of Economic Research,2020.
[9] Eliza Forsythe, Lisa B Kahn, Fabian Lange, and David Wiczer. Labor demandin the time of COVID-19: Evidence from vacancy postings and UI claims.Journal of Public Economics, 189:104238, 2020.
[10] Lena Hensvik, Thomas Le Barbanchon, and Roland Rathelot. Job searchduring the COVID-19 crisis. 2020.
[11] David Baqaee and Emmanuel Farhi. Nonlinear production networks withan application to the covid-19 crisis. Technical report, National Bureau ofEconomic Research, 2020.
[12] Jean-Noel Barrot and Julien Sauvagnat. Input specificity and the propagationof idiosyncratic shocks in production networks. The Quarterly Journal ofEconomics, 131(3):1543–1592, 2016.
[13] Hanwei Huang. Germs, roads and trade: Theory and evidence on the valueof diversification in global sourcing. Available at SSRN 3095273, 2017.
[14] Christoph E Boehm, Aaron Flaaen, and Nitya Pandalai-Nayar. Input linkagesand the transmission of shocks: firm-level evidence from the 2011 Tohokuearthquake. Review of Economics and Statistics, 101(1):60–75, 2019.
12

[15] Pol Antras, Stephen J Redding, and Esteban Rossi-Hansberg. Globalizationand pandemics. Technical report, Harvard University Working Paper, 2020.
[16] T Thanh Le, Zacharias Andreadakis, Arun Kumar, R Gomez Roman, StigTollefsen, Melanie Saville, and Stephen Mayhew. The COVID-19 vaccinedevelopment landscape. Nat Rev Drug Discov, 19(5):305–306, 2020.
[17] Barney S Graham. Rapid COVID-19 vaccine development. Science, 368(6494):945–946, 2020.
[18] Anthony S Fauci, H Clifford Lane, and Robert R Redfield. Covid-19navigatingthe uncharted. N Engl J Med, 382:1268–1269, 2020.
[19] Huan Wang, Zhang Markus, Li Robin, Zhong Oliver, Johnstone Hannah,Zhou Huan, Xue Hao, Sylvia Sean, Boswell Matthew, Loyalka Prashant, andRozelle Scott. Tracking the impact of covid-19 in rural China over time.Technical report, Rural Education Action Program Stanford University, 2020.
[20] JaeBin Ahn, Amit K Khandelwal, and Shang-Jin Wei. The role of intermedi-aries in facilitating trade. Journal of International Economics, 84(1):73–85,2011.
[21] Ensheng Dong, Hongru Du, and Lauren Gardner. An interactive web-baseddashboard to track COVID-19 in real time. The Lancet infectious diseases,20(5):533–534, 2020.
[22] Thomas Hale, Samuel Webster, Anna Petherick, Toby Phillips, and BeatrizKira. Oxford Covid-19 government response tracker. Blavatnik School ofGovernment, 25, 2020.
[23] Andrew B Bernard, J Bradford Jensen, Stephen J Redding, and Peter KSchott. Firms in international trade. Journal of Economic perspectives, 21(3):105–130, 2007.
[24] Sergio Correia. A feasible estimator for linear models with multi-way fixedeffects. Preprint at http://scorreia. com/research/hdfe. pdf, 2016.
13

Tables
Table 1: Summary Statistics: City Weekly Data
Variable Definition Mean Std. Dev. Min Maxjobs number of jobs 2541.2 19921.8 0 1,347,803n number of ads 499.3 2798.3 0 120,562localCovid number of confirmed new COVID-19 cases in the local city 1.98 136.2 -32 22,877domCovid number of confirmed new COVID-19 cases in other domestic cities weighted by distance 2.38 16.7 -.115 912.9expCovid number of confirmed new COVID-19 cases in export destinations weighted by export share 1284. 8 7032.3 -170.6 137,381.2impCovid number of confirmed new COVID-19 cases in source countries weighted by import share 1212.8 7934.2 -201.5 220,644expBorderControl COVID-19 policy shocks in export destinations weighted by export share 0.29 0.853 0 4impBorderControl COVID-19 policy shocks in import source countries weighted by import share 0.28 0.852 0 4Spring Spring Festival Dummy 0.025 0.155 0 1Autumn Autumn Hiring Season Dummy 0.016 0.127 0 1
Notes. Observations = 40,748. The sample covers 334 cities (including four provincial-level cities: Beijing, Shanghai, Tianjin, andChongqing) and 122 weeks of data from January 1, 2018, to April 30, 2020. The COVID shocks are measured in terms of the numberof new cases for each region and each week. For details concerning the construction of COVID-19 variables, see Appendix S1.1.
14

Table 2: COVID-19 shocks and local job creation
Dependant variable ln(number of jobs)
(1) (2) (3) (4)
ln(localCovid) -0.313∗∗∗ -0.172∗∗∗ -0.188∗∗∗ -0.179∗∗∗
(0.0392) (0.0359) (0.0388) (0.0367)
ln(domCovid) -0.142∗∗∗ -0.203∗∗∗ -0.175∗∗∗
(0.0195) (0.0217) (0.0209)
ln(expCovid) -0.0544∗∗∗ -0.0110(0.0161) (0.0197)
ln(impCovid) -0.0290∗ -0.00555(0.0150) (0.0175)
expBorderControl -0.175∗∗
(0.0676)
impBorderControl -0.0318(0.0316)
Control Variables Y Y Y YMonth Fixed Effect Y Y Y YCity × Year Fixed Effect Y Y Y Yadjusted R squared 0.822 0.823 0.824 0.824No. of observations 40641 40641 40641 40641
Note. The control variables are time dummies that capture major hiring seasons in spring
and autumn. The definitions of the variables are shown in Table 1. To address the issue of
zeros in the data, we do an ln(1 + x) transformation for variables with zeros. The models
are estimated using the Stata reghdfe package developed by Correia (24). The number of
observations is different from those in Table 1 because reghdfe drops singletons. The numbers
in the parentheses are robust standard errors, clustered at the provincial level. Significance
levels are indicated by *, **, *** at 0.1, 0.05, and 0.01, respectively.
15

Table 3: Foreign COVID shocks: trade intermediaries versus other firms
Dependant variable ln(number of jobs)
(1) (2) (3) (4)ln(expCovid) × intermediary -0.0484∗∗∗
(0.00784)
ln(impCovid) × intermediary -0.0526∗∗∗
(0.00663)
expBorderControl × intermediary -0.0790∗∗∗
(0.0177)
impBorderControl × intermediary -0.0923∗∗∗
(0.0214)Control Variables Y Y Y YMonth Fixed Effect Y Y Y YCity × Year Fixed Effect Y Y Y Yadjusted R squared 0.839 0.839 0.839 0.839No. of observations 80628 80628 80628 80628
Notes. This table uses data that aggregate job postings, by trade intermediaries and
other firms, for each city and week. The controls include the dummy for trade inter-
mediary, ln(localCovid), ln(domCovid), ln(expCovid), ln(impCovid), expBorderControl,
impBorderControl, dummies for the Spring Festival, and the autumn hiring seasons. Table
1 provides the definition for these variables. To address the issue of zeros in the data, we do
an ln(1 + x) transformation for variables with zeros. The models are estimated using the
Stata reghdfe package developed by Correia (24), which drops singletons during estimation.
The numbers in the parentheses are robust standard errors, clustered at the provincial level.
Significance levels are indicated by *, **, *** at 0.1, 0.05, and 0.01, respectively.
16

Figures
-2
-1
0
1
-4 -2 0 2 4 6 8 10 12 14
Loss
in th
e nu
mbe
r of p
oste
d jo
bs (
unit:
mill
ions
)
Weeks from Wuhan Lockdown
Figure 1: Loss in the number of posted jobs
Notes. This figure is a plot of the weekly loss in the number of posted jobs on the platform
during the COVID-19 outbreak in China compared to the average of the years 2018 and
2019. To ensure that the weeks are comparable across years, we align the data to the lunar
calendar and set Week 0 of 2018 and 2019 to the week of the Spring Festival. From Weeks
0 to 13, the cumulative job loss was 3.79 million, representing a 31.2% loss in local labor
demand.
17

0%
10%
20%
30%
40%
50%
60%
70%
80%
90%
100%
-2 -1 0 1 2 3 4 5 6 7 8 9 10 11 12 13
CON
TRIB
UTI
ON
WEEKS FROM WUHAN LOCKDOWN
expCovid impCovid expBorderControl impBorderControl localCovid domCovid
Figure 2: Contribution to reduction in job creation by component
Notes. In this figure, the bars plot the contribution of each shock to the reduction in job
creation, according to the estimation result shown in Column (4) of Table 2.We compute
the implied reduction in the number of jobs according to the estimated coefficients and the
observed shocks. We then compute the share of each shock by dividing the implied reduction
in job creation for a shock by the total implied reduction. The definition of each shock is
provided in Table 1.
18
-100%
-80%
-60%
-40%
-20%
0%
20%
40%
60%
80%
-4 -2 0 2 4 6 8 10 12 14
Estim
ated
loss
in p
oste
d jo
bs
Weeks From Wuhan Lockdown
Trade Intermediaries Other firms
Figure 3: Estimated loss in posted jobs by firm type
Notes. In this figure, we plot the estimated loss in posted jobs for trade intermediaries and
other firms using Eq. (S5).
19

Appendix
S1 Technical Details
S1.1 Measurements
To capture the foreign COVID-19 shocks, we construct the following variables,
expCovidit =∑j
expijNjt, (S1)
which captures export demand shocks, and
impCovidit =∑j
impijNjt, (S2)
which captures import supply shocks, where expij is the share of city i’s exportsto foreign region j, impij is the share of city i’s imports from j, and Njt is thenumber of newly confirmed cases in region j at period t. Similarly, we measurethe exposure of each city to foreign COVID-19 policies using
expBorderControlit =∑j
expijBorderControljt, (S3)
impBorderControlit =∑j
impijBorderControljt.
where BorderControljt is the border control policy imposed by region j at periodt. To measure the exposure of local labors market to shocks from other domesticcities, we construct the following variable
domesticCovidit =∑k 6=i
1/distik∑j 6=i 1/distij
Nkt, (S4)
which weights the exposure of city i to the pandemic in city k in terms of the num-ber of cases Nkt by the inverse of the great-circle distance 1/distik. We normalizethe weights such that they add up to one.
S1.2 Estimating equation for trading firms and other firms
To compare the impact of the COVID-19 shock on trade intermediaries versusother firms, we split firms in a given city into two groups: trade intermediariesand other firms, and then aggregate the job postings by group for each city and
A1

each week. Then we define dummies Interikt and Othersikt = 1−Interikt for tradeintermediaries and other firms, respectively. We then run the following regression,
ln(jobsikt) = γInterikt +M∑
τ=−m
ατ · Interikt · Tτ−t +M∑
τ=−m
βτ ·Othersikt · Tτ−t+
+Mt + Springt + Autumnt + CityY earit + εikt, (S5)
where Tτ−t is a time dummy which equals one if time t is τ periods away fromthe Wuhan Lockdown. ατ and βτ are the coefficients of interest which capturehow job postings by trade intermediaries and other firms evolved before and afterthe lockdown. To obtain the difference between ατ and βτ , we can substituteOthersikt = 1− Interikt into Eq. (S5) and get the following equation
ln(jobsikt) = γInterikt +M∑
τ=−m
δτ · Interikt · Tτ−t +M∑
τ=−m
dτTτ−t
+Mt + Springt + Autumnt + CityY earit + εikt, (S6)
where δτ = ατ − βτ . We plot the estimated δτ and associated ninety-five percentconfidence intervals in Figure S2.
A2

S2 Additional Figures0
200000
400000
600000
800000
−20 0 20 40 60weeks from the Spring Festival
2018 2019 2020
Nationwide
(a)0
10000
20000
30000
40000
−20 0 20 40 60weeks from the Spring Festival
2018 2019 2020
Wuhan
(b)
Figure S1: Weekly number of job ads: Nationwide and Wuhan
Notes. The figures plot the number of posted ads. Figure (a) is for the whole nation and
figure (b) is for the Wuhan city.
−2
−1
01
2
−3 −2 −1 0 1 2 3 4 5 6 7 8 9 10 11 12 13weeks from Wuhan Lockdown
Figure S2: COVID-19 and job creation: trade intermediaries versus other firms
Notes. This figure plots the coefficients of interaction terms between time dummies and a
dummy for trade intermediaries from a difference-in-difference estimation using data that
aggregate job postings by trade intermediaries and other firms for each city and period. The
dash lines represent 95% confidence intervals, which are constructed by clustering standard
errors at the provincial level.
A3

S3 Additional Tables
Table S1: COVID-19 and the number of job ads
Dependant variable ln(number of job ads)
(1) (2) (3) (4)
ln(localCovid) -0.306∗∗∗ -0.180∗∗∗ -0.195∗∗∗ -0.186∗∗∗
(0.0351) (0.0334) (0.0368) (0.0340)
ln(domCovid) -0.127∗∗∗ -0.191∗∗∗ -0.162∗∗∗
(0.0135) (0.0153) (0.0141)
ln(expCovid) -0.0458∗∗∗ -0.00120(0.00937) (0.00992)
ln(impCovid) -0.0407∗∗∗ -0.0148∗
(0.00858) (0.00819)
expBorderControl -0.174∗∗∗
(0.0376)
impBorderControl -0.0440∗
(0.0242)
Control Variables Y Y Y YMonth Fixed Effect Y Y Y YCity × Year Fixed Effect Y Y Y Yadjusted R squared 0.882 0.883 0.885 0.885No. of observations 40641 40641 40641 40641
Notes. The dependant variable is the number of job ads in each city. The control variables
are time dummies that capture major hiring seasons in the spring and autumn. To address
the issue of zeros in the data, we do an ln(1 + x) transformation for variables with zeros.
The models are estimated using the Stata reghdfe package developed by (24), which drops
singletons during estimation. The numbers in the parentheses are robust standard errors,
clustered at the provincial level. Significance levels are indicated by *, **, *** at 0.1, 0.05,
and 0.01, respectively.
A4

Table S2: COVID-19 and job creation: robustness check on variables
Dependant variable ln(number of jobs)
(1) (2) (3) (4)localCovid/population -1596.9∗∗∗ 825.2 854.8 866.9
(343.3) (627.7) (649.1) (656.3)
domCovid/population -42797.6∗∗∗ -43615.5∗∗∗ -43894.8∗∗∗
(14261.6) (14767.6) (14891.6)
ScaledExpCovid/population -2164.6∗∗∗ 1555.2(782.9) (1299.9)
ScaledImpCovid/population -2594.8∗∗ 926.5(1089.9) (2034.2)
ScaledExpPolicy -0.0124∗∗
(0.00542)
ScaledImpPolicy -0.0106∗
(0.00529)Control Variables Y Y Y YMonth Fixed Effect Y Y Y YCity × Year Fixed Effect Y Y Y Yadjusted R squared 0.827 0.828 0.828 0.828No. of observations 39567 39567 39567 39567
Notes. In this table, the numbers of newly confirmed COVID-19 cases in domestic cities and
foreign regions/countries are normalized by the local population. When considering foreign
COVID-19 shocks faced by a Chinese city, we scale the shocks by the city export to GDP ratio
and import to GDP ratio (variables with prefix ”ScaledExp” and ”ScaledImp,” respectively).
For the policy variables (”ScaledExpPolicy” and ”ScaledImpPolicy”), we consider a wider
spectrum of policies used by governments to contain the epidemic than border controls. The
control variables are time dummies that capture major hiring seasons in spring and autumn.
The models are estimated using the Stata reghdfe package developed by Correia (24), which
drops singletons during the estimation. The numbers in the parentheses are robust standard
errors clustered at the provincial level. Significance levels are indicated by *, **, *** at 0.1,
0.05, and 0.01, respectively.
A5

Table S3: COVID-19 and job creation: robustness check on the transformation
Dependant variable ln(number of jobs)
(1) (2) (3) (4)
ln(1-min(localCovid)+ localCovid) -0.714∗∗ -0.326∗∗ -0.311∗∗ -0.323∗∗
(0.264) (0.150) (0.149) (0.149)
ln(1-min(domCovid)+domCovid) -0.194∗∗∗ -0.285∗∗∗ -0.218∗∗∗
(0.0154) (0.0207) (0.0180)
ln(1-min(expCovid)+expCovid) -0.0908∗∗∗ -0.00370(0.0228) (0.0225)
ln(1-min(impCovid)+impCovid) -0.0569∗∗ 0.0188(0.0221) (0.0259)
expBorderControl -0.206∗∗∗
(0.0528)
impBorderControl -0.0646∗∗
(0.0262)
Control Variables Y Y Y YMonth Fixed Effect Y Y Y YCity × Year Fixed Effect Y Y Y Yadjusted R squared 0.821 0.823 0.824 0.824No. of observations 40710 40710 40710 40710
Notes: Our baseline uses the ln(1 + x) transformation which drops observations that are
negative. In this table, we use a ln(1 − (min(x)) + x) transformation and include those
negative observations. The control variables are time dummies which capture major hiring
seasons in spring and autumn. The models are estimated using the Stata reghdfe package
developed by Correia (24) which drops singletons during estimation. The numbers in the
parentheses are robust standard errors clustered at the provincial level. Significance levels
are indicated by *, **, *** at 0.1, 0.05 and 0.01, respectively.
A6

S4 Additional results for trading firms
Instead of estimating a dynamic difference-in-difference specification given by Eq.(S6), we estimate the following specification
ln(jobsikt) = γInterikt + α1T1t + α2T2t + β1Interikt · T1t + β2Interikt · T2t+Mt + Springt + Autumnt + CityY earit + εikt (S7)
T1t is a time dummy for periods in which the epicenter was China (from theweek of Wuhan lockdown to Week 6), and T2t is a dummy for periods in whichthe epicenter was outside China (Weeks 7 - 13). The result of the estimation isshown in Table S4. According to Column (1), the number of jobs posted by tradeintermediaries is much lower than that of other firms in general. As expected, whenthe coronavirus hit China, firms reduced their job postings, and as the epicentermoved outside China, there was a slight recovery of job creation. In Column (2),when we introduce the interaction term, we find that trade intermediaries’ jobpostings fell by less than other firms. However, as the epicenter moved outsideChina, their job postings fell much deeper than other firms. A similar patternholds for the number of job ads when we look at Columns (3) and (4).
So far, we have defined firms to be trade intermediaries by their names, whichmight miss other firms which also participate in international trade directly. Todeal with such concern, we exploit another a variable in our job posting data whichdescribes the main business of the firm. We look for Chinese characters meaning“import”, “export”, or “trade”. Together with information from the firm name,we enlarge the sample of trade firms to about 10 percent of the population of firmsin our data. Using the broader definition of trading firms, we again estimate Eq.(S7). Table S5 presents the estimation results. Overall, we find a pattern similarto the results in Table S4.
A7

Table S4: Job creation by trade intermediaries versus other firms: robustnesschecks
Dependent Variable: ln(total number of jobs) ln(total job ads)
(1) (2) (3) (4)Epicenter in China × intermediary 0.471∗∗∗ 0.494∗∗∗
(0.0494) (0.0380)
Epicenter outside China × intermediary -0.432∗∗∗ -0.246∗∗∗
(0.0423) (0.0238)
Intermediary -3.626∗∗∗ -3.628∗∗∗ -2.897∗∗∗ -2.911∗∗∗
(0.171) (0.171) (0.148) (0.147)
Epicenter in China -0.664∗∗∗ -0.905∗∗∗ -0.588∗∗∗ -0.839∗∗∗
(0.0636) (0.0635) (0.0458) (0.0421)
Epicenter outside China -0.539∗∗∗ -0.330∗∗∗ -0.541∗∗∗ -0.424∗∗∗
(0.0729) (0.0798) (0.0410) (0.0355)Control Variables Y Y Y YMonth Fixed Effect Y Y Y YCity × Year Fixed Effect Y Y Y Yadjusted R squared 0.838 0.839 0.868 0.869No. of observations 80765 80765 80765 80765
Notes. This table uses data that aggregate job postings by trade intermediaries and other
firms for each city and period. The control variables are time dummies that capture major
hiring seasons in spring and autumn. The models are estimated using the Stata reghdfe
package developed by Correia (24) which drops singletons during estimation. The numbers
in the parentheses are robust standard errors clustered at the provincial level. Significance
levels are indicated by *, **, *** at 0.1, 0.05 and 0.01, respectively.
A8

Table S5: Job creation by trade intermediaries versus other firms: robustnesschecks
Dependent Variable: ln(total number of jobs) ln(total job ads)
(1) (2) (3) (4)Epicenter in China × intermediary 0.283∗∗∗ 0.278∗∗∗
(0.0437) (0.0314)
Epicenter outside China × intermediary -0.268∗∗∗ -0.178∗∗∗
(0.0565) (0.0210)
Intermediary -2.958∗∗∗ -2.964∗∗∗ -2.373∗∗∗ -2.383∗∗∗
(0.124) (0.124) (0.108) (0.107)
Epicenter in China -0.620∗∗∗ -0.762∗∗∗ -0.551∗∗∗ -0.690∗∗∗
(0.0688) (0.0591) (0.0452) (0.0386)
Epicenter outside China -0.583∗∗∗ -0.450∗∗∗ -0.599∗∗∗ -0.511∗∗∗
(0.0848) (0.0973) (0.0498) (0.0468)Control Variables Y Y Y YMonth Fixed Effect Y Y Y YCity × Year Fixed Effect Y Y Y Yadjusted R squared 0.831 0.832 0.873 0.873No. of observations 81272 81272 81272 81272
Notes. This table uses data that aggregate job postings by trade intermediaries and other
firms for each city and period. Trade intermediaries are identified using information from
the firm name and a variable describing the firm’s main business. The control variables are
time dummies that capture major hiring seasons in spring and autumn. The models are
estimated using the Stata reghdfe package developed by Correia (24) which drops singletons
during estimation. The numbers in the parentheses are robust standard errors clustered at
the provincial level. Significance levels are indicated by *, **, *** at 0.1, 0.05 and 0.01,
respectively.
A9


![WHOLE OF - SOCIETY PANDEMIC READINESS€¦ · • Pandemics ARE worldwide epidemics • Pandemics ARE unpredictable [Origin - Timing - Severity - Duration] • Pandemics HAVE happened](https://static.fdocuments.in/doc/165x107/60219e6a89cf726c976d409c/whole-of-society-pandemic-readiness-a-pandemics-are-worldwide-epidemics-a.jpg)