Pandemic influenza: A 21st century model for mortality shocks · influenza: A 21st century model...
93
Pandemic influenza: A 21st century model for mortality shocks Technical publishing Life & Health
Transcript of Pandemic influenza: A 21st century model for mortality shocks · influenza: A 21st century model...

Pandemic influenza: A 21st century model for mortality shocks
Technical publishingLife & Health

Pandemic influenza:A 21st century model for mortality shocks

3 Swiss Re: Pandemic influenza
Foreword 4
Executive summary 5
1 Avian influenza 91.1 Prevalence 91.2 Outbreaks 101.3 Transmission to humans 111.4 The pandemic risk 131.5 Conclusions 14
2 Human influenza infections 162.1 The persistence of human influenza infections 162.2 Structure of the influenza virus: types, subtypes and strains in circulation 172.3 Causes and symptoms of influenza in humans 182.4 Diagnosis, treatment and prevention of influenza 202.5 Groups at risk of influenza complications 232.6 Conclusions 23
3 Influenza pandemics in history 253.1 Historical frequency and severity 253.2 Influenza pandemics 1700 –1900 263.3 Influenza pandemics of the 20th century 283.4 Why was the 1918 –1919 pandemic so severe? 303.5 Conclusions 35
4 Current situation 374.1 International agencies and their activities 374.2 International health regulations 404.3 Major advances in medical knowledge and treatment 404.4 Influenza vaccines 424.5 Antivirals 444.6 Antibiotics 464.7 Conclusions 46
5 Swiss Re’s pandemic influenza model 485.1 Objectives and scope of the model 485.2 Methodology 495.3 Limitations 635.4 Results 635.5 Conclusions 70
6 Mortality shocks and capital requirements 736.1 Severity 736.2 Regulatory capital 746.3 Rating agency capital 776.4 Economic capital 786.5 Conclusions 79
Appendix A – Influenza mortality in the insured population 80A.1 Historical observations on pandemic experience in insured groups 80A.2 Chronic disease burden and socio-economic status 83A.3 The relevance of historical findings for future pandemics 85A.4 Conclusions 87
Appendix B – Impact on casualty lines 88B.1 Duties of care 88B.2 Implications for specific casualty lines of business 90
Contents

4 Swiss Re: Pandemic influenza
Earlier this year, as part of our contribution to industry dialogue on the impact of an influenza pandemic on life insurance business, Swiss Re launched a new publication entitled “Influenza pandemics: Time for a reality check?”. At the time, we indicated that a more detailed publication would be produced on this topic by mid-2007. We are there-fore pleased to issue this new publication in our technical publishing series, in which we expand upon the scope and depth of our earlier report.
Currently within our industry, there is much interest – and some speculation – about the possible mortality impact from an influenza pandemic. Pandemic influenza is a material risk that has the potential to affect all life insurance markets around the world. However, it is not easy to specify the loss value from such an event, and therefore the amount of capital to hold.
Swiss Re has developed a sophisticated epidemiological model to improve our under-standing of the potential range of outcomes from a pandemic. This new report, “Pandemic influenza: A 21st century model for mortality shocks”, provides extensive commentary on the workings of the model, and discussion of the results derived from it. We believe that the output from the model will assist both insurers and regulators in considering how to manage the risk of a one-time “mortality shock” arising from an influenza pan-demic. Swiss Re is grateful to Professor Neil Ferguson of Imperial College London for the work he has done in reviewing the model.
Against the background of avian influenza and human influenza history and treatment, the report contains our estimate of the excess mortality likely to arise within insured populations in a 1-in-200-year severity pandemic. Drawing extensively on authoritative external sources, it also contains an analysis of the world’s worst influenza pandemic in 1918, along with a quantification of how the many changes that have occurred since that time would impact mortality from a similar virus in a modern day setting. These are headline results; the model is capable of simulating a wide range of pandemic scenarios to help us understand potential mortality experience in the event of an influenza pan-demic.
With the growing interest in developing internal models, and the move towards princi-ples-based supervisory approaches in many markets, this is the ideal time to consider the appropriate levels of excess mortality in capital models. Swiss Re is pleased to be making a key contribution to this highly topical issue.
Christian MumenthalerChief Risk OfficerSwiss Re
Foreword

5 Swiss Re: Pandemic influenza
Although mortality has generally been improving for many decades, life insurers still face the risk that an influenza pandemic could cause a one-time mortality shock. Influenza pandemics, however, are rare and unpredictable events. It is impossible to know when another pandemic will arise and, if it does, how severe it will be. Given this uncertainty, it is not easy to specify in advance the loss value from such an event, and therefore – for life insurers – the amount of capital to hold.
The current widespread outbreaks of highly pathogenic H5N1 avian influenza in birds have raised concern among public health experts about the possibility of a human influ-enza pandemic. While it is very difficult and rare for humans to be infected with H5N1, or any other avian influenza, the high death rate experienced among those who have been infected has also caused general concern.
At the same time, in the insurance industry there is a move away from detailed prescrip-tive solvency rules and supervisory actions to a principles-based approach, under which the insurer has the management responsibility to decide how best to match its business objectives with the outcomes specified by its regulator. This emerging environment has led to an increase in the interest in, and the use and calibration of, internal models.
Swiss Re has significant exposure to mortality risk through its life and health business, and recognises that pandemic influenza is a material risk that has the potential to affect all markets around the world. Swiss Re constantly and closely monitors the development of potential epidemics and pandemics, and has recently developed a sophisticated epi-demiological model to improve understanding of the potential range of outcomes from a pandemic, better enabling insurers to hold appropriate capital for this risk.
This report provides a detailed description of the methodology used in the model, and the results that can be produced. This description is provided against a background which considers the significance of the current outbreaks of avian influenza, documents the characteristics and history of human influenza pandemics, discusses and quantifies the impact of the range of interventions available to mitigate the effect of an influenza pan-demic, and outlines mortality-shock capital considerations and requirements.
Avian influenzaChapter 1 begins with a discussion of avian influenza, serving as a reference point from which to understand the significance of the current outbreaks of the highly pathogenic H5N1 “bird flu”. The chapter describes how avian influenza is common in birds, and al-ways has been. The ongoing outbreaks of H5N1 in birds, and subsequent infections and deaths in humans, make H5N1 a very visible strain of avian influenza. However, overall levels of avian influenza in bird populations do not, in themselves, indicate that the pan-demic risk is greater today than at any other time in the past.
In assessing the pandemic risk from avian influenza strains, the chapter notes that influ-enza viruses are highly species-specific, and that avian influenza viruses only infect other species, such as humans, on very rare occasions. H5N1 must undergo a series of genet-ic changes before it can become contagious in humans.
Human influenza infectionsChapter 2 discusses how, through frequent structural changes, the influenza virus can cause annual outbreaks and thereby continue to infect humans. Pandemics can occur when a new strain emerges – through antigenic drift or genetic reassortment – that has the capacity to be easily transmitted among humans.
Our modern-day understanding of the causes and transmission of influenza, its course of infection, and the body’s response, indicate which medical and non-medical interventions are likely to be successful in treating cases and preventing or slowing a pandemic. Various options for treatment are currently available, and this chapter discusses the effects of vaccination, antiviral medications and rest, fluids and medicines to reduce fever. The chapter notes how antibiotics have had a significant effect on influenza and pneumonia mortality rates due to their effectiveness in treating secondary bacterial pneumonia.
Executive summary

6 Swiss Re: Pandemic influenza
Influenza pandemics in historyIn seeking to establish those characteristics which were common to all past pandemics and those that differed between each of these events, Chapter 3 reviews the historical record of influenza pandemics. The past shows that influenza pandemics are rare events, with only 10 to 13 having occurred in the last 300 years. While the frequency of occur-rence of pandemics is irregular, measures of severity have been more consistent, all caus-ing high morbidity. Other than in the 1918 pandemic, however, mortality has been low, with the majority of deaths occurring among the elderly.
It is very clear from the historical record that the 1918 pandemic was a unique event in several respects: mortality was exceptionally high, and a high proportion of the deaths were among young adults. Chapter 3 discusses possible explanations for this uniqueness.
Current situationMuch has changed in the last hundred years in terms of what we know about the influ-enza virus, how it causes infection, how infections spread and how to treat and prevent them. These advances in knowledge, treatment and pandemic preparedness are chroni-cled and described in Chapter 4.
A range of major developments has occurred since the beginning of the last century. The World Health Organisation (WHO) and other international agencies responsible for man-aging global disease have been formed, antibiotics have been discovered, the influenza virus has been isolated, international health regulations have been adopted, influenza vaccines have become available and antiviral drugs have been approved. Some of these changes, on their own, have significantly reduced influenza mortality. Together, they have the potential to greatly reduce future pandemic morbidity and mortality.
Swiss Re’s pandemic influenza modelTaking all of this into account, Chapter 5 then describes how Swiss Re has modelled the spread of an influenza pandemic in order to understand the potential range of mortality outcomes.
The section on methodology explains how the model has been constructed, such that it needs only two input variables – lethality and reproductive value at time zero (R0) – from which to derive all other variables and the eventual outcome. The model works by ran-domly selecting these two variables from distributions that have been calibrated to past pandemics and then uses these values as ‘seeds’ to produce estimates of the resulting excess mortality. This process is repeated to produce many thousands of hypothetical pandemics, with each simulation producing an estimate of the corresponding excess mortality.
Using the model, Swiss Re has estimated that, in most developed countries, a 1-in-200-year severity pandemic would give rise to excess mortality of between 1 and 1.5 deaths per 1 000 lives within an insurance-aged group of people. Results presented in the chap-ter also show how different age groups are expected to experience very different rates of excess mortality, depending on the lethality of the virus.
The sensitivity of results to changes in the variables within the model is tested to illustrate the significance of the uncertainties surrounding future pandemics and assumptions made in the modelling process. In light of H5N1, Swiss Re has also explored the sensitivity of the model to changes in the frequency of severe pandemics.
At the end of the chapter, it is shown how the excess mortality of a 1918-like pandemic would be significantly reduced by taking account of changes in population age structure, healthcare, vaccines, antivirals and antibiotics.
Executive summary

7 Swiss Re: Pandemic influenza
Mortality shocks and capital requirementsIn considering how much capital insurers should hold to withstand a mortality shock, Chapter 6 shows how different stakeholders have different perspectives on this question. However, all of these parties have a commercial perspective – compared with that of governments and international agencies such as the WHO, who have a social responsi-bility to prepare for the worst. For the examples given in the chapter, holding capital to withstand a 1-in-200-year severity event is consistent with regulators’ thinking on sol-vency.
AppendicesAppendix A presents evidence to support the view that risk selection and socio-economic status are factors that can result in improved outcomes associated with influenza in insured portfolios, as compared with an unselected general population.
Appendix B outlines how a pandemic also has the potential to have an impact on casualty business.

An Indonesian worker prepares to burn dead chickens as authorities slaughtered around 2 700 of them infected by the H5N1 virus in Jembrana in March 2007. If the disease is detected early enough, the mild virus can be eliminated by culling flocks before it has an opportunity to mutate into the highly pathogenic form.

9 Swiss Re: Pandemic influenza
Avian influenza, or “bird flu”, is an infectious disease of birds caused by strains of the influenza A virus 1. As influenza viruses are highly species-specific, they only infect other species, such as pigs and humans, on rare occasions.
1.1 Prevalence
Avian influenza is common in bird populations, and always has been.
There are hundreds of strains of avian influenza viruses, but they can all be classified into one of two forms, based on their virulence:
Low pathogenic avian influenza (LPAI), which affects only the respiratory tract. LPAI is common, but it only causes mild symptoms so it may easily go undetected unless surveillance of bird flocks and regular testing is carried out.Highly pathogenic avian influenza (HPAI), on the other hand, causes sudden disease in multiple organs, spreads very rapidly and has a mortality rate in birds approaching 100% within two days. It is far less common, but because it is so dramatic it is very hard to miss.
Virulence and pathogenicityBoth terms describe the ability of an organism to cause disease. They are frequently used interchangeably, but “virulence” may also describe the degree of pathogenicity.
Viruses that can cause highly pathogenic avian influenza are currently restricted to the H5 and H7 subtypes. Highly pathogenic viruses typically only emerge by mutation when a virus, carried in its mild form by a wild bird, is introduced into poultry2. Once in poultry, the previously stable mild virus begins to evolve rapidly and can mutate, over an unpre-dictable period of time, into a highly lethal version of the same initially mild strain. If the disease is detected early enough, the mild virus can be eliminated by culling flocks before it has an opportunity to mutate into the highly pathogenic form3.
All 16 HA (haemagglutinin) and nine NA (neuraminidase) subtypes of influenza viruses are known to infect wild waterfowl, therefore providing an extensive pool of influenza viruses perpetually circulating in bird populations. In wild birds, routine testing will nearly always find some influenza viruses, the vast majority of which cause no harm4. For exam-ple, extensive worldwide surveillance of migratory birds has isolated LPAI viruses in at least 105 wild bird species of 26 different families. Of the 36 species of ducks, all but one tested positive and, of the nearly 29 000 birds tested, 9.5% tested positive to the in-fluenza A virus5.
Of all forms of avian influenza, the highly pathogenic H5N1 is commonly perceived to pose the greatest threat in terms of its potential to start a human influenza pandemic. However, there are other strains of concern which are also being monitored for their potential to infect and cause disease in humans. For example, in Hong Kong LPAI H9N2 infected two children in 1999 and one child in 2003. Another five human cases were reported in Chinese literature, although no deaths were recorded. H7N7, discussed later in this chapter, is also of concern because it is highly pathogenic in birds and more readily transmissible from human to human.
1 See Chapter 2, section 2.2 for details of terminology relating to types, subtypes and strains of the influenza virus.2 While mutation is the normal pattern of emergence, a laboratory study has shown that domestic ducks infected
with the H5N1 virus can, without showing any signs of illness, act as “reservoirs” to carry and spread an exist-ing strain of the virus, ie, as distinct from a new, mutant strain.
3 Avian influenza: Assessing the pandemic threat. World Health Organisation, 2005.4 Avian influenza (“bird flu”) fact sheet. World Health Organisation, February 2006.5 Olsen B, Munster VJ et al. Global patterns of influenza A virus in wild birds. Science, Vol. 312, 21 April 2006.
1 Avian influenza

10 Swiss Re: Pandemic influenza
While the surveillance and subsequent detection of influenza viruses in birds has intensi-fied in recent decades, it is likely that these viruses have always been present in birds at the same or similar levels. On this basis, the present level of avian influenza in birds does not, in itself, signal a greater risk of an impending human influenza pandemic than at any other time in history.
1.2 Outbreaks
Outbreaks of highly pathogenic avian influenza have occurred frequently in bird popula-tions in the past decade.
While the 1878 outbreak in Italy, which caused extremely high mortality in chickens, was almost certainly of the highly pathogenic form, the first confirmed outbreak of HPAI was reported in Scotland in 1959. Since then, 24 outbreaks have been recorded worldwide, of which 11 have occurred in the last 10 years (see Table 1.1).
Period Region/country Subtype causing the outbreak 1997 Australia H7N4 Hong Kong H5N1 Italy H5N21999–2000 Italy H7N12002 onwards Hong Kong H5N1 Chile H7N32003 Netherlands H7N72004 Pakistan H7N3 United States H5N2 Canada H7N3 South Africa H5N2
Source: World Health Organisation, 2005 (see footnote 3)
The majority of these outbreaks have had only a very limited geographical spread. A few did not spread beyond a single farm or flock and, other than H5N1, only one spread inter-nationally6. All of the larger outbreaks were difficult to control, and it typically took two to three years to eliminate the virus. Of the outbreaks listed in Table 1.1, H5N1 and H7N7 are significant because they succeeded in crossing the species barrier into humans.
H5N1None of the outbreaks since 1959 have approached the size of the current outbreaks of the highly pathogenic H5N1 avian influenza7. The present and ongoing outbreaks of H5N1 in birds began in South-East Asia in 2003. They are unprecedented in terms of the number of countries affected and the deaths of so many birds.
In an initial wave of spread from December 2003 to February 2004, outbreaks were re-ported in poultry in the Republic of Korea, Vietnam, Japan, Thailand, Cambodia, Lao PDR, Indonesia and China. In a second wave, recurrences of H5N1 were reported in poultry in China, Indonesia, Thailand and Vietnam in June and July 2004. In August 2004, the dis-ease spread to poultry in Malaysia.
2005 saw the spread of the disease into poultry and/or wild birds in Russia, Kazakhstan, Mongolia, Turkey, Romania, Croatia and Ukraine. In 2006, the virus spread through the Middle East and Africa, and was detected in wild birds in many European states. Out-breaks in one or two poultry farms in Germany and France were also reported.
6 The outbreak originating in the Netherlands; see pages 11 and 12 for more details.7 World Health Organisation, 2005 (see footnote 3).
Table 1.1Highly pathogenic avian influenza outbreaks in the past decade
Table 1.1Highly pathogenic avian influenza outbreaks in the past decade
1 Avian influenza

11 Swiss Re: Pandemic influenza
In total, at the time of writing, confirmed occurrences of H5N1 (in some cases in only one bird) have now been reported to the World Organisation for Animal Health (OIE) in more than 50 countries8.
H7N7In February 2003, outbreaks of HPAI H7N7 were detected in various poultry farms in a poultry-dense part of the Netherlands. Despite the rapid implementation and enforce-ment of regulatory control measures, the outbreak eventually spread to a second region within the Netherlands – where it was controlled relatively quickly – and into Belgium and Germany. In the Netherlands, more than 30 million chickens from 1 145 commercial farms (255 with infection) and poultry from 16 490 hobby farms – a quarter of the country’s poultry stock – were destroyed in the course of two months. Some 2.7 million chickens were destroyed in Belgium and 400 000 in Germany9,10.
1.3 Transmission to humans
Transmission of avian influenza viruses to humans is a very rare event.
Given the huge numbers of birds infected in some of the HPAI outbreaks referred to above, and the numerous consequent opportunities for human exposure and infection, the number of documented human cases is comparatively low. It is not presently under-stood why some people, and not others, become infected following similar exposures11.
The first recorded instance of human infection with H5N1 was in Hong Kong in 1997. 18 people were infected, six of whom died. Since the virus re-emerged in birds in South-East Asia in 2003, more than 250 confirmed human cases have been reported to the World Health Organisation (WHO), as shown in Table 1.2.
The total number of cases includes the number of deaths. WHO reports only laboratory-confirmed cases. All dates refer to onset of illness.
Source: World Health Organisation, 11 April 2007 (www.who.int)
8 This information is periodically updated by the World Health Organisation; for the latest information visit www.who.int.
9 Weekly Epidemiological Record No. 10. World Health Organisation, 5 March 2004.10 INFOSAN Information Note No. 4/2006. Controlling avian influenza. World Heath Organisation,
14 August 2006.11 Avian influenza frequently asked questions. World Health Organisation, 5 December 2005.
Table 1.2Cumulative number of confirmed human cases of avian influenza A/(H5N1) reported to the WHO
Table 1.2Cumulative number of confirmed human cases of avian influenza A/(H5N1) reported to the WHO
2003 2004 2005 2006 2007 TotalCountry cases deaths cases deaths cases deaths cases deaths cases deaths cases deathsAzerbaijan 0 0 0 0 0 0 8 5 0 0 8 5Cambodia 0 0 0 0 4 4 2 2 1 1 7 7China 1 1 0 0 8 5 13 8 2 1 24 15Djibouti 0 0 0 0 0 0 1 0 0 0 1 0Egypt 0 0 0 0 0 0 18 10 16 4 34 14Indonesia 0 0 0 0 20 13 55 45 6 5 81 63Iraq 0 0 0 0 0 0 3 2 0 0 3 2Lao PDR 0 0 0 0 0 0 0 0 2 2 2 2Nigeria 0 0 0 0 0 0 0 0 1 1 1 1Thailand 0 0 17 12 5 2 3 3 0 0 25 17Turkey 0 0 0 0 0 0 12 4 0 0 12 4Vietnam 3 3 29 20 61 19 0 0 0 0 93 42Total 4 4 46 32 98 43 115 79 28 14 291 172

12 Swiss Re: Pandemic influenza
Of the few avian influenza viruses known to have crossed the species barrier, H5N1 has caused the largest number of cases of severe disease and death in humans. The disease caused by H5N1 often follows an unusually aggressive clinical course, with rapid deteri-oration and high fatality. In the present outbreak, more than half of those confirmed as infected with the virus have died12.
Evidence is limited and conflicting, however, on the extent of mild disease that has oc-curred in humans from H5N1. Mildly symptomatic cases have been reported by the WHO. Population-based surveys enquiring on flu-like illnesses among people living in villages where H5N1 outbreaks have occurred also suggest that such infections are possible13. But blood tests in other studies of people exposed to the disease have failed to find many asymptomatic individuals testing positive for the virus.
Avian H9N2 influenza A virus has caused repeated human infections in Asia since 1998. The virus isolated from a five-year-old girl hospitalised with an influenza-like illness in Hong Kong in 2003 was closely related to viruses circulating in poultry in the markets of Hong Kong. Given that the girl in question had no history of contact with domestic poultry prior to the illness, it seems likely that she contracted the virus indirectly from the markets14.
In the 2003 H7N7 outbreak in the Netherlands, virus infection was detected in 89 hu-mans, of whom 78 had conjunctivitis and one other died – a Dutch veterinarian, who died from respiratory distress one week after visiting an infected farm. Three of the 89 confirmed H7N7 cases were household contacts who had no known exposure to infected poultry. This strongly suggests that human-to-human transmission occurred15. A report published by the Dutch National Institute for Public Health and the Environment (RIVM) estimated that at least 1 000 people were infected with the avian influenza virus, includ-ing those who came into direct contact with infected poultry as well as others living in the same households as infected poultry workers16.
12 World Health Organisation, 2005 (see footnote 11).13 Thorson A, Petzold M et al. Is exposure to sick or dead poultry associated with flu-like illness? A population
based study from a rural area in Vietnam with outbreaks of highly pathogenic avian influenza. Archives of Internal Medicine, 2006; 166: 119–123.
14 Butt KM, Smith GJD et al. Human infection with an avian H9N2 influenza A virus in Hong Kong in 2003. Journal of Clinical Microbiology, November 2005; 5760–5767.
15 Human-to-human transmission of avian influenza A/H7N7, The Netherlands, 2003. Eurosurveillance, 2005; 10(12): 264–8.
16 Bosman A, Mulder YM et al. Executive summary, Avian flu epidemic 2003: Public health consequences, RIVM report 630940004/2004.
1 Avian influenza

13 Swiss Re: Pandemic influenza
1.4 The pandemic risk
According to any authoritative commentary on the topic, another influenza pandemic is inevitable.
As shown in Table 1.3, the WHO has a six-phase alert system for informing the world of the seriousness of the human influenza pandemic threat, and of the need to prepare pro-gressively more intensely for its impact. The world is presently in phase 3: a new influen-za virus subtype is causing disease in humans, but is not yet spreading efficiently and sustainably among humans.
Inter-pandemic phase Low risk of human cases 1
New virus in animals, no human cases Higher risk of human cases 2
Pandemic alert No or very limited human-to-human transmission
3
New virus causes human cases Evidence of increased human-to-human transmission
4
Evidence of significant human-to-humantransmission
5
Pandemic Efficient and sustained human-to-human transmission
6
Source: World Health Organisation
In order for a new human influenza pandemic to begin, the following three conditions must all be met:
a new influenza virus strain emerges (or one re-emerges that has not circulated for at least a generation), andthis virus is able to infect humans, causing serious sickness, andit must be capable of efficient transmission from human to human
Based upon this criteria, it is clear that the threat of a new human influenza pandemic is not related purely to the emergence of H5N1 in birds. Other influenza viruses with pan-demic potential may emerge or, as in the case of H9N2 and H7N7, may have emerged already.
Influenza viruses can improve their transmissibility among humans in one of two ways. The first is a ‘reassortment’ event, where genetic material is exchanged between human and avian viruses during co-infection of a human or pig. The second mechanism is a more gradual process of random mutation, whereby the capability of the virus to adhere to, and replicate in, human cells increases during subsequent infections of humans.
Table 1.3WHO six-phase pandemic alert systemTable 1.3WHO six-phase pandemic alert system

14 Swiss Re: Pandemic influenza
The human influenza pandemics of 1957 and 1968 were both caused by the first of the two mechanisms described above, ie, by avian-human reassortant influenza viruses that had acquired the ability to attach to, and infect, human respiratory cells. A series of ex-periments carried out by researchers at the US Centers for Disease Control and Preven-tion (CDC) suggested that significant genetic changes in the H5N1 virus would likely be needed to create a strain that could cause a pandemic. In these experiments, genes from a human H3N2 influenza virus were added to genes from an H5N1 avian influenza virus and tested in ferrets, whose susceptibility to influenza viruses is similar to that of humans. These ‘hybrid’ viruses did not pass easily between ferrets and, in fact, caused disease less severe than the original H5N1 virus. It remains unknown whether the H5N1 virus could reassort with a human influenza virus in nature17.
Since its first isolation in humans in 1997 (and since its first outbreak in birds in 1959), the H5N1 virus has proved unable to acquire the ability to transmit easily and sustainably among humans. Before it can do so, it must still undergo a series of genetic changes. Given that no H5 influenza subtype has ever caused a human influenza pandemic, it is possible that this virus will never be able to transmit efficiently from human to human.
In the handful of instances of possible human to human transmission, the virus has never spread beyond a first generation of close contacts. Data from these instances suggest that transmission requires very close contact with a sick person, ie, that there is a sub-stantial ‘species barrier’.
Notwithstanding the above, the risk that the H5N1 virus will acquire the ability to spread easily and sustainably among humans will persist as long as opportunities for bird-to-hu-man infections occur. These opportunities will, in turn, persist as long as the virus contin-ues to circulate in birds, and this situation could last for some years18. Regardless of whether H5N1 will ever be able to start an human influenza pandemic or not, there is no doubt that the current outbreaks need to be controlled and that the disease must be eliminated from birds.
1.5 Conclusions
The threat from H5N1 needs to be seen against the wider background of avian influenza more generally. Not only is avian influenza common in bird populations, but it always has been. Outbreaks of highly pathogenic avian influenza occur frequently, and the strains from some of these outbreaks have been able to infect humans far more easily than H5N1. There has never been a human influenza pandemic caused by an H5 influenza subtype, and it is clear that H5N1 must undergo a series of genetic changes before it can become contagious in humans – this will not happen overnight. Concerted and co-ordinated global efforts are being made to monitor, control and eliminate H5N1 from bird populations.
17 Maines T, Chen L et al. Lack of transmission of H5N1 avian-human reassortant influenza viruses in a ferret model. Proceedings of the US National Academy of Sciences, 2006; 103(32): 12121–6.
18 World Health Organisation, 2005 (see footnote 11).
1 Avian influenza

Close contact between animals and humans, as shown in this market in Bangkok, increases the potential for infection to cross between the species.
16 Swiss Re: Pandemic influenza
Influenza, or “flu”, is a common and highly infectious viral disease in humans, other mam-mals and birds. It is typically a seasonal infection, occurring in the autumn and winter months of the respective hemispheres. In the tropics, and occasionally on cruise ships, influenza may occur at any time of the year. In the United States, the number of cases of seasonal influenza averages between 15 and 60 million per year, of which around 36 000 people die19. The World Health Organisation (WHO) has used the number of US cases to estimate that the global burden of seasonal influenza may approach one billion cases annually, representing around 20% of the world’s population.
Various environmental factors cause influenza infections to peak in the autumn and winter months20. People spend more time indoors, including in group settings such as in schools, and in conditions of less humidity (heated buildings) and reduced air exchange (closed windows). The geographic distribution of the population, travel patterns and even the timing of school holidays have been associated with the differences in the timing and incidence of influenza infections across regions and countries.
2.1 The persistence of human influenza infections
The ability of the influenza virus to cause annual outbreaks is due to the regularly chang-ing structure of the proteins found on its surface. There are two processes which enable the virus to be an ongoing infectious disease in humans:
First, small defects in the replication of genetic viral material allow for slightly different strains to emerge from year to year. This ability to mutate slowly is a process known as antigenic drift. People’s immunity to the new virus is limited, allowing new influenza outbreaks to begin.A second process, antigenic shift, refers to the sudden introduction of a new influenza virus into the environment. Antigenic shift can occur in one of two ways. First, it can happen when an existing influenza virus infecting an animal becomes capable of di-rectly infecting a human. The second way for antigenic shift to occur is through the formation of a new virus through a mixing of genetic material from animal and human influenza viruses. This latter process occurs by genetic reassortment.
The propensity for the influenza virus to mutate in these different ways allows it to avoid recognition by the immune system and accounts for the ongoing presence of influenza in human populations, leading to sickness (morbidity) and, on rare occasions, death among those affected.
When a new strain21 emerges that has the capacity to be easily transmitted between humans, and to which humans have little or no immunity, the circumstances that poten-tially trigger a more significant influenza epidemic then come into play. If widespread infection occurs on a global scale, then the term pandemic is typically applied to the influenza outbreak. Influenza pandemics have occurred three times in the 20th century, and over previous centuries, and these have led to millions of deaths worldwide.
19 Key facts about influenza and the influenza vaccine. US Centers for Disease Control, 2006.20 Halstead SB. Human factors in emerging infectious disease. Eastern Mediterranean Regional Office, World
Health Organisation, 1996; 21–29.21 Opinions differ on the correct definition of a “strain” and a “subtype”. The box on the following page provides
one view on the differences between these definitions. However, in the interests of simplicity, throughout this publication the two terms are used interchangeably unless specified otherwise.
2 Human influenza infections

17 Swiss Re: Pandemic influenza
Pandemic or epidemic?A pandemic is an outbreak of an infectious disease over a wide geographic area that affects a large proportion of the population. An epidemic, however, only affects people in a smaller geographic area – one or several communities, for example.
Type, subtype or strain? Various terminology exists to describe and identify particular forms of influenza virus. While these terms are frequently used interchangeably, there are important differences between a “type”, a “subtype” and a “strain”. The US Centers for Disease Control provides the following guidance in respect of these definitions:
TypeRefers to influenza A, B, and CSubtypeRefers only to influenza A. Different subtypes of influenza A include H1N1, H3N2, H5N1 etc StrainNew strains of each of these influenza A subtypes, along with new strains of influenza B, emerge each year through small genetic mutations (antigenic drift)
2.2 Structure of the influenza virus: types, subtypes and strains in circulation
StructureThe influenza A virus is classified as an orthomyxovirus and is made up of eight strands of RNA (ribonucleaic acid) segments. These segments carry genetic code for several proteins. The combination of encoded proteins determines whether the influenza virus type is type A, B or C. Examples of proteins that are distributed across the surface of the influenza A virus include haemagglutinin (HA) and neuraminidase (NA). These are the characteristic spike-shaped structures illustrated in Figure 2.1.
PB1, PB2, PA
HA
NP
NA
M1
M2
NS2
NS1
While the text in the main body of this chapter focuses on HA and NA, for the sake of completeness all 10 proteins are illustrated in this diagram. The PB1, PB2, PA, M2 and NS1 proteins are referred to later in this publication in Chapter 3, section 3.4.
Source: Reproduced with the permission of Dr Markus Eickmann, Institute for Virology, Marburg, Germany (www.biografix.de)
Figure 2.1Structure of an influenza A virusFigure 2.1Structure of an influenza A virus

18 Swiss Re: Pandemic influenza
Types, subtypes and strains in circulation Of the three types of influenza, only influenza A and B cause widespread disease in hu-mans. Different subtypes of influenza A are identified by alphabetical and numerical des-ignators. These refer to the HA and NA proteins present on the surface of the influenza A viruses. Influenza B viruses are not categorised in this fashion. In total, there are 16 differ-ent HA subtypes (H1 to H16) and nine different NA subtypes (N1 to N9). Until recently, only three HA subtypes of (H1, H2 and H3) and two NA subtypes (N1 and N2) have caused influenza A in humans, although other subtypes have circulated in birds and other mammals. Influenza B is typically found only in humans. Type B has caused seasonal epidemics but not pandemics because, unlike influenza A, influenza B does not undergo the dramatic changes associated with antigenic shift.
A common medical view is that many pandemic influenza subtypes originated as human infections in Asia22. A possible reason for this may relate to the animal farming and han-dling practices that are common to this region. These involve close contact between ani-mals and humans, increasing the potential for infection to cross between the species.
In the past, when an antigenic shift resulted in a new pandemic subtype, this was asso-ciated with the disappearance of the prior influenza subtype and the emergence of a new one. Analysis of tissue and blood serum have confirmed that the 1918 influenza pandemic – commonly known as “Spanish flu” – was an H1N1 subtype. The 1957 Asian pandemic (“Asian flu”) was an H2N2 subtype and the 1968 Hong Kong pandemic (“Hong Kong flu”) represented the H3N2 subtype. Researchers believe that the 1889 pandemic may have also been an H2N2 subtype. It also appears that a 1950s version of the H1N1 subtype re-emerged in Russia in 1977, possibly due to an accidental release of the virus from frozen storage23. Today, both the H3N2 and H1N1 influenza subtypes continue to co-circulate, as does a subtype of H1N2 that emerged in 200124. Circulation of multiple influenza A subtypes at the same time is a relatively new phenomenon.
2.3 Causes and symptoms of influenza in humans
Influenza transmissionPeople develop influenza most commonly by inhaling air filled with droplets containing the virus from the coughing and sneezing of infected persons. To a lesser extent, infection may result from touching an infected person or a surface that has been contaminated by someone touching, or coughing or sneezing over it. Millions of virus particles can be left on commonly-shared surfaces to be transmitted to others in this way. Infection of human body cells occurs when the HA proteins on the surface of the virus bind to a cell lining the upper respiratory tract. Binding allows for the genetic material in the virus to be passed into the host cell, which triggers replication and production of new virus particles, allow-ing other parts of the respiratory tract to become infected. The NA protein then acts to facilitate the release of the newly replicated viruses from the infected cell25. These new viruses can then repeat the cycle of infection, replication and release.
22 Shortridge K. Severe acute respiratory distress syndrome and influenza, virus incursions from Southern China. American Journal of Respiratory and Critical Care Medicine, 2003; 168: 1416–20.
23 Hilleman M. Realities and enigmas of human viral influenza: Pathogenesis, epidemiology and control, Vaccine, 2002, 20(25–26): 3068–3087.
24 Prevention and control of influenza: Recommendations of the Advisory Committee on Immunization Practices (ACIP). Morbidity and Mortality Weekly Report (MMWR) (published by the US Centers for Disease Control), July 2006; 28; Vol 55, No. RR10: 1–42.
25 Hilleman, 2002 (see footnote 23).
2 Human influenza infections

19 Swiss Re: Pandemic influenza
Virus
Translation
Ribosomes
Viralproteins
Endoplasmicreticulum
Maturation
ReplicationTranscription
Uncoating
Endocytotis
Budding
Release
Virus
ViralRNA
RNA
Packaging
12
3
4
6
7
5
1 Viral envelope2 Viral nucleic acid (RNA)3 Endosome4 Cell membrane5 Nucleus6 Ribonucleoprotein core7 Golgi apparatus
The influenza virus replicates by entering a host cell and using this cell’s resources to produce hun-dreds of copies of the viral RNA. The virus attaches to the outside of the host cell and its RNA enters into the cell. The viral genes are transcribed and translated by the cell’s enzymes and ribosomes. In this way, the virus takes over the cell’s productivity. Instead of producing only new cellular material, the cell now produces hundreds of new virus particles. The new virus particles are eventually released from the cell and drift off; some may land on, and enter, a host cell of their own.
Source: Adapted and used with permission from accessexcellence.org. Copyright 2007 US National Health Museum. All rights reserved
Course of infectionThe incubation period between the onset of infection and the symptoms being displayed is typically between one and two days. While symptoms vary from patient to patient, in-fluenza usually produces symptoms of fever, chills, cough, runny nose and muscle ache. Gastrointestinal symptoms – vomiting and diarrhoea – may also occur, especially in the young. Whether a seasonal or pandemic strain, the majority of individuals who become infected with an influenza virus and become ill see their symptoms resolved in three to seven days, though the illness may last longer. Symptoms abate with a reduction of virus-es in the bloodstream. Adults may be infectious from one day before the development of symptoms to five days afterwards26. Children can be infectious for twice as long, and those who are incapable of developing a normal immune response (for example, due to the presence of disease) can be infectious for much longer periods. Indoors, the influenza virus can survive for up to 24 hours on steel surfaces and 15 minutes on tissues, while under optimal conditions of low humidity and cool temperatures, it can survive on a hard surface for two days. Its ability to survive outside a host for prolonged periods highlights the importance of frequent hand washing in order to reduce the chance of passing virus between the hands and the eyes, nose and mouth.
26 Centers for Disease Control, 2006 (see footnote 24).
Figure 2.2Influenza A virus replicationFigure 2.2Influenza A virus replication

20 Swiss Re: Pandemic influenza
In the vast majority of cases, influenza runs its usual course and people affected by the virus recover. Complications may be caused by influenza, but these are rare, and are more likely to occur when an individual has a chronic debilitating disease or if infection occurs at very young or very old ages. The most common severe complication of influenza is secondary bacterial pneumonia and, more rarely, a primary viral pneumonia may also develop. Both types of pneumonia may also occur together. Far rarer than these compli-cations are infections of other parts of the body, including the central nervous system or other organs.
The body’s responseFor people who become infected, the human body puts up a number of defensive re-sponses. Cells of the immune system – white blood cells known as cytotoxic T-cells – that come into contact with an infected host cell send out chemical signals (chemokines and cytokines) to recruit other white cells, which attack the infected cells to eliminate further viral replication. Other T-cells initiate the manufacture of antibodies to act against the surface proteins, HA and NA – although the benefit of this activity is derived over the longer term, in that it helps to prevent future infections. It is important to note that this im-mune response mounted against the virus confers future protection against an identical strain of influenza and can moderate the virulence of an infection arising from a very similar strain. However, the same person can become repeatedly infected with different strains of influenza over their lifetime.
In rare cases, the body’s immune response to infection can become far too aggressive. The aggregation of T-cells at a site of infection can attract even more defensive cells that will also act to increase the immune response. This response – known as a cytokine storm – can lead to a build-up of secretions in the respiratory tract causing respiratory distress. Research with genetically re-engineered 1918 influenza A suggests that this virus could have produced very high levels of chemokines and cytokines27. Historic de-scriptions of certain individuals who rapidly died of influenza suggest that the cause of death could have been a cytokine storm. This may have been a more common complica-tion in young adults who became infected with the 1918 influenza because of a greater propensity in this age group to be able to mount a strong immune response to certain viral infections. The ability to produce a strong immune response that could trigger a cy-tokine storm is also an attribute currently present in certain H5 avian influenza strains28.
2.4 Diagnosis, treatment and prevention of influenza
DiagnosisBecause the symptoms of influenza are not unique, diagnosis on the basis of symptoms alone is not guaranteed to be accurate: other respiratory infections often present with a similar picture. However, the presence of widespread influenza infections in the commu-nity at an expected time of the year, along with the presence of characteristic symptoms, are typically sufficient to make a provisional diagnosis and to start treating the symp-toms. A definitive diagnosis is based on identifying the virus from respiratory secretions. Viral cultures allow the specific influenza subtype and strain to be identified. If all that is required is simply to determine the presence or absence of an influenza infection in a person, test kits are available that can provide this information in a matter of minutes.
27 Kobasa D et al. Aberrant innate immune response in lethal infection of macaques with the 1918 influenza virus (letter). Nature, January 2007; 445.
28 Zhou J, Law H et al. Differential expression of chemokines and their receptors in adult and neonatal macro-phages infected with human or avian influenza viruses. Journal of Infectious Diseases, 2006; 194(1): 61–70.
2 Human influenza infections

21 Swiss Re: Pandemic influenza
Treatment For the large majority of cases, symptomatic treatment is all that is required for those who become infected. Rest, fluids, and medicines to reduce fever represent the main needs in most cases. To reduce the potential spread of infection, people should not travel or go to work if they are symptomatic or have a fever. Any additional treatment would be tailored according to the complications that develop. As mentioned earlier, serious secondary respiratory infections such as bacterial pneumonia represent a major complication asso-ciated with an influenza infection and can be managed with antibiotics. Evidence of the tremendous impact that antibiotics have had in reducing influenza mortality is demon-strated by the large declines in influenza mortality rates, beginning in the 1940s when antibiotics became widely available (see Figure 2.3)29. Other types of complications are managed on a case-by-case basis and may be amenable to specific treatments or other supportive care.
0
0.5
1.0
1.5
2.0
2.5
20001990198019701960195019401930192019101900
Deaths/1 0001
2
1 1918 influenza pandemic (5.885 deaths/1 000)2 Introduction of sulfa drugs (∼1935)3 Introduction of penicillin and streptomycin (∼1941–43)
3
The widespread availability of antibiotics, beginning in the 1940s, had a major impact in terms of reducing influenza mortality.
Source: Based on US National Center for Health Statistics data
Antiviral medicationAnother means to control influenza is through antiviral medications. These can be used as a preventative measure or for the treatment of influenza infections. These drugs have a number of beneficial effects, including shortening the duration and severity of infection, reducing the production of the virus (which helps to reduce its spread), and controlling serious influenza complications such as pneumonia.
However, there is evidence of widespread resistance by the influenza A subtype to some of the older antivirals30 for certain influenza strains in circulation. In North America, for example, it has been recommended not to use these older medications in influenza A epidemics unless the virus’s susceptibility to these drugs has been confirmed31. Neura-minidase inhibitors32 represent a newer class of antivirals which can be effective against both influenza A and B viruses. These drugs interfere with neuraminidase, a substance which facilitates the release of viral particles from infected cells.
29 Armstrong G, Conn L, Pinner R. Trends in infectious disease mortality in the 20th century, Journal of the American Medical Association, 1999; 281(1): 61–66.
30 Amantadine and rimantadine.31 Centers for Disease Control, 2006 (see footnote 24).32 Oseltamivir and zanamivir.
Figure 2.3Influenza and pneumonia mortality trends: total population, United States 1990–1998
Figure 2.3Influenza and pneumonia mortality trends: total population, United States 1990–1998

22 Swiss Re: Pandemic influenza
VaccinationThe most effective measure in the control of influenza is to prevent the disease through vaccination. Vaccination reduces the probability of disease, or its severity, if an infection occurs. In a study of healthy elderly people in the Netherlands, Voordouw found that the risk of acquiring a seasonal influenza infection was cut in half by vaccination and the risk of death was reduced by 24%33.
The WHO and major governments track the global emergence of influenza infections. Based on the identification of predominant antigenic strains from a prior influenza out-break, these authorities make an assessment of the strains considered likely to resurface in the upcoming season. Based on this assessment, vaccines can be produced that will protect individuals from the exposures anticipated in the next season. Because influenza is usually a mild infection, vaccination is typically reserved for individuals who have a higher probability of developing complications of this disease34.
The effectiveness of a vaccine depends on how closely a new strain of influenza resem-bles strains that are contained in the existing vaccine. When an antigenic shift occurs in an influenza virus or a new subtype widely circulates, as would be the case in a pan-demic, the degree of protection is reduced or lost. In these circumstances, a vaccine specific to the new strain needs to be produced and distributed in large volumes. The time required to do this means that it will not be available during the early months of a pandemic. Further discussion of the vaccine production process, and the work being carried out to shorten this, are contained in Chapter 435.
Vaccines come in two basic forms, both of which stimulate an immune response: inacti-vated (killed influenza virus) and live attenuated influenza vaccines. Which is used will depend on availability, and to whom the vaccine is being administered. The attenuated live vaccine has the potential to produce mild flu-like symptoms, in which case it is typi-cally reserved for healthy people aged between five and 49 years – unless circumstanc-es dictate that such individuals should not be immunised in this way (for example, due to allergies)36. Traditional vaccine production methods involve growing a virus in embryo-nated hens’ eggs. Alternative production methods for influenza vaccines and ways to ex-tend the vaccine supply represent an area of active research and are discussed further in Chapter 437.
33 Voordouw B, van der Linden P et al. Influenza vaccination in community-dwelling elderly. Impact on mortality and influenza-associated morbidity. Archives of Internal Medicine, 2003; 163: 1089–94.
34 This group includes the over 50s, residents of long-term care facilities, and adults and children with chronic heart and lung disease, diabetes, kidney disease and weakened immune systems.
35 See section 4.4.36 “LAIV (the live vaccine) is an option for vaccination of healthy ... persons aged 5–49 years (including health-
care workers and other persons in close contact with groups at high risk and those wanting to avoid influenza). During periods when inactivated vaccine is in short supply, use of LAIV is encouraged when feasible for eligi-ble persons (including healthcare workers) because use of LAIV by these persons might increase availability of inactivated vaccine for persons in groups at high risk. Possible advantages of LAIV include its potential to induce a broad mucosal and systemic immune response, its ease of administration, and the acceptability of an intranasal rather than intramuscular route of administration.” (Centers for Disease Control, 2006 (see foot-note 24)).
37 See section 4.4.
2 Human influenza infections

23 Swiss Re: Pandemic influenza
2.5 Groups at risk of influenza complications
For most seasonal influenza outbreaks, pneumonia and influenza deaths are concentrated in the very young and the very old, with the majority occurring among people over the age of 6538. In the years when a pandemic has occurred, in contrast to this age pattern, a higher proportion of deaths among those under the age of 65 has been observed39. This age shift may, in part, be due to a greater diversity of antibodies against prior influ-enza strains still being present in older people, giving them the benefit of partial immunity to the new strain.
Influenza also contributes to increased morbidity and mortality rates in individuals with chronic disease. Peaks in deaths due to chronic heart disease, cerebrovascular disease (such as stroke), and diabetes have been noted to coincide with peaks in the incidence of influenza and pneumonia40. Additional factors that can influence the risk of influenza complications and death are discussed in Appendix A.
2.6 Conclusions
Influenza is a common infectious disease. In considering the impact of influenza infections over the past century, its effects are mostly seen at the age extremes, where individuals are more susceptible to complications. Individuals with chronic disease are at increased risk of developing complications associated with influenza infections. Starting in the mid-20th century, the availability of antibiotics had a dramatic impact on rates of influenza and pneumonia mortality due to their effectiveness in treating secondary bacterial pneu-monias. Today, the key preventative measure to reduce influenza morbidity and mortality in at-risk populations is vaccination. Options for treating the symptoms of influenza, or for dealing with complications that might develop, are available, and expanding.
38 Centers for Disease Control, 2006 (see footnote 24).39 Simonsen L, Clarke M et al. Pandemic versus epidemic influenza mortality: A pattern of changing age
distribution. Journal of Infectious Diseases, 1998; 178: 53–60.40 Reichert T, Simonsen L et al. Influenza and the winter increase in mortality in the United States 1959–99.
American Journal of Epidemiology, 2004; 160(6): 492–502.
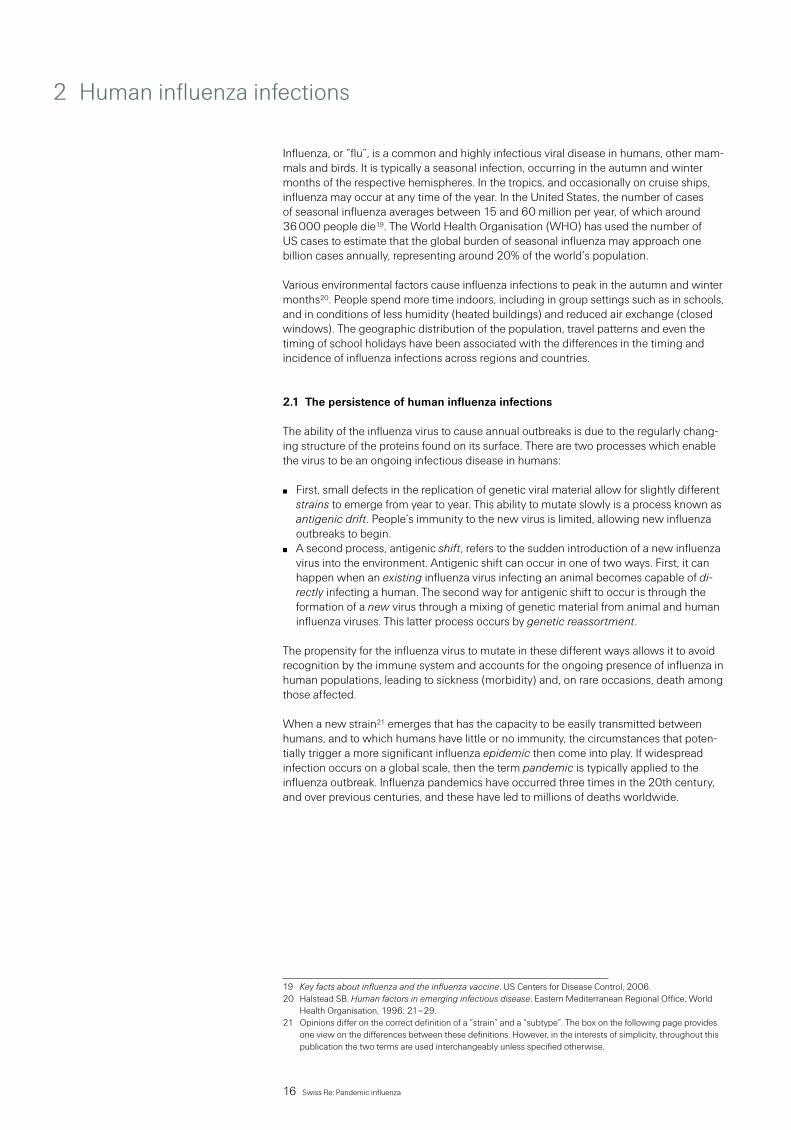
Influenza victims crowd into an emergency hospital near Fort Riley, Kansas in 1918. 1918 is often seen as a possible benchmark for excess mortality in a future pandemic. However, this pandemic was exceptional among all those that have been recorded since 1580.

25 Swiss Re: Pandemic influenza
Influenza pandemics are infrequent events, occurring at irregular intervals. There is no chronological pattern that would allow us to predict when the next one might come.
3.1 Historical frequency and severity
Frequency While our most detailed knowledge of influenza infections is from epidemics and pan-demics that occurred in the 20th century, epidemics with reported symptoms that suggest an influenza infection have been documented for much of recorded history. Descriptions of an epidemic provided by the Greek physician Hippocrates around 412 BC are sugges-tive of influenza41 and other influenza epidemics were documented in the Middle Ages. A widespread epidemic, reported as a “sweating sickness”, with influenza-like symptoms occurred in England in 1485. The first well described pandemic of an influenza-like dis-ease occurred in 1580. In the last 300 years, there have been up to 13 influenza pan-demics; these have occurred at irregular intervals, with as little as two years separating some of the outbreaks, and as many as 56 years between others42. Of these, generally the best known is the pandemic of 1918–1919, the worst recorded pandemic over this period.
Based simply on historical frequencies, there is a 3–4% chance of an influenza pandemic occurring in any given year and, relatively, a far smaller chance of a severe pandemic.
SeverityEven for the influenza pandemics of the recent past, the scantiness and unreliability of available statistics (see box) makes it impossible to know or determine accurate morbidity or mortality rates from these historical events. However, although the estimates are very rough, mortality rates during the pandemics in the 18th and 19th centuries appear to more closely resemble those of the mild pandemics of 1957 and 1968 than those of the severe 1918 pandemic.
Assessing mortality attributable to influenzaAssessing the impact of influenza pandemics on mortality is difficult. Influenza diagnoses are generally not laboratory-confirmed, and deaths related to influenza are often attribut-ed to pneumonia and other secondary complications that occur well after the influenza virus infection. For these reasons, influenza may not be listed on the death certificate for many influenza-related deaths. Given this incomplete identification, an indirect approach involving statistical modelling has long been used to estimate the seasonal excess in mortality attributable to influenza. Excess mortality during an influenza season is calcu-lated as the difference between the number of deaths observed and the expected base-line in the absence of influenza43.
41 Ghendon Y. Introduction to pandemic influenza through history. European Journal of Epidemiology, 1994; 10: 451–53.
42 Osterholm M. Preparing for the next pandemic. Foreign Affairs, July/August 2005; and Patterson KD. Pandemic influenza 1700–1900: A study in historical epidemiology. Rowman & Littlefield Totowa, NJ, 1986.
43 Simonsen L, Clarke M et al. The impact of influenza epidemics on mortality: Introducing a severity index. American Journal of Public Health, December 1997; 87(12).
3 Influenza pandemics in history

26 Swiss Re: Pandemic influenza
3.2 Influenza pandemics 1700–1900
High morbidity and low mortality, with most deaths occurring among the elderly, were characteristic of all 18th and 19th century pandemics.
The study by Patterson44 provides a useful and authoritative analysis of the history of in-fluenza pandemics between 1700 and 1900. Those which he identified as pandemics, or probable pandemics, are summarised in Table 3.1, and briefly described below.
Year(s) Years since previous pandemic Place of origin or of first report Viral type1729–1730 ? Russia? Unknown1732–1733 2 Russia Unknown1781–1782 48 Russia, China? Unknown1788–1789(?) 6 Russia Unknown1830–1831 41–48 Russia, China Unknown1833 2 Russia Unknown1836–1837 3 Russia? Unknown1889–1890 52–56 Russia H21899–1900 9 Unknown H3
Source: Modified from Patterson KD, 1986 (see footnote 42)
1729–1730The first pandemic of the 18th century occurred in 1729–1730, and may have spread over the entire globe. Apparently, however, influenza did not break out in North America until 1732. European observers favoured Russia as its origin, but there is no documenta-tion of this. The pandemic is reported to have caused much sickness, but relatively few deaths, with mortality mostly among the elderly.
1732–1733Within two years, another pandemic began, initially in Russia. Morbidity during the pan-demic of 1732–1733 seems to have been high and, despite its closeness to the previous pandemic, there was no evidence that exposure to the 1729–1730 pandemic conferred any residual immunity. Mortality rates, while possibly higher than during the previous pandemic, remained low – except among the very young, the very old and those with chronic illnesses.
1781–1782The pandemic of 1781–1782 spread rapidly and made tens of millions of people sick. The earliest reports were from Russia, but for the first time there were suspicions of Asian origins. It was estimated that more than two thirds of the global population, from all walks of life, contracted the disease. Mortality, however, was low, and generally followed the usual pattern of being restricted mainly to the elderly and those with chronic respiratory illnesses.
1788–1789 (possible pandemic)Morbidity and mortality were lower in the possible pandemic of 1788–1789 than in the previous pandemic of 1781–1782. Almost all of those who died were elderly or chroni-cally ill. Once again, the earliest reports were from Russia, with clear patterns of spread to Europe and possibly North America.
44 Patterson KD, 1986 (see footnote 42).
Table 3.1Pandemics (or probable pandemics)1700–1900
Table 3.1Pandemics (or probable pandemics)1700–1900
3 Influenza pandemics in history

27 Swiss Re: Pandemic influenza
1830–1831The first pandemic of the 19th century occurred in 1830–1831. Suspicions about its Chinese origins arose from vague references to influenza in Southern China in October/November 1829. The pandemic spread rapidly, causing much morbidity but little mor-tality.
1833The pandemic that swept Europe in 1833 was first reported in Russia in January. While its geographical spread was far narrower than in 1831, it caused considerably greater morbidity in Europe than the outbreak of 1831. It seems that men and women, young and old, were all equally likely to contract the disease. Mortality also appears to have been higher in 1833 than in 1831, although case fatality rates were still low45. It was ob-served that the elderly and those with pre-existing respiratory illnesses were most at risk. There was no evidence that those with exposure to the 1830–1831 pandemic had any immunity against the 1833 virus.
1836–1837A severe epidemic of unclear origin occurred in Europe in 1836–1837. Big cities were attacked first, with subsequent spreading-out to small towns and then the countryside. This was the third pandemic in less than a decade but, as with 1833, there was no evi-dence that exposure to prior pandemics conveyed any immunity to infection. This was the most severe influenza to strike since 1782, with extensive morbidity. However, case fatality rates remained low, even though total mortality was higher than in the previous two pandemics. Most of the deaths were among the elderly and chronically ill and were associated with secondary pneumonias. There was no significant increase in excess mortality for those aged under 25.
1889–1890The pandemic of 1889–1890 is generally believed to have originated in Russia. The pandemic caused enormous morbidity in 1889 – attack rates of one third to one half for most places represent a reasonable estimate. There is no data to support any analysis of attack rates by age, gender or socio-economic status, but it is likely that any variations were more to do with exposure to the disease – for example, due to the nature of a per-son’s job – than with any greater or lesser vulnerability. While the elderly were lightly hit in 1889–1890, they had higher morbidity rates (and higher overall mortality) in the sub-sequent recurrences in the years that immediately followed. Excess annual mortality rates varied by country, and within each country, but in many cases were between 0.75 and 1 deaths per 1 000 people. As with all of the previous pandemics, mortality during 1889–1890 itself, and the years that followed, was closely linked with secondary pneu-monia and/or other respiratory diseases, and was at its most severe among the elderly.
1899–1901Increases in pneumonia-influenza death rates recorded in several countries signalled the last pandemic of the 19th century in 1899–1900 and 1900–1901. This pandemic, of unknown origin and with no obvious pattern of geographical spread, was clinically mild and, as usual, was most lethal among the elderly. Very high morbidity was observed in some outbreaks but, even in these places – as elsewhere – mortality rates were low.
45 “Case fatality” refers to the rate of death among people who are not only infected but who also become sick (see Chapter 5, section 5.2.1 for further explanation).

28 Swiss Re: Pandemic influenza
3.3 Influenza pandemics of the 20th century
Three pandemics occurred in the 20th century, in 1918, 1957 and 1968. These are summarised in Table 3.2, and briefly described below.
Sources: Estimated number of US deaths: Glezen WP, 1996 (see footnote 51) and World Health Organisation, 2005 (see footnote 3); Simonsen L, Clarke M et al, 1998 (see footnote 39); US popu-lation (for excess mortality calculation): Historical National Population Estimates: 1 July 1900 to 1 July 1999, Population Estimates Program, Population Division, US Census Bureau, 11 April 2000 (revised 28 June 2000)
1918–1919The 1918–1919 pandemic was the worst recorded pandemic since the first well de-scribed pandemic of 1580. It killed upwards of 40 million people globally in less than a year. As discussed in further detail below46, the difference between its three waves seemed to be primarily in the much higher frequency of complicated, severe and fatal cases in the second and third waves47. The first wave, which began with outbreaks in Eu-rope and different US states in March 1918, was highly contagious but not especially deadly. The second wave began almost simultaneously in France, Sierra Leone and the United States as schools reopened in September 1918, and was highly fatal48. In many nations, a third wave appeared in early 1919. This was also highly fatal (see Figure 3.2 for the UK on page 32).
Uncharacteristically for influenza, nearly half of the influenza-related deaths in the 1918 pandemic were in young adults aged between 20 and 40. In a complete reversal of pre-vious patterns, 99% of deaths occurred in people younger than 65. Death rates in males far exceeded those in females. Many of the deaths in 1918 were from pneumonia caused by secondary bacterial infections, but the 1918 pandemic also caused a form of primary viral pneumonia that could kill apparently healthy young individuals within 48 hours. There is speculation that the elderly may have had partial protection from infection as a result of historical exposure to a related viral strain in the 19th century.
46 See section 3.4.3.47 Taubenberger JK and Morens DM. 1918 influenza: The mother of all pandemics. Emerging Infectious
Diseases, 2006; 12(1): 15–22.48 World Health Organisation, 2005 (see footnote 3).
Table 3.2Influenza pandemics of the 20th centuryTable 3.2Influenza pandemics of the 20th century
Years since Place of origin Estimated Estimated number US excess mortality Year(s) previous pandemic or of first report Viral type global deaths of US deaths per 1 000 1918–1919 18 France, US H1N1 40–50 million 500 000–550 000 5.3‰(Spanish flu) 1957–1958 38 China H2N2 1–2 million 70 000 0.41‰(Asian flu) 1968–1969 10 China H3N2 1 million 34 000 0.17‰(Hong Kong flu)
3 Influenza pandemics in history

29 Swiss Re: Pandemic influenza
“Spanish” flu?The description of the 1918 pandemic as “Spanish flu” is a misnomer. There is no evidence to suggest that the pandemic originated in Spain, nor that it was more severe there than anywhere else. The first cases were detected in Europe and the United States. As Spain was neutral during World War I, its media covered the epidemic without restraint. The popular association of the 1918 pandemic with Spain is thought to have arisen from this high-profile news coverage49.
1957–1958The mild H2N2 virus that caused the 1957–1958 pandemic was first identified in China at the end of February 195750, and appeared in coastal cities of the United States in June the same year. The virus ‘seeded’ the population in summer (ie, it quietly established and maintained itself with a low level of activity) and broke out with the opening of schools in September. Large numbers of cases occurred (concentrated in school-age children due to their close contact in crowded settings) and the outbreaks were frequently explosive, but fatalities were relatively low. Mortality showed the characteristic pattern of previous pandemics, with most excess deaths confined to infants and the elderly. In most countries, between one and three months later, a second wave followed the first. Concentrated in the elderly, this caused very high levels of illness and greater fatalities than the first wave51.
1968–1969The 1968–1969 pandemic virus first came to the attention of the western world in July 1968, with a brief report of a large epidemic in Hong Kong52. Its international spread re-sembled that seen in 1957, but clinical symptoms were milder and mortality was lower. In most countries the disease spread slowly. The epidemic began in September in Cali-fornia (carried there by troops returning from Vietnam) and, by late December, spread eastwards to affect the whole of the United States. A significant increase in mortality from influenza-related pneumonia occurred during the first two weeks of January 1969, with deaths concentrated in the elderly. In contrast to the US experience, Canada and most of Europe experienced hardly any excess mortality. Because the virus was genetically simi-lar to viruses from previous pandemics, including the one as recent as 1957, it is believed that some segments of the world population had partial protection, either against infection from the influenza virus or from severe disease.
49 World Health Organisation, 2005 (see footnote 3).50 World Health Organisation, 2005 (see footnote 3).51 Glezen WP. Emerging infections: Pandemic influenza. Epidemiologic Reviews, 1996; 18(1) and World Health
Organisation, 2005 (see footnote 3).52 Kilbourne ED. Influenza pandemics of the 20th century. Emerging Infectious Diseases, 2006; 12(1).

30 Swiss Re: Pandemic influenza
3.4 Why was the 1918–1919 pandemic so severe?
Patterson, in his study of pandemic influenza concluded53:
“Perhaps the most striking generalization confirmed by this study is similarity among most pandemics, and the utter uniqueness of the 1918 outbreak. No other pandemic spread so explosively, killed nearly so many victims, nor caused remotely as much mortality among young and middle-aged people … The 1918 pandemic was, so far, a singular event, and any recurrence is impossible to forecast.”
In many respects, the 1918 influenza pandemic was similar to other influenza pandemics. However, in contrast to all other pandemics:
mortality was exceptionally highmortality was concentrated in a much younger age group, andthe waves of infection followed one another with unusual rapidity
Research is ongoing into what caused this unusual severity and pattern of disease, looking at the viral component itself, along with the underlying conditions in humans and environmental factors present in 1918. 3.4.1 Characteristics of the virus contributing to exceptionally high mortalityResearch by Taubenberger sequenced and analysed all eight RNA segments of the 1918 influenza virus54,55. While this, and other analysis, falls short of providing a concrete ex-planation, on a genetic basis, of the exceptional virulence of the 1918 virus strain, it does give the following clues:
Despite the exceptional virulence of the virus, neither the 1918 haemagglutinin (HA) nor the 1918 neuraminidase (NA) genes possessed the mutations that account for the virulence of other influenza strains, or the highly pathogenic avian influenza H5 or H7 viruses.One of the distinctive characteristics of the 1918 virus was its ability to inflict rapid and severe damage to the respiratory tract of its victims. The 1918 NS1 protein was very effective in inhibiting the body’s response to viral invasion, which could explain why the virus was able to reproduce so quickly (it is also interesting to note that the change in the NS1 protein associated with increased virulence of the 1997 H5N1 avi-an influenza strain was not, however, found in the 1918 NS1 protein).The M2 protein is involved in the process that releases infectious viral material from the virus. However, the changes in the M2 protein that are typically associated with high viral yield and lethality were not found in the 1918 virus56.The 1918 polymerase genes (PB1, PB2 and PA) allowed the 1918 virus to replicate faster than other human H1N1 viruses, which also likely contributed to its high viru-lence57.It may have been simply that the combination of the genes/proteins of the 1918 virus created the ‘perfect storm’, with the genes working together optimally to produce the virus’s extraordinary virulence.
53 Patterson KD, 1986 (see footnote 42).54 Taubenberger JK. The origin and virulence of the 1918 “Spanish” influenza virus. Proceedings of the
American Philosophical Society, 2006; 150 (1).55 See Chapter 2, section 2.2 for further background on the structure of the influenza virus.56 Garcia-Sastre A and Whitley RJ. Lessons learned from reconstructing the 1918 influenza pandemic.
Journal of Infectious Diseases, 2006; 194: S127–32.57 Langford C. The age pattern of mortality in the 1918–19 influenza pandemic: An attempted explanation
based on data for England and Wales. Medical History, 2002; 46: 1–20.
3 Influenza pandemics in history

31 Swiss Re: Pandemic influenza
3.4.2 Concentration of mortality in the younger age groupsThe profile of influenza deaths by age has historically been U-shaped, with peaks of mor-tality among infants and the very old, and comparatively low mortality rates at the ages in between. However, as illustrated by Figure 3.1, the age-specific death rates for the 1918 pandemic followed a W-shaped curve, with a middle peak in deaths among young adults between 25 and 34 (which, as the graph shows, did not occur during the normal annual influenza seasons of the preceding years). While the majority of deaths in 1918 were due to secondary bacterial pneumonia (since antibiotics were not then available), a significant minority died rapidly and violently soon after the onset of influenza symptoms. As many of these young adults that died were apparently previously healthy, one expla-nation suggested was that the damage caused by an over-reaction of the immune sys-tem resulted in the failure of multiple organ systems58.
55–
64
65
–74
75–
84
Age band
Inter-pandemic years 1911–1915 1918 pandemic year
Deaths/1 000 (in the general population)25
20
15
10
5
0
85
+
45
–5
4
35
–4
4
25–
34
15–
24
5–
14
1–
4
<1
The graph shows average general population mortality for the inter-pandemic years 1911–1915 and during the 1918 pandemic year.
Source: based on, and derived from, data used in Taubenberger JK, 2006 (see footnote 54)
Given that the elderly are the age group usually most vulnerable to influenza, it is surpris-ing that less than 1% of all influenza-related deaths in 1918 were among those aged 65 and over. This compares with 64% in 1957 and 52% in 1968. While mortality rates of people aged 65 and over who became sick are as high in 1918 as in other influenza years59, the incidence of infection in this group was much lower in 1918. A likely expla-nation for this is that – depending on their actual age – those aged 65 and over may have been exposed to a similar virus in a previous pandemic, giving them a level of partial immunity to the 1918 strain. It has been suggested that, if the virus that caused the epi-demic of 1847–1848 was related to the one of 1918, this could explain the age pattern of mortality in 191860.
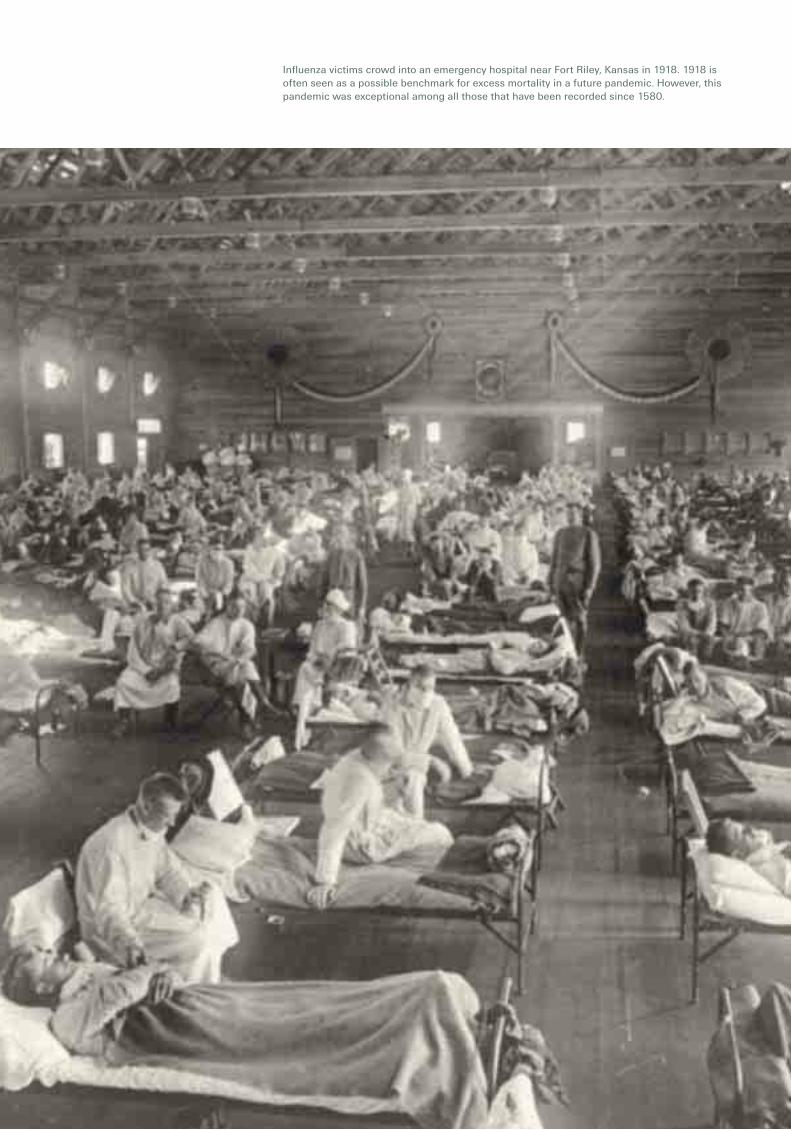
Another suggested explanation for the unusual age profile observed in 1918 is based on the widespread prevalence of tuberculosis, even in developed countries. The evidence to support this is discussed more fully in the final section of this chapter.
58 See also Chapter 2, section 2.3 for further discussion on the body’s response to the influenza virus.59 Taubenberger JK and Morens DM, 2006 (see footnote 47).60 Langford C, 2002 (see footnote 57).
Figure 3.1Influenza and pneumonia average general population mortality per 1 000 by age (US data)
Figure 3.1Influenza and pneumonia average general population mortality per 1 000 by age (US data)

32 Swiss Re: Pandemic influenza
3.4.3 Three rapidly successive wavesAs introduced in Chapter 2, influenza epidemics are most common in the colder months of the year. Pandemics, too, have mostly followed this trend. After an initial period of spread and infection, influenza pandemics then usually settle into a pattern of annual epidemic recurrences (or waves) as the virus drifts from year to year. In 1918, however, in many places there were three separate waves within a single year. Each wave caused widespread sickness but, as shown in Figure 3.2, only the second and third wave caused high mortality.
29/6 27/7 24/8 21/9
1918 1919
19/10 16/11 14/12 11/1 8/2 8/3 5/4
Deaths/1 000 (in the general population)25
20
15
10
5
0
In the United States a first wave began in March, causing widespread illness but relatively few deaths. This ‘springtime’ wave spread to most countries of the world over the following months. A second wave spread globally from September to November, and many places saw a third wave in early 1919. The second wave and, to a lesser extent, the third wave also caused high rates of illness but, unlike the first, were highly fatal.
Source: Jordan E. Epidemic influenza: a survey. Chicago: American Medical Association, 1927
It is not clear what gave the 1918 virus this unprecedented ability to generate rapidly successive pandemic waves. Without human samples from all three waves it is not pos-sible to say whether the same virus was responsible for all three waves, or whether the virus mutated between waves. There is some evidence to suggest, at least, that the third wave may have broken out as a result of the reopening of schools, churches and theatres after the end of the second wave61.
61 Kilbourne ED, 2006 (see footnote 52).
Figure 3.2Weekly combined influenza and pneumonia mortality per 1 000 in the United Kingdom 1918–1919
Figure 3.2Weekly combined influenza and pneumonia mortality per 1 000 in the United Kingdom 1918–1919
3 Influenza pandemics in history

33 Swiss Re: Pandemic influenza
3.4.4 World War I had a significant impactWorld War I took place mostly in Europe between July 1914 and November 1918. As Figure 3.2 above shows, the first wave of the 1918 influenza pandemic appeared in the spring of 1918. The second wave peaked in September to November of 1918, and the third wave followed in many places early in 1919. Both directly and indirectly, this over-lap with World War I had a significant impact on the spread and ultimate death toll of the 1918 influenza pandemic.
When the United States entered the war in April 1917, in an attempt to maintain morale the US government quickly took steps to censor and control freedom of speech. The Es-pionage Act virtually legalised press censorship, and the Seditions Act made it punisha-ble by twenty years of imprisonment to “utter, print, write or publish any disloyal, profane, scurrilous or abusive language about the government of the United States”62. President Wilson made no public statement about influenza. In this information vacuum, people were – at least initially – largely unaware of the presence of the virus, and neither they nor the public health authorities took any steps to prepare for the re-emergence of the influenza strain.
The war further compounded the problem by providing the ideal environment for the disease to break out and spread globally. As noted by Barry63:
“The US Army had exploded from a few tens of thousands of soldiers before the war to millions in a few months. Huge cantonments, each holding roughly 50 000 men, were thrown together in a matter of weeks. Hundreds of thousands of men occupied them before the camps were finished. They were jammed into those barracks that were fin-ished, barracks designed for far less than their number, while tens of thousands of men lived through the first winter in tents. Hospitals were the last buildings to be constructed. These circumstances not only brought huge numbers of men into this most intimate proximity but exposed farm boys to city boys from hundreds of miles away, each of them with entirely different disease immunities and vulnerabilities.”
As troops moved from camp to camp, it became impossible to isolate the disease in one camp and stop it from spreading to others. It spread into the civilian population and, with the continued transport of soldiers to and from France, it spread globally. Further afield in Iran, despite its neutrality, warring armies used Iranian soil as a battlefield, and it was in this environment of massive troop movements and clashing armies that the 1918 in-fluenza pandemic made its appearance64.
In addition to these developments, the military had a desperate need for thousands of doctors and nurses. When the war began, only 776 physicians were serving in the US armed forces. By the time it ended, 38 000 were serving65. This level of demand meant that medical care available for civilians deteriorated rapidly. Since so many doctors were away supporting the troops, the sick were cared for by inexperienced young doctors, medical students or older doctors, many of whom were not trained in contemporary medicine. Third- and fourth-year medical school classes were closed and the students were assigned jobs as interns or nurses66.
62 Barry JM. The great influenza: The story of the deadliest pandemic in history. Penguin, 2004.63 Barry JM, 2004 (see footnote 62).64 Afkhami A. Compromised constitutions: The Iranian experience with the 1918 influenza pandemic.
Bulletin of the History of Medicine, 2003; 77(2): 367–392.65 Barry JM, 2004 (see footnote 62).66 Starr. Influenza in 1918: Recollections of the epidemic in Philadelphia. Annals of Internal Medicine,
1976; 85: 516–518.
34 Swiss Re: Pandemic influenza
3.4.5 Underlying disease burdenAs with all infectious diseases, the death toll from the 1918 influenza pandemic was far higher in poor countries than in the developed world. For example, the excess mortality per 1 000 persons was between 42 and 67 in India, compared with around five in much of Europe and the United States67. Better food and shelter, and differential access to healthcare – even the supportive care useful for influenza victims, such as helping with feeding and bathing – all played a part in this difference, as did the greater underlying disease burden present in the populations of the poorer countries.
In his paper examining the demographic impact of the 1918 influenza pandemic on Iran68, Afkhami suggests that famine, opium consumption, malaria and anaemia were fundamentally responsible for the high mortality rate in Iran, rather than the prevailing notion that the virus targeted the young and healthy.
In the early 20th century, tuberculosis was widespread, even in developed countries. For example, around 30% of adults in the United States had tuberculosis antibodies as a result of infection or exposure to the disease. Following an examination of death rates by age and gender for 30 causes (representing around 80% of all registered deaths in the United States), research by Noymer and Garenne suggests that many apparently healthy young adults who died in 1918 were infected with tuberculosis, and that this ex-plains the unusually high mortality rates among young adults, especially males69. They note that tuberculosis death rates experienced their steepest decline of the 20th century just after 1918, and that this decline was much more marked for males than females, as shown in Figure 3.3. According to Noymer and Garenne, this was because many tuber-culosis sufferers died of influenza and were not therefore around to die in the following years, or to pass the disease on to others.
0
0.5
1.0
1.5
2.0
2.5
1960194019201900
Deaths/1 000 (in the general population)
Males Females
Sources: Reproduced from Noymer A and Garenne M, 2000 (see footnote 69). Original sources: US Department of Health, Education and Welfare 1956; Grove RD and Hetzel AM, Vital statistics rates in the United States, 1940–1960. Washington, DC: US National Center for Statistics, 1968
67 Patterson KD and Pyle GF. The geography and mortality of the 1918 influenza pandemic. Bulletin of the History of Medicine, 1991; 65: 4–21.
68 Afkhami A, 2003 (see footnote 64).69 Noymer A and Garenne M. The 1918 influenza epidemic’s effects on sex differentials in mortality in the
United States. Population and Development Review¸2000; 26(3): 565–581.
Figure 3.3Age-standardised death rates for tuberculosis, United States, 1900 –1960
Figure 3.3Age-standardised death rates for tuberculosis, United States, 1900 –1960
3 Influenza pandemics in history

35 Swiss Re: Pandemic influenza
As noted by Noymer and Garenne:
“The age pattern of the 1918 flu means that tuberculosis and influenza overlapped much more than usual … The secondary pneumonia that occurs as a complication of influenza infection could be exacerbated by active tuberculosis or by tuberculosis lesions in the case of latency. Virtually all influenza deaths involved the lungs, an important site of pa-thology for tuberculosis.
“An influenza-tuberculosis nexus is consistent with what is known about the 1918 epi-demic, including the high fatality rate and the W-shaped mortality profile, and it helps explain the sex differentials we observe. The deadliness of the epidemic seems less ex-treme if we consider that many victims also had tuberculosis. Excess male flu mortality is consistent with the differential incidence of tuberculosis by sex. The fact that flu deaths had a mode in the 25–34 age group is also strongly indicative of a tuberculosis inter-action; tuberculosis is a disease of adulthood, not of old age.”
3.4.6 Limited medical knowledge and treatmentsA key factor that made 1918 so severe compared with today is that no antibiotics, vac-cines or antivirals were available. Also since then, public health measures such as im-provements in sanitation, nutrition, hygiene and the cleanliness of drinking water have all contributed to a reduction in the spread of infectious diseases. Chapter 4 contains an in-depth description of these issues, including the major advances in our understanding of the causes and treatment of bacterial and viral diseases.
3.5 Conclusions
Influenza pandemics are rare events – only 10 to 13 have occurred in the last 300 years. They have happened at irregular intervals, with no apparent pattern that would enable us to predict when the next one might be. Based simply on historical frequencies, the prob-ability of an influenza pandemic occurring in any given year in the future would appear to be around 3–4%.
The present scientific understanding of the influenza virus is insufficient for us to know how severe the next pandemic might be. However, past pandemics have been more consistent with respect to severity than regularity. All past pandemics, for example, have caused high morbidity and, apart from the 1918 pandemic, low mortality, with most of the deaths among the elderly.
The 1918 pandemic was unique among all pandemics since the first well described pandemic of 1580, both with respect to its exceptionally high mortality rate and the high proportion of deaths in young adults. Many factors appear to have contributed to this pandemic’s extreme severity, a number of which have been described in this chapter.
Swiss Re has used a rigorous mathematical modelling approach to improve the level of understanding of the potential range of outcomes from a pandemic, and their respective likelihood. This approach and some key results are described in Chapter 5.

A Roche employee checks empty Tamiflu capsules before they go onto the filling line. The global manufacturing network for Tamiflu can produce in excess of 400 million treatments per year.

37 Swiss Re: Pandemic influenza
Compared with all past influenza pandemics, the world is now much better prepared to cope. There are a number of reasons for this:
International agencies responsible for managing the global disease situation in animals and humans were founded in the 20th century, including the World Health Organisa-tion (WHO) which serves as a global alert mechanism for the emergence of influenza viruses with pandemic potential. Antibiotics are now available to treat bacterial pneumonia, the major complication arising from influenza (penicillin was discovered in 1928).Virological research and knowledge has grown rapidly since the beginning of the last century (the influenza virus was first isolated in 1933).The International Health Regulations (IHR) were first adopted in 1951.Influenza vaccines have been available since the 1950s, and have proved their effec-tiveness in reducing the incidence of seasonal influenza by two thirds or more70. Antiviral drugs for the treatment of influenza were first approved in the 1970s, and have demonstrated their effectiveness during seasonal influenza epidemics.
4.1 International agencies and their activities
The World Organisation for Animal Health (OIE – Office International des Epizooties) was created by international agreement in 1924 with the objective of managing situations involving global animal diseases.
The Food and Agriculture Organisation of the United Nations (FAO) was founded in 1945. Through its Animal Health and Production Division, the FAO’s role includes strengthening animal disease intelligence and emergency preparedness, and examining the role of migratory birds in the spread of disease. It also supports the general raising of awareness in relation to animal health risks and undertakes risk communication. The organisation also analyses and advises on the social and economic consequences of a given disease and its control, along with strengthening field surveillance and laboratory capabilities, and reinforcing global avian influenza surveillance and early warning capabilities.
At a global level, avian influenza early-warning activities are the joint concern of the FAO, OIE and WHO, working together in a Global Early Warning (and Response) System (GLEWS). Based at the FAO’s headquarters in Rome, the role of GLEWS is to monitor animal diseases crossing borders between countries and emerging zoonoses (diseases that can spread from animals to humans).
The FAO and OIE have prepared a global plan for the progressive control of highly patho-genic avian influenza, and in April 2005 established the OIE-FAO Avian Influenza Net-work (OFFLU). OFFLU’s role is to coordinate research, provide confirmatory diagnosis, support individual countries through the provision of experts, and interface with the WHO in the analysis of viral strains.
The FAO has assumed the lead role in the UN System Influenza Coordination (UNSIC). UNSIC was established by the former UN Secretary-General Kofi Annan in September 2005, as the specialised UN organisation in charge of assisting member states in con-trolling influenza at source in animals.
The WHO itself was established in 1948. Its objective is the attainment, by all peoples, of the highest possible level of health. Among its varied activities, the organisation is in charge of coordinating the global response to potential influenza pandemics, with a par-ticular focus at the current time on human cases of H5N1 avian influenza.
70 World Health Organisation, 2005 (see footnote 3).
4 Current situation

38 Swiss Re: Pandemic influenza
Through the work of its Global Influenza Surveillance Network (GISN), the WHO makes recommendations on the composition of the annual seasonal influenza vaccine produced each year. Established in 1952, the GISN also serves as a global alert mechanism for the emergence of influenza viruses with pandemic potential. The network comprises four WHO Collaborating Centres (CCs) and 117 National Influenza Centres (NICs) in 88 coun-tries. The GISN’s first major test was the influenza pandemic of 1957, during which it performed very well:
“At the start of May 1957, WHO received news of extensive influenza epidemics in Hong Kong and Singapore. By mid-May, the virus had been isolated by laboratories in Japan and Singapore. Within a week, laboratories in the WHO network had analysed the virus and identified it as a completely new virus subtype. Using radio and telegraph despatches, WHO alerted the world to the onset of a pandemic, allowing health services to brace themselves for an upsurge of cases and deaths. Samples of the virus were im-mediately distributed to vaccine manufacturers throughout the world.”71
The WHO coordinates the international response to any cross-border disease outbreak using resources from the Global Outbreak Alert and Response Network (GOARN). Created in 2000, the GOARN is a collaboration of existing institutions and networks which pool human and technical resources for the rapid identification and confirmation of, and re-sponse to, outbreaks of international importance.
The WHO’s overall mission, vision, objectives and activities with respect to influenza are set out in the WHO Global Influenza Programme (see box). Additionally, in the climate of concern arising from the ongoing outbreaks of H5N1 avian influenza in animals and infections in humans, in November 2005 a 12-point action plan was agreed at a joint meeting of the WHO, FAO, OIE and the World Bank, convened to discuss avian influenza and human pandemic influenza72.
WHO Global Influenza Programme
MissionContribute to reducing death and disease due to annual influenza epidemics and Prepare for the next influenza pandemic
WHO vision on influenza surveillance and control Effective and timely influenza surveillance in all regions of the world Antigenic and genetic match of influenza vaccine and current circulating influenza viruses Efficient national influenza control strategies and campaigns Sufficient influenza vaccines made available before and during pandemics and epi-demics
Objectives Increase and strengthen global epidemic and pandemic preparedness through:
Improved quality and global coverage of influenza surveillance Improved understanding of health and economic burden of influenza including benefits from epidemic control and pandemic preparedness Increased national epidemic and pandemic preparedness including vaccine and pharmaceutical supplies Expanded use of existing vaccines particularly in developing countries and in high-risk groups and accelerated introduction of new vaccines More rapid communication and information exchange between WHO Influenza Network Members and key partners and stakeholders
71 World Health Organisation, 2005 (see footnote 3).72 WHO strategic action plan for pandemic influenza 2006–2007. World Health Organisation, 2006.
4 Current situation

39 Swiss Re: Pandemic influenza
Priority activitiesGlobal Influenza will focus on four major groups of activities (including research) on:
Global influenza surveillance for accurate and timely recommendations on influenza vaccine composition Enhancement of global and national pandemic preparedness including initial outbreak investigation and coordination of rapid response Preparation and publication of technical and standard setting documents on influenza surveillance and control Providing international leadership in the coordination of implementation and advoca-cy of the Global Agenda on Influenza Surveillance, Prevention and Control
Concerning human health matters, the 12-point plan seeks to achieve two overarching objectives:
to exploit all feasible opportunities to prevent the H5N1 virus from developing the ability to ignite a pandemic and, should this effort fail,to ensure that measures are in place to mitigate the high levels of morbidity and mortality, and social and economic disruption that can be expected during the next pandemic
Among the strategic actions in meeting these objectives, the plan identifies the need to intensify rapid-containment operations. This has the goal of preventing the virus from increasing its transmissibility among humans, or delaying its international spread. This will be achieved by quickly assessing situations that potentially signal the start of efficient human-to-human transmission, and then intervening immediately using rapid-response field teams, and global and regional stockpiles of antiviral drugs and other supplies.
According to results from mathematical models, antiviral prophylaxis would need to reach 80% of the initially affected population within around three weeks of symptoms appearing among the first people infected with an emerging pandemic virus. Other measures, including restrictions on the movement of people in and out of the affected area, would also be implemented quickly and effectively.
Prophylaxis A prophylactic measure is one taken to maintain health and prevent the spread of disease.
Historically, pandemics have always brought an abrupt surge in the number of illnesses and deaths. Another consequence of a pandemic is increased absenteeism, so govern-ments and companies need to have plans in place to ensure the continuity of essential services. Core competencies that may be needed during a pandemic include an ability to rapidly increase the number of hospital beds, to find additional staff, and to procure and distribute essential medical supplies. Building the capacity to cope with these conse-quences of a pandemic is therefore another strategic action identified within the plan, and a specific goal relating to this action is ensuring that all countries have formulated and tested pandemic response plans. The WHO provides guidance and assistance to countries in how to develop their plans. The WHO also works with individual countries, regions and internationally, in order to test plans and identify gaps in core capacities. By the end of 2006, 178 countries had drafted or finalised a national preparedness plan73.
73 WHO activities in avian influenza and pandemic preparedness, January–December 2006. World Health Organisation, 2007.

40 Swiss Re: Pandemic influenza
4.2 International health regulations
A hundred years after the first international conference to monitor and control the inter-national spread of disease, a set of international health regulations was adopted in 1951. These are legally binding on all WHO member countries.
Originally adopted by WHO member states as the International Sanitary Regulations, the 1951 regulations were replaced by, and renamed, the International Health Regulations (IHR) in 1969. Under the 1969 regulations, member countries are required to notify the WHO if and when cholera, plague or yellow fever occur in their territory.
The scope of the regulations was extended by the IHR (2005), which came into force on 15 June 2007. The purpose and scope of the updated 2005 regulations are to prevent, protect against, control and provide a public health response to the international spread of disease in ways that are commensurate with, and restricted to, public health risks. Any unnecessary interference with international traffic and trade must be avoided. Important-ly, member states must now notify the WHO of all events that – through the international spread of disease – constitute a public health risk to other members, and which poten-tially require a coordinated international response. They must also respond to requests for verification of information regarding such events.
As a temporary mechanism until the IHR (2005) came into force, the Influenza Pandemic Task Force (IPTF) was advising the WHO on the response to avian influenza, the appro-priate phase of pandemic alert74 and the corresponding recommended response meas-ures, when to declare an influenza pandemic, and how the international community should respond.
4.3 Major advances in medical knowledge and treatment
The pace of research and development in the healthcare field enabled medicine in the 20th century to undergo revolutionary change. The advances made possible over the past hundred years have contributed to an extension in life expectancy of more than 35 years.
The healthcare landscape has changed dramatically during the past century, with many more tools available to help public health and medical professionals prevent and treat infectious disease. Many of these tools should contribute to improved outcomes in future infectious disease epidemics and pandemics.
Public health measuresPublic health measures are an important factor in the significant declines in infectious disease deaths, especially in the first half of the 20th century, and have contributed greatly to the increase in life expectancy. Improvements in sanitation, nutrition, hygiene and the cleanliness of drinking water have all led to a reduction in the spread of infectious disease. The introduction of chlorine in water stopped the spread of waterborne diseases such as typhoid and cholera. In addition, improvements in the identification and early treatment of people with transmissible infectious diseases, such as tuberculosis, has helped reduce the spread of infection and has contributed to decreased morbidity and mortality from these conditions.
74 See Chapter 1, Table 1.3 for further details.
4 Current situation

41 Swiss Re: Pandemic influenza
Another factor that has helped reduce the transmission of influenza and other infectious diseases is improved public health communications about epidemic spread within a par-ticular region. These measures have been instrumental in encouraging people to modify behaviour that would otherwise expose them to an increased risk of infection (for exam-ple, the contact modification – or “social distancing” – explored later in this publication75).
Prevention in the form of mass vaccination programmes has also had a dramatic impact on the incidence of infectious diseases, especially among the young. Certain diseases, such as smallpox, have been effectively removed as a cause of disease and death in the global population as a result of intensive containment and vaccination campaigns.
The past century has also seen a rapid expansion of knowledge about the causes of other serious chronic diseases such as cardiovascular disease, which has been substantially reduced with the help of public health campaigns to alert people to the dangers of smok-ing, sedentary lifestyles and poor dietary choices. Many deaths from influenza are related to co-morbidity from these chronic diseases, and the decrease in this burden will help reduce influenza deaths in a future pandemic.
Understanding and treating bacterial and viral diseaseThe rapid expansion of research into the origins of bacterial and viral diseases during the 20th century has led to major advances in our understanding of how these diseases are caused, as well as how to treat them.
In the 1930s, sulfonamide drugs were found to be active against streptococcal infections and, in the United Kingdom, the first pure extracts of penicillin were obtained. The range of antibiotics steadily increased with streptomycin being discovered in the United States in the 1940s, followed by many others. Importantly, many of these drugs are active against pneumonia, a frequently fatal infection. The widespread availability of antibiotics in the latter half of the 20th century in developed countries has been a major mitigating factor in treating secondary pneumonias due to influenza infections.
In the 1960s and 1970s, management of patients who were seriously ill with infections was enhanced with the introduction of intensive care units (ICUs). ICUs allow the medical profession to institute aggressive supportive measures during a critical phase of treatment, increasing the probability of survival among those who have access to this advanced care.
During the past century, advances in molecular biology have contributed to accelerated rates of vaccine development. While vaccines against diphtheria, pertussis and tetanus were made available in the 1920s, it was not until the 1950s that the first vaccinations against influenza and polio were developed. Vaccines for many other conditions includ-ing measles, mumps, rubella, chicken pox, meningitis, hepatitis and lyme disease have followed. Today, annual vaccination has an important part in reducing the morbidity and mortality associated with influenza.
As the genetic structure of viruses became better understood, the 1980s saw the rapid development of antiviral drugs. Since then, the arsenal of antiviral medicines has contin-ued to expand, and there have been considerable improvements in the management of viral diseases, notably in AIDS and viral hepatitis.
75 See Chapter 5, section 5.2.1 c).

42 Swiss Re: Pandemic influenza
4.4 Influenza vaccines
Vaccines are the most important medical intervention for preventing influenza and re-ducing its health consequences during a pandemic.
However, while they have been available since the 1950s, they were available neither soon enough, nor or in sufficient quantities, to have an impact on the first waves of either the 1957 or 1968 pandemics. These past problems, related to the length of the produc-tion process and inadequate manufacturing capacity, still remain, but they are being ad-dressed.
Timeline of the vaccine development and production processTraditionally, influenza vaccines are produced in fertilised chicken eggs. Eleven days after fertilisation, the influenza virus is injected into the eggs and accumulates in the fluid sur-rounding the embryo. A high-yielding donor strain is co-injected. The embryo becomes infected so that the virus can multiply. After several days of incubation, machines open the eggs and harvest the virus. Then the virus is carefully purified, chemically inactivated and used to produce the vaccine. On average, between one and two eggs are needed to produce one dose of vaccine. The entire production process lasts at least six months76.
Time to productionThe time needed to physically produce influenza vaccines using the traditional egg-based production technologies can be reduced in a number of ways. For example, it is possible to produce and store in advance bulk antigen (the component of a vaccine that brings out the immune response) which can protect against a specific subtype. However, ad-vance stockpiling of a true pandemic vaccine is not possible, as the vaccine must closely match the actual strain of the pandemic virus and must therefore await its emergence.
So-called pre-pandemic or imperfect vaccines against the H5N1 virus are being stock-piled in some countries, with the expectation that they will provide at least partial protec-tion against some future, related pandemic strain of H5N1.
The WHO and OIE are working on another step to shorten the time it takes to produce a vaccine – by approximately 14 days. If the pandemic preparedness alert phase reaches level 4 or above, they plan to make available to vaccine manufacturers pandemic vaccine viruses that have been developed using reverse genetics, before all safety tests have been completed77. Reverse genetics is a technology currently in development which allows for specific manipulation of the influenza genome. Methods for constructing new viruses for vaccines have been developed but are not yet in use commercially. If this method could be used on a larger scale, it may simplify and speed up the development of new vaccines.
An alternative to the current egg-based manufacturing methods may be to base vaccines on cell culture. Throughout the world, a number of contracts have been awarded to com-panies doing research into cell-based vaccine manufacture. This method offers a reliable, flexible, much faster and more easily scalable means of production compared with egg-based vaccine production78.
76 Backgrounder from www.gsk.com: Egg-based vs. cell-based influenza vaccine production. GlaxoSmithKline plc, 2005.
77 Early release of influenza viruses for pandemic influenza vaccine development. World Health Organisation, 1 February 2007.
78 Pandemic Planning Update. US Department of Health and Human Services, 13 March 2006.
4 Current situation

43 Swiss Re: Pandemic influenza
As a further future development, DNA-based vaccines offer a potential mid- to long-term solution to the problem of production delays, reducing the production period to between one and four months.
Because a new vaccine for seasonal influenza is produced almost every year, the steps required for vaccine development, licensing and production are familiar to both industry and regulatory agencies. However, to gain time during a pandemic, several activities are currently being undertaken ahead of time to enable rapid authorisation, production and marketing of vaccines. These include clinical trials to establish optimal vaccine formula-tion and the immediate registration of a ‘mock-up’ vaccine. The WHO is also working to-wards internationally agreed specifications that will accelerate the licensing of human pandemic influenza vaccines.
In addition, regulatory authorities in some countries may have emergency powers which come into play during a pandemic (for example, to permit the use of unapproved products if there is a reasonable belief the products may be effective and if the benefits outweigh the costs). Limitation of liability (on the part of vaccine manufacturers) is another issue that governments may need to face in any mass, emergency vaccination programme.
Production capacityThe greatest problem relating to vaccines is inadequate production capacity. Demand will unquestionably outstrip supply, particularly at the start of a pandemic.
Manufacturing capacity for influenza vaccines is concentrated in Australia, Europe, Japan and North America. The need for a vaccine will, however, be global. The present maximum manufacturing capacity – at around 350 million doses of trivalent vaccine per year – falls far below the expected demand during the first wave of a pandemic. In the past, influenza has tended to be more severe in the second wave. Should this happen, the extra few months could enable vaccine supplies to be increased.
Trivalent vaccinesTrivalent vaccines are the variety used for or seasonal flu vaccines. They contain three in-fluenza strains, two of type A and one of type B.
Following consultation with scientific experts working on national immunisation pro-grammes, along with national regulatory authorities, vaccine manufacturers and the re-search community, in September 2006 the WHO published an action plan to increase vaccine supply79. The plan describes the current situation of vaccine production (see Table 4.1), the estimated demand during a pandemic and the key challenges faced by the scientific community in closing the gap. The plan presents three main approaches to increasing vaccine availability:
increasing the uptake of the seasonal influenza vaccine, which would provide the vac-cine industry with more substantial and predictable demand, and enable it to increase production capacities accordinglyincreasing production capacity for pandemic vaccines by improving the production yields and increasing the likelihood that a vaccine will trigger an immune system de-fence (its immunogenicity), building new production plants, exploring other formula-tions of influenza vaccine, considering alternative ways of administering the vaccine in order to lower the dosage required, andbuilding on research and development efforts being undertaken by the research com-munity to design more potent and more effective vaccines, possibly to provide protec-tion after just one dose or to provide long-lasting immunity against a wide range of influenza virus strains
79 Global pandemic influenza action plan to increase vaccine supply. World Health Organisation, 2006.

44 Swiss Re: Pandemic influenza
Estimate of production capacity for current 350 million doses (inactivated trivalent vaccineinfluenza vaccine: containing 15 μg of HA per dose)Estimate of production capacity for potential 500 million doses (inactivated trivalent vaccineinfluenza vaccine, if manufacturers optimize containing 15 μg of HA per dose)current output (eg, by working 3 shifts/24 hours):Planned expansion for extra vaccine production- 780 million doses (inactivated trivalent vaccinecapacity in the next 2–3 years (280 million): containing 15 μg of HA per dose)Estimate if production should switch to mono- 2 340 million doses of pandemic vaccinevalent pandemic influenza vaccine, assuming (inactivated monovalent vaccine containingonly 15 μg of HA per dose (2009 projection): 15 μg of HA per dose)
Source: World Health Organisation, 2006 (see footnote 79)
The WHO is working with the wider research community to explore all the options set out in the action plan and to encourage the levels of financial investment that will be needed from all sources.
A high priority has been given by the WHO to investigating strategies that cut down on the use of antigen. Including an adjuvant (an ingredient which renders a vaccine more effective at lower doses) in the vaccine formulation could enhance the effectiveness of low doses of antigen, thereby finding a way to address limited antigen supplies and limit-ed manufacturing capacity.
4.5 Antivirals
The two principal roles played by antivirals in the management of seasonal influenza – prophylaxis and treatment – were explained in Chapter 280. Research has demonstrated their effectiveness when used for both purposes81.
Of the two classes of antiviral drugs specifically used in treating influenza, the oldest and most affordable drugs have been the M2 inhibitors, amantadine and rimantadine. Apart from their advantageous price, these drugs have a long shelf life – at least two decades and possibly more82. Amantadine prophylaxis has also been tested in a pandemic situa-tion, with 70–80% success, even in people with no previous exposure83. Their effective-ness as treatment depends on them being administered within 24 hours of a person be-coming ill, following which they reduce fever and symptoms by between one and two days84.
The use of the M2 inhibitors, however, faces several problems. As noted in Chapter 2, drug resistance may develop quickly. Also, their safety in pregnant women is questiona-ble. In elderly patients, the dose has to be reduced and, in certain patient groups, close clinical monitoring is needed. During a pandemic, when health services are challenged by a sudden and sharp surge in the number of patients, keeping a careful watch on indi-vidual patients may not be possible85.
80 See section 2.4.81 World Health Organisation, 2005 (see footnote 3).82 World Health Organisation, 2005 (see footnote 3).83 Monto AS, Gunn RA et al. Prevention of Russian influenza by amantadine. Journal of the American Medical
Association, 1979; 241: 1003–7.84 Van Voris LP, Betts RF et al. Successful treatment of naturally occurring influenza A/USSR/77 H1N1.
Journal of the American Medical Association, 1981; 245: 1128–31.85 World Health Organisation, 2005 (see footnote 3).
Table 4.1Short-term potential availability of the influenza vaccine (per year)
Table 4.1Short-term potential availability of the influenza vaccine (per year)
4 Current situation

45 Swiss Re: Pandemic influenza
Drugs in the second, and newer, class have a better safety profile and are less prone to the development of drug resistance86. These are the neuraminidase inhibitors – osel-tamivir, commercially known as Tamiflu, and zanamivir, commercially known as Relenza87. Their efficacy depends on administration within 48 hours after the onset of symptoms, and the sooner the better.
In the past, the main constraints surrounding the neuraminidase inhibitors have been price and supply88. However, Roche – the manufacturer of Tamiflu – has established a special price for government orders and has implemented a further price reduction for low-income countries. Tamiflu has been sub-licensed to companies in India, China and an agreement has been signed with an African company.
The global manufacturing network for Tamiflu – eight Roche sites and 19 external manu-facturers located in nine countries – can produce in excess of 400 million treatments per year. As supply now significantly exceeds Tamiflu orders, Roche is tailoring its production schedule to this current level of need, while maintaining a buffer stock and the capability to gear-up production quickly to full capacity in response to a surge in demand89.
Antiviral drugs have important roles to play in protecting against and treating both sea-sonal and pandemic influenza. Under pandemic conditions, their importance is elevated during the first wave of infection when vaccines are not likely to be available. Once a pandemic has been declared, antiviral drugs will be the principal medical intervention for reducing morbidity and mortality until a vaccine is developed. In the absence of vaccines, though while not conferring immunity, antivirals will be the only medical intervention ca-pable of providing both protection against disease and therapeutic benefit in people who are ill90. In the event of an influenza pandemic, shortening the symptom period by a few days through the use of antivirals will also help to reduce the spread of the virus (unlike vaccines, neuraminidase inhibitors do not need to be tailored to the virus each year – they are theoretically effective against all strains of influenza).
Recent studies, based on mathematical modelling, indicate that these drugs could be used prophylactically near the start of a pandemic to reduce the risk that a fully transmis-sible virus will emerge91. The success of this strategy depends on several assumptions about the early behaviour of a pandemic virus, which cannot be known in advance, and critically on how quickly clinical cases are diagnosed, and the speed with which antiviral drugs can be distributed. In support of this strategy, Roche has donated more than five million courses of Tamiflu to the WHO, which have been stockpiled in reserve for emer-gency use in the first areas to be affected by an emerging pandemic virus. Three million courses are a ‘fire blanket’, stored at Roche and to be shipped as per instructions from the WHO. The additional two million courses are for regional stockpiling. The WHO has assigned these to countries where a pandemic is considered more likely to start, and which are not yet so well prepared.
Even if this strategy is unsuccessful in preventing a pandemic virus from emerging, anti-virals may at least delay its international spread, thereby buying time to build vaccine supplies. At today’s global capacity, each day gained could allow manufacturers to pro-duce an extra five million doses of vaccine92.
86 Surveillance operations monitor for emerging viral resistance to these newer class of antivirals.87 World Health Organisation, 2005 (see footnote 3).88 World Health Organisation, 2005 (see footnote 3).89 Roche update on Tamiflu for pandemic preparedness. Roche Media News, 26 April 2007.90 World Health Organisation, 2005 (see footnote 3).91 Ferguson, NM, Cummings DAT et al. Strategies for containing an emerging influenza pandemic in Southeast
Asia. Nature, 2005; 437(7056): 209–214.92 World Health Organisation, 2005 (see footnote 3).

46 Swiss Re: Pandemic influenza
Stockpiling drugs in advance is presently the only way for governments to ensure that sufficient supplies are available at the start of a pandemic. Roche has received and fulfilled orders for Tamiflu from more than 80 countries worldwide. The magnitude of these orders varies, with some countries stockpiling or intending to stockpile adequate quantities of Tamiflu to cover between 20% and 40% of their population. Orders from governments amount to about 215 million treatments in total. Governments have also developed plans to distribute antivirals, and criteria for use. In most cases, the intention is to use the drugs for treatment of cases with clinical symptoms, and those coming into contact with them – including healthcare workers. Prophylactic use on a large scale is not currently envisaged.
4.6 Antibiotics
Antibiotics do not protect against initial infection from an influenza virus, nor do they slow down the spread from person to person by reducing the amount of virus shed by those already infected. However, they have been successful in significantly reducing mortality from bacterial pneumonia, which is a major complication associated with influenza infec-tion93. The continuing importance of antibiotics to medicine means that considerable re-search has been undertaken into discovering and producing them. As a consequence, a growing arsenal of antibiotics is available to treat bacterial infections. These drugs will continue to have a significant impact on morbidity and mortality.
4.7 Conclusions
The world is now much better prepared to cope with an influenza pandemic than at any other time in history. International agencies, networks, systems and plans formed since the beginning of the last century keep the international community constantly alert to the threat of influenza pandemics and ready to respond. Advances in medical knowledge and treatment, combined with improvements in hygiene and nutrition, have effectively elimi-nated many historical causes of infectious disease epidemics. Antibiotics are important in reducing deaths due to bacterial pneumonia, the major complication associated with influ-enza infection. The newer class of antivirals can be used prophylactically near the start of a pandemic to reduce the risk that a fully transmissible virus will emerge – or at least de-lay its international spread – thereby gaining more time for the production of vaccines, the most important medical intervention for preventing influenza infections.
93 See Chapter 2, Figure 2.3.
4 Current situation

Contact modification (“social distancing”) is the main example of the non-pharmaceutical intervention assumptions contained within Swiss Re’s epidemiological model; a reduction in mixing between people can make a significant contribution to reducing the spread of a pandemic.

48 Swiss Re: Pandemic influenza
5.1 Objectives and scope of the model
Mortality, along with any events, trends or developments that have an impact on mortality, is by definition of great interest to the life insurance industry. A new influenza pandemic is one of the most uncertain risks, and potentially the largest, that may affect mortality in the short to medium term. The purpose of Swiss Re’s pandemic influenza model is to im-prove our understanding of this risk – both in terms of the likelihood of a pandemic event, and the range of severities that may occur.
To date, a range of studies and models have been published which provide insight into various aspects of pandemic mortality risk. Existing models tend to focus on questions of public health, the deployment of resources and government policy. However, few of those currently available include outcomes, neither do they provide a level of detail, nor disaggregations of data, that would enable a systematic analysis of the current risk facing the insurance industry.
Some models use stochastic processes to assess the measures needed to avert or con-tain a pandemic – a very useful focus in public health and in developing public policy. Others consider the impact of interventions (ie, they analyse what would happen if spe-cific steps were taken to reduce the impact of a pandemic, such as vaccination), but these tend to combine adult ages within the study into one group, thereby losing the age-spe-cific characteristics that are highly significant in the most recent pandemics. Some mod-els focus on certain characteristics of the 1918 influenza pandemic, and others involve splitting data sets by geography and demographics. All of these approaches offer useful insights and have their own strengths and weaknesses, and collectively they strengthen the ability of public and private institutions to plan for a new pandemic.
Stochastic processesA stochastic process assumes that the probability of an event happening is governed by chance. For example, on Monday morning two people are healthy and uninfected. By Tuesday afternoon each has, say, a 1-in-2 chance of becoming infected. If we do not use a stochastic process, we would assume that one becomes infected and one does not (ie, infected = 2 x 0.5 = 1). In a stochastic process we work on the basis that each event is governed by chance. The outcome could be that nobody is infected, or that both people are infected (and the probability of either of these outcomes = 0.25). Or it could be that one of the two is infected (probability = 0.5). A stochastic model would randomly choose one outcome for each person and the final number infected would be an aggregation of these chance outcomes.
Swiss Re’s model has its own set of priorities and is designed to answer certain ques-tions relevant to life insurance, but which are also of use in public health, government planning, and in generating a better understanding of this risk among the general public. The model has the following key benefits:
in all its calculations it includes demographically-useful quinquennial age groups (ie, banded into groups spanning five years – 30 to 34, 35 to 39 etc)it takes account of a wide range of factors present in the three pandemics of the last century (for example, differences in mortality and susceptibility to infection by age)it includes many of the widely-recognised interventions that may slow or mitigate the effects of a pandemic, and it seeks to imitate the capacities of the public and institutions to respond to a pandem-ic, and to maintain these responses
5 Swiss Re’s pandemic influenza model

49 Swiss Re: Pandemic influenza
The model does not cover every single aspect of possible pandemic influenza modelling. In particular, the model does not take into account exactly how the influenza virus would spread from place to place within the borders of a particular country, nor does it account for the fact that pandemics develop in an especially unpredictable manner in the first few days of spread. For those intending to apply the results of the Swiss Re model in practice, it is essential that the limitations of this particular mathematical modelling process are understood94.
The model is designed to generate two main outcomes: The focus, first of all, is to create a large set of randomly generated, synthetic pandem-ics by using information about viruses that have caused past pandemics – in particu-lar their ability to cause disease and death (pathogenicity), and their ability to spread. The outcomes of these hypothetical pandemics, modelled to simulate the effects of a range of modern interventions, provide an understanding of the range and likelihood of possible pandemic events based on historical precedents.Also of interest is the effect of a modern context and modern interventions on any plausible influenza pandemic. Differences between today’s environment and the envi-ronment in which historical pandemics occurred include demographic factors (age structure, travel patterns, population density), institutional considerations (media and information, government capacity, healthcare capacity), technological advances (med-ical tools such as antibiotics and antivirals, medical knowledge about the influenza virus, communications infrastructure) and psycho-social shifts (risk aversion, fatalism).
In short, the model can use a range of different assumptions to simulate a new viral strain which might emerge, and tell us what impact this would have on the global popu-lation. It can also tell us how a real pandemic that took place sometime in our history would look if it happened today.
5.2 Methodology
Swiss Re’s model has been constructed in such a way that any plausible influenza pan-demic can, in most significant respects, be reproduced. This section describes how a simulated pandemic is produced, and applies to any chosen set of pandemic parameters.
5.2.1 Individual event simulationsMany parameters are hard-coded into the model. Each simulation performed by the model then needs two additional variables to be provided, from which it can generate a number of other factors relevant to the eventual outcome. These two variables, which are gener-ated randomly from historically-based distributions each time the model is run, are as follows (see box on next page for more details):
the ability of the pandemic to cause death (its lethality), andits ability to spread (expressed as the reproduction value at time zero, R0)
These two numbers are the ‘seed’ values, which the model uses to generate a variety of other variables.
The model calculates spread at discrete time intervals, each lasting 24 hours. It begins on Day 1 with a number of people infected in any chosen country, and in any chosen age group. The number infected by Day 2 is a mathematical function based on the underlying contagiousness of those already infected on Day 1 and the number of contacts they have with susceptible people. As the days go by, more people become infected, fewer remain susceptible, and an increasingly large proportion of contacts occur with people who have recovered (and who are therefore unsusceptible). Eventually, after a number of days, the pool of susceptible people is sufficiently depleted (and the pool of recovered people suf-ficiently large) that the number of new infections starts to decrease instead of increasing. At this point, the pandemic has peaked and the number of newly infected people drops rapidly.
94 See section 5.3 for further discussion on limitations.

50 Swiss Re: Pandemic influenza
Spread is assumed to happen between, and within, age groups according to an age-mixing matrix contained within the model. Spread also occurs between countries, as a result of infected people travelling across borders.
The natural course of the pandemic can be changed by deliberate actions which can reduce the daily number of contacts between people, reduce the number of people who are susceptible, or change the contagiousness of infected people. These deliberate inter-ventions to impede the spread of the virus are examples of how the interplay between in-fected people and those who are susceptible can be adjusted in the simulations produced by the model.
Lethality, mortality and death-per-caseLethality, as used here, refers to the number of deaths per infection (in simple terms, how many people does it kill as a proportion of those infected). Mortality refers to a rate of death in the whole population, including those infected and uninfected. Also, lethality should not be confused with death-per-case, which is the rate of death among people who are both infected and who become sick (ie, they display clinical symptoms). Death-per-case is also sometimes referred to as the case fatality rate.
For example, take a population of 1 000 people. 600 of them become infected from a new virus. Of these 600 infected people, 300 of them (representing 30% of the total 1 000) become sick. Ultimately, three people die. The mortality, lethality and death-per-case are calculated as follows:
Calculation ResultMortality rate 3/1 000 0.3%Lethality 3/600 0.5%Death-per-case 3/300 1%
R0 – reproductive value at time zeroR0 is the reproductive value of a virus at time zero (ie, at the beginning of Day 1 referred to in the main text above). This represents the average number of people who would subsequently be infected by any newly infected person in an entirely susceptible popula-tion (ie, at the start of a pandemic or epidemic). R0 is therefore a basic measure of the ability of a virus to spread, and can differ slightly by country depending on the number of people in each age group (ie, R0 is higher if a greater proportion of people are in ages that have more daily contacts – see Figure 5.4 and associated commentary). R0 and lethality rates used in calibrating the model are rates specific to the United States; other country-specific rates are based on these US rates, but adjusted to accommodate demographic differences.
5 Swiss Re’s pandemic influenza model

51 Swiss Re: Pandemic influenza
Constants within the modelA number of constants are contained within the model itself and these are used in vary-ing proportions for all pandemics modelled. Exactly how these pre-defined parameters are used depends on the lethality and on the spread (R0) value applied to the particular simulation. For example, a baseline age profile is used to model the level of bacterial pneumonia deaths which are expected to result in each age group. Similarly, such base-lines exist for deaths due to viral pneumonia or cytokine storms95, and for contagious-ness (by day) since infection. The precise way in which the model uses these constants depends on the seed values.
The number of ‘countries’ in the model has been set at 37, with most of the 37 being individual countries but some being aggregations of countries to make up, in total, the population of the world. Age groups are quinquennial to age 79, with an upper group consisting of those aged 80 and above. As set out above, each simulation begins on Day 1 with a few infections, specified by country and by age group. The model is usually used to estimate how the pandemic in question would spread within the first 365 days, although this can be varied.
Parameters within the modelThe model also contains a number of parameters which contribute towards producing the end results. The easiest way to understand these is to consider their purpose in the model structure. The parameters fall into basically three categories:
Inception variables and calibrationsCreated using the R0 value and the lethality particular to each simulation, these varia-bles are established automatically at the start of the simulation but thereafter remain constant throughout (see Figure 5.1 for a diagrammatic summary). The inception vari-ables define the epidemiological characteristics of the virus being simulated – such as the age profile of those predicted to die from the virus, or the degree of contagiousness at different ages (the R0 value can differ slightly by country depending on the number of people in each age group – see box above).Demographic characteristicsThese are a set of parameters defined to represent populations in each of the territories, or aggregations of territories, being modelled (they include, for example, the age pro-file of the population, the size of the population, and rates of travel to and from other countries). Intervention assumptions These are used to define the capacity of each territory to respond using non-pharma-ceutical or pharmaceutical interventions, and the effectiveness of each type of inter-vention in slowing the spread of the pandemic or reducing the mortality resulting from it (see Table 5.1).
Non-pharmaceutical intervention assumptions Pharmaceutical intervention assumptionsEffectiveness of social distancing Size of national stockpiles of antiviral drugs(contact modification) and supply ratesEffect of reduced land and air border crossings Effectiveness of antivirals in slowing spreadin reducing spread and reducing various categories of mortality Effectiveness of antibiotics in reducing bacterial pneumonia deaths
95 These baselines are different because these causes of death typically have differing impacts at various ages; see Chapter 2, section 2.3 for further details and an explanation of cytokine storms.
Table 5.1Examples of intervention assumptionsTable 5.1Examples of intervention assumptions

52 Swiss Re: Pandemic influenza
This figure summarises how data inputs, along with the constants contained within Swiss Re’s model, are used to produce the inception variables which contribute towards producing the end results. The labels in brackets describe how each item of data is sourced or generated.
Figure 5.1Inception variables used by the modelFigure 5.1Inception variables used by the model
Data inputs based on historyR0 values(historical data)
Scaling(mathematical)
Profile of mortality by age and by cause(simulation-specific variable)
Proportion of deaths due to bacterial pneumonia or viral pneumonia/cytokine storm by age (mathematical)
Viral pneumonia/cytokine stormmortality age profile (constant)
Lethality values(historical data)
Seed values for each simulation
Inception variables
Distributional fit(mathematical)
Distributional fit(mathematical)
R0
(randomly generated)Lethality(randomly generated)
Bacterial pneumonia mortalityage profile (constant)
Viral pneumonia/cytokine stormmortality duration profile (constant)
Bacterial pneumonia mortality duration profile (constant)
Scaling(mathematical)
Contagiousness duration profile(constant)
Profile of contagiousness by age and duration (simulation-specific variable)
Profile of clinical infection by age and duration (simulation-specific variable)
Profile of lethality by age, duration and cause (simulation-specific variable)
5 Swiss Re’s pandemic influenza model

53 Swiss Re: Pandemic influenza
a) Inception variables and calibrations
Age profile of lethalityThe first variable to be defined in the model is the age profile of lethality (ie, in which age groups does the pandemic cause the greatest number of deaths).
The model assumes that pandemics with high rates of lethality result in especially high rates of death among young adults, as was the case in 1918. Particular causes of the ‘hump’ of deaths among young adults in 1918 are assumed to be the higher levels of primary viral pneumonia and cytokine storms. This assumption is based on an analysis performed by Swiss Re on data relating to the three 20th century pandemics, enabling a profile to be derived for bacterial pneumonia deaths (best described as a U shape – ie with mortality peaking at childhood and among the elderly) and deaths from viral pneu-monia and cytokine storm effects (a hump at young adult ages only).
The model takes the single lethality input value and generates an age-specific mortality profile using these two causes of death (see Figure 5.2). Pandemics with the usual low lethality, such as in 1957 and 1968, are assumed to be entirely due to bacterial pneumo-nia (U-shaped). Mortality in pandemics with very high lethality, such as 1918, is a combi-nation of the two causes (W-shaped). The impact of each of the two causes changes proportionally as lethality increases.
0.00
0.01
0.02
0.03
0.04
0.05
1918 model
1918 actual
80
+
75–
79
70–
74
65
–69
60
–6
4
55–
59
50
–5
4
45
–4
9
40
–4
4
35
–39
30
–3
4
25–
29
20–
24
15–
19
10–
14
5–
9
0–
4
0
0.004
0.008
0.012
0.016
0.020
1968 model
1968 actual
1957 model
1957 actual
1918 lethality 1957 and 1968 lethality
Age
Source: Generated by Swiss Re’s model using data from Dowdle WR. Influenza A virus recycling revisited. Bulletin of the World Health Organisation, 1999; 77 (10): 820–828, and Taubenberger JK and Morens DM, 2006 (see footnote 47)
Figure 5.2Age-specific lethality rates, model versus actual
Figure 5.2Age-specific lethality rates, model versus actual

54 Swiss Re: Pandemic influenza
The same profile of mortality is used for every country, but the profile may be scaled up or down depending on the lethality specific to each country modelled. The reference value is lethality in the United States (see Table 5.2 – the United States was chosen as a refer-ence because lethality data from this country was used to calibrate the model due to its reasonably good quality). Country-specific lethality is assumed to be equal to the ratio between US life expectancy and each other country’s life expectancy96. On this basis, for example, the expected pandemic influenza lethality in 2006 for India is taken to be approximately 20% higher than for the United States, and for Canada some 3% lower. Although life expectancy in the United States is higher than it was in 1918, this is not reflected in the lethalities chosen for that country – this means that the results produced by the model in respect of the US are likely to be modestly conservative.
US lethalityPandemic start year (death per infection)1889 0.375%1918 1.1%1957 0.2753%1968 0.054%
With respect to 1918, a wide range of lethality values and clinical infection rates are given in the lit-erature describing this pandemic. The 1.1% lethality assumed here is based on a clinical infection rate of 29.4% and an assumption that 55% of those infected are symptomatic, and is equivalent to a death-per-case of 2.04%.
Rates of clinical infectionThe second main variable contained within the model, derived at the start of each simu-lation, is the pattern of rates of clinical infection according both to age and to the number of days elapsed since infection (rate of clinical infection refers to the proportion who are sick).
In order to generate this variable, the model uses the two main, but distinct, types of illness that people can typically develop having become infected with the influenza virus – bac-terial pneumonia and viral pneumonia/cytokine storm (these correspond to the causes of death used to model lethality). The model assumes that each of these two types of illness will have varying effects, depending on how much time has elapsed since the infection occurred (the duration profile)97. Each age group in the model experiences a proportion of deaths resulting from either of these two causes. A sickness rate (morbidity) for each age group is derived from a weighted average of the duration profiles of each cause. Viral pneumonia and cytokine storms are expected to manifest themselves a few days after in-fection, while bacterial pneumonias are expected to take longer to develop. This means that, in the model, morbidity peaks earlier in young adults in higher lethality pandemics (this age group being particularly susceptible to viral pneumonia and cytokine storms), but in all other cases it peaks only after approximately six days. The total mortality per age group is distributed by ‘duration since infection’ using the same patterns that apply to morbidity.
96 Life expectancy data is derived from The World Factbook, US Central Intelligence Agency, 2006.97 Derived from data in Hayden FG and Fritz RD. Local and systemic cytokine responses during experimental
human influenza A virus infection: Relation to symptom formation and host defence. Journal of Clinical Investigation, 1998; 101(3): 643–649.
Table 5.2US lethality assumed for previous recorded pandemics (no treatment given)
Table 5.2US lethality assumed for previous recorded pandemics (no treatment given)
5 Swiss Re’s pandemic influenza model

55 Swiss Re: Pandemic influenza
Incubation periodWhile it constitutes a variable, the incubation period of the virus is not explicitly modelled. Instead, it is implied by the age and duration-specific rates of clinical infection. In high lethality pandemics the incubation period implied in the model is typically an average of two days, while for low lethality pandemics the period is 2.3 days. The incubation periods used in the model are in line with those given by various sources98.
ContagiousnessThe next main variable in the model describes the degree of contagiousness (or infectivity) by age and by the number of days elapsed since infection. This variable ignores people’s behaviour (which is explicitly modelled – see below), and refers only to their ability to shed infectious viruses. The peak of contagiousness is assumed to occur on the second day after the day of infection (see Figure 5.3). Those who have recovered from being ill are generally accepted to be not contagious99, and anybody who is infected but not showing symptoms is assumed to be far less contagious than someone with symptoms.
0%
10%
20%
30%
40%
50%
60%
70%
87654321
Proportion of total
Duration since infection (in days)
This profile is always scaled to accommodate spread (R0). The graph shows, for example, that around 64% of those infected by an average infected individual who survives to Day 8 would be in-fected on Day 2 (assuming that mixing behaviours are equal at each duration), about 26% of subse-quent infectees would be infected on Day 3, around 5% on Day 4 etc.
Source: derived using information from Hayden FG and Fritz RS, 1998 (see footnote 97)
Behavioural factorsThe model also specifically considers behavioural factors, which have an impact on trans-mission of the influenza virus by infected people mixing with non-infected people. Mixing by the sick is currently set by the model to be 50% of ‘normal mixing’ (ie, people who are sick will have half as many contacts with others when compared with healthy people). Those who are healthy, despite being infected, are assumed to mix normally, while suc-cessfully treated people (using antibiotics or antivirals) mix at a rate of 80% of ‘normal’ mixing. In the absence of data to show the mixing habits of sick or recovered people, the assumptions were generated by consensus within Swiss Re’s project team after discus-sion as to what was reasonable.
98 Ward P, Small I et al. Oseltamivir (Tamiflu) and its potential for use in the event of an influenza pandemic. Journal of Antimicrobial Chemotherapy, 2005; 55(suppl. S1): i5–i21; Longini IM, Halloran ME et al. Contain-ing pandemic influenza with antiviral agents. American Journal of Epidemiology, 2004; 159(7): 623–633; World Health Organisation (WHO) Writing Group. Non-pharmaceutical interventions for pandemic influenza, international measures. Emerging Infectious Diseases¸2006; 12(1): 81–87; Mills CE, Robbins JM et al. Transmissibility of 1918 pandemic influenza (letter). Nature, 2004; 432(16): 904–906.
99 Ferguson N, personal communication, 2007 (this communication forms part of the work undertaken by Professor Ferguson of Imperial College London in reviewing the assumptions, methodology and results of Swiss Re’s model; the documentation is not available in the public domain).
Figure 5.3Duration-specific profile of individual infectivity (behaviour not considered)
Figure 5.3Duration-specific profile of individual infectivity (behaviour not considered)
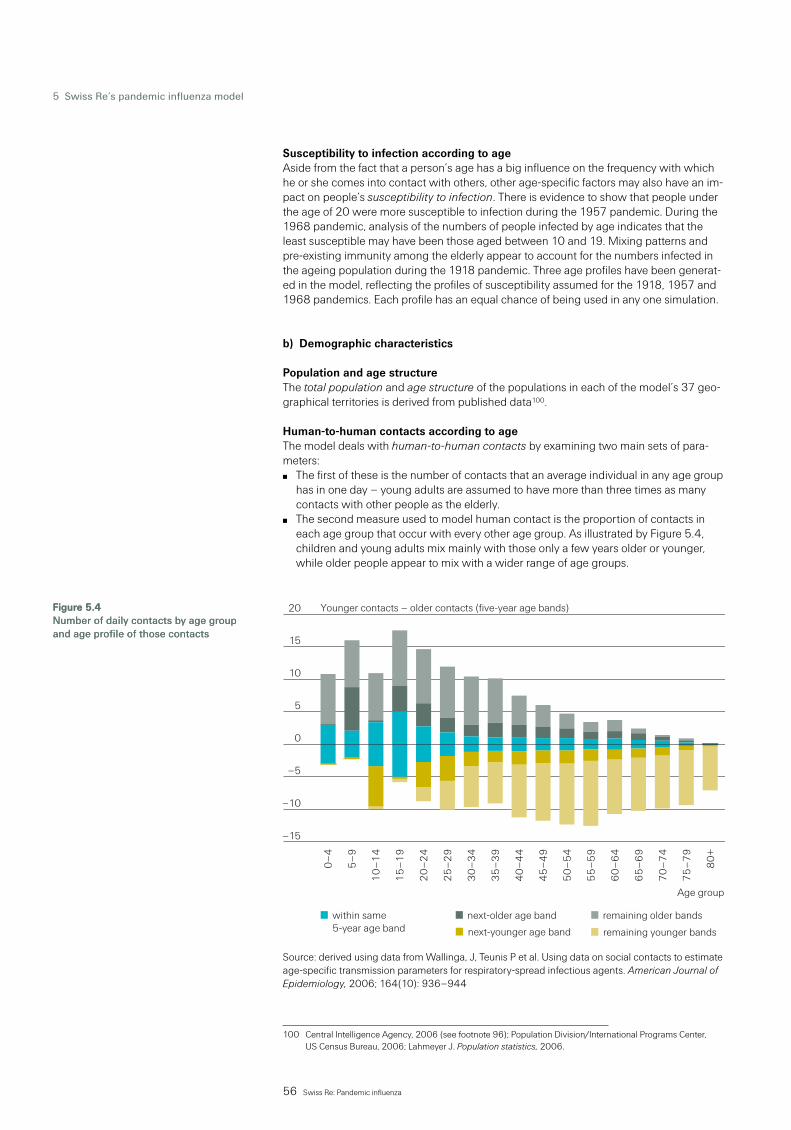
56 Swiss Re: Pandemic influenza
Susceptibility to infection according to ageAside from the fact that a person’s age has a big influence on the frequency with which he or she comes into contact with others, other age-specific factors may also have an im-pact on people’s susceptibility to infection. There is evidence to show that people under the age of 20 were more susceptible to infection during the 1957 pandemic. During the 1968 pandemic, analysis of the numbers of people infected by age indicates that the least susceptible may have been those aged between 10 and 19. Mixing patterns and pre-existing immunity among the elderly appear to account for the numbers infected in the ageing population during the 1918 pandemic. Three age profiles have been generat-ed in the model, reflecting the profiles of susceptibility assumed for the 1918, 1957 and 1968 pandemics. Each profile has an equal chance of being used in any one simulation.
b) Demographic characteristics
Population and age structureThe total population and age structure of the populations in each of the model’s 37 geo-graphical territories is derived from published data100.
Human-to-human contacts according to ageThe model deals with human-to-human contacts by examining two main sets of para-meters:
The first of these is the number of contacts that an average individual in any age group has in one day – young adults are assumed to have more than three times as many contacts with other people as the elderly. The second measure used to model human contact is the proportion of contacts in each age group that occur with every other age group. As illustrated by Figure 5.4, children and young adults mix mainly with those only a few years older or younger, while older people appear to mix with a wider range of age groups.
–15
–10
–5
0
remaining younger bandsnext-younger age band
80
+
75
–7
9
70
–7
4
65
–6
9
60
–6
4
55
–5
9
50
–5
4
45
–4
9
40
–4
4
35
–3
9
30
–3
4
25
–2
9
20
–2
4
15
–1
9
10
–1
4
5–
9
0–
4
5
10
15
20
remaining older bandsnext-older age bandwithin same 5-year age band
Younger contacts – older contacts (five-year age bands)
Age group
Source: derived using data from Wallinga, J, Teunis P et al. Using data on social contacts to estimate age-specific transmission parameters for respiratory-spread infectious agents. American Journal of Epidemiology, 2006; 164(10): 936–944
100 Central Intelligence Agency, 2006 (see footnote 96); Population Division/International Programs Center, US Census Bureau, 2006; Lahmeyer J. Population statistics, 2006.
Figure 5.4Number of daily contacts by age group and age profile of those contacts
Figure 5.4Number of daily contacts by age group and age profile of those contacts
5 Swiss Re’s pandemic influenza model

57 Swiss Re: Pandemic influenza
Given that mixing differs by age group, a changing age structure in the population is likely to result in different viral spread capability. Changes in age structure are considered when deriving spread (R0) values relevant to today. Different age structures in the various coun-tries also result in different R0 values being applied. An ageing population tends to result in a lower R0 value, especially as mixing rates peak among young adults, but also because children are generally more contagious (ie, there are fewer highly contagious children around in an older population).
Demographically defined epidemiological factors: pre-existing immunityThe model also contains some demographically defined epidemiological factors. These include pre-existing immunity to a pandemic virus. In the case of age-specific immunity there is evidence to suggest that a proportion of people older than 65 had some immuni-ty to the 1918 pandemic virus101; this is likely to have been caused by exposure to a simi-lar virus a number of decades previously. There also appears to have been a degree of pre-existing immunity among some people aged over 77 during the 1968 pandemic, thought to relate to exposure to a virus that circulated before 1893. Simulations performed by Swiss Re’s model that reproduce the 1918 pandemic take account of this. While it is possible that a pandemic happening now might be mitigated by pre-existing immunity (relating to the 1957 and 1968 pandemics), for current simulations this factor has not been included (at this stage Swiss Re believes it has an insufficient understanding of ‘virus recycling’ to include it in simulating randomly generated pandemics).
TravelTravel between one and another of the 37 territories modelled consists of either air travel or surface travel (by land or sea). The Swiss Re model uses a table of daily movements between countries, by air and surface. The table of surface crossings takes into account a number of demographic, socio-economic, cultural and political factors that might af-fect the numbers travelling. The table describing air travel mainly considers distance and population as factors impacting the numbers travelling.
c) Non-pharmaceutical intervention assumptions
Contact modificationThe first, and most widely used, of the non-pharmaceutical intervention assumptions in the model is contact modification (also known as “social distancing”). The model is able to reflect a reduction in mixing within each of the age groups in any of the countries modelled. Due to the fact that this intervention occurred in past pandemics, it is a com-ponent of all model runs including those imitating 1918, 1957 and 1968.
There are three levels of contact modification in the model, each of varying intensity and duration. They are triggered in each country when deaths reach a certain level – defined as a proportion of the crude death rate102. For example, a low level of deaths would trigger a low intensity of contact modification, while a high level of deaths would result in a more intense intervention. Because it takes time for news to spread and for people to react, contact modification is only activated a few days after the trigger is reached. The de-activation of each level uses a similar technique to that which switches it on: an “off” trigger occurs, followed by a delay and then de-activation of that episode of contact mod-ification.
Each episode of contact modification is assumed to start at full intensity, and then to fade or weaken over time – however strong the intervention might be initially, we assume that it will not be sustained at full strength in the days that follow. This weakening begins im-mediately after activation, and may reduce the intervention to nothing, independently of whether or not an “off” trigger is reached.
101 Luk J, Gross P et al. Observations on mortality during the 1918 influenza pandemic. Clinical Infectious Diseases, 2001; 33: 1375–1378.
102 Central Intelligence Agency, 2006 (see footnote 96). Crude death rate (CDR) is the most basic measure of mortality (ie, deaths/population).

58 Swiss Re: Pandemic influenza
Deaths may increase again after one episode of contact modification. This resurgence in deaths may result in a second or subsequent episode of contact modification. These later episodes of contact modification occur at a reduced intensity (due to an hysterisis effect, best described here as a weakening or fatigue due to recent experience), while the trig-gers setting them off increase (due to a large extent to the fatigue, in that greater levels of mortality are required to precipitate a response). As such, each later episode is progres-sively weaker than the previous and occurs at a higher level of mortality than the prior episode. The methodology relating to contact modification is based on evidence regard-ing patterns of behaviour which manifested themselves during the spread of the 1918 pandemic influenza virus within various US cities103.
Travel restrictions Travel restrictions can also be simulated in the model. The method involves reducing or increasing the rate of travel as required. This can be done for both surface travel and air travel, and may vary by age group and by pairs of source and destination country. The as-sumption for the baseline model is that no travel modification occurs, as this intervention has virtually no impact on the total number of deaths produced by each simulation.
d) Pharmaceutical intervention assumptions
Antibiotics Antibiotics are assumed to reduce bacterial pneumonia mortality by 70%, but to have no effect on transmission of the influenza virus itself. Antibiotics are assumed to be used by a maximum of 80% of those who require them in the most developed countries. The poorest of the developing countries are assumed to have usage levels as low as 13.5%. These numbers are based on a ‘scoring system’ developed by Swiss Re using published health system data from various sources.
AntiviralsAntivirals, which are being stockpiled by many governments, are expected to slow the spread of influenza and substantially reduce overall illness and mortality. However, their effectiveness against a wide range of potential viruses is not fully understood. The model therefore assumes that antivirals would not work at all – whether used for treatment or prophylaxis – in 1 in 4 simulated pandemics.
Antiviral medications are assumed to be used in three ways:to treat sick peopleto target those with whom sick people come into contact, in order to reduce sickness and prevent infection (targeted antiviral prophylaxis), andgiven to the general population to reduce sickness and prevent infection (general anti-viral prophylaxis)
Although the current model is set up to allow for targeted and general antiviral prophy-laxis, this capability has not been used in the set of simulations that are written-up in sec-tion 5.4 of this chapter. Few countries currently have sufficient antiviral stocks to sup-press a widely disseminated pandemic outbreak, whether using prophylaxis in either a targeted or general way. As currently constructed, the model assumes that current stocks are most efficiently used if application is restricted to treatment only. However, given the progress being made in terms of stockpiling, targeted prophylaxis is likely to become fea-sible in many countries by late 2007.
The first factor considered when simulating this intervention is the availability of antivirals. The stockpile in each territory varies, as does daily supply and usage. If stocks are depleted or non-existent in a given country, antiviral treatment is assumed not to occur until stocks are replenished.
103 Ferguson N, 2007 (see footnote 99).
5 Swiss Re’s pandemic influenza model

59 Swiss Re: Pandemic influenza
Antiviral treatment is assumed to reduce infectiousness, as well as sickness and mortali-ty. It will therefore slow the spread of the simulated pandemic and reduce death rates. Every person receiving antivirals is assumed to get them within 48 hours of becoming sick. However, because this requirement is likely to be challenging even for the best of healthcare systems, it is assumed to be achieved in only 65% of people who become ill in highly developed countries. In less developed countries, penetration is far lower (as low as 6%). Death rates from viral pneumonia and cytokine storms are assumed to de-crease by 38% among those treated, and deaths from bacterial pneumonias are as-sumed to decrease by 67%104. Morbidity is taken to be reduced by 61%, as is underlying contagiousness. Mixing rates for those who are successfully treated (ie, sick people be-coming well) are taken to be 80% of normal mixing (as compared with 50% of normal mixing when still sick).
Although not yet used in any simulation so far produced by Swiss Re, the model can, if needed, account for a targeted antiviral prophylaxis intervention capability. Targeted prophylaxis involves identifying and tracing individuals with whom sick people have mixed; these people are then given antivirals.
Also, to date, Swiss Re has not included the use of general prophylaxis in any of the sim-ulations performed by the model. Because general prophylaxis does not specifically tar-get infected people, the vast majority of people receiving the antivirals derive little direct benefit from this intervention.
VaccinesWhile the effect of vaccines is accounted for in the model, they are largely ineffective in reducing mortality in a pandemic’s first year due to current production technology and capacity. The process of developing a vaccine is triggered by a certain number of deaths worldwide. The model currently assumes a development time of 200 days, after which supplies reach countries at rates specified in the model. The rates of supply are currently weighted to assume that 80% of vaccine production is first supplied to the countries in which the vaccine is produced, with the other 20% being distributed in proportion to the size of economies (ie, more populous, wealthier countries receive more). Vaccines are assumed in the model to be 90% effective in protecting against infection.
Pre-pandemic vaccines are not a part of the current event set105 simulations, but the model has been set up in order to allow for this intervention, and the effect of pre-pan-demic vaccines has been tested (results are included in section 5.4.2, which covers the sensitivity of the model). In this intervention it is assumed that a number of people are given a vaccine that is not specific to the virus that emerges, and that a proportion of re-cipients gain protection against infection (the model currently assumes 50%). The model can apply this intervention in one of two ways: a “self-interest” approach applies the vac-cines to vaccine-producing countries first, whereas a “global interest” model applies the available vaccine to countries where the highest numbers of new infections are occurring.
Healthcare resourcesEach of the pharmaceutical interventions is expected to use healthcare resources within each country’s healthcare system. A limit, based on the numbers of physicians and nurses working in each country106, is placed on resources that can be used. Each healthcare activity relating to an infected person – such as antibiotic treatment, antiviral treatment or targeted antiviral prophylaxis – is assumed to use resources. When these run out, ra-tioning is applied proportionately to all interventions.
104 Derived from data in Tamiflu factsheet, Hoffmann-La Roche Limited, 2005.105 See section 5.2.2 for further discussion of event sets.106 Core Health Indicators, World Health Organisation, 2006.

60 Swiss Re: Pandemic influenza
5.2.2 Event setsBy using individual, one-off simulations, it is possible to examine the patterns of infection, intervention and mortality for a specific set of lethality and spread (R0) values. Because the precise nature of any future pandemic is unknown, understanding the risk is best achieved by creating a representative set of plausible events.
Modelling based on ‘event sets’ consists of a number of randomly generated ‘events’ or simulations of the level of excess mortality (in the interest of producing statistically signif-icant results, the number of events can run to many thousands). Each of the events com-prised within the set is defined by variables which are generated using distributions that reflect historical evidence. These variables are of the types discussed throughout the sec-tion above and include, for example, the ability of a virus to spread, the likelihood that an infected person will die, and the probability that antivirals will to some degree be effective in reducing the impact of a new virus. No explicit relationship is, however, assumed be-tween any of these variables.
Each simulation carried out will produce an estimate of mortality in the global population over the first year following the introduction of a new pandemic influenza virus107. The set of these outcomes, which the model produces by age group and country, is used to understand the likelihood that events of various severities will occur. Using output data, differentiated by age and country, it is possible to derive the expected excess mortality108, either for national or global populations, or for populations reflecting risk exposures in the life assurance industry.
The event sets are based on R0 and lethality distributions derived using data from the last four pandemics (as shown earlier in Table 5.2). The R0 value for each has been sourced from a review of various items of literature109 and by performing a calibration of the Swiss Re model to ensure internal consistency. Given the changes in population age structure, each R0 value has been revised to reflect 2006 spread conditions – ie, fewer young people (who mix more) and more elderly people (who mix less); for example, the R0 value of 2.1 for the 1918 influenza becomes 2.005 for a similar pandemic simulated for 2006. A generalised Pareto distribution was found to be most suitable for modelling the R0 values. The values assumed for the three 20th century influenza pandemics are shown in Table 5.3110.
Pandemic start year R0 value1918 2.101957 1.601968 1.89
107 It is important to stress that the model considers the first year, not the first wave. Subsequent waves can oc-cur within the first year.
108 Excess mortality is defined as mortality over and above day-to-day expected levels.109 Chowell G, Ammon CE et al. Transmission dynamics of the great influenza pandemic of 1918 in Geneva,
Switzerland: Assessing the effects of hypothetical interventions. Journal of Theoretical Biology, 2005; Mills CE, Robbins JM et al. Transmissibility of 1918 pandemic influenza (letter). Nature, 2004; 432(16) 904–906; Bansal S, Pourbohloul B et al. A comparative analysis of influenza vaccination programs, 2006; World Health Organisation (WHO) Writing Group. Non-pharmaceutical interventions for pandemic influenza, international measures, 2006 (see footnote 98); Ferguson N, Cummings DAT et al, 2005 (see footnote 91); Ferguson N, Cummings DAT et al. Strategies for mitigating an influenza pandemic. Nature, 2006; 442(7101): 448–452. Longini IM, Halloran ER et al. Containing pandemic influenza with antiviral agents. American Journal of Epidemiology, 2004; 15(7): 623–633.
110 Data from 1892 pandemic was useful in understanding lethality patterns, but less so when estimating R0. This explains why three pandemics were used to model R0, and four to model lethality.
Table 5.3Baseline R0 value assumed for previous recorded pandemics
Table 5.3Baseline R0 value assumed for previous recorded pandemics
5 Swiss Re’s pandemic influenza model

61 Swiss Re: Pandemic influenza
The sourcing of lethality rates using literature review111 and calibration is similar to that used for the R0 values. The 1918 pandemic was the most severe of any of the last 13 pandemics; the model therefore assumes that 1 in 13 pandemics will be as severe as 1918. In fitting a distribution to past pandemic lethalities, Swiss Re considered and tested various statistical distributions including Weibull, Gamma, generalised Pareto, normal and lognormal.
Among the considerations in choosing which of these five distributions is used in the model was whether to take account of the current outbreaks of H5N1 highly pathogenic avian influenza and associated severe and fatal human infections. In the end, Swiss Re chose the lognormal distribution for lethality; the reasons why are set out in the box below. No ‘H5N1 allowance’ was made to the distribution for R0 values because, as discussed in Chapter 1112, it is not clear that the prevalence of avian influenza in birds is any higher now than it has been in the past.
Allowance for H5N1 in the modelling
Chapter 1 discussed how the pandemic threat from H5N1 needs to be seen against the wider background of avian influenza in general.
For the 125 years for which information is available, there is no evidence that a human pandemic, nor even an epidemic, has been caused by any previous highly pathogenic vi-rus reported in poultry. However, it could be argued that the continuing spread of H5N1 among poultry, and the associated increasing number of severe and fatal human infec-tions, have increased the risk that the next pandemic virus will have high pathogenicity. It is certainly the case that the concern over H5N1 is warranted, if for no other reason than its current high death-per-case rate113.
Given the uncertainties over the direction of the evolution of H5N1 viruses, and an in-complete understanding of the biological barriers to the development of a humanly trans-missible virus, it is unclear how best to allow for the current H5N1 outbreaks in the mod-elling.
Swiss Re’s model allows for the potentially greater risk of a high lethality virus by fitting historical data to a distribution which allows for an especially large proportion of viruses to be highly lethal. The appropriate distribution in this case is the lognormal distribution.
Swiss Re also tested alternative explicit ‘H5N1 allowances’. These included, for example, varying the 1-in-13 weighting of the 1918 pandemic (from 1 in 20 to 1 in 3). Table 5.4 shows the excess mortality levels derived for certain return periods by fitting two distri-bution types and using a range of weightings for the lethality of the 1918 pandemic.
111 Patterson KD, 1986 (see footnote 42); Simonsen L, Clarke MJ et al, 1998 (see footnote 39); Glezen WP, 1996 (see footnote 51); Potter CW. A history of influenza. Journal of Applied Microbiology, 2001; 91: 572–579; Taubenberger JK and Morens DM, 2006 (see footnote 47); Chowell G, Ammon CE et al. Transmission dy-namics of the great influenza pandemic of 1918 in Geneva, Switzerland: Assessing the effects of hypotheti-cal interventions. Journal of Theoretical Biology, 2005; De Jong JC, Rimmelzwaan GF et al. Review article: Influenza virus: A master of metamorphosis. Journal of Infection, 2000; 40: 218–228; Longini IM, Halloran ME et al. Containing pandemic influenza with antiviral agents. American Journal of Epidemiology, 2004; 159(7): 623–633; Lee VJ, Phua HK et al. Economics of neuraminidase inhibitor stockpiling for pandemic influenza, Singapore. Emerging Infectious Diseases, 2006; 12(1): 95–102.
112 See Chapter 1, section 1.1113 Taubenberger JK, Morens DM et al. The next influenza pandemic: Can it be predicted? Journal of the
American Medical Association, 2007; 297(18).

62 Swiss Re: Pandemic influenza
Distribution type 1918 weighting Mortality by return period 1-in-100 1-in-200 1-in-500Lognormal 1/20 0.6‰ 1.0‰ 1.8‰ (base) 1/13 0.6‰ 1.1‰ 2.2‰ 1/6 0.8‰ 1.6‰ 3.2‰Weibull 1/13 0.7‰ 1.0‰ 1.5‰ 1/6 0.9‰ 1.4‰ 2.2‰ 1/3 1.3‰ 2.2‰ 3.3‰
Other possible approaches to explicitly allow for an additional risk could include adding a specified high lethality risk to the historical lethality data, or giving a certain weighting, say 5%, to a lethality of 5% (ie, 1/10 of the current H5N1 death-per-case).
The use of the lognormal distribution, which has the ‘fattest’ tail of all the potential distri-bution types considered, goes some way to allowing for an enhanced risk of a high le-thality pandemic. Alternative approaches, such as using a Weibull distribution with a specific extra allowance, produce results within a reasonable range of the chosen base.
5.2.3 Calibrating the model to real data: the 1918 pandemicIn calibrating, adjusting and designing its pandemic influenza model, Swiss Re has found it useful to compare model outcomes against real data.
In the current discussion and debate about the risks posed by pandemic influenza, one of the key historical events examined is the 1918 pandemic. Because of the scale of mor-tality experienced, this pandemic was reasonably well documented at the time, and has subsequently been extensively researched. Swiss Re’s calibration process, and its review of medical and other literature, has led to various assumptions being accepted for the 1918 pandemic. Examples of some of these assumptions, and the corresponding model outcomes used in calibrating the model, are shown in Table 5.5.
Estimates of actual experience Model generated/usedR0 Estimated 1.5 to 4, most 2.1 between 1.7 and 2.5Lethality Estimated between 0.99% and Between 1.01% and 2.65% 5.56% depending on country* depending on countryNumber of deaths (1918–1919 season only)United States 529 000 531 000United Kingdom 179 000 186 000Canada 39 000 40 000Switzerland 19 000 19 000Germany 313 000 325 000India 5 486 000 5 511 000Africa 1 567 000 1 568 000
The estimates of between 0.99% and 5.56% (see * in table) are derived from a variety of medical and other literature sources: Chowell G, Ammon CE et al, 2005; Mills CE, Robbins JM et al, 2004; Bansal S, Pourbohloul B et al, 2006; World Health Organisation (WHO) Writing Group, 2006. Fer-guson N, Cummings DAT et al, 2005 Ferguson N, Cummings DAT et al, 2006. See footnote 109 for full references to these sources
The calibration of the model to the 1918 pandemic includes only one intervention: contact modification. Records show that contact modification was practiced in certain countries to reduce infection risk, even though the spread of viruses was not understood at that time.
Table 5.4Excess mortality (insured-age population) using a range of lethality, distribution types and 1918 lethality weightings
Table 5.5Model outcomes compared with estimates of actual mortality during the first year of the 1918 pandemic (rounded to nearest 1 000)
5 Swiss Re’s pandemic influenza model

63 Swiss Re: Pandemic influenza
5.3 Limitations
Swiss Re’s pandemic influenza model is a deterministic model. This makes it unsuitable for modelling the highly uncertain stochastic processes which occur at the start of a pandemic, and when it first enters a new country. Swiss Re’s model cannot be used to determine if a pandemic can be contained – all simulations are based on the assumption that containment is unsuccessful114.
Neither does the model account for any geographical dispersion within each of the 37 territories. In reality, the spread of the influenza virus in a geographically dispersed popu-lation, from city to city and into smaller towns and countryside, will occur at a slower pace and in a less regular fashion than is modelled by treating a national population as a single entity. The peak daily number of deaths will likely be smaller, and the final attack rate may be slightly lower than that produced by the Swiss Re model. This limitation is not, however, expected to result in materially different mortality outcomes.
The fact that pandemics are relatively rare events means that the model’s calibration is based on only the four most recent pandemics. It also means that a great deal may have changed between pandemics, especially regarding technology and demography, mak-ing them difficult to compare and understand in a modern context. An attempt has been made to try to isolate these effects in calibrating and parameterising but, without doubt, there will be differences that have not been identified. The risk this implies in understand-ing the range of future pandemics is covered in section 5.4.2, which covers the sensitivi-ty of the model.
In modelling a new pandemic virus in the way that Swiss Re has done, it is important to note that a large number of uncertain variables are required. These uncertainties have mostly been dealt with by extensive sensitivity testing. This involves changes to the model to examine the impact of plausible deviations from the best estimate values assumed. The outcomes of these sensitivity tests are presented as part of the results in the section that follows.
5.4 Results
5.4.1 Event set outcomesEach simulation that forms part of a given event set generates a particular level of excess mortality. If these are sorted from lowest to highest, it is possible to examine the likelihood that the mortality in any given one-year period will exceed various levels. On the assump-tion that pandemics occur on average every 30 years, the lowest level of pandemic excess mortality has a likelihood of 1 in 30, ie 3.33%. Figure 5.5 shows the annual probability than an influenza pandemic, in a number of key developed countries, will cause excess mortality greater than the number shown on the X-axis. The figures shown are age-weighted to represent an insurance portfolio. With the exception of Canada, a 1-in-200-year event (0.5% annual probability) is estimated to give rise to excess mortality of between 1 and 1.5 per thousand (‰), given current intervention capabilities. The figure for a 1-in-100-year event (1% annual probability) is between 0.4‰ and 0.7‰, and for a 1-in-500-year event (0.2%) is between 1.6‰ and 3.1‰.
114 For further information on containment see Ferguson N, Cummings DAT et al, 2005 and Ferguson N, Cummings DAT et al, 2006 (see footnotes 91 and 109 for full references).

64 Swiss Re: Pandemic influenza
Switzerland US UK Canada
0.5 1.0 1.5 2.00
Annual probability
Deaths/1 000 (age weighted to represent insurance portfolio)
3.0%
2.5%
2.0%
1.5%
1.0%
0.5%
0.0%
Among the countries which appear to be least impacted is Canada, with estimated 1-in-200-year excess mortality at around 0.7‰ in an insurance-age population. Australia and New Zealand are in a similar position (but, in the interests of making the graph legible are not shown). These countries all have high life expectancies and relatively few elderly people compared with other developed countries, resulting in lower underlying lethality levels in most pandemics. In addition they have robust healthcare systems, high current stocks of antivirals and the capacity to implement successful non-pharmaceutical inter-ventions. The United States, where antiviral stocks are currently insufficient, is roughly in the middle of the group of developed nations (estimated excess mortality of 1.0‰). At the other end of the scale, Italy, Spain, Germany and Japan (not shown, again for legibili-ty) appear to have the highest expected levels of mortality, especially in low lethality pandemics. This is largely as a result of their older populations and, to a lesser extent, their relatively smaller stocks of antivirals, but not necessarily a consequence of weaker healthcare systems.
Figure 5.6 shows insured-age excess mortality levels for a group of developing countries, or aggregations of developing countries (as with Figure 5.5, to ensure legibility not all ex-amples are shown). Countries expected to experience higher levels of mortality include India, Pakistan and Indonesia, due to high population density, along with a weak capacity to reduce contact rates – leading to rapid spread of influenza viruses. The healthcare sys-tems of these countries are also weaker than in developed countries, and the availability of antivirals is almost zero. The developing countries (or aggregations of countries) with the lowest expected levels of excess mortality are the Caribbean and Central America, and South America. These aggregations are a mix of middle-income countries and low-income countries, some of which have higher life expectancy, better healthcare systems and a better capacity to enact contact modification.
Figure 5.5Insured-age excess mortality due to pandemic influenza, selected developed countries
5 Swiss Re’s pandemic influenza model

65 Swiss Re: Pandemic influenza
3.0%
1.0 3.0 4.0 6.0Deaths/1 000 (age weighted to represent insurance portfolio)
Annual probability
2.5%
2.0%
1.5%
1.0%
0.5%
0%
2.00 5.0
China
India South America
South Africa
Different age groups are expected to experience very different rates of excess mortality, depending on the lethality of the virus. As can be seen in Figure 5.7, which uses the Unit-ed States as an example, the excess mortality in the various age groups shows very dif-ferent patterns when sorted from the least to the most severe pandemic. The oldest and youngest age groups experience higher mortality, due to secondary causes, in the milder pandemics. This reflects the typical U-shaped age-specific lethality profiles assumed for low lethality pandemics. Most pandemics which have higher overall levels of lethality are assumed to impact disproportionately on young adults.
1.0
3.0%
Annual probability
2.5%
2.0%
1.5%
1.0%
0.5%
0.0%
2.0 3.0 4.0 5.0 7.0Population mortality (deaths/1 000)
0 6.0
0–4
5–9
15–19
25–29
35–39
45–49
55–59
65–69
75–79
When examining the pandemics with a less than 1-in-400-year likelihood (ie, less than 0.25%), the line representing 25–29 year olds is to the right of all other lines; this indicates that young adults experience the highest mortality in the severest pandemics.
Figure 5.6Insured-age excess mortality due to pandemic influenza, selected developing countries
Figure 5.7US age-specific excess mortality due to pandemic influenza, selected age groups

66 Swiss Re: Pandemic influenza
5.4.2 Sensitivity of results to variations made to the model Given the uncertainty surrounding future pandemics, it is necessary to investigate the effects of these uncertainties. As a reinsurer, Swiss Re is most interested in the expected shortfall – the average annual loss likely to occur with a frequency of less than once every hundred years115. Figure 5.8 shows how the expected shortfall for the population relevant to Swiss Re (ie, weighted by exposure to countries and age groups) changes when certain parameters in the model are adjusted (ie, the model’s sensitivity).
Each of the sensitivity tests shown in Figure 5.8 is defined as listed in Table 5.6.
115 The expected shortfall measure is also known as “99% Tail VaR” (see box within section 6.2 of Chapter 6).
Table 5.6Model sensitivity tests
Sensitivity test Comment Sensitivity to the parameterR0 and lethality fit of historical data: parameter error
Refers to the fact that the sample of pandemics is small. As a result, the distributions representing spread (R0) and lethality are very uncertain. The ‘low’ result reflects simultaneous use of lower 60% confidence interval values for both R0 and lethality, while the ‘high’ result reflects the same using upper 60% confidence interval values
Due to the very small sample, sensitivity is high
Pre-pandemic partially effective vaccine Refers to the effect that a partially effective pre-pandemic vaccine may have on excess mortality. The normal assumption in the model is that no pre-pandemic vaccine is used. Use of pre-pandemic vaccines assumes 1 billion doses at the start of the pandemic, and effective protection for 50% of those receiving vaccines
The model is moderately to highly sensitive to this
Contact modification Refers to the extent to which mixing is assumed to be curtailed in a pandemic. The baseline assumes a maxi-mum reduction in mixing of 65% – this rate lasting only a day before it begins to slowly fade. The lower value tested here is a maximum reduction of 40%, and the higher value a reduction in mixing of 80%
The model is moderately sensitive to this
Proportion of deaths due to ‘bacterial pneumonia’ or ‘viral pneumonia and cytokine storm’ causes
Refers to the estimated proportion of deaths assumed to be due to each cause. The sensitivity test changes the formula used in generating these proportions
The model is moderately sensitive to this
Lower underlying mortality – health improvements in the United States
Refers to the fact that US life expectancy has increased, which likely indicates better underlying health status. This would be expected to reduce lethality. The reduc-tion in lethality is 29% when this factor is considered
The model is moderately sensitive to this
Probability of pandemic occurring Refers to the annual likelihood of an influenza pandemic in any one year. This is assumed to be 1 in 30 – the sen-sitivity tests examine the effect of assuming 1 in 40 and 1 in 24
The model is moderately sensitive to this
Population density effects Refers to the idea that higher density and urbanisation may enhance spread in modern times, while better housing and living conditions in many countries may re-duce influenza spread. Contact rates are increased by 10% and decreased by 10% to test this variable
The model is moderately sensitive to this
5 Swiss Re’s pandemic influenza model

67 Swiss Re: Pandemic influenza
Sensitivity test Comment Sensitivity to the parameterAntibiotic effectiveness Refers to uncertainty regarding the effect antibiotics will
have in reducing bacterial pneumonia mortality. The best-estimate model assumes that antibiotics reduce bacterial pneumonia deaths by an average of 70%. The sensitivity tests examine the effect of changing this to 60% or 80%
The model is moderately sensitive to this
Post-pandemic mortality trends Refers to mortality in years subsequent to the year of outbreak. Lower mortality can be expected if individuals who may have had underlying illnesses experience ac-celerated mortality in the pandemic year (ie, they would have died anyway in the years that followed). Higher mortality may be expected due to the virus causing higher pneumonia deaths in subsequent years. Post-pandemic mortality is an aggregation of these two ef-fects. In the ‘low’ scenario pandemic, mortality across multiple years is assumed to be 90% of the mortality in the first year, while the ‘high’ scenario assumes this to be 110%
Historical evidence indicates this effect is likely to be small to moderate
Statistical error using 50 000 pandemics (bootstrap, standard error)
Refers to underlying variability that may occur in an event set of this size
Not truly a sensitivity, but the under-lying variability is shown to be small at the number of events used
Age profile of deaths due to ‘bacterial pneumo-nia’ or ‘viral pneumonia and cytokine storm’ causes
Refers to the fact that most bacterial pneumonia deaths are assumed to be among the elderly and the very young, while most viral pneumonia deaths are assumed to be among young adults. The sensitivity tests what would be happen if this assumption was incorrect (ie, if the two causes were spread in equal proportion across the ages)
The model is moderately sensitive to this
Probability of antiviral treatment being effective Refers to the likelihood that antiviral treatments are ef-fective at reducing mortality and spread, set at 75% for the best-estimate event set. The sensitivity demonstrates what would happen were this changed to 60% or 90%
The model is moderately sensitive to this
Travel rates Refers to the amount of travel occurring during the peri-od when the pandemic is occurring. The travel rates on which the ‘low’ scenario is based are 1% of normal trav-el rates, while the ‘high’ scenario tests what would hap-pen if travel rates were double the rate used
The model’s sensitivity to this is low
R0 and lethality fit of historical data: distributional shape
Refers to the mathematical distribution used in fitting historical data and deriving random event sets. Shown here is the widest range produced by testing various dis-tribution types
The model’s sensitivity to this is very low
Location where pandemic starts Refers to the country in which the pandemic is assumed to start. Two scenarios were run: one with the pandemic starting in Russia (ie, close to Europe), the other with the pandemic starting in South America (ie, proximity to the United States)
The model’s sensitivity to this is low

68 Swiss Re: Pandemic influenza
The expected shortfall using best-estimate values is represented by the large squares. Bars to the right or left represent upper or lower levels of shortfall which may occur, given a range of plausible values.
Modern pandemic with characteristics of the 1918 influenzaA simulation intended to represent a modern pandemic caused by a virus identical to that of 1918 takes modern interventions into account. These include enhanced contact modification (due to better understanding of the virus, better information flow and great-er risk aversion in populations with less tolerance of death), antibiotics, antiviral treat-ment, and vaccines.
Various demographic factors and epidemiological aspects have also been revised com-pared with 1918. These include the size of populations, the age structures of the various countries, and total mixing rates relative to those of the United States (considering current population density and urbanisation as factors). In addition, the underlying lethality levels used for each country relative to the United States have been changed (for example, life expectancy in India is much closer to US levels today than in 1918). The spread (R0) value used for the modern simulation of a 1918 pandemic has also to be adapted to reflect the changed age structure of the population.
Figure 5.8Sensitivity of outcome, according to selected population, to plausible changes in variables
R0 and lethality fit of historical data: parameter error
Pre-pandemic partially effective vaccine
Contact modification
Proportion of deaths ‘bacterial pneumonia’/‘viral pneumonia and cytokine storm’ causes
Lower underlying mortality – health improvements in the United States
Probability of pandemic occurring
Population density effects
Antibiotic effectiveness
Post-pandemic mortality trends
Statistical error using 50 000 pandemics (bootstrap, standard error)
Age profile of deaths due to ‘bacterial pneumonia’/‘viral pneumonia and cytokine storm’ causes
Probability of antiviral treatment being effective
Travel rates
R0 and lethality fit of historical data: distributional shape
Location where pandemic starts
0 1 2 3
Weighted excess mortality (per 1 000)
5 Swiss Re’s pandemic influenza model

69 Swiss Re: Pandemic influenza
Simulations of the 1918 pandemic produce numbers of deaths, based on either 1918 or on modern circumstances. It is possible to ‘switch on’ certain changes, one at a time, to examine the effect they have on mortality. The results shown in Figure 5.9 indicate the effects of the various adjustments used to simulate the 1918 pandemic in modern times.
Deaths/1 000 (in the general population)
Base 1 2 3 4 5
1 2006 population structure (spread rate and age profile of mortality)2 … plus underlying health changes relative to US (US assumed unchanged)3 … plus antibiotics4 … plus antiviral treatment5 … plus vaccines
0.0
1.5
3.0
4.5
6.0
Germany
Switzerland
Canada
UK
US
12.0
18.0
24.0
India
China
The graph shows the cumulative effect on mortality rates of selected changes since 1918. Because, under this simulation, mortality is considerably higher in developing countries than in the developed world, the scale at the top of the graph differs from the scale at the bottom. The “base” equates to the best simulation of 1918 that could be achieved with the Swiss Re model using conditions and interventions relevant to that time. The effect of enhancements in contact modification between 1918 and today is not present in the numbers shown here.
These results indicate a substantially lower overall rate of mortality in a current population than was the case in the real 1918 pandemic. This is a consequence of two key factors: reduced proportions of people infected and lower lethality. The effect of the changes in population age structures in various countries that have taken place since 1918 is to re-duce mortality by 10–15%. Underlying health status in many developing countries has improved substantially since 1918: life expectancy in India, for example, has almost tripled. This improvement in health status is assumed, in the model, to affect country-specific lethality, and has a large effect on mortality in developing countries. Antibiotics reduce mortality most substantially in developed countries, while antivirals have an impact almost exclusively in these countries. Pandemic-specific vaccines (as opposed to pre-pandemic vaccines), considering current technology, are developed too late to make any tangible difference in the first year (but would be significant if the model were adapted to illustrate mortality in waves occurring after the first year). The relative decrease in expected mor-tality, between 65% and 70% depending on country, is similar for developed and devel-oping countries, but is due to very different factors, depending on the country concerned.
Figure 5.9Relative change in total deaths per country, 1918 compared with 2006

70 Swiss Re: Pandemic influenza
5.5 Conclusions
Swiss Re has developed a sophisticated model to simulate the effect of a pandemic on the global population, which takes into account the knowledge available today. This model suggests that an event with a likelihood of 1 in 200 years will cause excess mor-tality of between 1 and about 1.5 per thousand in insurance-age populations in devel-oped countries, while in developing countries an event with this likelihood is expected to result in excess mortality between 1.5 and 4 per thousand in an insurance-age popula-tion.
Preparations by governments continue and technology is currently advancing. If these trends remain in place, the risk will gradually decline yet further over time. Developments that are most likely to reduce risk in the next few years are increased stocks of antivirals, more rapid development of new vaccines, faster production of vaccines after develop-ment and improved influenza diagnostics. Risk reduction can, however, only be sus-tained if vigilance by public and private institutions and multilateral agencies is main-tained.
The reduction in the excess mortality risk due to influenza is a consequence of a number of factors including demographic changes, technological advances and socio-cultural developments. In addition, the awareness of pandemic influenza risk has allowed gov-ernments to prepare for any outbreak of a new influenza strain. In today’s world, an event with as severe a mortality outcome as that of the 1918 pandemic could only occur if a vi-rus with substantially higher lethality and a better ability to spread were to emerge. Using the United States as a benchmark, the annual likelihood of an event resulting in a general population mortality rate equivalent to 1918 is about 1 in 3 000 – a very rare event.
Authorship of the modelAt Swiss Re, the primary author of the epidemiological model discussed in this chapter is Stephen Kramer, working closely under the project leadership of Peter Middelkamp. A range of further colleagues at Swiss Re also provided input.
Swiss Re would like to thank Professor Neil Ferguson of Imperial College London for his external review of the model. Professor Ferguson’s independent commentary about his work for Swiss Re is shown opposite.
5 Swiss Re’s pandemic influenza model

71 Swiss Re: Pandemic influenza
Independent expert’s review of the modelBy Professor Neil FergusonDirector of the MRC Centre for Outbreak Analysis and Modelling, Imperial College London
Swiss Re consulted with me at multiple points during the development of its pandemics model. Initially, the focus of my advice was on the parameters used in constructing the epidemiological model, the principles underlying various aspects of the modelling, and alternative ways of approaching a number of technical challenges.
Having created a complete model, Swiss Re provided me with documentation on its overall design and parameterisation, on the basis of which I carried out a detailed review. During this review I assessed the model’s assumptions, calibration, internal consistency and mathematical correctness. The review focused on how population mixing was incor-porated in the model, the methods used to obtain a series of variables specific to pan-demics of differing severities, as well as the mechanisms used to model various forms of intervention.
Following the review and consequent changes made to the model, I concluded that the modelling undertaken was generally solid, in so far as the limited data allows. I cautioned, however, that any modelling of pandemic risk contained large inherent uncertainties and that the results would be dependent on a wide range of assumptions.
Acknowledging this, Swiss Re conducted extensive sensitivity testing on a number of the variables and certain assumptions, the purpose of which was to determine possible ranges of outcomes across an array of plausible deviations. These have been presented in this chapter. In order to provide transparency and credibility, I also highlighted the need for the assumptions and limitations of the model to be presented. In line with this view, this chapter has also provided key details in these areas.
Swiss Re’s model primarily estimates the risk from a future human influenza pandemic by extrapolating from past human influenza pandemics. In my observations to Swiss Re, I highlighted the difficulty of estimating how the global spread of the highly pathogenic H5N1 avian influenza might affect such pandemic risk estimates. As detailed in this chapter, Swiss Re has considered a number of ways of adjusting for an H5N1 risk-en-hancing factor, most notably by increasing the probability that a new pandemic might be very severe in terms of the mortality generated. The challenges of accounting for H5N1 in any quantitative risk analysis are also discussed in this chapter. Given the fundamental lack of data enabling any rigorous estimate of the risk of H5N1 causing a highly lethal human pandemic virus to be made, the exploratory analysis by Swiss Re on this issue is at least informative as to how the overall pandemic risk distribution is sensitive to rare se-vere pandemics.
Having undergone both extensive internal review within Swiss Re, and having been criti-cally reviewed by me, I believe that the modelling has been sufficiently challenged, ex-amined and revised to have identified any substantial structural flaws which might sub-stantially affect the results. While recognising the inherent substantial uncertainties aris-ing from pandemics being rare and imperfectly recorded events, I think that Swiss Re’s work – as documented in this chapter – is sufficiently robust to represent a significant contribution to our understanding of the risk posed by influenza pandemics.
Professor Neil FergusonJune 2007

In determining how much capital to hold to withstand a pandemic mortality shock, different stakeholders have different perspectives. Shareholders in insurance stocks, for example, want the insurance company to hold only the necessary amount of capital for it to achieve its economic objectives, and thereby obtain the best return on investment.

73 Swiss Re: Pandemic influenza
Despite the enormous medical advances made in the last century, and the growing lev-els of preparedness by governments and international bodies, life insurers still face the risk that an influenza pandemic could cause a one-time mortality shock. However, be-cause influenza pandemics are rare events, occurring with irregular frequency, there is a shortage of recent events from which to estimate future loss values, and therefore the ap-propriate amount of capital to hold.
The more transparency that can be achieved in this area, the better for all parties con-cerned. However, in determining how much capital to hold to withstand a mortality shock, different stakeholders have different perspectives:
The end consumers of life insurance policies, and their dependents, want the reassur-ance that their insurance company will hold enough capital to be able to pay a claim. Policyholders also want their premiums to be affordable.Insurers’ shareholders, however, have a different perspective: they want the insurance company to hold only the necessary amount of capital for it to achieve its economic objectives, and thereby obtain the best return on investment.Other parties (such as lenders to insurance companies, product distributors and other suppliers of goods and services) also have an interest in either or both the financial strength of the insurer, and the price at which the insurer is able to sell its insurance policies.
Regulators, rating agencies and management all have a part to play in balancing these competing interests.
6.1 Severity
In determining the severity of a pandemic for which capital must be held, again different stakeholders have different perspectives.
GovernmentsOne stakeholder outside the explicit scope of this chapter – but important to consider in this context – is governments. Governments are duty-bound to prevent or minimise hu-man morbidity and mortality caused by an influenza pandemic, along with ensuring that the social disruption and the economic consequences are managed and mitigated. The World Health Organisation provides a checklist for governments to use in drawing up their national preparedness plans116.
The prevailing view that governments need to plan for a ‘worst case’ scenario is illustrat-ed in the following example from the US Department of Health and Human Services (HHS). Its November 2005 pandemic influenza plan says:
“Uncertainty about the magnitude of the next pandemic requires plans to be made to cater for a severe pandemic such as 1918.”
This view has been echoed by others, for example:
“… the government must prepare for the worst – it would be unconscionable not to … And that makes for confusion as the public hears a drumbeat of dire warnings …”117.
In considering the impact of mortality shocks, it is important to remember that expecta-tions and planning needs on the part of public authorities are not the same as they are for the private life insurance industry.
116 WHO checklist for influenza pandemic preparedness planning. World Health Organisation, 2005.117 Dr Anthony Fauci, Director, National Institute of Allergy and Infectious Diseases, Associated Press,
11 April 2006.
6 Mortality shocks and capital requirements

74 Swiss Re: Pandemic influenza
Regulators Regulators want to ensure that insurers under their supervision remain solvent, and that the financial system retains the confidence of the public. In considering the financial im-pact on insurers of mortality shocks, such as influenza pandemics, regulators must take a different perspective from that of governments. In setting solvency capital standards, they must balance the risk of an insurer’s insolvency against the economic cost of capital required to protect against that risk. According to the UK Financial Services Authority:
“Given the risks inherent in the financial markets, a zero-failure regime is neither achievable in practice nor desirable in theory.”118
Rating agencies Rating agencies assess the likelihood of an insurer being able to make timely payments on its financial obligations. Their ratings are relied upon by insurance-buying consumers and their advisers along with lenders and investors.
Based upon their analysis of an insurer’s capital adequacy, they issue ratings which rep-resent their assessment that an insurer’s capital will be sufficient to meet future losses.
Management An insurance company’s management acts on behalf of the firm’s owners – in most cases its shareholders – and consequently has an interest in maintaining an economically efficient level of capital. In the absence of regulatory and other external constraints, the amount of capital that insurers would devote to supporting their financial activities would follow from considering the trade-off between risk and return.
Companies can achieve an efficient level of capital by writing a well-diversified business mix. If an insurer provides protection against a large range of unrelated catastrophes, the amount of capital required is far lower than the simple sum of the capital required for each individual event. For example, only once in 40 000 years would a 1-in-200-year influenza pandemic coincide with, say, a 1-in-200-year Californian earthquake.
From a pragmatic point of view insurers will, of course, need to hold a capital margin over and above that required by regulators and rating agencies – to avoid temporarily breaching these levels in the course of normal business activities. However, based upon the trade-off between risk and reward mentioned above, insurers will need to hold a lower amount of capital than that required to withstand the worst possible, and least likely, mortality shock.
6.2 Regulatory capital
“From a regulatory perspective, the purpose of capital is to ensure that, despite adverse conditions, policy claims and obligations will be met as they fall due …”119.
Typically to date, regulatory capital requirements have involved the application of fixed, “risk-based” factors to various items of a company’s reported balance sheet and/or other financial statements. The fixed factors are generally determined based on a “ruin theory” approach120, but are set to reflect a conservative view of an industry-wide exposure to risk and do not necessarily reflect a company’s true (economic) capital requirements. Some systems use a combination of fixed factors and an internal model approach, and account at least partially for the expected diversification effects. Regulators have also used stress and scenario tests to supplement the factor-based approach.
118 Principles-based regulation: Focusing on the outcomes that matter. Financial Services Authority, April 2007.119 The IAIS common structure for the assessment of insurer solvency. International Association of Insurance
Supervisors, February 2007.120 Ruin theory is a concept describing an insurer’s vulnerability to insolvency.
6 Mortality shocks and capital requirements

75 Swiss Re: Pandemic influenza
In conjunction with the greater interest being shown in “principles-based regulation” (see box), there is now an increased focus by regulators on the use of company-specific inter-nal models to assess companies’ unique risks and capital requirements. This is necessary due to the increasing amount of sophistication in financial products and capital manage-ment121.
Principles-based regulation Principles-based regulation means, where possible, moving away from an approach where regulators use detailed prescriptive rules and supervisory actions to dictate how firms should operate their business, and towards giving firms the responsibility to decide how best to align their business objectives and processes with the outcomes specified by the regulator.
It is believed that, by supplementing a risk-based and evidence-based approach with principles-based regulation, there will be significant benefits – both in terms of more efficient markets and from firms being better attuned to consumers’ needs.
A principles-based approach enables the economic and business interests of firms’ sen-ior management, and their boards and shareholders, to be aligned more effectively with regulatory goals. Regulation ceases to be seen as a costly, unwelcome distraction and becomes an integrated part of business decision making.
However, even under a principles-based approach, detailed rules will continue to remain part of the regulatory toolkit. There will be a range of scenarios in which detailed rules will be the most appropriate way for regulators to secure the regulatory outcome re-quired. For example, rules may be suitable where the effects of a firm’s behaviour are not readily observable, or are observable only over a very long period122.
Regulators in various markets take different approaches to framing capital requirements – including appropriate allowance for mortality shocks. The following sections describe three key examples. In addition to meeting specific, or implicit, mortality shock assump-tions in capital rules, an insurer is also sometimes asked to demonstrate to its regulator its ability to withstand certain adverse events, or to determine how adverse an event its capital would be sufficient to withstand.
EU Solvency IISolvency II is the proposed new European directive for insurers, covering their capital requirements and related supervision. Solvency II will introduce a modern, risk-based approach using market-consistent methods for the valuation of insurers’ assets and liabil-ities. Solvency II will also see a much greater role for a firm’s own risk and capital assess-ments, including its internal capital model (see box on the following page), in providing a significant input to the supervisor’s assessment of the firm.
Under Solvency II, the Solvency Capital Requirement (SCR) is the normal, target level of capital that an insurer will be expected to hold. It will be calibrated to enable the insurer to withstand a single 1-in-200-year negative event and still meet all its liabilities to policy-holders.
121 Report of Solvency Working Party. Prepared for the International Actuarial Association (IAA) Insurance Regulation Committee, February 2002.
122 UK Financial Services Authority, 2007 (see footnote 118).

76 Swiss Re: Pandemic influenza
As part of the consultation process in the development of Solvency II, the Committee of European Insurance and Occupations Pension Scheme Supervisors (CEIOPS) has issued its third Quantitative Impact Study (QIS3) in relation to the proposed directive. QIS3 pro-poses that:
“… we assume a capital component equal to 1.5 per mille of capital at risk for mortality catastrophe risk.”
The results of this consultation exercise will provide a significant input into the final cali-bration of the Solvency II requirements.
Internal capital modelsMany insurers have a model – typically a sophisticated computer-based system – which uses a framework of financial and economic assumptions to forecast the future pattern of cash flows. These models normally provide a projection of the changes to the value of assets and liabilities at different future dates using a series of assumptions set by the firm. Typically, the model allows a range of different scenarios (including disaster scenarios) to be applied in order to assess the effect of these scenarios on the value of assets and lia-bilities. One of the aims of an internal capital model is to determine the appropriate level of capital the firm needs to hold to run its business. The development and use of an inter-nal capital model is usually aligned with the more general risk modelling work undertaken by a firm to document, describe and understand the risks in its business, the factors that affect these risks and the tools the firm can use to mitigate them123.
Swiss Solvency TestThe Swiss Federal Office of Private Insurance (FOPI) started development of the Swiss Solvency Test (SST) in 2003. Under the SST, insurers must hold sufficient capital at the beginning of the year in order to be able to cover the liabilities at the end of the year with 99% probability.
In addition to finding a stochastic distribution for the underwriting result124, the SST also incorporates the concept of evaluating additional extreme scenarios, including a pan-demic scenario. These extreme scenario losses are aggregated with the distribution for the underwriting result, giving a distribution function to which the 99% Tail VaR (see box on the following page) can be applied.
FOPI gives guidance on which risk factors should be considered for the pandemic sce-nario. This guidance also encompasses quantitative benchmark figures which FOPI ex-pects companies to use – these are based on external studies and cover mortality and morbidity effects and the impact of a pandemic on financial markets. However, if a com-pany has a better model and more sophisticated assumptions, these may be acceptable to FOPI, provided they are documented appropriately and argued-for convincingly.
123 Solvency II frequently asked questions. Association of British Insurers, January 2007.124 See Chapter 5, section 5.1 for an explanation of stochastic processes.
6 Mortality shocks and capital requirements

77 Swiss Re: Pandemic influenza
UK Individual Capital AssessmentThe UK Financial Services Authority requires firms to complete an Individual Capital Assessment under which the firm must undertake an assessment of the adequacy of its capital resources against a 99.5% confidence interval, over a one-year timeframe, that assets will be at least equal to liabilities. This is equivalent to “withstanding a single 1-in-200-year negative event” as proposed in Solvency II.
Value at Risk The Value at Risk (VaR) is a widely used measure for summarising risk distribution and defining the base capital requirement. The 99% Value at Risk (VaR), for example, is the level of loss likely to be exceeded in only one out of 100 years. Similarly, the 99.5% VaR is the level of loss likely to be exceeded in only one out of 200 years.
99% Tail VaRAlso known as the “expected shortfall”, the 99% Tail VaR measures the average annual loss likely to occur with a frequency of less than once every 100 years.
Both the 99.5% VaR and the 99% Tail VaR are more conservative risk capital measures than the 99% VaR.
6.3 Rating agency capital
Credit rating agencies assess the probability that an insurer will meet its financial obliga-tions in the future.
Capital adequacy is one of a number of criteria used for the rating agencies’ assessment of insurance companies. To quantitatively assess capital adequacy, agencies use risk-based capital models to determine the amount of capital needed to cover losses at vary-ing confidence intervals. Insights drawn from these models are evaluated in conjunction with more qualitative factors – for example, the composition of the company’s capital structure, its reserve adequacy and its level of diversification – to form a comprehensive opinion on the level of capitalisation.
For example, for a large portfolio of mortality risks in a highly developed life market, it can be seen from Table 6.1 that Standard & Poor’s capital requirements (European model) for a AA target rating is between 3.31‰ and 0.83‰, applied to the net sums at risk.
Net sums at risk (excluding life policies with critical illness acceleration riders) Sums at risk (%)First USD 1 000 million 0.331Next USD 4 000 million 0.220Next USD 5 000 million 0.165Next USD 40 000 million 0.138Next USD 50 000 million 0.110Excess over USD 100 000 million 0.083
Source: Standard & Poor’s, new capital model
Separately from their ratings services, some of the larger credit rating agencies also conduct research activities. These analyse, for example, how insurers and the insurance industry might be impacted by a future pandemic125, 126.
125 Determining the insurance ramifications of a possible pandemic. Standard & Poor’s, November 2005.126 Bird flu – will it ruffle the industry’s feathers?. Fitch Ratings, March 2006.
Table 6.1Traditional life reinsurance business charges for AA target

78 Swiss Re: Pandemic influenza
6.4 Economic capital
Economic capital is often described as sufficient surplus capital to cover potential losses, at a given risk-tolerance level, over a specified time horizon.
Internal integrated risk models can be used to determine the capital required to support the risks on an insurer’s books, and to allocate risk-taking capacity to the lines of business chosen by the company – according, for example, to the profitability of a given line, or in the interests of diversification.
For example127, Swiss Re’s risk model (not to be confused with the pandemic spread model discussed in Chapter 5) is based on two important principles:
It uses an asset-liability management (ALM) approach, measuring the net impact of risk on the economic value of both assets and liabilities.It adopts an integrated perspective, recognising that a single risk factor can affect dif-ferent sub-portfolios and that different risk factors can have mutual dependencies.
The model generates a probability distribution for Swiss Re’s annual economic profit and loss, specifying the likelihood that the profit or loss will fall within any given range. From this distribution, a base capital requirement is derived. This captures the potential for se-vere, but rare, aggregate losses over a one-year time horizon. Swiss Re compares the base capital requirement with available capital to determine the adequacy of its capitali-sation.
In addition to the 99% VaR, Swiss Re also considers other measures, including the 99% Tail VaR and the 99.5% VaR.
The profit and loss distributions in these integrated risk models consider all possible caus-es of mortality shock scenarios and therefore benefit from diversification effects. While the model per se does not change the impact of an individual event such as an influenza pandemic, because the ‘buffering’ risk capital also buffers other possibly severe but un-related events at the same time, the capital cost allocated to pandemic risk, for example, decreases.
Insurers may supplement their internal capital modelling by considering the capital im-pact of certain shock events. Smaller insurance companies without the resources to build their own internal model may use stress testing128 to assess their ability to withstand se-vere, but rare, events. However, where a company is, for example, assessing the impact of various pandemic scenarios on its capitalisation, it must be remembered that pan-demics of different severity are not equally likely. For instance, a typical mild-severity pandemic is much more likely than a severe pandemic.
127 Swiss Re Annual Report 2006, March 2007.128 Stress scenario analyses complement risk models by providing information on the economic implications of
certain adverse situations.
6 Mortality shocks and capital requirements

79 Swiss Re: Pandemic influenza
6.5 Conclusions
In preparing for an influenza pandemic, governments have a social responsibility to pre-pare for the worst. This does not mean that they need to build hospital capacity sufficient to meet the surge demand of a 1-in-500 year event. It does mean, however, that they need to have plans in place to prevent and minimise human morbidity and mortality, and to manage and mitigate social disruption and the economic consequences.
Insurers also have responsibilities – to their policyholders rather than the general public – but the amount of capital they hold to withstand mortality shocks such as influenza pandemics is a commercial decision. Regulators prescribe minimum levels, and insurers hold capital in excess of this to allow them to achieve their economic objectives.
Regulators, in turn, recognise that a zero-failure regime is not commercially achievable or desirable. A typical regulatory requirement is for insurers to be able to withstand a mortality shock event in the order of a 1-in-200 year event.

80 Swiss Re: Pandemic influenza
While most of the results from Swiss Re’s model presented in Chapter 5 are representa-tive of an insurance-age population, the model does not account for the likely lower excess mortality of insured lives arising in an influenza pandemic. There is, however, reasonable evidence that people who have been underwritten for life insurance will experience lower excess mortality. Two key questions arise:
Have any differences been observed between pandemic influenza mortality experience in the general population, compared with life insurance policyholders?If such differences have been noted in the past, should any of these observations be taken into account when considering what impact a future pandemic could have in an insured population?
Registration data provided by the Influenza Branch of the US Centers for Disease Control and Prevention’s National Center for Infectious Disease indicates that the overall excess mortality from influenza-pneumonia in 1918 was 5.3 deaths per 1 000 (‰). However, in Wisconsin the death rate was 3.6‰. Some cities, for example Grand Rapids Michigan, had an even lower rate (1.9‰)129. It is therefore clear that, from a geographical stand-point, mortality experience during this significant influenza pandemic was not uniform. If such differences can exist between one population group and another, it also seems pos-sible that similar differences in pandemic influenza mortality experience could exist be-tween a group of life insurance policyholders as compared with the general population.
This appendix explores the question of insured versus general population mortality due to pandemic influenza, using historic and contemporary sources of insurance and popu-lation information. Based on research performed by Swiss Re in North America, it seems plausible that the beneficial effects associated with risk selection and socio-economic status are key factors that can result in better outcomes in the insured population in the event of an influenza pandemic, as compared with an unselected general population.
A.1 Historical observations on pandemic experience in insured groups
Some of the first observations made on the impact of influenza pandemics in insured populations were presented by Franklin Mead130. These observations suggested that influenza mortality experience was not uniform across various insured groups. Mead took two in-force portfolios: a block of business of 11 companies selling ordinary life in-surance policies, and a block of business of three companies issuing industrial policies. He compared the claims experience on these two populations over a period spanning 1886–1895, which encompasses the 1889 influenza pandemic. Mead noted that the ratio of all-cause mortality claims for industrial policies was higher than the claims ratio for ordinary policies, particularly during the pandemic years, compared with the pre-pandemic period. This disparity became less pronounced in the years following the pan-demic.
Industrial policies were small in terms of amount assured, and were typically purchased by working-class people such as labourers engaged in manufacturing, transportation and service industries. Ordinary policyholders tended to be business owners or profes-sionals. Additionally, ordinary policies generally required medical screening at the time of policy issue. Based on the differences he observed in the claims ratio between the two groups, Mead believed that the outcomes bore a direct relationship to the underlying life insurance product type. It appears that ownership of either one of these products was a measure which served as a proxy for a constellation of differences between the two in-sured groups, and that these differences, when considered all together, had an influence on observed mortality outcomes.
129 Shay D. Influenza pandemics of the 20th century, 2005 (presentation made by the Influenza Branch of the US National Center for Infectious Diseases, Centers for Disease Control and Prevention).
130 Mead F. Discussion of the paper “The influenza epidemic of 1918, Craig J and Dublin L”. Transactions, Actuarial Society of America, 1919; 20: 496–8.
Appendix A Influenza mortality in the insured population

81 Swiss Re: Pandemic influenza
In another study, Moir examined the annual experience of 10 life insurance companies between 1914 and 1922, a timeframe encompassing the 1918 influenza pandemic131. Moir did not include details about the gender and age distribution of this business. But if, over the same timeframe, insured mortality is compared against mortality observed in the general US white male population over the age of one, the insured all-cause mortality experience before, during and after the pandemic period was lower. Additionally, all-cause mortality in the insured block was also generally lower than in the general population, even when compared with the total (ie, both the male and female) US population over the age of one. In considering possible reasons why insured mortality was better in the years immediately after the pandemic, Moir reported that, between 1918 and 1920, sales of life insurance in the United States saw a substantial increase. This ‘surge’ in new business would have raised the proportion of healthy, selected lives within the overall risk pool and therefore might positively influence the observed insured-lives mortality in the post-pandemic period, as compared with the general population.
In 1948, the Metropolitan Life Insurance Company published mortality and claims statis-tics about its industrial policyholders that included the period around the 1918 influenza pandemic132. This data can be compared with equivalent statistics for the US general population from the same timeframe. In performing such a comparison, death rates will be seen as being slightly lower for influenza and pneumonia across the same time-frame133. In an earlier publication, Craig and Dublin published all-cause mortality claims statistics for the same company, based on Metropolitan Life’s experience of industrial and ordinary policyholders, comparing claims results for 1917 and 1918134. Craig et al observed a difference in the excess claims rate between these policy groups and be-lieved that the data demonstrated an economic – or class – effect. In a review of Craig’s paper, Little provided a similar analysis of data from the Prudential Life Insurance Compa-ny, but combined ordinary and intermediate policies and compared them with industrial policies135. Intermediate policies were generally sold with amounts assured in a range that was higher than the average industrial policy, but still not at the level of an ordinary policy. In the Prudential Life experience, the difference in the rate of excess claims was less marked between the two groups compared with the Metropolitan Life experience. The narrower difference between the industrial policyholder and intermediate/ordinary policyholder groups is likely to be due to the mixing of experience between intermediate and ordinary policies.
Through an analysis of data that included life insurance policies issued in the 1950s and 1960s, Swiss Re has examined historical influenza and pneumonia in insured popula-tions for the periods 1953–1956 and 1957–1958136. Compared with the 1918 pan-demic, the overall pneumonia and influenza mortality rates for the insured and general population were much lower. Figure A.1 summarises findings for insured males as com-pared with equivalent vital statistics during the same timeframe from the US white male general population137. Not only was the observed pneumonia and influenza mortality rate for both periods lower than in the general population, but also the excess death rate in the insured group (ie, the level of mortality over and above that expected in a normal year) was approximately 12.5% lower. Over the entire period – ie, 1953 to 1958 – there were only 107 deaths in the insured group, so we cannot draw any firm conclusions based on this study alone.
131 Moir H. Recent mortality. Transactions, Actuarial Society of America, 1922; 23(67,68): 408–434.132 Influenza and pneumonia – 30 years after the pandemic. In Metropolitan Life Insurance Company Statistical
Bulletin, 1948; 29(9): 8–10. Details about the age and gender distribution of the business are not provided.133 Dunn H. Vital Statistics of the United States 1900–1940. US Government Printing Office, 1947.134 Craig J, Dublin L. The Influenza Epidemic of 1918. Transactions, Actuarial Society of America, 1919; 20:
134–156.135 Little J. Discussion of the paper “The influenza epidemic of 1918, Craig J and Dublin L”. Transactions,
Actuarial Society of America, 1919; 20: 493–6.136 This is an internal analysis performed by Swiss Re; it has not been published externally.137 Grove RD and Hetzel AM, Vital statistics rates in the United States, 1940–1960. Washington,
DC: US National Center for Statistics, 1968.

82 Swiss Re: Pandemic influenza
0
0.05
0.10
0.15
0.20
0.25
Swiss Re pneumonia and influenza study
US white malepopulation
Death rate/1 000
Pre-pandemic period (1953–1956)Pandemic (1957–1958)
To correct for any differences in the age distribution between the insured and general population, mortality rates are age-adjusted to the standard population of 1940 and, in addition, are restricted to the age groups to whom life insurance is more commonly issued, ie, children and adults and not the advanced elderly.
Source: US National Vital Statistics System (US white male population) (see footnote 138)
Using data for the white male population from the US National Vital Statistics System138, Swiss Re conducted a similar analysis of insured business during the period between 1964 and 1969. The purpose was to again compare the impact of the 1968 influenza pandemic in insured and general population groups. Figure A.2 summarises findings for insured males issued with standard policies, as compared with the US white male gener-al population.
0
0.05
0.10
0.15
0.20
0.25
Swiss Re pneumonia and influenza study
US white male population
Death rate/1 000
Pre-pandemic period (1964–1967)Pandemic (1968–1969)
The note beneath Figure A.1 applies also to this chart.
Source: US National Vital Statistics System (US white male population) (see footnote 138)
138 Table 290 (trend table for 1960–67). US National Vital Statistics System, 1968–78.
Figure A.1Mortality rates due to pneumonia and influ-enza, males aged 0–74, before and during the 1957 influenza pandemic, US white male population compared with Swiss Re study group
Figure A.2Mortality rates due to pneumonia and influ-enza, males aged 0–74, before and during the 1968 influenza pandemic, US white male population compared with Swiss Re study group
Appendix A Influenza mortality in the insured population

83 Swiss Re: Pandemic influenza
Similar to the 1957 study, the pneumonia and influenza mortality death rate for both pe-riods was lower than in the general population, and the excess death rate in the insured group was approximately 12% lower. Over the entire period – ie, 1964 to 1969 – there were 335 deaths in the insured group.
This review of historic insured lives experience enables several conclusions to be made.
First, mortality experience during influenza pandemics has been noted to vary according to certain life insurance characteristics. As early as 1918, some writers of life insurance believed that a class effect was being observed in the data. This effect was likely tied to medical screening and the economic status of the policyholder (as indicated by the amount assured), as these are the defining differences between industrial and ordinary policies.
Second, the absence of exact age and gender distribution data for the 1918 pandemics limits the ability to compare mortality experience between the insured and the general population. However, comparisons against general population groups that are made up of the most likely insured demographic subgroup (males) suggest that insured mortality rates were lower before, during, and after this pandemic than observed in the general population139. A significant increase in life insurance business volume may have contrib-uted to the lower insured mortality rates observed for the post-pandemic period.
Third, Swiss Re’s internal studies on the 1957 and 1968 pandemics offer limited evidence of better mortality experience in insured groups of standard ordinary policyholders, com-pared with an age- and gender-matched general population. This finding is also consist-ent with a further set of data published by Metropolitan Life Insurance company on its standard ordinary policyholders140.
If these differences in mortality outcomes have existed in the past, it is plausible to be-lieve that such differences may continue into the future. Additionally, since mortality dif-ferences within insured groups have been observed, it is likely that a range of possible outcomes may occur. These outcomes would depend on factors such as the differences that might arise in characteristics of insured groups according to the amount assured.
A.2 Chronic disease burden and socio-economic status
Against this background, what are the underlying drivers behind these differences in observed mortality?
Historic observers of the 1918 pandemic noted that chronic disease was a risk factor for mortality141, 142. Also, during the 1968 pandemic, about half of those aged between 45 and 64 who died of influenza had a serious chronic condition listed on their death certifi-cate143. Even today, physicians recognise that chronic disease continues to be a risk fac-tor for influenza mortality, and include people with chronic disease among those they recommend for vaccination. The burden of underlying chronic disease is lower in medi-cally screened populations who buy life insurance, and this may be an important factor in the observation of different outcomes between insured and general populations in influ-enza pandemics. People who purchase policies with higher amounts assured are likely to be employed and, in many countries, may have better access to healthcare. Data from
139 It is Swiss Re’s belief that the majority of polices during this period were predominantly sold to males.140 Mortality from influenza and pneumonia. In Metropolitan Life Insurance Company Statistical Bulletin, 1976;
57: 2–7.141 Report on the mortality from influenza in England and Wales during the epidemic of 1918–19, page 3
(supplement to the 81st annual report of the Registrar-General of Births, Deaths and Marriages, London). HMSO, 1920.
142 Collins S. Excess mortality from causes other than influenza and pneumonia during influenza epidemics. Public Health Reports, 1932; 47(46): 2159–2180.
143 Simonsen L, Clarke M et al, 1998 (see footnote 39).

84 Swiss Re: Pandemic influenza
the National Health Interview survey in the United States finds a significantly lower prev-alence of heart disease, stroke, asthma, emphysema and diabetes in those with higher incomes and private health insurance144. All of these diseases can increase the rate of adverse outcomes in those who develop influenza. Studies have also noted that, for peo-ple with these conditions, a higher socio-economic status is associated with a reduced relative risk of death, as compared with the risk faced from the same diseases by people who are financially worse off145. Recent models of a future influenza pandemic also pre-dict a different outcome in developing countries compared with what will be observed in developed regions, based on differences in personal economics and the availability of health resources146.
A population-based qualitative survey study of the 1918 pandemic – based on 100 000 household interviews – found that those of higher economic means were less likely to acquire, and die of, pandemic influenza than those judged to be from poorer house-holds147. As noted in Figure A.3, Swiss Re’s study of the 1968 pandemic found that the amount assured can be related to different pneumonia and influenza mortality outcomes in insured groups. In the study, both the pre-pandemic and pandemic mortality from pneumonia and influenza, along with the excess death rate, was found to be significantly lower in the higher-amount group than for lower amounts assured. Consistent with these findings, other population studies have also identified reduced mortality rates due to res-piratory disease with higher socio-economic status148.
0
0.05
0.10
0.15
0.20
0.25
Higher amountsassured
Lower amounts assured
Death rate/1 000
Pre-pandemic period (1964–1967)Pandemic (1968–1969)
The upper amount-assured range in this study averaged USD 24 000 for the pre-pandemic period and USD 28 000 for the pandemic period. The lower amount-assured range averaged USD 6 400 and USD 7 000 respectively. The analysis is restricted to ordinary policies issued at standard rates to male policyholders. The average policy duration was similar in all groups (6.5 to 7.5 years). All policies issued in this study (across all amounts assured) would have included medical underwriting.
144 Lethbridge-Çejku M et al. National Heath Interview Survey, 2004. Vital Health Statistics Reports, US National Center for Heath Statistics, 2006; 10(228).
145 Steeland K et al. All-cause and cause specific mortality by socio-economic status among employed persons in 27 US states, 1984–1997. Americal Journal of Public Health, 2004; 94: 1037–42.
146 Murray CJL, Lopez AD et al. Estimation of potential global pandemic influenza mortality on the basis of vital registry data from the 1918–20 pandemic: A quantitative analysis. Lancet, 2006; 368: 2211–8.
147 Sydenstricker E. The incidence of influenza among persons of different economic status during the epidemic of 1918. Reprint of USPHS Report, 46(4) January 1931, Public Health Reports, 2006; 121 (Supp 1) 191–204.
148 Turrell G et al. Socio-economic inequalities in all-cause and specific cause mortality in Australia, 1985–87 and 1995–97. International Journal of Epidemiology, 2001; 30: 231–39.
Figure A.3Mortality rates due to pneumonia and influ-enza, standard insured males aged 0–74, before and during the 1968 influenza pan-demic, low amounts assured compared with high amounts assured
Appendix A Influenza mortality in the insured population

85 Swiss Re: Pandemic influenza
A.3 The relevance of historical findings for future pandemics
Against this evidence on mortality differences between insured and general population groups, to what extent is this information relevant for future pandemics?
The benefit of risk selectionUnderwriting and product offerings have undergone significant changes since the pan-demics that occurred in the early and mid-20th century. In the United States, blood test-ing is now widely used in many products to look for overt disease, and to assess the risk of future disease. Medical screening continues to become more advanced and, where available, physicians’ reports often yield extensive information of importance to under-writing. Compared with the risk selection process of the early 1900s, today’s underwrit-ing environment makes it possible to learn a great deal more about an applicant. At the same time, however, the cost of issuing policies and the time involved in obtaining medi-cal screening have been significant drivers in the growth of simplified-issue products, where the use of objective medical screening is far more limited.
Differences that existed historically in terms of policyholder profile – defined by the amount assured and the intensity of medical screening – continue to exist today, due to the diversity in both levels of premiums and product offerings, and the associated wide differences in observed mortality. It is likely that those policyholders who meet the most stringent objective screening standards, and who purchase policies at above-average amounts assured, could fare considerably better in the event of a pandemic, because of better underlying health status, and perhaps due to the availability of additional health-care resources associated with their higher socio-economic status. At the other extreme, in the case of certain simplified-issue, final-expense policies, these products have histori-cally been noted to experience levels of mortality that can exceed aggregate general population mortality. During the next pandemic, it is conceivable that the known adverse association between chronic disease burden and influenza mortality may lead to even worse excess mortality experience for such products than in the general population.
Some in the industry question the effectiveness of contemporary underwriting practices in significantly altering the burden of chronic disease and therefore question the need to consider the impact of pandemics in insured groups separately from the general popula-tion. However, Swiss Re takes the view that risk selection is highly instrumental in defin-ing a group with a lower disease burden. Through its Admin Re® acquisitions149, Swiss Re has been able to assess the prevalence of chronic disease in traditional lines of US insur-ance business issued over the past 10 years. In comparing the age-specific prevalence of disease in applicants and policyholders for conditions known to increase adverse out-comes in influenza, this analysis has found significant reductions in the prevalence of heart disease, asthma, emphysema and diabetes at the time of policy issue, as com-pared with the equivalent age-specific disease prevalence rates in the general popula-tion150. Chronic disease does not explain all influenza deaths, but these observations confirm that it contributes to adverse outcomes in some who are affected by influenza. The fact that the risk selection process effectively reduces chronic disease burden in those below and above age 65 should help contribute to better outcomes in an under-written group.
149 Admin Re® is a core line of business for Swiss Re. This risk and capital management solution involves the acquisition of life insurance companies or the reinsurance of books of life and health policies. In addition to assuming the insurance risk, Swiss Re typically assumes responsibility for policy administration.
150 Lethbridge-Çejku M et al, 2004 (see footnote 145).

86 Swiss Re: Pandemic influenza
More generally, through its analyses, Swiss Re has noted a reduced prevalence of all types of risk factors in applicants and policyholders compared with the general popula-tion at equivalent ages. Self-selection (ie, potential applicants choosing not to apply be-cause of their disease or other risk factor) and underwriting continue to be the main drivers of the reduced burden of chronic disease in insured groups. Relative to observed mortality in the general population, self-selection and underwriting contribute to signifi-cantly reduced mortality rates in policyholders, both at the time of policy issue and for a range of durations into the life of the policy. For those insurance products that employ a reasonable number of objective medical screens, companies should be confident that they have selected a population with a more optimal medical risk profile to face a future pandemic than the population at large. Additionally, in line with research among the gen-eral population that looks into the impact of socio-economic status on health, Swiss Re has identified a reduced prevalence of chronic disease in applicants and policyholders as the amount assured increases, suggesting that different outcomes within the same product type may also be observed151.
Further observationsAn important issue to consider is what “healthy” meant in 1918 compared with how we would define health status today. The standards of healthcare and diagnostic capabilities at the beginning of the 20th century were vastly different from those in place today.
At the time of the 1918 pandemic some 30% of adults in the United States would have tested positive for exposure to tuberculosis. Physicians’ ability to identify disease at the pre-symptomatic stage was far less advanced. Evidence of the limited ability to screen for chronic disease is highlighted by an autopsy study of soldiers who died of influenza in 1918, where longstanding diseases such as tuberculosis, cirrhosis, chronic fibrous hepa-titis, fibrous myocarditis and chronic nephritis were shown to be present in a number of the cases152. Not long before their death, these people had been considered fit for war-time duty, yet the presence of longstanding disease in a portion of those who died sug-gests that they were not healthy when they entered active duty.
Just because some of these individuals who died of influenza did not overtly display symptoms of disease, it does not mean that these people were free from underlying dis-ease. On the contrary, it is likely that the course of influenza in some of these cases was adversely affected by the presence of these other diseases. It seems plausible that some apparently young and healthy individuals who died of influenza in 1918 had experienced this adverse outcome due to the presence of some other illness.
Today, insurance applicants undergoing the routine medical screening associated with fully underwritten policies would be less likely to have any of these conditions. In addition, the reduction in the prevalence of infectious diseases, such as tuberculosis, in developed countries would significantly reduce the probability of conditions such as this lung infec-tion being present in most insured groups.
151 The analyses discussed in this paragraph are internal studies of proprietary data on insured lives, and are not therefore available in the public domain.
152 Walker O. Pathology of influenza-pneumonia, Journal of Laboratory and Clinical Medicine, 1919; 5: 154–75.
Appendix A Influenza mortality in the insured population

87 Swiss Re: Pandemic influenza
A.4 Conclusions
Certain factors in the population today are likely to influence influenza outcomes, just as they have influenced them in the past. Chronic disease is one of these factors. This ap-pendix has presented evidence that the risk selection process tied to traditional life insur-ance purchases can significantly reduce chronic disease burden in the insured group. Risk selection contributes to more favourable mortality long after the applicant is granted the insurance cover, suggesting that the alteration in disease burden through the screen-ing process is not a short-lived phenomenon.
Socio-economic status is another influence on disease outcome. Analyses conducted by Swiss Re on the 1968 pandemic suggest that the amount assured may be a surrogate measure of socio-economic status (these studies observed a reduced influenza mortality in the group purchasing higher amounts assured). Research continues to find an associa-tion between morbidity and mortality risk and socio-economic status. Recent models of a future influenza pandemic also predict a different outcome in developing countries compared with what will be observed in developed regions, based on differences in per-sonal economics and the availability of health resources.
Based on the evidence presented in this appendix, it seems plausible that risk selection and socio-economic status are factors that can result in improved outcomes associated with influenza, as compared with an unselected general population.

88 Swiss Re: Pandemic influenza
While the main focus of this publication is to consider the mortality impact of influenza pandemics, a pandemic also has the potential to have an impact on casualty business. Many of the exposures described in this appendix may also apply in the case of seasonal influenza, but their impact would likely be greatly exacerbated during a global pandemic.
Claims arising from contamination of property are a possibility, albeit a fairly remote one153. If contamination occurs, it could result in business interruption, evacuation and closure of buildings and, ultimately, in costs for decontamination. The extent to which the presence of the influenza virus in, or on, a premises constitutes a physical injury or destruction of tangible property – and therefore a trigger for liability policies – would depend on the legal interpretation of the specific case.
A more likely scenario is that liability covers which provide indemnification for bodily injury or death could be triggered by an influenza-related event. Almost all liability insurance policies taken out by businesses are typically subject to claims for bodily injury which, al-legedly, is caused by the insured. Disease transmission from contaminated hard surfaces is possible, and this type of transmission does constitute a potential risk to human life. For a claim to be successful, the claimant would need to prove a causal connection be-tween the infection or exposure and the actions of the insured. However, in most cases involving influenza, proving such a relationship between cause and effect could be ex-tremely difficult, except where the claimant has been unequivocally exposed – for exam-ple, workers in the health sector. As regards the cost of defending a claim, in liability in-surance the policyholder is likely to be covered, whether or not the claim proves to be valid.
B.1 Duties of care
From a legal perspective, business operators have certain duties of care. Negligent or intentional violations of such duties may create a legal liability to compensate victims. There are specific duties of care regarding employees, third parties and shareholders.
EmployeesAn employer has a duty to provide a safe working environment and to protect its employ-ees from any damage related to their occupational activity. Typically, however, employers have no general liability towards influenza victims (ie, simply because an employee hap-pens to contract influenza but is unable to prove any fault on the part of his or her em-ployer does not automatically provide grounds for a claim against the employer).
Employers could potentially bear liability, however, where an employee is able to estab-lish that he or she contracted influenza at their workplace or were clearly put at a higher risk by specific circumstances related to their job. Where companies fail to take appropri-ate action to protect an employee who falls ill, the employer may be exposed to a claim (or a claim from the deceased’s family if the victim subsequently dies of influenza). In highly exposed sectors like healthcare or public transport, the employer has an extended duty of care to implement all practical measures advised by the relevant authorities in the interests of minimising potential exposure to influenza infection. These measures could involve rules for hand washing, disinfection of instruments, use of face masks, social dis-tancing or other means of preventing influenza from spreading through physical contact made in the workplace.
153 Indoors, the influenza virus can survive for up to 24 hours on steel surfaces; under optimal conditions of low humidity and cool temperatures, it can survive on a hard surface for two days (see Chapter 2, section 2.3).
Appendix B Impact on casualty lines

89 Swiss Re: Pandemic influenza
Third partiesThe vast majority of critical infrastructure facilities are owned and operated by private industry. Even where infrastructure is operated by government, the private sector is fre-quently involved – for example, the maintenance of public transport vehicles may be handled by private companies. In order to mitigate the impact of an influenza pandemic on the economy and the functioning of society, the private sector must therefore take ef-fective measures to protect the health and safety not only of its employees but also its customers and other stakeholders. Based on this consideration, there will be a certain duty of care and obligation in respect of protecting third parties. Plaintiffs may argue that they caught influenza or have suffered other damage because the operator or owner of a business did not take all measures that could be reasonably expected in law to prevent the transmission of the disease.
ShareholdersAn influenza pandemic could cause severe economic damage, in particular to companies whose operators or owners have not taken all necessary steps to ensure business conti-nuity. Apart from the remote possibility of contamination, a pandemic would not directly affect the physical infrastructure of an organisation, but would have an impact on its hu-man resources, removing essential personnel from the workplace for weeks, or potentially months where recruitment and training is necessary to replace employees who die from the virus. The precise impact would depend in part on the geographical reach of the company, ie, ranging from a single site to a global network of offices. Various estimates exist, but it is expected that, at the height of a pandemic wave, up to 40% of employees may be absent for a period of two weeks, with lower percentages absent for a few weeks on either side of the peak154. Periods of absence will be due not only to illness or inca-pacitation on the part of individual employees, but also because of a proportion of the workforce staying at home to take care of sick family members, remaining in voluntary quarantine in households affected by influenza, minding children when schools are closed, reacting to public health recommendations, or simply staying at home to improve their chances of not contracting the virus.
To help mitigate against possible liability, from the point of view of operational risk man-agement and business continuity management, it is important for companies to draw up plans for carrying on with a reduced workforce and in the absence of key persons, including making arrangements for people to work at home. Measures should also be devised to protect the health of the workforce and to mitigate against substantial finan-cial losses or major falls in stock prices.
154 National strategy for pandemic influenza: Implementation plan, (US) White House Homeland Security Council, May 2006, page 13.

90 Swiss Re: Pandemic influenza
B.2 Implications for specific casualty lines of business
This section sets out the specific lines of business that may be affected by an influenza pandemic. In order for casualty underwriters to mitigate against the impact, best practice requires a detailed assessment of the potential exposure to a pandemic, for example, to identify highly-exposed industries and activities, and to ensure the presence of proper risk management and contingency planning on the part of the insured. Underwriters should also take steps to apply adequate conditions through, for example, clear limitations to the extent of coverages, limitations on indemnity payments covering the cost of de-fending claims, and the imposition of sublimits.
Coverage for occupational diseasesAs set out above, workers in certain occupations – such as hospital and medical research workers – have a heightened exposure to infectious diseases. For these groups, infectious diseases are usually defined as occupational diseases which, by law, must typically be covered under first-party occupational accident/disease policies, such as workers’ com-pensation (or employers’ liability, as it is known in the United Kingdom).
Travel accident insuranceTravel accident policies covering illness/sickness and “repatriation not arising from an accident” could be triggered.
General third-party liability insurance Depending on the legal situation and the burden of proof in terms of causality, the dis-semination of infectious viruses in frequently used buildings and installations – such as schools, shopping centres, hospitals, public transport and commercial buildings – could trigger public liability insurance on the basis of negligent failure to prevent contamination and pollution, inadequate precautionary measures, or poor housekeeping or hygiene standards.
Typically, general third-party liability (GTPL) insurance policies are triggered only by an actual injury. However, in view of the bodily injury or personal injury wording of some policies, claims based on fear of exposure, exposure without actual symptoms, or mental or emotional distress may also be covered.
Since influenza is usually spread by airborne transmission of the virus, it could be argued that the pollution exclusions in the GTPL policies apply. The pollution wording usually excludes any “soil, liquid or gaseous contaminants or irritants”. These exclusions are not limited to industrial chemicals and waste only, and may be interpreted in a broader sense to encompass anything that is a potential contaminant or irritant.
The varied wording of GTPL policies and the various legal interpretations of policy lan-guage could lead to coverage disputes.
Professional indemnity insuranceProfessional indemnity insurance could also be subject to claims, for example, due to flawed consultancy and recommendations in contingency planning (errors & omissions) or insufficient hygiene and sterilisation of rooms and instruments (medical malpractice).
From an operational risk management point of view, directors and officers (D & O) are re-quired to implement action plans for pandemics155. Claims due to the negligent failure of such contingency planning, which lead to a financial loss other than property damage or bodily injury, could also have an impact on D & O insurance. In particular, D & O policies might be exposed if a drop in stock prices following a pandemic event were to trigger investor claims.
155 For example, the US National strategy for pandemic influenza: Implementation plan (see footnote 154) requires: “As part of [their] planning, organizations will need to ensure that reasonable measures are in place to protect the health of personnel during a pandemic”.
Appendix B Impact on casualty lines

Jürg BusenhartJürg Busenhart is a technical officer in the Casualty Americas unit of Swiss Re’s Products function. In addi-tion to heading the Centre of Competence for Environ-mental Impairment Liability, he also directs the Envi-ronmental Risk & Underwriting Knowledge Network, which brings together Swiss Re’s environmental insur-ance specialists. He is an expert in environmental and product recall insurance, and acts a consultant for Swiss Re’s Client Markets divisions on specialised lia-bility issues and liability insurance solutions. He studied chemistry and graduated from the University of Zurich with a degree in law. He joined Swiss Re in 1996 after working for several years as a liability insurance spe-cialist in primary insurance.
Dr Brian IvanovicDr Brian Ivanovic, a board-certified family physician and epidemiologist, directs and manages the under-writing research area of Applied R & D at Swiss Re’s offices in Fort Wayne. He serves as Swiss Re’s point of contact to identify emerging life and health risks and supports facultative underwriting as a member of the medical director case review team. Dr Ivanovic is an associate editor of the Journal of Insurance Medicine and has contributed towards articles in the North American Actuarial Journal. He has assisted with sev-eral Society of Actuaries research working groups and was lead instructor on a key mortality course offered by the American Academy of Insurance Medicine. Pri-or to joining the insurance industry in 1997, he com-pleted a Fellowship in Academic Medicine at the Medical College of Wisconsin in Milwaukee and spent six years teaching medical students in Des Moines and Milwaukee. He began his professional career as a flight surgeon in the US Air Force.
Keith WoolnoughKeith Woolnough, the lead author of this publication, works as a senior risk actuary in Swiss Re’s Life & Health Risk Management team in London. Among his key responsibilities is the monitoring and communicating of pandemic risk. He has worked closely with Swiss Re Capital Management and Advisory team in arranging the latest tranche of Swiss Re’s Vita Capital extreme mortality notes, which mitigate Swiss Re’s exposure to the extreme mortality risks associated with pandemic influenza. He joined Swiss Re in 2002, with more than 20 years’ experience in various actuarial management positions within financial services organisations. He graduated in civil engineering from the University of Auckland, is a Fellow of the Institute of Actuaries of Australia and a member of the Pandemics Working Party of the Faculty and Institute of Actuaries.
Stephen KramerStephen Kramer is Swiss Re’s head of Life & Health parametric modelling, and the primary author of Swiss Re’s pandemic influenza model. He relocated to London from South Africa for the specific purpose of constructing a pandemic influenza model for Swiss Re, having previously gained extensive experience in mod-elling AIDS/HIV in sub-Saharan countries. Prior to join-ing Swiss Re he worked at the Centre for Actuarial Re-search at the University of Cape Town, and provided consultancy services to insurance companies includ-ing Metropolitan Life. In South Africa he developed AIDS/HIV and demographic models for a number of countries, was a member of the AIDS sub-committee of the Actuarial Society of South Africa, and was a founding member of the Life Offices Association AIDS committee. He has written and spoken extensively on AIDS/HIV, including writing the introductory chapter of the Southern African HIV clinicians’ handbook (social epidemiology), articles on AIDS/HIV modelling, and industry opinions on AIDS/HIV and insurance.

© 2007 Swiss Reinsurance Company
Title: Pandemic influenza: A 21st century model for mortality shocks
Authors:Keith Woolnough (all chapters except those shown below)Dr Brian Ivanovic (Chapter 2 and Appendix A) Stephen Kramer (Chapter 5)Jürg Busenhart (Appendix B)
Editing and realisation:Tim Dickenson
Production:Group Communications
Graphic designLogistics/Media Production
Photo credits:Front cover: www.inmagine.comPage 8: AFP/GettyimagesPage 15: KeystonePage 24: KeystonePage 36: © F. Hoffmann-La Roche Ltd.,
used with permissionPage 47: GettyimagesPage 72: Keystone
The authors and editor thank those who kindly dedicated time to peer reviewing this publication.
The editorial deadline for this production was 15 June 2007.
Internet URLs cited were correct at the time of writing.
The material and conclusions contained in this publi-cation are for information purposes only, and theauthors offer no guarantee for the accuracy andcompleteness of its contents. All liability for theintegrity, confidentiality or timeliness of this publica-tion, or for any damages resulting from the use ofinformation herein is expressly excluded. Under nocircumstances shall Swiss Re Group or its entities beliable for any financial or consequential loss relating to this product.
Order number: 1503215_07_en
Group Communications, 7/07, 5000 en

Swiss Reinsurance CompanyMythenquai 50/60P.O. Box8022 ZurichSwitzerland
Telephone +41 43 285 2121Fax +41 43 285 2999www.swissre.com