panama profile
24
The Panama Canal - Uniting the Oceans: Panama travel is incomplete without visiting one of mankind's greatest accomplishments: the Panama Canal. The Panama Canal splits the Panama isthmus and unites the Atlantic Ocean and the Pacific Ocean, allowing ships to pass through. Imagine: before the construction of the Panama Canal, a ship heading from California to New York would have to travel 14 ,000 miles, circumnavigating the entire continent of South America! Once the Panama Canal was completed, the same voyage took (and still takes) just 6,000 miles. In 1903 the United States secured the right, by treaty, to build a canal across Panama (see The 1903 Treaty and Qualified Independence , ch. 1). The United States rejected plans to build a sea-level canal similar to that attempted by the French and opted instead for a system based on locks. Construction began in 1907 and was facilitated by medical work that largely eradicated yellow fever and reduced the incidence of malaria (see Building the Canal , ch. 1). Construction of the canal involved damming the Río Chagres to create the huge Gatun Lake in the middle of the isthmus. Channels were dug from each coast, and locks were built to raise and lower ships between sea level and Gatun Lake. Three sets of locks were constructed: Gatun Locks on the Atlantic side, and the Pedro Miguel and Miraflores Locks on the Pacific side. The lock chambers were 303 meters long by 33 meters wide, which limited vessel size to approximately 287 meters in length and 32 meters in width. Distance through the canal is eighty-two kilometers, and in 1987 transit took about fifteen hours, nearly half of which was sp ent in waiting. The canal began commercial operations in 1914. The United States operated the canal and set tolls from the beginning of operation. Tolls covered operation costs but were kept low to encourage canal use. Direct benefits to Panama were minimal, consisting of annual annuity payments that increased infrequently, usually in response to Panamanian demands. In the 1975 to 1977 period, the annuity payments reached US$2.3 million a year. Indirect benefits to Panama's economy were substantial, however, and included the jobs of its citizens working in the Canal Zone, value of goods and services sold to the Canal Zone and to passing ships, and expenditures by visitors. Data as of December 1987 The 1977 treaties and the related documents, which became effective October 1, 1979, signaled important changes for the Panamanian economy. The most obvious benefit was in receipts from operation of the canal. Under the terms of the treaties, the government of Panama receives from the Panama Canal Commission: a fixed annuity of US$10 million; an annual payment of US$10 million for public services such as police and fire protection, garbage collection, and street maintenance, which Panama provides
Transcript of panama profile

8/11/2019 panama profile
http://slidepdf.com/reader/full/panama-profile 1/24
The Panama Canal - Uniting the Oceans:
Panama travel is incomplete without visiting one of mankind's greatest
accomplishments: the Panama Canal. The Panama Canal splits the Panama isthmus
and unites the Atlantic Ocean and the Pacific Ocean, allowing ships to pass through.Imagine: before the construction of the Panama Canal, a ship heading from California to
New York would have to travel 14,000 miles, circumnavigating the entire continent of
South America! Once the Panama Canal was completed, the same voyage took (and
still takes) just 6,000 miles.
In 1903 the United States secured the right, by treaty, to build a canal across Panama(see The 1903 Treaty and Qualified Independence , ch. 1). The United States rejectedplans to build a sea-level canal similar to that attempted by the French and optedinstead for a system based on locks. Construction began in 1907 and was facilitated by
medical work that largely eradicated yellow fever and reduced the incidence of malaria(see Building the Canal , ch. 1).
Construction of the canal involved damming the Río Chagres to create the huge GatunLake in the middle of the isthmus. Channels were dug from each coast, and locks werebuilt to raise and lower ships between sea level and Gatun Lake. Three sets of lockswere constructed: Gatun Locks on the Atlantic side, and the Pedro Miguel andMiraflores Locks on the Pacific side. The lock chambers were 303 meters long by 33meters wide, which limited vessel size to approximately 287 meters in length and 32meters in width. Distance through the canal is eighty-two kilometers, and in 1987transit took about fifteen hours, nearly half of which was spent in waiting. The canal
began commercial operations in 1914.
The United States operated the canal and set tolls from the beginning of operation.Tolls covered operation costs but were kept low to encourage canal use. Directbenefits to Panama were minimal, consisting of annual annuity payments thatincreased infrequently, usually in response to Panamanian demands. In the 1975 to1977 period, the annuity payments reached US$2.3 million a year. Indirect benefits toPanama's economy were substantial, however, and included the jobs of its citizensworking in the Canal Zone, value of goods and services sold to the Canal Zone and topassing ships, and expenditures by visitors.
Data as of December 1987
The 1977 treaties and the related documents, which became effective October 1, 1979,signaled important changes for the Panamanian economy. The most obvious benefitwas in receipts from operation of the canal. Under the terms of the treaties, thegovernment of Panama receives from the Panama Canal Commission: a fixed annuityof US$10 million; an annual payment of US$10 million for public services such as policeand fire protection, garbage collection, and street maintenance, which Panama provides
8/11/2019 panama profile
http://slidepdf.com/reader/full/panama-profile 2/24
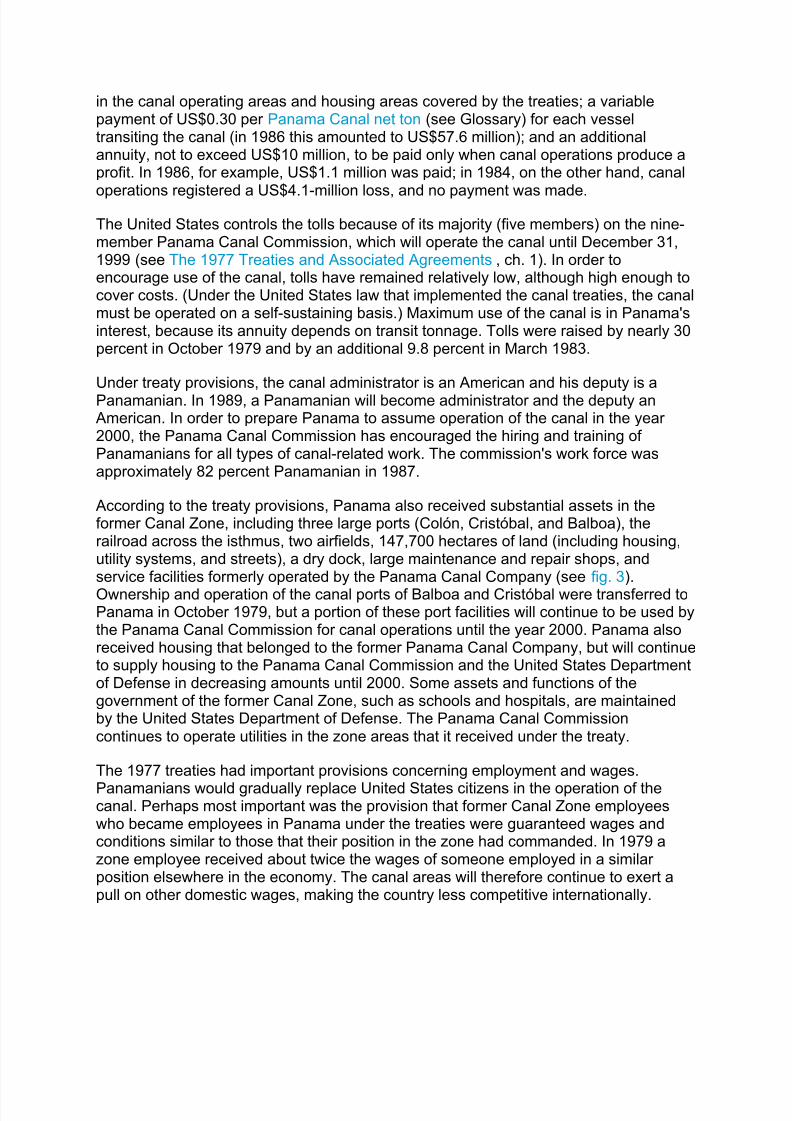
in the canal operating areas and housing areas covered by the treaties; a variablepayment of US$0.30 per Panama Canal net ton (see Glossary) for each vesseltransiting the canal (in 1986 this amounted to US$57.6 million); and an additionalannuity, not to exceed US$10 million, to be paid only when canal operations produce aprofit. In 1986, for example, US$1.1 million was paid; in 1984, on the other hand, canal
operations registered a US$4.1-million loss, and no payment was made.
The United States controls the tolls because of its majority (five members) on the nine-member Panama Canal Commission, which will operate the canal until December 31,1999 (see The 1977 Treaties and Associated Agreements , ch. 1). In order toencourage use of the canal, tolls have remained relatively low, although high enough tocover costs. (Under the United States law that implemented the canal treaties, the canalmust be operated on a self-sustaining basis.) Maximum use of the canal is in Panama'sinterest, because its annuity depends on transit tonnage. Tolls were raised by nearly 30percent in October 1979 and by an additional 9.8 percent in March 1983.
Under treaty provisions, the canal administrator is an American and his deputy is aPanamanian. In 1989, a Panamanian will become administrator and the deputy an
American. In order to prepare Panama to assume operation of the canal in the year2000, the Panama Canal Commission has encouraged the hiring and training ofPanamanians for all types of canal-related work. The commission's work force wasapproximately 82 percent Panamanian in 1987.
According to the treaty provisions, Panama also received substantial assets in theformer Canal Zone, including three large ports (Colón, Cristóbal, and Balboa), therailroad across the isthmus, two airfields, 147,700 hectares of land (including housing,utility systems, and streets), a dry dock, large maintenance and repair shops, andservice facilities formerly operated by the Panama Canal Company (see fig. 3).
Ownership and operation of the canal ports of Balboa and Cristóbal were transferred toPanama in October 1979, but a portion of these port facilities will continue to be used bythe Panama Canal Commission for canal operations until the year 2000. Panama alsoreceived housing that belonged to the former Panama Canal Company, but will continueto supply housing to the Panama Canal Commission and the United States Departmentof Defense in decreasing amounts until 2000. Some assets and functions of thegovernment of the former Canal Zone, such as schools and hospitals, are maintainedby the United States Department of Defense. The Panama Canal Commissioncontinues to operate utilities in the zone areas that it received under the treaty.
The 1977 treaties had important provisions concerning employment and wages.
Panamanians would gradually replace United States citizens in the operation of thecanal. Perhaps most important was the provision that former Canal Zone employeeswho became employees in Panama under the treaties were guaranteed wages andconditions similar to those that their position in the zone had commanded. In 1979 azone employee received about twice the wages of someone employed in a similarposition elsewhere in the economy. The canal areas will therefore continue to exert apull on other domestic wages, making the country less competitive internationally.
8/11/2019 panama profile
http://slidepdf.com/reader/full/panama-profile 3/24
Data as of December 1987
In the 1980s, Panama has struggled to adjust to the constraints imposed on itseconomy by a high external debt. To compensate for a deficit in the capital account, itscurrent account has registered a surplus since 1983, because the service sector has
maintained a surplus. Debt has remained high in per capita terms, but the actual debtburden has fallen.
Trade
The value of Panama's merchandise exports has always lagged behind imports. Thelevel of imports relative to the size of the economy has remained large. Panama'sconsumption standards have been high for a developing country. In the early 1900s,nearly everything consumed in the metropolitan areas was imported because littleagricultural surplus and virtually no manufacturing existed. By the mid-1980s, thecountry was largely self-sufficient in foods except for wheat, temperate-zone fruits andvegetables, and oils and fats. Domestic manufacturing provided a growing share of
consumer goods, but the country still imported a wide range of commodities.
With the decline of commodity prices on world markets in the 1980s, the terms of trade (see Glossary) have steadily moved against Panama. Based on a terms of trade indexof 100 in 1980, Panama's index stood at 82 in 1985, meaning that it had to exportconsiderably more in order to import the same value of goods it had previouslyimported.
Panama controlled trade by issuing import and export licenses. Since 1983 tariffs havegradually replaced quantitative restrictions on imports. Taxes were levied on someimports, and incentives were given to nontraditional exports through tax creditcertificates.
In 1985 merchandise exports totalled US$414.50 million (excluding reexports from theCFZ) down from US$526.10 million in 1980 (see table 16, Appendix A). Refinedpetroleum topped the list of export items, at US$100.60 million, but its net contributionto the trade balance was much smaller, given that Panama's crude oil is imported.Bananas, traditionally the largest export item, accounted for US$78.1 million in exports,followed by shrimp (US$53.4 million), manufactured goods (US$45 million), sugar(US$33.3 million), coffee (US$15.6 million), and clothing (US$11.5 million).
About 75 percent of Panama's exports went to industrial countries; Latin Americareceived the other 25 percent. The United States was by far the largest single market,
and in 1985 received 60.5 percent of Panama's exports. Most of the remaining exportswent to Costa Rica (7.5 percent), the Federal Republic of Germany (West Germany)(5.5 percent), Belgium (4.9 percent), and Italy (4.5 percent). The CBI was expected toincrease Panama's exports to the United States. The CBI seeks to provide long-termtrade, aid, and investment incentives to promote the economic revitalization of theCaribbean Basin. The most significant incentive is twelve-year, duty-free access of mostgoods to the United States market. Some omitted goods were footwear, textiles, leatherand general apparel, canned tuna, petroleum and petroleum products, rubber and
8/11/2019 panama profile
http://slidepdf.com/reader/full/panama-profile 4/24
plastic gloves, luggage, and handbags. In addition, special rules limited the eligibility ofsugar for duty-free treatment. Twenty countries, including Panama, were granted thisaccess in January 1984. In 1987 judging the long-term CBI benefits for Panama waspremature. Critics charged that few new trade benefits would accrue from the CBIbeyond those under the Generalized System of Preferences, which already
accommodated 87 percent of Caribbean Basin exports to the United States. In the initialyears of CBI implementation, the share of Panama's exports going to the United Statesremained unchanged.
In 1985 Panama's merchandise imports amounted to US$1.34 billion, or about 30percent of GDP. In that year, manufactured goods were the largest import item(US$348.6 million), followed by crude oil (US$271.8 million), machinery and transportequipment (US$266.7 million), chemicals (US$158.0 million), and food products(US$142.6 million). Crude oil has traditionally been the largest import item, but in the1980s its share of imports fell as petroleum prices declined and hydroelectric energycapacity increased.
About one-third of Panama's imports came from the United States, another third fromother industrial countries, and onethird from Latin America. In 1985 Panama's importscame from the United States (30.8 percent), Japan (8.9 percent), Mexico (8.2 percent),Venezuela (6.8 percent), and Ecuador (7.2 percent). Mexico and Venezuela supplied 70percent of Panama's crude oil under the San José Agreement.
Data as of December 1987
<< Back to Panama Economy
One of the major legacies of the Torrijos government was a large external debt. In the
1970s, the government relied increasingly on loans, essentially from abroad, to financecapital investments. The external public debt increased from US$150 million at thebeginning of 1970 to US$774 million at the end of 1975. External factors, such as therise in oil price, were partly to blame for the larger debt. By the end of 1978, Panama'sexternal debt was nearly US$1.9 billion, about 80 percent of GDP--one of the highestratios in the world.
In 1985 the external debt reached US$3.6 billion, or 73.5 percent of GDP, which on aper capita basis (US$1,636) was one of the largest in the world (see table 18, Appendix
A). Most of the debt (US$3.27 billion) was long-term in its maturity structure; US$2.13billion was owed to private creditors and US$1.14 billion to official creditors (US$741
million to multilateral agencies and US$403 million to bilateral sources).
Despite the high level of debt, the debt burden, as measured by the ratio of total interestto GDP, fell from 8.0 percent in 1982 to 6.6 percent in 1985. Several factors helpedPanama lower its debt burden. These included the drop in world oil prices and thedecline in the average interest rate from a high of 11.4 percent in 1982 to 8.5 percent in1985. In 1983 the government implemented an economic adjustment program, which,from 1982 to 1985, slowed the annual rate of foreign debt accumulation from 16.4

8/11/2019 panama profile
http://slidepdf.com/reader/full/panama-profile 5/24
percent to 6.7 percent and cut the private creditors' share of long-term debt from 72percent to 65 percent.
Panama has rescheduled its loans from international bank creditors in 1983, 1985, and1987. In September 1985, the Paris Club (a financial consortium of Western financiers
and governments) also agreed to restructure US$19 million in principal repayments. Anestimated US$1.2 billion was due between 1987 and 1990. Although the debt was stillhigh in per capita terms, the lowered debt burden enhanced the country's chances ofsuccessfully rescheduling its loans.
* * *The World Bank's Panama: Structural Change and Growth Prospects (1985) is an in-depth analysis of Panama's economy, with an emphasis on policy formulation. Forcomparative studies, see John Weeks's The Economies of Central America and issuesof the Economist Intelligence Unit's Country Profile: Nicaragua, Costa Rica, andPanama. For annual updates of economic activity in Panama, see the Inter-AmericanDevelopment Bank's Economic and Social Progress in Latin America, the InternationalMonetary Fund's Balance of Payments Statistics Yearbooks, and the World Bank'sWorld Development Reports. (For further information and complete citations, seeBibliography.)
U.S. – Panama Free Trade Agreement
On October 31, 2012 the U.S. Government and Government of Panamaannounced that the U.S. – Panama Trade Promotion Agreement (often referred toas the Free Trade Agreement, or FTA) – went into effect.
If you are interested in or are already exporting U.S. –made goods to Panama, theFTA is big news! And here is why:
Tariffs have dropped to 0% for 87% of U.S. Exports to Panama. Panama’s tariffs arealready relatively low – an average of 7% for industrial goods, around 15% foragricultural products regardless of where the products are made. But a 0% percent tariffis a competitive advantage for U.S.-made goods. And U.S. products and services arealready very competitive, with some 30% market share of Panama’s imports. That givesU.S. exporters several advantages:
Better chance of winning the business. You can drop your price relativeto your non-U.S. competitors. That gives you a competitive advantage.
Better margins. You can alternatively offer the same price and obtain bettermargins if you win the business. That 7 - 12% that went to paying the tariffnow goes to you. In that sense it is just like a tax cut, where you get to keepmore of your money.

8/11/2019 panama profile
http://slidepdf.com/reader/full/panama-profile 6/24
Simplified paperwork. For some of Panama’s biggest projects, e.g. thePanama Canal Expansion and the Metro, you can in theory export duty freeif eventually your goods will be re-exported or consumed. In reality, theseprojects are time-sensitive. Your supplies are on critical path. And thecontractors don’t have time to file paperwork. So you’ll end up having to
quote with duties paid or you’ll have paperwork delays that will cost you thebusiness. With the FTA in place, you don’t have to worry about those issues.You just have to document content of origin.
Greater Transparency in Public Procurement. Selling to the Governmentof Panama can be a challenge. Certain clauses in the FTA will make theprocess more transparent and will give the U.S. Government increasedleverage to ensure that you are competing on a level playing field.
No threat from Panamanian access to U.S. Market. Because Panama is aservice-driven economy with almost no industrial sector, U.S. exporters willnot face increased competition from Panamanian companies due to the FTA.
In fact, Panamanian exports to the U.S. (primarily agricultural products)already come in duty-free, due to the Caribbean Basin Initiative.
The United States and Panama signed a trade promotion agreement, sometimes calleda Free Trade Agreement (FTA), on June 28, 2007. Panama approved the TPA on July11, 2007. The TPA was signed into law in the United States on October 21, 2011.
U.S.-Panama FTA is a comprehensive free trade agreement that can result insignificant liberalization of trade in goods and services, including financial services. It
also includes important disciplines relating to customs administration and tradefacilitation, technical barriers to trade, government procurement, investment,telecommunications, electronic commerce, intellectual property rights, and labor andenvironmental protection.
U.S. firms will have better access to Panama's services sector than it provides to otherWTO Members under the General Agreement on Tarrifs in Services. All servicessectors are covered under the agreement except where Panama has made specificexceptions. Moreover, Panama agreed to become a full participant in the WTOInformation Technology Agreement.
Panama has also entered into a bilateral agreement with the United States resolving anumber of regulatory barriers to trade in agricultural goods ranging from meat andpoultry to processed products, including dairy and rice. USTR is currently working toaddress outstanding issues regarding the Panama FTA, including labor and tax policies.
President Obama is committed to pursuing an ambitious trade agenda that will helpgrow our economy and support good jobs for U.S. workers by opening new markets. To

8/11/2019 panama profile
http://slidepdf.com/reader/full/panama-profile 7/24
achieve that objective, we seek to provide a level playing field that creates economicopportunities for U.S. workers, companies, farmers, and ranchers, and that ensures ourtrading partners have acceptable working conditions and respect fundamental laborrights. As part of this broader trade agenda, the Obama Administration has workedclosely with the government of Panama to resolve outstanding issues related to the
U.S.-Panama Trade Promotion Agreement.
On April 18, 2011, a Tax Information Exchange Agreement (TIEA) went into effectbetween the United States and Panama. The TIEA will permit the two countries toimprove their tax information exchange transparency networks globally. TheGovernment of Panama has also taken a series of legislative and administrative actionsto further strengthen its labor laws and enforcement. The completion of action ontransparency and labor clears the way for the Obama Administration to begindiscussions with Members of Congress about the draft implementing bill for the
Agreement.
Panama is one of the fastest growing economies in Latin America, expanding 6.2percent in 2010, with similar annual growth forecast through 2015. The U.S.-PanamaTrade Promotion Agreement will support American jobs, expand markets, and enhanceU.S. competitiveness by eliminating tariffs and other barriers to U.S. exports andexpanding trade between our two countries.
Population growth rate: 1.35% (2014 est.)
Definition: The average annual percent change in the population, resulting from a
surplus (or deficit) of births over deaths and the balance of migrants entering andleaving a country. The rate may be positive or negative. The growth rate is a factor indetermining how great a burden would be imposed on a country by the changing needsof its people for infrastructure (e.g., schools, hospitals, housing, roads), resources (e.g.,food, water, electricity), and jobs. Rapid population growth can be seen as threateningby neighboring countries.
Panama
1.35% (2014 est.)
https://www.cia.gov/library/publications/the-world-factbook/fields/2002.html
CIA World Fact book
Population Growth Rate (%)

8/11/2019 panama profile
http://slidepdf.com/reader/full/panama-profile 8/24
export
Country 2000 2001 2002 2003 2004 2005 2006 2007 2008 2009 2010 2011 2012
Panama 1.34 1.3 1.26 1.36 1.31 1.26 1.6 1.56 1.54 1.5 1.46 1.44 1.41
8/11/2019 panama profile
http://slidepdf.com/reader/full/panama-profile 9/24
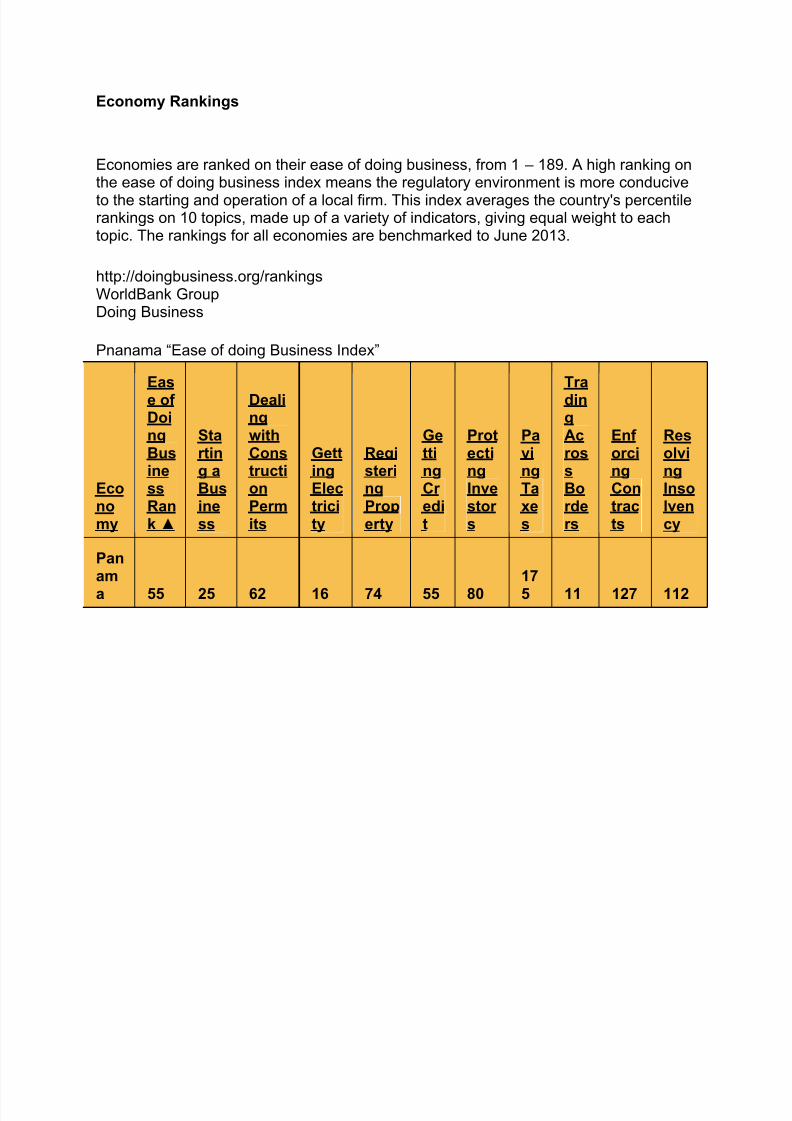
Economy Rankings
Economies are ranked on their ease of doing business, from 1 – 189. A high ranking onthe ease of doing business index means the regulatory environment is more conducive
to the starting and operation of a local firm. This index averages the country's percentilerankings on 10 topics, made up of a variety of indicators, giving equal weight to eachtopic. The rankings for all economies are benchmarked to June 2013.
http://doingbusiness.org/rankingsWorldBank GroupDoing Business
Pnanama “Ease of doing Business Index”
Economy
Ease ofDoingBusinessRank ▲
Starting aBusiness
DealingwithConstructionPermits
GettingElectricity
RegisteringProperty
GettingCr edit
ProtectingInvestor s
PayingTaxes
TradingAcrossBorders
Enf orcingContracts
ResolvingInsolvency
Panam
a 55 25 62 16 74 55 80
17
5 11 127 112
8/11/2019 panama profile
http://slidepdf.com/reader/full/panama-profile 10/24
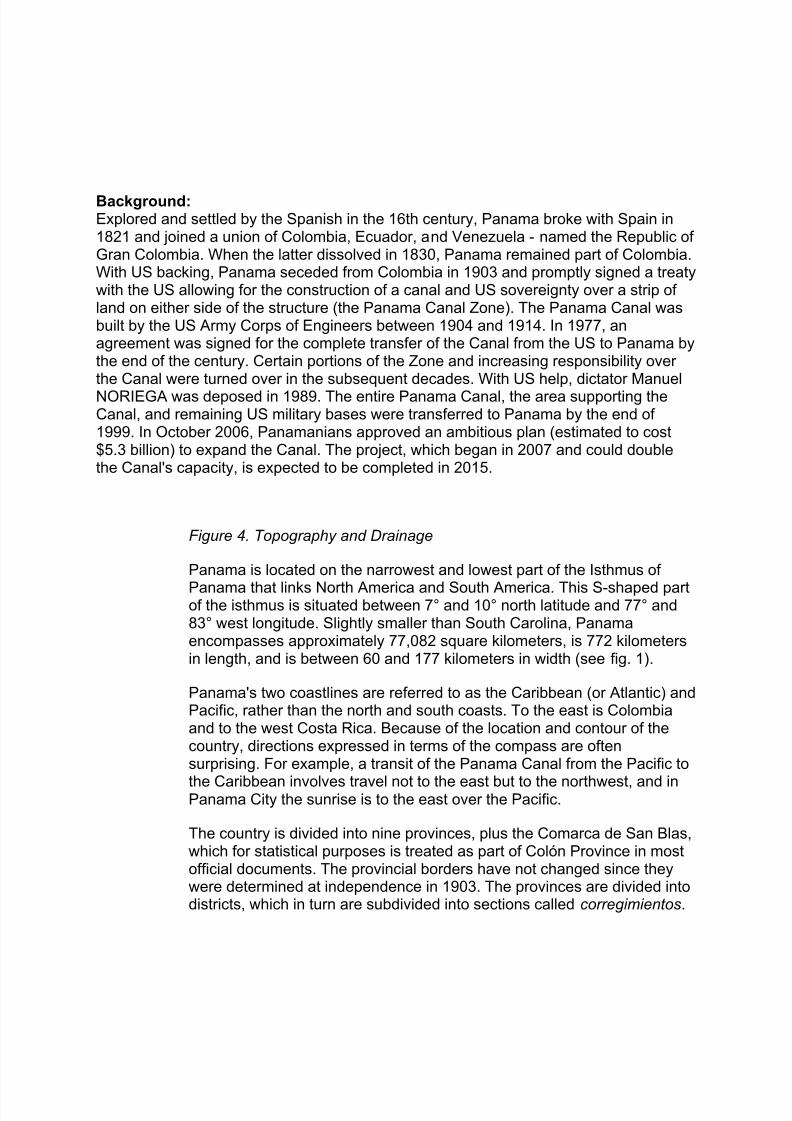
Background: Explored and settled by the Spanish in the 16th century, Panama broke with Spain in1821 and joined a union of Colombia, Ecuador, and Venezuela - named the Republic ofGran Colombia. When the latter dissolved in 1830, Panama remained part of Colombia.With US backing, Panama seceded from Colombia in 1903 and promptly signed a treatywith the US allowing for the construction of a canal and US sovereignty over a strip ofland on either side of the structure (the Panama Canal Zone). The Panama Canal wasbuilt by the US Army Corps of Engineers between 1904 and 1914. In 1977, anagreement was signed for the complete transfer of the Canal from the US to Panama bythe end of the century. Certain portions of the Zone and increasing responsibility overthe Canal were turned over in the subsequent decades. With US help, dictator Manuel
NORIEGA was deposed in 1989. The entire Panama Canal, the area supporting theCanal, and remaining US military bases were transferred to Panama by the end of1999. In October 2006, Panamanians approved an ambitious plan (estimated to cost$5.3 billion) to expand the Canal. The project, which began in 2007 and could doublethe Canal's capacity, is expected to be completed in 2015.
Figure 4. Topography and Drainage
Panama is located on the narrowest and lowest part of the Isthmus of
Panama that links North America and South America. This S-shaped partof the isthmus is situated between 7° and 10° north latitude and 77° and83° west longitude. Slightly smaller than South Carolina, Panamaencompasses approximately 77,082 square kilometers, is 772 kilometersin length, and is between 60 and 177 kilometers in width (see fig. 1).
Panama's two coastlines are referred to as the Caribbean (or Atlantic) andPacific, rather than the north and south coasts. To the east is Colombiaand to the west Costa Rica. Because of the location and contour of thecountry, directions expressed in terms of the compass are oftensurprising. For example, a transit of the Panama Canal from the Pacific to
the Caribbean involves travel not to the east but to the northwest, and inPanama City the sunrise is to the east over the Pacific.
The country is divided into nine provinces, plus the Comarca de San Blas,which for statistical purposes is treated as part of Colón Province in mostofficial documents. The provincial borders have not changed since theywere determined at independence in 1903. The provinces are divided intodistricts, which in turn are subdivided into sections called corregimientos.

8/11/2019 panama profile
http://slidepdf.com/reader/full/panama-profile 11/24
Configurations of the corregimientos are changed periodically toaccommodate population changes as revealed in the census reports.
The country's two international boundaries, with Colombia and Costa Rica,have been clearly demarcated, and in the late 1980s there were no
outstanding disputes. The country claims the seabed of the continentalshelf, which has been defined by Panama to extend to the 500-metersubmarine contour. In addition, a 1958 law asserts jurisdiction over 12nautical miles from the coastlines, and in 1968 the government announceda claim to a 200-nautical-mile Exclusive Economic Zone.
The Caribbean coastline is marked by several good natural harbors.However, Cristóbal, at the Caribbean terminus of the canal, had the onlyimportant port facilities in the late 1980s. The numerous islands of the
Archipiélago de Bocas del Toro, near the Costa Rican border, provide anextensive natural roadstead and shield the banana port of Almirante. Theover 350 San Blas Islands, near Colombia, are strung out for more than160 kilometers along the sheltered Caribbean coastline.
The major port on the Pacific coastline is Balboa. The principal islands arethose of the Archipiélago de las Perlas in the middle of the Gulf ofPanama, the penal colony on the Isla de Coiba in the Golfo de Chiriquí,and the decorative island of Taboga, a tourist attraction that can be seenfrom Panama City. In all, there are some 1,000 islands off the Pacificcoast.
The Pacific coastal waters are extraordinarily shallow. Depths of 180meters are reached only outside the perimeters of both the Gulf of
Panama and the Golfo de Chiriquí, and wide mud flats extend up to 70kilometers seaward from the coastlines. As a consequence, the tidal rangeis extreme. A variation of about 70 centimeters between high and lowwater on the Caribbean coast contrasts sharply with over 700 centimeterson the Pacific coast, and some 130 kilometers up the Río Tuira the rangeis still over 500 centimeters.
The dominant feature of the country's landform is the central spine ofmountains and hills that forms the continental divide (see fig. 4). Thedivide does not form part of the great mountain chains of North America,and only near the Colombian border are there highlands related to the
Andean system of South America. The spine that forms the divide is thehighly eroded arch of an uplift from the sea bottom, in which peaks wereformed by volcanic intrusions.
The mountain range of the divide is called the Cordillera de Talamancanear the Costa Rican border. Farther east it becomes the Serranía deTabasará, and the portion of it closer to the lower saddle of the isthmus,where the canal is located, is often called the Sierra de Veraguas. As a
8/11/2019 panama profile
http://slidepdf.com/reader/full/panama-profile 12/24
whole, the range between Costa Rica and the canal is generally referredto by Panamanian geographers as the Cordillera Central.
The highest point in the country is the Volcán Barú (formerly known as theVolcán de Chiriquí), which rises to almost 3,500 meters. The apex of a
highland that includes the nation's richest soil, the Volcán Barú is stillreferred to as a volcano, although it has been inactive for millennia.
Nearly 500 rivers lace Panama's rugged landscape. Mostly unnavigable,many originate as swift highland streams, meander in valleys, and formcoastal deltas. However, the Río Chepo and the Río Chagres are sourcesof hydroelectric power.
The Río Chagres is one of the longest and most vital of the approximately150 rivers that flow into the Caribbean. Part of this river was dammed tocreate Gatun Lake, which forms a major part of the transit route betweenthe locks near each end of the canal. Both Gatun Lake and Madden Lake(also filled with water from the Río Chagres) provide hydroelectricity forthe area of the former Canal Zone.
The Río Chepo, another major source of hydroelectric power, is one of themore than 300 rivers emptying into the Pacific. These Pacific-orientedrivers are longer and slower running than those of the Caribbean side.Their basins are also more extensive. One of the longest is the Río Tuira,which flows into the Golfo de San Miguel and is the nation's only rivernavigable by larger vessels.
Panama has a tropical climate. Temperatures are uniformly high- -as is
the relative humidity--and there is little seasonal variation. Diurnal rangesare low; on a typical dry-season day in the capital city, the early morningminimum may be 24°C and the afternoon maximum 29°C. Thetemperature seldom exceeds 32°C for more than a short time.
Temperatures on the Pacific side of the isthmus are somewhat lower thanon the Caribbean, and breezes tend to rise after dusk in most parts of thecountry. Temperatures are markedly cooler in the higher parts of themountain ranges, and frosts occur in the Cordillera de Talamanca inwestern Panama.
Climatic regions are determined less on the basis of temperature than onrainfall, which varies regionally from less than 1.3 to more than 3 metersper year. Almost all of the rain falls during the rainy season, which isusually from April to December, but varies in length from seven to ninemonths. The cycle of rainfall is determined primarily by two factors:moisture from the Caribbean, which is transported by north and northeastwinds prevailing during most of the year, and the continental divide, whichacts as a rainshield for the Pacific lowlands. A third influence that is
8/11/2019 panama profile
http://slidepdf.com/reader/full/panama-profile 13/24
present during the late autumn is the southwest wind off the Pacific. Thiswind brings some precipitation to the Pacific lowlands, modified by thehighlands of the Península de Azuero, which form a partial rainshield formuch of central Panama. In general, rainfall is much heavier on theCaribbean than on the Pacific side of the continental divide. The annual
average in Panama City is little more than half of that in Colón. Althoughrainy-season thunderstorms are common, the country is outside thehurricane track.
Panama's tropical environment supports an abundance of plants. Forestsdominate, interrupted in places by grasslands, scrub, and crops. Althoughnearly 40 percent of Panama is still wooded, deforestation is a continuingthreat to the rain-drenched woodlands. Tree cover has been reduced bymore than 50 percent since the 1940s. Subsistence farming, widelypracticed from the northeastern jungles to the southwestern grasslands,consists largely of corn, bean, and tuber plots. Mangrove swamps occuralong parts of both coasts, with banana plantations occupying deltas nearCosta Rica. In many places, a multi-canopied rain forest abuts the swampon one side of the country and extends to the lower reaches of slopes inthe other.
In mid-1987, Panama's population was estimated at 2.3 million, when 40percent of the population was under 15 years of age (see fig. 6). This highproportion suggested continued pressure on the educational system toprovide instruction and on the economy to create jobs in the next twodecades. Population had increased more than 600 percent since thecountry's first census in 1911 (see table 2, Appendix A). The annual rateof increase ranged from less than 0.5 percent in the economicallydepressed 1920s to more than 3 percent in the decade from 1910 to 1920and in the 1960s. Demographers projected an annual growth rate of 2.2percent in the 1980s, declining to 1.9 percent by 1990-95.
Provincial growth rates in the 1970s ranged from a low of 0.5 percent inLos Santos to a high of 3.5 percent in Panamá (see table 3, Appendix A).The population in Bocas del Toro, both in remote and rural areas, grew atan average annual rate of approximately 3.1 percent. This high growthrate was due to a significant influx of migrants in response to thedevelopment of the Cerro Colorado copper project in the eastern part ofthat province (see Mining , ch. 3). Population density was seventy-five
persons per square kilometer. The highest densities and the region of themost concentrated urbanization were located in the corridor along theformer Canal Zone from Colón to Panama City.
The crude death rate was 5 persons per 1,000 in the mid-1980s, a declineof nearly 50 percent from the mid-1960s. The crude birth rate was 27 per1,000, a drop of one-third during the same period. Organized familyplanning began in 1966 with the establishment of the Panamanian Family

8/11/2019 panama profile
http://slidepdf.com/reader/full/panama-profile 14/24
Planning Organization, a private group. By 1969 the Ministry of Healthwas actively involved in family planning; clinics, information, andinstruction were becoming more available to the population as a whole. Bythe late 1970s and early 1980s, more than 60 percent of women ofchildbearing age were using some form of contraception.
GEOGRAPHICAL NAMES
This table lists the international rankings of Panama in all categories that are publishedin the CIA World Factbook, and those that we derived from them. Additionalinternational rankings of Panama can be found in the main country ranks menu. For a definition of each entry, visit the Definitions page.
Ranked Data Value Rank Date of Info
Communications
Internet hosts 11,022 132 2012
Internet users 959,800 104 2009
Telephones - main lines in use 640,000 90 2012
Telephones - mobile cellular 6,770,000 96 2012
Economy
Budget expenditures $9,835,000,000 88 2012 est.
Budget revenues $9,070,000,000 85 2012 est.
Budget surplus (+) or deficit (-) % of GDP -2.10 88 2012 est.
Commercial bank prime lending rate (%) 6.91 128 31 Dec 2011 est.
Current account balance -$3,267,000,000 152 2012 est.

8/11/2019 panama profile
http://slidepdf.com/reader/full/panama-profile 15/24
Debt - external $13,560,000,000 89 31 Dec 2012 est.
Distribution of family income - Gini index 51.9 16 2010 est.
Exports $18,880,000,000 74 2012 est.
GDP - official exchange rate $35,760,000,000 93 2012 est.
GDP - per capita (PPP) $15,400 89 2012 est.
GDP - purchasing power parity $56,460,000,000 92 2012 est.
GDP - real growth rate (%) 10.70 8 2012 est.
Household income or consumption by
percentage share - highest 10%40.10 22 2010 est.
Household income or consumption by
percentage share - lowest 10% (%)
1.10 138 2010 est.
Imports $24,610,000,000 69 2012 est.
Industrial production growth rate (%) 15.70 2 2012 est.
Inflation rate(consumer prices) (%) 5.70 68 2012 est.
Labor force 1,517,000 128 2012 est.
Labor force - by occupation – agriculture
(%) 17.00 101 2009 est.
Labor force - by occupation – industry (%) 18.60 102 2009 est.
Labor force - by occupation – services (%) 64.40 71 2009 est.

8/11/2019 panama profile
http://slidepdf.com/reader/full/panama-profile 16/24
Market value of publicly traded shares $ 10,920,000,000 71 31 Dec 2010
Population below poverty line (%) 26.00 83 2012 est.
Public debt (% of GPD) 39.60 91 2012 est.
Reserves of foreign exchange and gold $2,466,000,000 118 31 Dec 2012 est.
Stock of broad money $ 29,720,000,000 77 31 Dec 2012 est.
Stock of direct foreign investment - abroad $3,110,000,000 68 31 Dec 2012 est.
Stock of direct foreign investment - at home $29,270,000,000 62 31 Dec 2012 est.
Stock of domestic credit $32,270,000,000 69 31 Dec 2012 est.
Stock of narrow money $ 7,659,000,000 87 31 Dec 2012 est.
Taxes and other revenues 25.4 122 2012 est.
Unemployment rate (%)
4.40 164 2012 est.
Energy
Carbon dioxide emissions from
consumption of energy
15,900,000 91 2011 est.
Crude Oil - exports 0 133 2010 est.
Crude Oil - imports 0 140 2010 est.
Crude Oil - production 0 167 2012 est.
Crude Oil - proved reserves 0 148 1 Jan 2010 est.

8/11/2019 panama profile
http://slidepdf.com/reader/full/panama-profile 17/24
Electricity - consumption(kWh) 6,209,000,000 104 2010 est.
Electricity – exports (kWh) 39,000,000 82 2010 est.
Electricity - from fossil fuels 52.6 148 2010 est.
Electricity - from hydroelectric plants 47.4 45 2010 est.
Electricity - from nuclear fuels 0.0 106 2010 est.
Electricity - from other renewable sources 0.0 157 2010 est.
Electricity – imports (kWh) 72,000,000 95 2011 est.
Electricity - installed generating capacity 1,976,000 104 2010 est.
Electricity – production (kWh) 7,257,000,000 107 2010 est.
Electricity Consumption per capita (kWh) 1,744.39 112 NA
Natural gas – consumption (cu m) 0 155 2010 est.
Natural gas – exports (cu m) 0 123 2011 est.
Natural gas – imports (cu m) 0 130 2011 est.
Natural gas – production (cu m) 0 147 2011 est.
Natural gas - proved reserves (cu m)
0 151 1 Jan 2013 est.
Refined petroleum products - consumption 98,890 78 2011 est.
Refined petroleum products - exports 0 156 2010 est.

8/11/2019 panama profile
http://slidepdf.com/reader/full/panama-profile 18/24
Refined petroleum products - imports 111,100 48 2010 est.
Refined petroleum products - production 0 154 2010 est.
Geography
Coastline(km) 2,490 55 NA
Elevation extremes - highest point (m) 3475 57 NA
Elevation extremes - lowest point (m) 0 108 NA
Freshwater withdrawal(domestic/industrial/agricultural) - per
capita (cu km/yr)
296.1 97 2005
Freshwater withdrawal
(domestic/industrial/agricultural) - total (cu
km/yr)
0.91 115 2005
Irrigated land (sq km) 346 120 2003
Land Area - sq km 74,340.00 118 NA
Land boundaries - km 555 135 NA
Land use - arable land (%) 7.16 134 2011
Land use – other (%) 90.33 108 2011
Land use - permanent crops (%) 2.51 79 2011
Population density - Persons per sq km* 47.88 159 Jul 2013 est.

8/11/2019 panama profile
http://slidepdf.com/reader/full/panama-profile 19/24
Total Area - sq km 75,420.00 118 NA
Total renewable water resources (cu km) 148.00 53 2011
Water Area - sq km 1,080 109 NA
Military
Manpower available for military service -
male890,006 131 2010 est.
Manpower fit for military service - female 728,329 128 2010 est.
Manpower fit for military service - male 731,254 128 2010 est.
Manpower reaching militarily significant
age annually - female30,879 121 2010 est.
Manpower reaching militarily significant
age annually - male32,142 122 2010 est.
Military expenditures - percent of GDP 1.00 126 2012
Population
Age structure 0-14 years - female 483,145 120 2013 est.
Age structure 0-14 years - male 503,633 121 2013 est.
Age structure 0-14 years (%) 27.70 96 2013 est.
Age structure 15-24 years 17.4 120 2013 est.
Age structure 15-24 years - female 304,056 129 2013 est.

8/11/2019 panama profile
http://slidepdf.com/reader/full/panama-profile 20/24
Age structure 15-24 years - male 315,918 130 2013 est.
Age structure 25-54 years 40 121 2013 est.
Age structure 25-54 years - female 703,459 134 2013 est.
Age structure 25-54 years - male 721,225 134 2013 est.
Age structure 55-64 years 7.3 119 2013 est.
Age structure 55-64 years - female 130,899 134 2013 est.
Age structure 55-64 years - male 127,743 131 2013 est.
Age structure 65 years and over - female 144,921 127 2013 est.
Age structure 65 years and over - male 124,409 120 2013 est.
Age structure 65 years and over (%) 7.60 100 2013 est.
Birth Rate(births/1,000 population)
18.91 96 2013 est.
Children under the age of 5 years
underweight
3.90 97 2008
Death Rate(deaths/1,000 population) 4.73 197 2013 est.
Drinking water source - Improved - rural 85.8 116 NA
Drinking water source - Improved - total 94.2 105 NA
Drinking water source - Improved - urban 97 116 NA
Drinking water source - UnImproved - rural 14.2 85 2011 est.
http://www.photius.com/rankings/population/children_under_the_age_of_5_years_underweight_2014_0.html
http://www.photius.com/rankings/population/children_under_the_age_of_5_years_underweight_2014_0.html
http://www.photius.com/rankings/population/children_under_the_age_of_5_years_underweight_2014_0.html
http://www.photius.com/rankings/population/children_under_the_age_of_5_years_underweight_2014_0.html

8/11/2019 panama profile
http://slidepdf.com/reader/full/panama-profile 21/24
Drinking water source - UnImproved - total 5.8 99 2011 est.
Drinking water source - UnImproved -
urban3 92 2011 est.
Education expenditures - percent of GDP 4.10 106 2011
Health expenditures 8.20 59 2011
HIV/AIDS - adult prevalence rate (%) 0.90 51 2009 est.
HIV/AIDS - deaths 1,500 60 2009 est.
HIV/AIDS - people living with HIV/AIDS 20,000 76 2009 est.
Hospital bed density 2.40 92 2010
Infant mortality rate – female (deaths/1,000
live births)
10.21 132 2013 est.
Infant mortality rate – male (deaths/1,000
live births)
11.77 139 2013 est.
Infant mortality rate – total (deaths/1,000
live births)
11.01 137 2013 est.
Life expectancy at birth – female (years) 81.04 57 2013 est.
Life expectancy at birth – male (years) 75.35 60 2013 est.
Life expectancy at birth – total (years) 78.13 56 2013 est.
Literacy – female (%) 93.50 101 2010 est.

8/11/2019 panama profile
http://slidepdf.com/reader/full/panama-profile 22/24
Literacy – male (%) 94.70 115 2010 est.
Literacy – total (%) 94.10 109 2010 est.
Maternal mortality rate 92.00 80 2010
Median age – female (years) 28.40 120 2013 est.
Median age – male (years) 27.60 122 2013 est.
Median age – total (years) 28.00 121 2013 est.
Net migration rate (migrant(s)/1,000population)
-0.35 130 2013 est.
Obesity - adult prevalence rate 25.40 55 2008
Physicians density 1.50 87 2000
Population 3,559,408 132 Jul 2013 est.
Population growth rate (%) 1.38 89 2013 est.
Sanitation facility access - Rural Improved
(% of population)54.1 132 NA
Sanitation facility access - Rural
UnImproved (% of population)
45.9 67 NA
Sanitation facility access - Total Improved(% of population)
71.2 129 NA
Sanitation facility access - Total
UnImproved (% of population)
28.8 74 NA

8/11/2019 panama profile
http://slidepdf.com/reader/full/panama-profile 23/24
Sanitation facility access - Urban Improved
(% of population)76.9 137 NA
Sanitation facility access - Urban
UnImproved (% of population)
23.1 65 NA
School life expectancy - female (years) 14 76 2010
School life expectancy - male (years) 13 86 2010
School life expectancy - total (years) 13 91 2010
Sex ratio - 65 years and over(male(s)/female)
0.86 63 2013 est
Sex ratio - at birth (male(s)/female) 1.05 109 2013 est
Sex ratio - total population (male(s)/female) 1.02 50 2013 est
Suffrage 18.00 100 NA
Total fertility rate (children born/woman) 2.40 86 2013 est.
Unemployment, youth ages 15-24 - female
(%)
10 107 2012
Unemployment, youth ages 15-24 -
male(%)9 113 2012
Unemployment, youth ages 15-24 - total(%)
15 88 2012
Urbanization - rate of urbanization (%) 2.3 80 2010

8/11/2019 panama profile
http://slidepdf.com/reader/full/panama-profile 24/24
Urbanization - urban population (%) 75 61 2010-15 est.
Transportation
Airports 117 49 2013
Airports - with paved runways - total 57 43 2013
Airports - with unpaved runways - total 60 55 2013
Heliports 3.00 45 2013
Merchant marine (ships) 6,413 1 2010
Pipelines (km) 128 115 2013
Railways (km) 76 127 2008
Roadways (km) 15,137 122 2010
Waterways (km)
800 73 2011