PAN-AMPK activator O304 improves glucose homeostasis and ... · from cba mice on high fat diet...
31
Supplemental data PAN-AMPK activator O304 improves glucose homeostasis and microvascular perfusion in mice and type2 diabetes patients Authors: Pär Steneberg, Emma Lindahl, Ulf Dahl, Emmelie Lidh, Jurate Straseviciene, Fredrik Backlund, Elisabet Kjellkvist, Eva Berggren, Ingela Lundberg, Ingela Bergqvist, Madelene Ericsson, Björn Eriksson, Kajsa Linde, Jacob Westman, Thomas Edlund, and Helena Edlund * * Corresponding author. E-mail: [email protected] 1. Supplemental figures 2. Supplemental tables 3. Supplemental Methods 4. Supplemental References
Transcript of PAN-AMPK activator O304 improves glucose homeostasis and ... · from cba mice on high fat diet...

Supplemental data
PAN-AMPK activator O304 improves glucose homeostasis and microvascular perfusion in mice and type2 diabetes
patients
Authors: Pär Steneberg, Emma Lindahl, Ulf Dahl, Emmelie Lidh, Jurate Straseviciene,
Fredrik Backlund, Elisabet Kjellkvist, Eva Berggren, Ingela Lundberg, Ingela Bergqvist,
Madelene Ericsson, Björn Eriksson, Kajsa Linde, Jacob Westman, Thomas Edlund, and
Helena Edlund*
* Corresponding author. E-mail: [email protected]
1. Supplemental figures
2. Supplemental tables
3. Supplemental Methods
4. Supplemental References

1
Supplemental figure 1. Chemical structure of O304.
Figure S1. Chemical structure of O304.

2
Supplemental figure 2. O304 does not inhibit PP2C activity or allosterically activate
AMPK and enhances AMPK activity in a variety of primary human cells. (A) PP2C
phosphatase activity in presence of indicated concentrations of O304 (n=3). (B and C)
Representative immunoblot analysis and quantification of O304 dose dependent increase of p-
T172 AMPK phosphorylation of 111 (B) and 211 (C) trimers, respectively, in presence
and absence of 150µM ADP as indicated (n=as indicated in figure) (D) SAMS peptide assay
under conditions as indicated (n=4). (E) Immunoblot analysis of O304 dose-dependent increase
of p-T172 AMPK and p-S79 ACC phosphorylation in human skeletal myotubes (n=1), human
hepatocytes (n=1), primary human preadipocytes (n=2) and human umbilical vein endothelial
cells (n=1). (F) Representative immunoblot analysis of p-T172 AMPK and p-S79 ACC
phosphorylation in HeLa cells treated with O304 or ionomycin (n=1 for each condition) as
indicated. Data are presented as mean±SEM, *p<0.05, **p<0.01, ***p<0.001, (two-tailed
Student t test).

3
Supplemental figure 3. O304 is orally available but does not cross the blood-brain barrier.
(A) Plasma levels of O304 following oral gavage of 40 mg/kg O304 in B6 mice (pooled plasma
from 3 independent mice) and NTac:SD rats (pooled plasma from 4 independent rats). (B) O304
concentrations in rat serum, liver, and brain following oral gavage (n=1).
4
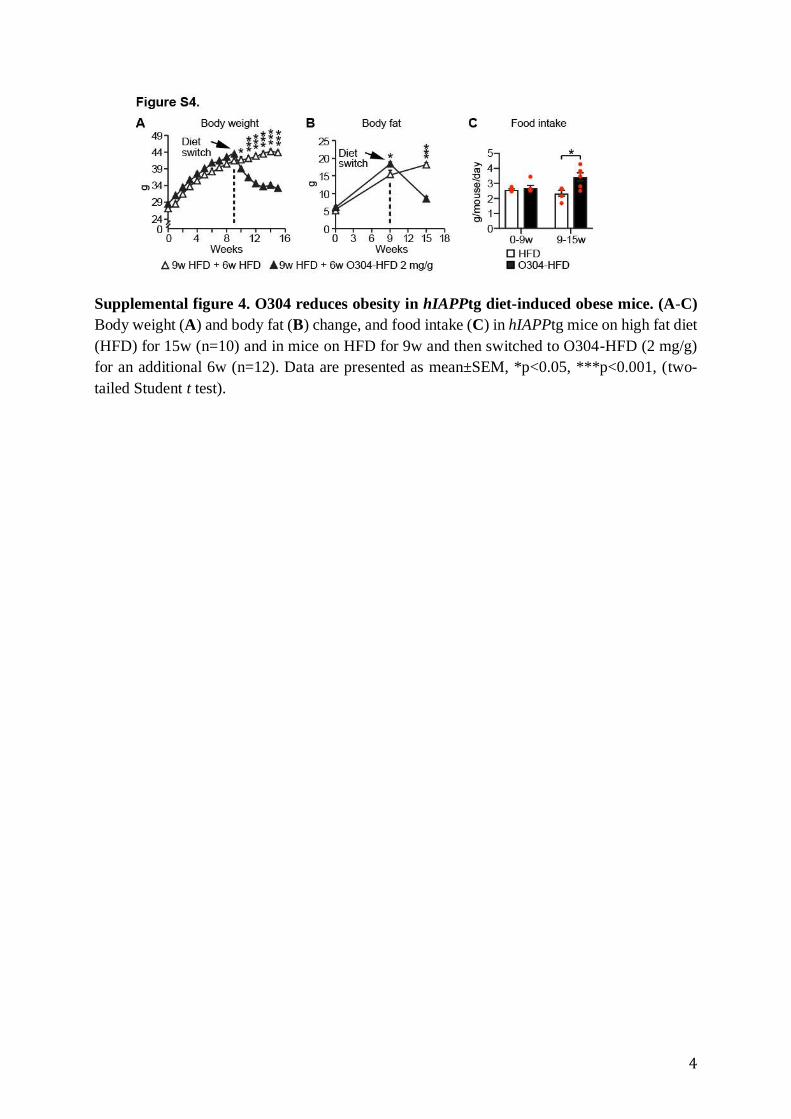
Supplemental figure 4. O304 reduces obesity in hIAPPtg diet-induced obese mice. (A-C)
Body weight (A) and body fat (B) change, and food intake (C) in hIAPPtg mice on high fat diet
(HFD) for 15w (n=10) and in mice on HFD for 9w and then switched to O304-HFD (2 mg/g)
for an additional 6w (n=12). Data are presented as mean±SEM, *p<0.05, ***p<0.001, (two-
tailed Student t test).

5
Supplemental figure 5. O304 enhances autophagic flux in INS-1 cells and attenuates high
glucose induced unfolded protein response (UPR) gene expression in ex vivo cultured
primary mouse islets. (A) Representative immunoblot analysis and quantification of LC3II
levels, in the absence or presence of Bafilomycin A1 (BafA1), in untreated (control) and O304
(5 M) treated INS-1 cells (n=3 per condition). (B) qRT-PCR mRNA levels of the indicated
UPR genes in isolated primary mouse islets ex vivo cultured in 11 mM glucose, 22 mM glucose,
and 22 mM glucose + 5 µM O304 (n=4 for each condition) for 96 hrs. Data are presented as
mean±SEM, *p<0.05, **p<0.01, ***p<0.001, (two-tailed Student t test).
6
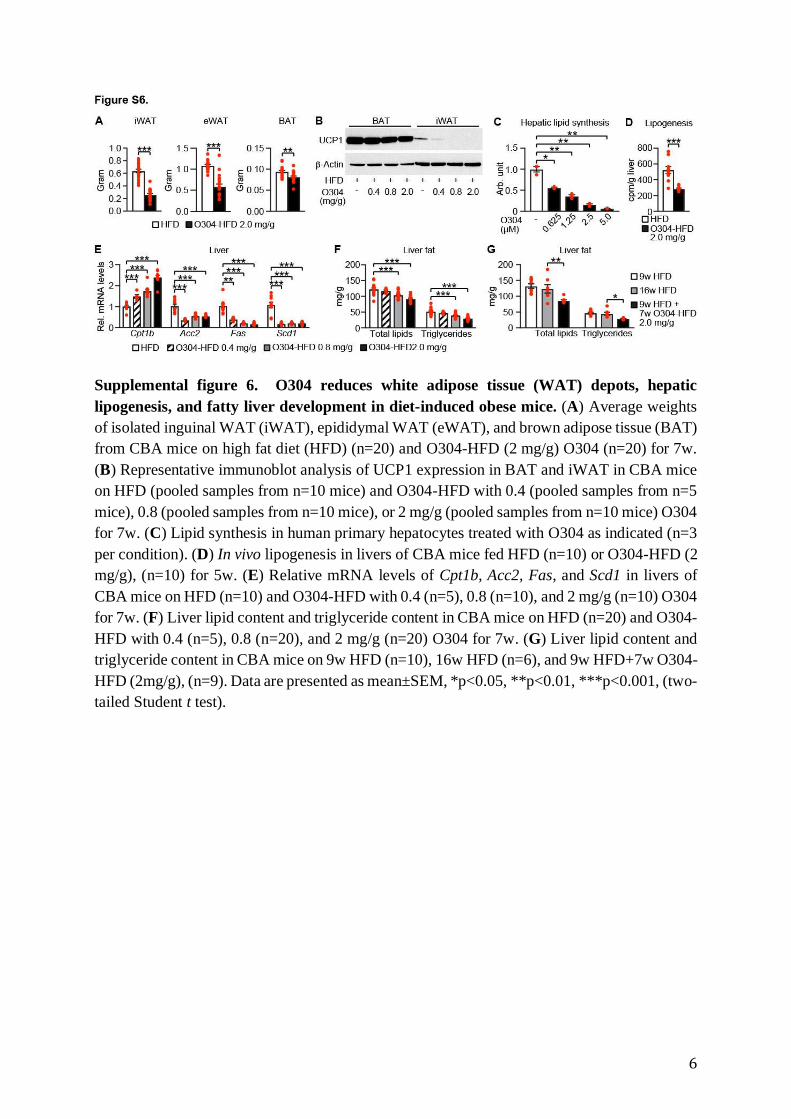
Supplemental figure 6. O304 reduces white adipose tissue (WAT) depots, hepatic
lipogenesis, and fatty liver development in diet-induced obese mice. (A) Average weights
of isolated inguinal WAT (iWAT), epididymal WAT (eWAT), and brown adipose tissue (BAT)
from CBA mice on high fat diet (HFD) (n=20) and O304-HFD (2 mg/g) O304 (n=20) for 7w.
(B) Representative immunoblot analysis of UCP1 expression in BAT and iWAT in CBA mice
on HFD (pooled samples from n=10 mice) and O304-HFD with 0.4 (pooled samples from n=5
mice), 0.8 (pooled samples from n=10 mice), or 2 mg/g (pooled samples from n=10 mice) O304
for 7w. (C) Lipid synthesis in human primary hepatocytes treated with O304 as indicated (n=3
per condition). (D) In vivo lipogenesis in livers of CBA mice fed HFD (n=10) or O304-HFD (2
mg/g), (n=10) for 5w. (E) Relative mRNA levels of Cpt1b, Acc2, Fas, and Scd1 in livers of
CBA mice on HFD (n=10) and O304-HFD with 0.4 (n=5), 0.8 (n=10), and 2 mg/g (n=10) O304
for 7w. (F) Liver lipid content and triglyceride content in CBA mice on HFD (n=20) and O304-
HFD with 0.4 (n=5), 0.8 (n=20), and 2 mg/g (n=20) O304 for 7w. (G) Liver lipid content and
triglyceride content in CBA mice on 9w HFD (n=10), 16w HFD (n=6), and 9w HFD+7w O304-
HFD (2mg/g), (n=9). Data are presented as mean±SEM, *p<0.05, **p<0.01, ***p<0.001, (two-
tailed Student t test).
7
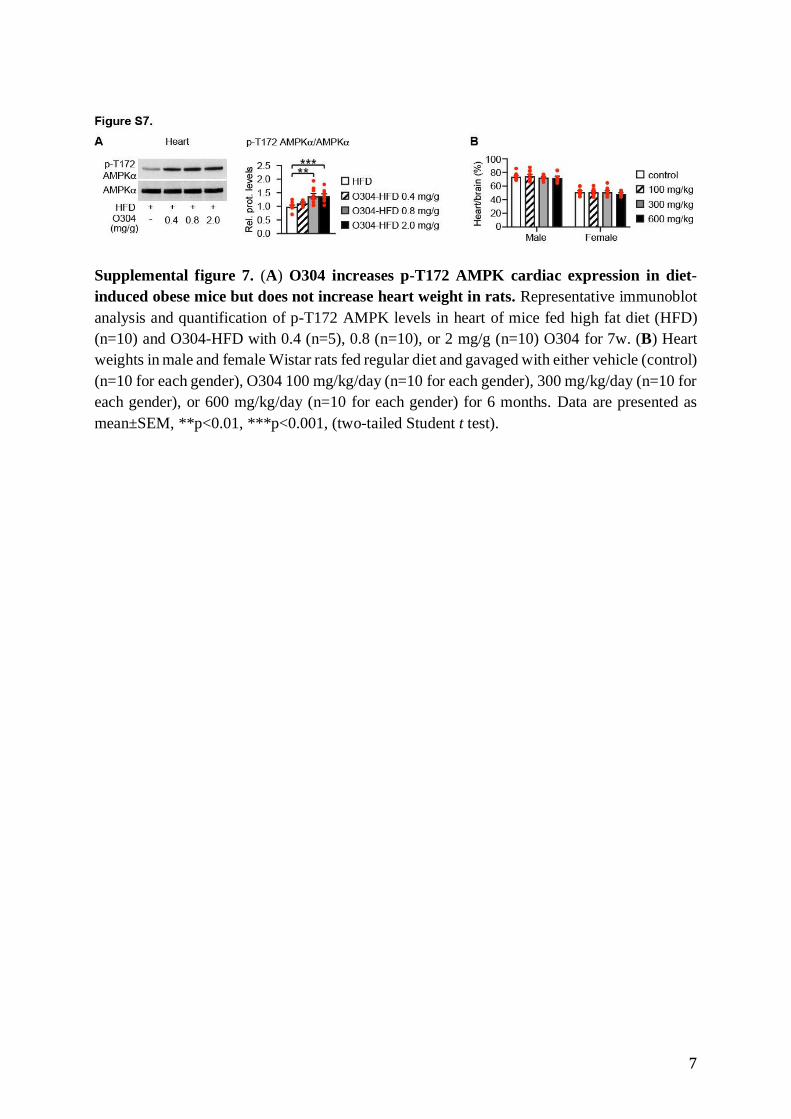
Supplemental figure 7. (A) O304 increases p-T172 AMPK cardiac expression in diet-
induced obese mice but does not increase heart weight in rats. Representative immunoblot
analysis and quantification of p-T172 AMPK levels in heart of mice fed high fat diet (HFD)
(n=10) and O304-HFD with 0.4 (n=5), 0.8 (n=10), or 2 mg/g (n=10) O304 for 7w. (B) Heart
weights in male and female Wistar rats fed regular diet and gavaged with either vehicle (control)
(n=10 for each gender), O304 100 mg/kg/day (n=10 for each gender), 300 mg/kg/day (n=10 for
each gender), or 600 mg/kg/day (n=10 for each gender) for 6 months. Data are presented as
mean±SEM, **p<0.01, ***p<0.001, (two-tailed Student t test).
8
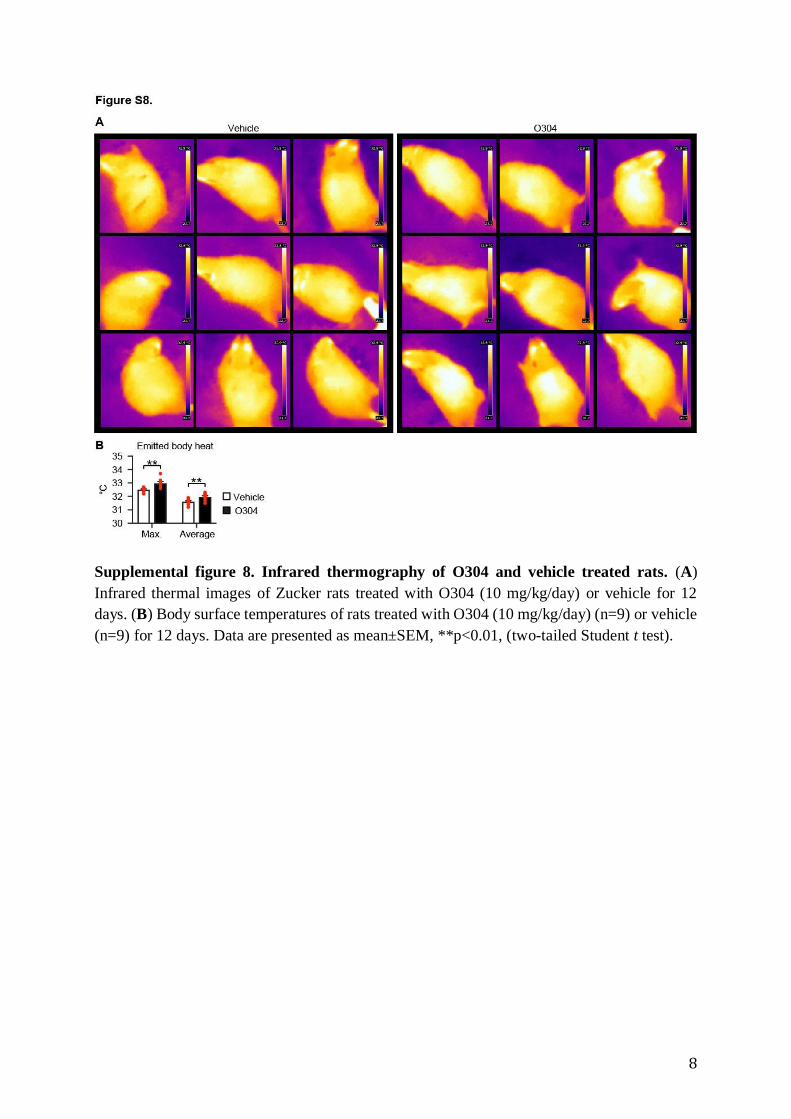
Supplemental figure 8. Infrared thermography of O304 and vehicle treated rats. (A)
Infrared thermal images of Zucker rats treated with O304 (10 mg/kg/day) or vehicle for 12
days. (B) Body surface temperatures of rats treated with O304 (10 mg/kg/day) (n=9) or vehicle
(n=9) for 12 days. Data are presented as mean±SEM, **p<0.01, (two-tailed Student t test).

9
Supplemental figure 9. Fasting plasma glucose (FPG) and O304 plasma levels in type 2
diabetes (T2D) patients of the Phase IIa TELLUS study. (A) Individual FPG levels in T2D
patients at day 1 and 28. (B) Plasma concentrations of O304 in T2D patients during the 28d
study. Error bars in (B) indicate standard deviation (SD).

10
Supplemental Table 1. Cell lines and islets Cell line/islets Growth conditions O304 activation condition
Human Preadipocytes (Cell
Applications, Inc. #802h-05a)
Preadipocyte growth medium (Cell
Applications, Inc. #811-500)
Cells were treated (in the presence of
0.1% DMSO) with 2.5, 5 or 10 µM
O304 in serum free DMEM (Gibco
#21885) for 4.5 hours
Human skeletal muscle cells (Cell
Applications, Inc. #150-05a)
Growth Medium (Cell Applications,
Inc. #151-500)
Cells were treated (in the presence of
0.1% DMSO) with 2.5, 5 or 10 µM
O304 in serum free DMEM (Gibco
#21885) for 4 hours
Wi-38 human lung fibroblast cells
(LGC Promochem-ATCC #CCL-
75)
DMEM (Gibco #21885), glucose 1g/L,
10% FBS (Gibco #10500-064), 1mM
MEM NEAA (Gibco #11140-035),
25µg/ml gentamicin (Gibco #15750)
Cells were treated (in the presence of
0.1% DMSO) with 2.5, 5 or 10 µM
O304 in serum free DMEM (Gibco
#21885) for 16 hours to analyze AMPK
activation and 16 hours to analyze ATP
content.
Human hepatocytes (Gibco
#HMCPMS)
Resuspended and plated in Williams’
medium E (Gibco #A1217601)
supplemented with hepatocyte plating
supplement pack (Gibco #CM3000).
Cells were treated (in the presence of
0.1% DMSO) with 2.5, 5 or 10 µM
O304 in serum free Williams´ medium
E (Gibco #A1217601) for 2 hours (for
western) or with 0.625, 1.25, 2.5 or 5
µM O304 in serum free Williams´
medium E (Gibco #A1217601) for 2+4
hours ([1,2-14C] acetate incorporation)
Human umbilical vein endothelial
cells (Lonza #CC-2519)
EBM (Lonza #CC-3121) supplemented
with EGM singleQuot kit Suppl. and
growth factor (Lonza #CC-4133)
Cells were treated (in the presence of
0.1% DMSO) with 2.5, 5 or 10 µM
O304 in serum free EBM for 16 hours
Insulinoma 1 (INS-1E) (AddexBio
#C0018009) RPMI medium 1640 (GIBCO #21875-
034), 11.1 mM glucose (GIBCO
#A24940-01), 10% fetal bovine serum
(GIBCO #10500),
1mM sodium pyruvate (GIBCO
#11360-039), 10mM Hepes (Umeå
University, Laboratory medicine), 0.1%
2-Mercaptoethanol (Sigma #M3148),
50U;µg/ml Pen;Strep (Gibco #15140-
122),
Cells were treated (in the presence of
0.1% DMSO) with 2.5, 5.0 and 10 µM
O304 in RPMI medium (GIBCO
#11879), 11.1 mM glucose (GIBCO
#A24940-01), 1x MEM NEAA (Gibco
#11140-050), 10mM Hepes (Umeå
University, Laboratory medicine),
1mM sodium pyruvate (GIBCO
#11360-039), 0.1% 2-Mercaptoethanol
(Sigma #M3148), 50U;µg/ml Pen;Strep
(Gibco #15140-122), 1x N-2 (GIBCO
#17502-048) for 2 hours
HeLa cells (kind gift from Prof.
Erik Lundgren, CMB, Umeå
University)
DMEM (Gibco #21885), glucose 1g/L,
10% FBS (Gibco #10500-064), 1mM
MEM NEAA (Gibco #11140-035),
25µg/ml gentamicin (Gibco #15750)
Cells were treated (in the presence of
0.1% DMSO) with 2.5, 5 or 10 µM
O304 in serum free DMEM (Gibco
#21885) for 4 hours. 1µM Ionomycin
were added the last 20 minutes to
control cells as it activates AMPK.
Mouse islets RPMI medium (GIBCO #11879), 1%
fetal bovine serum (GIBCO
#10500),11.1 mM glucose (GIBCO
#A24940-01), 10mM Hepes (Umeå
University, Laboratory medicine), 1mM
sodium pyruvate (GIBCO #11360-039),
0.1% 2-Mercaptoethanol (Sigma
#M3148), 50U;µg/ml Pen;Strep (Gibco
#15140-122)
Islets were treated (in the presence of
0.1% DMSO) with 2.5, 5.0 and 10 µM
O304 in serum free RPMI medium
supplemented as described for growth
conditions for 2 hours
Human islets CMRL medium 1066 (GIBCO #21530-
027), 10% fetal bovine serum (GIBCO
#10500), 20U;µg/ml Pen;Strep (Gibco
#15140-122) and 1X GlutaMax (Gibco
#35050-038)
Islets were treated (in the presence of
0.1% DMSO) with 1.0, 2.5, 5.0 and 10
µM O304 in CMRL medium 1066,
serum free, supplemented as described
for growth conditions for 4 hours
Rat L6 skeletal muscle cells (Cat
No. CRL-1458, LGC Promochem-
ATCC)
Dulbecco’s Modified Eagle Medium
(Gibco #31966)
N/A

11
Supplemental Table 2. Antibodies
Supplemental Table 3. Primers
Experiment Target Forward primer Reverse Primer
qRT-PCR Fas TCCTGGAACGAGAACACGATCT GAGACGTGTCACTCCTGGACT
Scd-1 AGTGAGGCGAGCAACTGACTA GGTGGTGGTGGTCGTGTAAGA
Acc2 CCCAGGAGGCTGCATTGAAC ACGCGACGGTGAAATCTCTG
Cpt1b AGATCAAGCCGGTCATGGCA TTGCCTGGGATGCGTGTAGT
Glut1 ATCCCAGCAGCAAGAAGG CCAGTGTTATAGCCGAACTG
TXNIP ATCTTTATGTACGCCCCTGA GGATCCACCTCAGTGTAAGT
Atf4 GGAATGGCCGGCTATGG TCCCGGAAAAGGCATCCT
Bip TTCAGCCAATTATCAGCAAACTCT TTTTCTGATGTATCCTCTTCACCAGT
Pdia4 TGACCCGGCCTACTTGCA GTGTGGTGAAACTTGTAATCTTCTCTCA
Edem2 ACTTGGGAGAGACGCTGTGG GGAGGTCCTTGATCGTGGCA
Herpud1 CATGTACCTGCACCACGTCG GAGGACCACCATCATCCGG
Dnajc3 GACAGCTAGCCGACGCCTTA GTCACCATCAACTGCAGCGT
Tbp GAATTGTACCGCAGCTTCAAAA AGTGCAATGGTCTTTAGGTCAAGTT
Ywhas CTGCGTGACATCTGCAACGA GGTTGCGAAGCATTGGGGAT
Atgl TCACCATCCGCTTGTTGGA TGCTACCCGTCTGCTCTTTCA
Cd36 TCATATTGTGCTTGCAAATCCAA GCTTTACCAAAGATGTAGCCAGTGT
Acc1 AGCCAGACATGCTGGATCTCAT TGGGGATCTCTGGCTTACAGG
Ppargc1 CCGTAAATCTGCGGGATGATG CAGTTTCGTTCGACCTGCGTAA
Cox8b GTTCACAGTGGTTCCCAAAG AACGACTATGGCTGAGATCC
Antigen Species Supplier Dilution-Condition
Primary
anribodies
p-AMPKα (Thr-172) Rabbit Cell Signaling (cat.nr. 2535) 1/500-3000 (depending on
cell line/tissue), TBST +
5% BSA
panAMPKα Rabbit Cell Signaling (cat.nr. 2532) 1/2000-20 000 (depending
on cell line/tissue), TBST
+ 5% BSA
GAPDH Rabbit Cell Signaling (cat.nr. 2118) 1/50 000, TBST + 5%
BSA
p-ACC (Ser-79) Rabbit Cell Signaling (cat.nr. 3661) 1/500-3,000 (depending on
cell line/tissue), TBST +
5% BSA
ACC Rabbit Cell Signaling (cat.nr. 3662) 1/500-2 000 (depending on
cell line/tissue), TBST +
5% BSA
ATGL Rabbit Cell Signaling (cat.nr. 109251) 1/70 000, TBST + 5%
BSA
p-S406 ATGL Rabbit Cell Signaling (cat.nr. 135093) 1/2000, TBST + 5% BSA
UCP-1 Rabbit Abcam (cat. Nr.23841) 1:100 000, TBST + 5
%BSA
LC3B Rabbit Cell signaling (cat. nr. 2775) 1:500, TBST + 5% BSA
β-Actin Rabbit Cell Signaling (cat.nr. 4967) 1/1000-5000 (depending
on tissue), TBST + 5%
BSA
secondary
antibodies
peroxidase-conjugated
Affini-pure Goat Anti-
Rabbit IgG (H+L)
Jackson Laboratories, INC.
(cat.nr. 111-035-003)
1/10 000, TBST + 5%
non-fat dried milk

12
Supplemental Experimental Procedures
Study design
For animal experiments, no sample-size estimate was calculated before the study was executed.
The experiments were not randomized unless otherwise stated. Investigators were not blinded
to allocation during experiments and outcome assessment except during some measurements
and quantifications (glucose tolerance test, glucose stimulated insulin secretion, arginine
stimulation of insulin secretion, amyloid quantification, echocardiography, and ultrasound
examination of the heart). For in vivo data, each n value corresponds to a single mouse. For
amyloid quantification each n value corresponds to independent experiments and total number
of islets investigated, respectively. For in vitro data, each n value corresponds to an independent
experiment. If technical replicates were performed, then their mean was considered as n = 1
O304
O304 is a small heterocyclic compound developed by Betagenon AB. O304 was developed
through rationale design from an early hit molecule identified in a cellular screen and belongs
to the 4th generation of AMPK activators scaffolds developed by Betagenon AB (1). O304 used
in the study was synthesised and purified by Anthem Bioscience Pvt. Ltd. (Bangalore, India)
for Baltic Bio AB (Umeå, Sweden) and Betagenon AB (Umeå, Sweden). For cell culture assays
O304 were dissolved in DMSO Hybri-MaxTM (Sigma, #D2650). For in vivo assays O304 were
dissolved in 2% w/v methylcellulose, 4 mM phosphate buffer pH 7.4. Metformin (Sigma
#D150959) was dissolved in in 2% w/v methylcellulose, 4 mM phosphate buffer pH 7.4.
Pharmacokinetics of O304 in C57BL/6JBomTac mice and NTac:SD rats was determined via
UHPLC-ESI Triple Quad MSMS in plasma from non-fasted animals. O304 (40 mg/kg O304)

13
was administered via oral gavage and 4-, 8-, 12- and 24-hours after administration blood was
collected. O304 levels were determined in liver and brain from non-fasted Crl:CD(SD) rats
administered O304 (40 mg/kg O304), once daily for 3 weeks, via oral gavage. O304 was
extracted in acetonitrile and levels determined using UHPLC-ESI Triple Quad MSMS.
No severe adverse effects (SAEs) occurred in a clinical phase I single ascending dose (SAD)
and multiple ascending dose (MAD) study at 100 to 2400 mg daily doses of O304, nor in the
TELLUS study. During single and multiple dose escalation, increased frequency or intensity of
events by dose or by treatment (O304/placebo) were not observed. Most of the AEs reported
after start of study treatment were of mild intensity in the phase I and TELLUS studies. No
clinically significant abnormal physical examination findings were reported at any of the time-
points assessed in the SAD or the MAD part of the phase I study, nor in the TELLUS study.
There were no remarkable mean changes over time or individual clinically significant abnormal
values with regard to any of the vital signs or ECG parameters or for any of the safety laboratory
parameters analysed in the phase I and TELLUS studies. No individual abnormal laboratory
values were assessed as clinically significant in either study.
Animals
Female Crl:CD(SD) rats (Strain #001), male and female Wistar rats (Strain #003), and Zucker
Crl:ZUC-Leprfa rats (Strain #185) were obtained from Charles River Lab. Female NTac:SD
rats were obtained from Taconic. Male C57BL/6J (B6) mice were obtained from JAX mice
(Jax #000664). Male C57BL/6JBomTac mice were obtained from Taconic (B6JBom). Male
B6CBAF1/J (F1) mice were obtained from JAX mice (Jax #10011). CBA/CaCrl (CBA) mice
were obtained from Charles River Lab (Charles River CBA/CaCrl). hIAPPtg mice were
obtained from JAX mice (Jax #008232) and maintained by brother sister mating as well as by

14
back-cross to CBA for more than 10 generations. Wild type littermates were used as controls
for hIAPPtg mice.
14-15 weeks old male B6 were, based on starting weight, assigned into vehicle, Metformin,
O304, and Metformin+O304 treatment groups (100 mg/kg, orally once a day), 10
animals/group, and fed HFD throughout the 8 weeks experimental period.
7 weeks old male B6 were fed HFD for 7 weeks after which they, based on weight, were
assigned into O304, and Metformin+O304 treatment groups (100 mg/kg, orally once a day),
and fed HFD for an additional 4 weeks.
12 weeks old CBA mice were randomized into a HFD and three O304-HFD groups (0.4 mg/g,
0.8 mg/g, and 2 mg/g) for 7 weeks. 16-17 weeks old CBA mice on regular diet was used as
controls where indicated.
14 weeks old CBA mice were randomized into HFD and O304-HFD (2 mg/g) groups for 2
weeks while housed at 22°C. The two groups were then switched from HFD to O304-HFD and
vice versa for an additional 4.5 weeks before transferred from 22°C to 30°C (thermoneutrality).
After one week at 30°C the diet was switched again and one week after the switch core body
temperature were determined.
10-11 weeks old male hIAPPtg mice were randomized into vehicle and O304 treatment groups
(100 mg/kg, orally once a day) and fed HFD throughout the 6 weeks experimental period.

15
10-11 weeks old male hIAPPtg;CBA mice and wild type littermates were fed HFD for 9 weeks.
After 9 weeks mice were either sacrificed or randomized into two groups either continuing on
HFD or switched to O304-HFD (2 mg/g) for an additional 7 weeks.
8-10 weeks old Wistar male and female rats were treated by oral gavage with vehicle or O304
at 100, 300 or 600 mg/kg/day for 6 months.
Animals were housed at 12:12 hour light/dark cycle in a temperature/humidity controlled
(22°C/50%humidity) room and ad libitum feeding with either standard chow (Special Diet
Service #801730), high fat diet (HFD) (Research diets, Inc. #D12492) or HFD (Research diets,
Inc. #D12492) custom formulated with O304 at 2mg/g O304, 0.8mg/g O304 and 0.4mg/g
O304, respectively.
Cardiovascular Safety Pharmacology Study Using Radiotelemetry in Conscious
Beagle Dogs Following a Single Oral Gavage
Telemetry analyses was performed by CiToxLAB North America (Laval, Quebec, Canada) in
adult male beagle dogs, selected from CiToxLAB North America Dog Telemetry Colony,
which had previously undergone surgery for telemetry transmitter implantation to monitor the
arterial blood pressure, electrocardiogram, body temperature and locomotor activity (Data
Science International, Model D70-PCT). All surgical procedures were performed in accordance
with relevant Standard Operating Procedures. A telemetry transmitter was placed between the
internal abdominal oblique muscle and the aponeurosis of the transverses abdominis of each
animal. The pressure catheter was inserted into the femoral artery and the biopotential leads
subcutaneously in a Lead II configuration. O304 was gavaged as a suspension at 60,180, or 540
mg/kg.
16
Food control, Body weight and Composition
Food intake was measured weekly by giving each cage 200 g pellet. After one week, the amount
of pellets consumed were calculated and adjusted according to the number of animals/cage.
Body weight was measured weekly. Body composition was assessed using EchoMRI.
Echocardiography
Left ventricle structure and function were analyzed with transthoracic, high-frequency
echocardiography using the MS550D transducer. The examination was performed during light
isoflurane anesthesia (1.5-2.0 % in 800 mL oxygen). Anesthesia level was adjusted to keep the
respiration rate at 80-110 breaths per minute. Left ventricular volumes were determined in B-
mode using a Simpson’s rule reconstruction. All images were analyzed off-line in a blinded
way using the Vevo LAB software 1.7.0. Stroke volume, cardiac output and heart rate were
analyzed, as well as wall thicknesses and left ventricle diameter. Three measurements/animal
was performed for mean values.
Laser Doppler Imaging
9 weeks old F1 mice were fed HFD for 8 weeks and treated with either vehicle or O304 (40
mg/kg, orally once a day). Veet hair removal cream was used to remove hair from the left hind
limb one day prior to blood perfusion analysis. Mice were anaesthetized using isoflurane and
placed on a heating pad. Blood perfusion was scanned using a PeriScan PIM II Images and
LDPIwin software (version 2.6.1) was used to analyze the images.
Treadmill

17
For treadmill test 14 months old C57BL/6J mice with comparable running distance to
exhaustion were assigned to two groups (14 animals/group) prior to treatment with either
vehicle or O304 (20 mg/kg, orally once a day) for 30 days. One week prior to the test mice went
through a familiarization session of 5 minutes on the treadmill. Running protocol as follows:
15 minutes at 18.8 m/minute, 5 minutes at 24.4 m/minute and 27.1 m/minute until exhaustion.
At exhaustion, blood lactate levels were measured using a lactate test meter (Arkray).
Indirect Calorimetry Measurements
21 weeks old CBA mice that had been on HFD or HFD formulated with 0.8mg/g for 11w were
individually housed in the chamber with a 12-h light/12-h dark cycle in ambient temperature of
22°C and allowed a minimum of 12 hours to acclimate to the chamber before data collection.
VO2 and VCO2 rates were measured during 3 days by indirect calorimetry in TSE PhenoMaster
Calorimetry metabolic cages (TSE Systems GmbH). The respiratory exchange ratio (RER) was
calculated as a ratio of VCO2 produced/VO2 consumed. An RER of 0.7 indicates that fat is the
predominant fuel source, while an RER closer to 1.0 indicates that carbohydrate is the primary
fuel. Energy expenditure (EE) was calculated as the product of the calorific value (CV) of
oxygen [=3.815 + (1.232 x RER)] and the volume of O2 consumed, i.e. [EE = CV x VO2
(kcal/h)] and related to lean weight.
Infrared thermal imaging
Skin temperature of non-sedated Zucker rats that had been treated with O304 (10 mg/kg/day)
or vehicle for 12 days was recorded with an infrared camera (FLIR ix series Extech IRC30,
FLIR systems Inc.) and analysed with a specific software package (FLIR QuickReport version
1.2 SP2 (1.0.1.217). 9 rats per group was used and mean and maximum skin surface
temperatures were measured for each animal 2 hours after final dose administration.
18
Glucose and Serum Related Measurements
Oral and intraperitoneal glucose tolerance tests combined with glucose stimulated insulin
secretion were performed on 6 hours fasted non-sedated mice following i.p. injection of glucose
(SIGMA #G7021) (0.75 g/kg body weight). Arginine-stimulated insulin secretion was
determined following i.p. injection of arginine (SIGMA #A5131) (1g/kg body weight) in non-
fasted 21 weeks old CBA mice that had been on HFD or O304-HFD (0.8 mg/g) for 11w. Blood
glucose was measured using Glucometer (Ultra 2, One Touch) and plasma insulin analysed via
the ultrasensitive mouse insulin ELISA kit (Chrystal Chem Inc. #90080). Area under the Curve
(AUC) was calculated according to the trapezoid rule. The homeostasis model for insulin
resistance (HOMA-IR) was calculated via: fasting blood glucose (mmol/L) × fasting plasma
insulin (μU/L) / 22.5. MATSUDA index was calculated via: [10000 / sqrt (insulin (0 min) +
glucose (0 min) + insulin mean (0-60 min) + glucose mean (0-60 min)]. Statistical significance
was calculated via Student t-test (two-tailed).
Autophagic Flux Assay
INS-1E cells were incubated for 24 h with or without 5 M O304 in the presence or absence of
100 nM Bafilomycin A1 (InvivoGen #tlrl-baf1) during the last 60 min of incubation. Levels of
LC3II were determined by Western blot analysis and quantified. Primary and secondary
antibodies used are listed in (Supplemental Table 2).
Amyloid Analyses and Ex Vivo Islet Amyloid Assay
Islets amyloid was quantification was done on pancreatic tissues isolated from hIAPPtg mice
on HFD for 16 weeks (n=7 mice/n=69 islets) and hIAPPtg mice on HFD for 9 weeks then
switched to O304-HFD (2 mg/g) for 7 weeks (n=5 mice/n=48 islets). Isolated pancreases was

19
direct frozen, sectioned, and amyloid content quantified by staining with Thioflavin-S as
previously described (3). For ex vivo analyses, islets were isolated by collagenase digestion of
the pancreas (2) and cultured in RPMI medium 1640 (GIBCO #11879-0) supplemented with
11.1 or 22.2 mM glucose (GIBCO #A24940-01), 1% fetal bovine serum (GIBCO #10500),
50U;µg/ml Pen/Strep (Gibco #15140-122), 10 mM Hepes (Umeå University, Laboratory
medicine), 1 mM sodium pyruvate (GIBCO #11360-039) and 0.1% 2-Mercaptoethanol (Sigma
#M3148). 0, 2.5, 5.0, and 10 µM O304 were added from day 0 of culture. For assessing the
effect of autophagy inhibition, 3-Methyladenine (3-MA, Aldrich #M9281), 5 µM, was added
from day 0 of culture in combination with O304, 5 µM. The control contained DMSO 1:2000.
Medium and compounds were changed every second day. After 92 hours of treatment islets
were embedded, sectioned and amyloid content quantified by staining with Thioflavin-S as
previously described (3). A minimum of 3 independent experiments was evaluated.
Determination of Cellular ATP Content
Wi-38 human lung fibroblast cells were stimulated with O304 for 16 hours. Thereafter ATP
content were determined with the ATP bioluminescence assay kit HS II (Roche Applied
Science #11699709001) according to manufacturer’s recommendations. The ATP data were
normalized to cellular protein determined using BCA protein assay kit (Pierce #23225).
Western Blot Analysis
All cell lines were lysed in 0.1 M Tris-HCl, pH 6.8, 2% SDS, 10 mM sodium fluoride (SIGMA
#S7920), 10 mM β-glycerophosphate (SIGMA #G6376), and 1 mM sodium vanadate (SIGMA
#72060) and supernatant collected after 1 minute at 14,000 rpm. Islets (human and mouse) were
lysed in 0.1 M Tris-HCl, pH 6.8, 2% SDS, protease inhibitor (Roche #04 693 124 001) and
phosphatase inhibitor (Roche #04 906 837 001). Right calf muscle, heart, iWAT, and

20
interscapular BAT was crushed in a pestle using liquid nitrogen and homogenized in ice cold
RIPA buffer (150 mM sodium chloride (SIGMA #S7653), 1.0% NP40 (USB), 0.5% sodium
deoxycholate (SIGMA #D6750), 0.1% SDS, 50 mM Tris pH 8.0, 20 mM sodium
pyrophosphate (SIGMA #71515), 10 mM sodium fluoride, 10 mM -glycerolphosphate, 1 mM
sodium vanadate and protease inhibitor cocktail (Roche #04693124001),1 tablet/10 ml lysis
buffer). The supernatant was collected after 2 min at 14,000 rpm. This procedure was repeated
until all fat was eliminated and the supernatant was clear, at 4°C. Samples were analyzed on 4-
15% polyacrylamide gels. Primary and secondary antibodies used are listed in (Supplemental
Table 2). Values were normalized toward AMPKα, β-Actin, GAPDH or the respective non-
phosphorylated counterpart.
qRT-PCR
For RNA purification calf muscle, iWAT, interscapular BAT, and left lateral liver lobe was
crushed in a pestle using liquid nitrogen before turning to respective RNA kit. RNA from liver
was prepared using Total RNA isolation Nucleospin II Kit (Macherey-Nagel #740955.50).
RNA from adipose tissue was prepared using RNeasy Lipid Tissue Mini kit (Qiagen #74804).
RNA from calf muscle tissue was prepared using RNeasy Fibrous Tissue Mini kit (Qiagen
#74704). First strand cDNA synthesis was done using SuperScript III (First-Strand Synthesis
SuperMix for qRT-PCR, Invitrogen #11752-250) according to the manufacturer’s instructions.
Total RNA was prepared from isolated islets using RNeasy Micro Kit (Qiagen #74004) and
first strand cDNA synthesis was done using Superscript III (Invitrogen #18080-051) according
to the manufacturer’s instructions. Quantification of mRNA expression levels was performed
essentially as previously described (4). Primers used for qRT-PCR are listed in Supplemental
Table 3. Tyrosine 3-monooxygenase/tryptophan 5-monoxygenase activation protein, zeta
21
polypeptide (YWHAS) was used to normalize expression levels except for islets where TBP
was used.
Liver Lipid Extraction and Triglyceride Determination
0.2-0.3 g of liver was homogenized in 3 ml PBS before addition of 6 ml chloroform/methanol
(2:1). Samples were mixed until phase separation no longer occurred and left at RT 30 minutes
before centrifuged, 4,500 rpm, 5 minutes. The chloroform phase was transferred into pre-
weighted glassware and kept at 4°C O/N. Any water drops were removed and the chloroform
evaporated by a stream of nitrogen before residual solvent was removed via SpeedVac, 15
minutes. The glassware was re-weighed, and total lipids calculated (mg/g liver). The residue
was dissolved in 35% Triton X-100/methanol. Liver triglycerides were determined with a
Serum Triglyceride Determination Kit (Sigma-Aldrich #TR0100). Analyses were done
according to the manufacturer’s recommendations with a minor modification for triglyceride
determination, which was analyzed at 560 nm instead of 540 nm.
Glycogen Determination
Heart glycogen content was determined using a Glycogen Assay Kit (Abcam #ab65620)
according to the manufacturer’s recommendations.
[1,2-14C] Acetate Incorporation into Total Lipids
Primary human hepatocytes (65,000-130,000 cells/well in 24-well dishes) were treated with
vehicle control, 0.625, 1.25, 2.5 or 5 µM O304 in serum free Williams´ medium E, 2 hours,
before addition of 0.25 µCi [1,2-14C]-acetate/well for an additional 4 hours. See Supplementary
Table 1 for growth conditions. 200 µl 0.5% trypsin was used to detach the cells before addition
of 800µl chloroform/methanol (2:1) and 500 µl 4 mM MgCl2. The samples were vortexed and

22
spun at 14,000 rpm, 2 minutes before discarding the aqueous layer. The procedure was repeated
twice, first with 700 µl chloroform/methanol (2:1) and 500 µl 4 mM MgCl2 and then 400 µl
chloroform/methanol (2:1) and 500 µl 4 mM MgCl2. The organic phase was transferred into a
scintillation vial and evaporated to dryness by a stream of nitrogen. The residue was dissolved
in 3 ml liquid scintillation cocktail (Optiphase HiSafe 3, Perkin Elmer #1200.437) and 14C
determined for 1 minute in a Wallac 1414 beta counter (Perkin Elmer). Before lipid extraction,
10 µl samples were used to determine protein concentration. 14C-values were normalized to
cellular protein concentration.
In vivo Lipogenesis
15 weeks old CBA mice that had been on HFD or O304-HFD (2 mg/g) for 5 weeks were starved
overnight and refed 90 minutes before injection with 1000 µCi 3H-NaOac (Perkin Elmer
#NET003005MC) diluted in 0.9% NaCl. After 90 minutes 0.2-0.3 g liver were isolated and
homogenized in 3 ml PBS before addition of 6 ml chloroform/methanol (2:1). Samples were
mixed until phase separation no longer occurred and left at RT 30 minutes before centrifuged,
4,500 rpm, 5 minutes. The water phase was removed and 3 ml chloroform transferred to a
scintillation vial and evaporated to dryness by a stream of nitrogen while standing in a 40°C
water bath. The residue was dissolved in 3 ml optiphase hisafe 3 (Perkin Elmer #1200.437) and
3H determined for 1 minute in a Wallac 1414 counter. 3H values were normalized to liver
weight.
Glucose Uptake in L6 Myotubes
Rat L6 skeletal muscle cells grown in high-glucose (4.5 g/L) Dulbecco’s Modified Eagle
Medium (Gibco #31966), 10% fetal bovine serum (Gibco #10500-064) and 25 µg/ml
gentamicin (Gibco1#5750) were induced to differentiate, by reducing the serum concentration

23
to 2% for 14 days by which time the majority of myoblast had differentiated to myotubes.
Myotubes were rinsed in serum-free low-glucose (1 g/L) DMEM (Gibco #21885), treated with
vehicle control, 2.5, 5 and 10 µM O304 (serum-free low-glucose DMEM, 0.1% DMSO) for 2
hours, rinsed in serum-free DMEM w/o glucose (Gibco #11966) and thereafter incubated with
the same for 20 minutes before addition of 1 µCi 2-Deoxy-D-glucose (2-DG) (Perkin Elmer
#NET549A250UC) for 10 minutes. The cells were rinsed 3 times in serum-free DMEM w/o
glucose and lysed in 1 ml RIPA buffer (150mM Sodiumchloride, 1% NP40, 0.5%
Sodiumdeoxycholate, 0.1% SDS, 50 mM Tris pH8.0). 300 µl were added to 4 ml liquid
scintillation cocktail (Perkin Elmer #1200-437) before counted, 1 minute, in a Wallac 1414 beta
counter. CPM was converted to arbitrary units by setting vehicle control as 1.
L6 myotubes were transfected with siAMPK1 and 2 (Santa Cruz Biotechnology, Inc #sc-
270142 and #sc-155985) or Silencer Negative Control siRNA (Ambion #AM4635) 6-7 days
after starting differentiation, using lipofectamin RNAiMAX Transfection Reagent (Thermo
Fisher Scientific #13778030) according to manufactorer´s instructions (forward transfection).
The final concentration of siRNA was set at 100nM. The day before transfection the medium
was changed to antibiotic-free medium (high-glucose, 4.5 g/L, Dulbecco’s Modified Eagle
Medium (Gibco #31966) and 2% fetal bovine serum (Gibco #10500-064). The level of
AMPK1 and 2 expression in cells transfected with siAMPK1 and 2 and Silencer Negative
Control siRNA, respectively was quantified by Western blot. Glucose uptake in the absence or
presence of O304 (5 µM) for 4h was assayed 72 hours after transfection as described above.
Glucose uptake induced by O304 was normalized to that of vehicle control in cells transfected
with siAMPK1 and 2 and Silencer Negative Control siRNA, respectively.
In Vivo Glucose Uptake

24
12 weeks old CBA mice that had been on HFD or O304-HFD (2 mg/g) for 2 weeks were starved
for 3 hours and then intravenously injected with 9 ± 1.1 MBq of clinical grade 18F-Fluoro-
Deoxy-Glucose (18F-FDG) (prepared at the Nuclear Medicine department at Norrlands
University Hospital, Umeå) in saline in a total volume of 70-100 μL, during light isoflurane
anaesthesia (1.5-2% in 800 mL/min O2). Mice were allowed to be awake and freely moving
around in their cage after injection. After 180 minutes, mice were sacrificed under deep
isoflurane anaesthesia and blood was removed by retrograde perfusion of PBS via the aorta.
When the liver was pale, tissues were collected and scanned for a 10 minutes static uptake
(nanoScan PET/CT, Mediso, Hungary). The tissues were then scanned ex vivo scanning to
assess uptake in the isolated tissues. Images were reconstructed to a 0.4 x 0.4 mm resolution
with a 3D iterative reconstruction with 4 iterations and 4 subsets (Mediso Tera-Tomo 3D),
covering 98 mm axial distance, employing spike filter, delayed-window random correction,
scatter and CT-based attenuation corrections. Volumes of interest were manually delineated
over each tissue using imlook4d (www.dicom-port.com). Tracer uptake was quantified as
standardized uptake values (SUV), using the formula: SUV = C / (I / m); with C being the
measured tissue activity concentration (Bq/mL), I the injected dose (Bq), and m the body weight
(g). C and I are decay corrected to the same time.
SAMS Peptide AMPK Activity Assay
50 ng AMPK (Upstate #14-305) was mixed in various combination with 2.5, 5 or 10 µM O304
or 20 µM AMP (Sigma #A2002) in buffer (40 mM Hepes pH7.45, 0.5 mM DTT, 2 mM MgCl2,
0.1% DMSO). In all settings 10 µg SAMS and 0.03 µCi/µl 32P ATP (Perkin Elmer
#NEG502Z500UC) were added. Total reaction volume was 25 µl, all components mixed on ice
and the reaction carried out at 37°C, 15 minutes, before terminated with 5 µl phosphoric acid,
and placed back on ice. 25 µl reaction were dried in on Whatman P81 filters, 50°C, 2 minutes,

25
washed 3 times in 250 ml 1% phosphoric acid, 2 minutes, before added to 4 ml liquid
scintillation cocktail (Perkin Elmer #1200-437) and counted, 1 minute, in a Wallac 1414 beta
counter. The radioactivity correlates to enzyme activity.
AMPK Activation Assay
Table 3 contain origin of cell lines, growth conditions and settings for activation of AMPK via
O304. Human skeletal muscle cells were grown in growth medium obtained from the supplier
of the cells until induction of myotube differentiation in DMEM (Gibco #21885) supplemented
with 2% horse serum (Gibco #26050-070) for two days and thereafter treated with O304 as
described in Table 3. Upon arrival, human hepatocytes were thawed for 1 minute at 37°C before
transferred into thawing medium (CHRM, Invitrogen #CM7000). After centrifugation, 10
minutes, 100x g at RT, the cell pellet was resuspended in Williams´ medium E (Gibco
#A1217601) supplemented with hepatocyte plating supplement pack (Gibco #CM3000). The
cells were plated onto gelatin coated 60 mm dishes and then incubated overnight before treated
with O304 as described in Table 3. INS-1E cells were pre-treated with medium for activation
condition (Table 3) for 4 hours before addition of O304. All cell lines were maintained in a
humidified incubator at 37°C, 5% CO2. Table 3 describes growth conditions and settings for
activation of AMPK by O304 in mouse and human islets. After harvest mouse islets were
cultured for two days in growth condition medium at 37°C, 5% CO2 before treatment with O304
for 2 hours. Human islets from non-diabetic and T2D donors were provided through the JDRF
award 31-2008-416 ECIT Islet for Basic Research program in compliance with Swedish law
and the Ethical board for human research in Umea (www.epn.se). Upon arrival, the islets were
transferred to 50 ml falcon tubes and left to settle for 5min before removal of the supernatant
and addition of culture medium (CMRL medium (GIBCO #21530-027), 10% fetal bovine
serum (GIBCO #10500), 20U/ml Pen:Strep (Gibco #15140-122) and 1X GlutaMax (Gibco

26
#35050-038). Islets were washed with culture medium 3 additional times before transferred to
Petri dishes and left to recover overnight in a humidified incubator at 37°C, 5% CO2 before
treatment with O304 for 4 hours
AMPK In Vitro De-Phosphorylation Assay
AMPKα2/β1/γ1 trimer (Life Technologies #PV4674, Lot 1261361B) (1 ng/µl) was incubated
with 10 µM O304, 20 µM O304 or 150 µM ADP (Sigma #A2754) +/- 1 mM ATP (Sigma
#A1852-1VL) in buffer (40 mM Hepes, 0.5 mM DTT, 0.2 mg/ml Gelatin (Sigma #G7041) and
0.4% DMSO), +/- PP2Cα (0.25-0.75 ng/µl) (Abcam ab51205-100; Lot GR54133-5) and 5 mM
MnCl2 (total volume 20 µl). AMPKα2/β1/γ1 +/- ATP was preincubated with O304 and ADP
for 2 minutes at 30°C before addition of PP2C/MnCl2 to start the dephosphorylation reaction
which continued for 10-15 minutes at 30°C. Reactions were terminated by the addition of
0.17% BSA, 13 mM EDTA, 1.3x XT Sample buffer and 0.67% β-Mercaptoethanol in PBS.
Samples were placed on ice, 5 minutes, heated at 100°C for 5 minutes and chilled before run
on a western gel. All steps were performed in high quality low-protein-binding
eppendorf tubes. In a separate experiment 10µM O304, 20 µM O304, 150 µM ADP
alone or the combination of 10 µM O304+150 µM ADP and 20 µM O304+150 µM
ADP was incubated with 1ng/µl of AMPKα2/β1/γ1 or AMPKα1/β1/γ1 (Life Technologies
#PV4672) trimer in buffer (40mM Hepes, 0.5mM DTT, 0.2mg/ml gelatin and 0.4% DMSO)
+/- 0.25-0.5 ng/µl PP2Cα and 5 mM MnCl2 or 5mM MgCl2. AMPK was sequentially
preincubated with O304 and ADP or the combination for 2 minutes at 30°C before sequential
addition of PP2C/MnCl2 or PP2C/MgCl2 to start the dephosphorylation reaction which
continued for 5-15 minutes at 30°C. The reaction was thereafter terminated and analyzed as
above.

27
PP2C Phosphatase Activity Assay
3 ng/µl PP2Cα (Abcam ab51205) and 5, 10 or 20 µM O304 in buffer (50mM Tris-HCL pH 7.5,
0.1 mM EDTA, 0.5mM DTT, 5 mM MgCl2) was used in the Sensolyte FDP protein phosphatase
assay kit (Anaspec #71100) according to the manufactuer’s instructions to measure the activity
of PP2Cα. The fluorescence intensity was measured in a Bio Tek Synergy H4 multi-mode
microplate reader.
Study Design of Phase IIa Clinical Trial
The TELLUS study is an exploratory proof-of-concept randomised, parallel-group, double-
blinded, placebo controlled phase IIa study 28 day study of the first-in-class AMPK activator
O304 (1000 mg/day) in T2D patients on Metformin for ≥ 3 months. TELLUS is listed in the
EudraCT database protocol no. 2016-002183-13. The study was performed in accordance with
ethical principles that have their origin in the Declaration of Helsinki and are consistent with
International Conference of Harmonization (ICH)/Good Clinical Practice (GCP), European
Union (EU) Clinical Trials Directive, and applicable local regulatory requirements. The study
protocol was approved by the Regional Ethics Committee in Uppsala, Sweden, Project no/ID
O304-2016-02. Before performing any study-related procedures an informed consent form was
signed and personally dated by all patients and by the Investigator.
Main inclusion criteria: Male and female patients, 18-80 years of age, with uncomplicated T2D,
on stable T2D treatment with Metformin monotherapy for ≥ 3 months. HbA1c of ≥6.5% and
≤9.0%, and not FPG at day 1, was selected as the main inclusion criterion.
Main exclusion criteria: History of myocardial infarction (MI), unstable angina, stroke or
transient ischemic attack (TIA). Congestive heart failure defined as New York Heart
28
Association (NYHA) class III-IV. Any clinically significant abnormalities in physical
examination, ECG or clinical chemistry results, as judged by the Investigator.
Clinical Study Compound
A good-manufacturing practice (GMP) batch of 5 kg O304 was manufactured by Anthem
BioSciences Pvt.Ltd, Bangalore, Karnataka, India. The suspension is composed of O304
20mg/ml in 2% methylcellulose in phosphate buffer. A 2% methylcellulose suspension that
color matched the active product was used as placebo. The O304 and placebo suspensions were
manufactured, packaged and labeled by Recipharm Pharmaceutical Development AB, Solna,
Sweden.
Clinical Methodology
Sixty-five (65) patients were randomised (1:1) to treatment with either O304 or placebo. A
screening visit (Visit 1) was performed within 3 weeks before randomisation and the start of
IMP administration. Patients were randomised on Day 1 (Visit 2) and allocated to 28 days’
treatment with either O304 or placebo (1:1). Study visits to the clinic were performed 7, 14, 21,
28, 29 and 40 days (Visits 3 to 8) following randomisation and start of treatment. The patients
were confined to the research clinic from the evening before Day 1 and Day 28 (Day -1 and
Day 27, respectively) to ensure fasting conditions before samples for analyses of FPG were
collected. Magnetic Resonance Imaging (MRI) scans after screening but before day 1 and after
end of treatment were performed at the University Hospital in Uppsala, Sweden, according to
standardized methods. Antaros Medical in Uppsala performed the data analysis. A clinical read
of the acquired scans was performed by a radiologist at Antaros Medical. If clinically significant
findings were noted by the radiologist, the Investigator was notified of the finding. The
Investigator was to evaluate and handle the finding as per standard medical/clinical judgment.

29
Any findings were reported as either baseline events or adverse events, if they started, or
worsened after administration of the first dose of IMP. The method used for assessing
microvascular function in the calf muscle, (a proxy for oxygenation), include a dynamic MRI
investigation of T2* determination before during and after reactive hyperemia (5). Sixty five
(65) patients were randomized, 32 patients in the placebo group and 33 in the O304 group, and
59 patients completed the study (28 and 31 in the two groups, respectively). HbA1c of ≥6.5%
and ≤9.0%, and not FPG at day 1, was used as the inclusion criterion since MRI examinations
had to be performed after screen but before day 1. Subsequently, a wide range of FPG values
were observed at baseline, both <7 and >13.3 mmol/l, (<126 to >240 mg/dl) were 13.3 mmol/l
(240 mg/dl) represents uncontrolled hyperglycemia, requiring a post hoc statistical analysis of
change in FPG at day 28 compared to day 1 in T2D patients with FPG >7 mM and <13.3 mM
at day 1.
QUANTIFICATION AND STATISTICAL ANALYSES
Quantification of western blot experiments was performed using Image Lab (Bio-Rad
Laboratories version 4.1 build 16) and Image-J Software (version 1.45s). Amyloid content
quantification was performed using Image-J software (version1.49m). All the statistical
analyses of in vitro and mouse in vivo data were performed by two-tailed Students t-tests. We
considered a value of P< 0.05 to be statistically significant. Patient data analyses were
performed using the mix model Anova test and the non-parametric Wilcoxon Rank Sum test.
The composite endpoint was analyzed using Chi-Square, and Fisher’s exact test.
REFERENCES
1. Westman J, Vågberg J, and Hallett A. 13 Jan 2011. 2. Ahren B, Simonsson E, Scheurink AJ, Mulder H, Myrsen U, and Sundler F.
Dissociated insulinotropic sensitivity to glucose and carbachol in high-fat diet-induced insulin resistance in C57BL/6J mice. Metabolism. 1997;46(1):97-106.

30
3. Ly PT, Cai F, and Song W. Detection of neuritic plaques in Alzheimer's disease mouse model. J Vis Exp. 201153).
4. Steneberg P, Rubins N, Bartoov-Shifman R, Walker MD, and Edlund H. The FFA receptor GPR40 links hyperinsulinemia, hepatic steatosis, and impaired glucose homeostasis in mouse. Cell Metab. 2005;1(4):245-58.
5. Jacobi B, Bongartz G, Partovi S, Schulte AC, Aschwanden M, Lumsden AB, Davies MG, Loebe M, Noon GP, Karimi S, et al. Skeletal muscle BOLD MRI: from underlying physiological concepts to its usefulness in clinical conditions. J Magn Reson Imaging. 2012;35(6):1253-65.