Palm Oil - teebweb.org · Refining - Crude palm oil & palm kernels Inputs: Electricity, fuel, other...
23
Palm Oil TEEB FOR AGRICULTURE AND FOOD
Transcript of Palm Oil - teebweb.org · Refining - Crude palm oil & palm kernels Inputs: Electricity, fuel, other...

Palm Oil TEEB FOR AGRICULTURE AND FOOD

Palm Oil Countries in this study are responsible for 96% of global palm oil production
- Africa
Cote d’Ivoire and Nigeria
- Asia
China, Indonesia, Malaysia, and Thailand
- Oceania
Papua New Guinea
- South America
Brazil, Colombia, Guatemala, and Honduras
Biophysical data: 2011
Valuation year: 2014
Overview
Palm oil consumption set to double in 40-years
Aim Support the development of natural and social capital
accounting.
Showing how businesses can identify more sustainable practices that yield financial and societal returns
Materiality Assessment Palm oil production in the top 11 countries analysed
Indonesia Case Study Land conversion
Fertiliser application
Methane capture from palm oil mill effluent (POME) ponds
Wage, salary, occupational health, and safety practices

Framework 1. Understand drivers of change
Devise KPIs that measure impact or dependency
2. Understand the consequence Identify the endpoint (primary receptor) of
the impact or dependency
3. Quantify in biophysical terms Changes in life expectancy, quality of life,
ecosystem service provision
4. Quantify in monetary terms Valuation is always human-centric and
reflect the value to the endpoint
Palm Oil Indonesia and Malaysia are responsible for 49% and 35% of global palm oil production
Three cultivation systems
- Smallholders; Estate plantations and; Large agri-businesses
Life cycle stages included
- Planting and growing
- Milling
- Refining (palm oil and palm oil kernels)
Materiality Assessment
Biophysical Quantification Input-output modelling
Secondary life-cycle assessment (LCA) data – Agri-Footprint
Agri-footprint was externally reviewed
The data corresponds to a typical farm and milling operation in Indonesia and Malaysia
Planting and growing Inputs: Fertilizers, fuel, land, pesticides, and water
Milling Inputs: Electricity, fuel, transportation, and water
Refining - Crude palm oil & palm kernels Inputs: Electricity, fuel, other raw materials, transportation, and
water

Materiality Assessment - Processes

Materiality Assessment - Practices
Practice or input Measured output
Operational Supply chain
Land use change Loss in carbon stored (above-
ground and soil) n/a
Fertilizer application Air, land and water pollution
from application
Air, land and water pollution
from manufacture
Pesticide application Land pollution from
application
Air, land and water pollution
from manufacture
Water use Water use n/a
Use of other inputs: energy,
raw materials and
transportation
Air, land and water pollution
from use
Air, land and water pollution
from manufacture
POME management Methane (greenhouse gas)
emissions n/a

Palm Oil Indonesia and Malaysia are responsible for 49% and 35% of global palm oil production
Three cultivation systems
- Smallholders; Estate plantations and; Large agri-businesses
Life cycle stages included
- Planting and growing
- Milling
- Refining (palm oil and palm oil kernels)
Natural capital costs
- Air, land, and water pollutants
- Greenhouse gas emissions
- Waste production
- Water consumption
Materiality Assessment
Monetary Valuation Impact on human health and ecosystems
Air, land, and water pollutants
GHG emissions
Waste production
Water consumption
Limitations Natural capital costs excluded:
Impact resulting loss of biodiversity
Displacement of local communities
Partially excluded: Air pollution from biomass burning – not all health impacts included
Natural capital dependencies excluded: Ecosystem services

Palm oil Palm oil production has a total cost of $38.5bn and palm kernel oil $5bn
Indonesia and Malaysia contribute 66% and 26% to the total impact of palm oil production
On average, producing one tonne of palm oil and palm kernel oil has a natural capital cost of $813 and $924 respectively
Producing palm oil in Nigeria has the highest cost per tonne, due to lower yield per ha and conversion rate
Cote d’Ivoire has the lowest cost per tonne due to lower social and natural capital costs of emissions associated with fertiliser application and pesticide application
Main drivers of valuation results:
- Yield (tonnes of FFB per ha) and conversion rate (tonnes of FFB per tonne of finished product)
- Quantity and type of inputs
- Monetary valuation per unit quantity of emissions
Materiality Assessment [results]

Materiality Assessment [results]

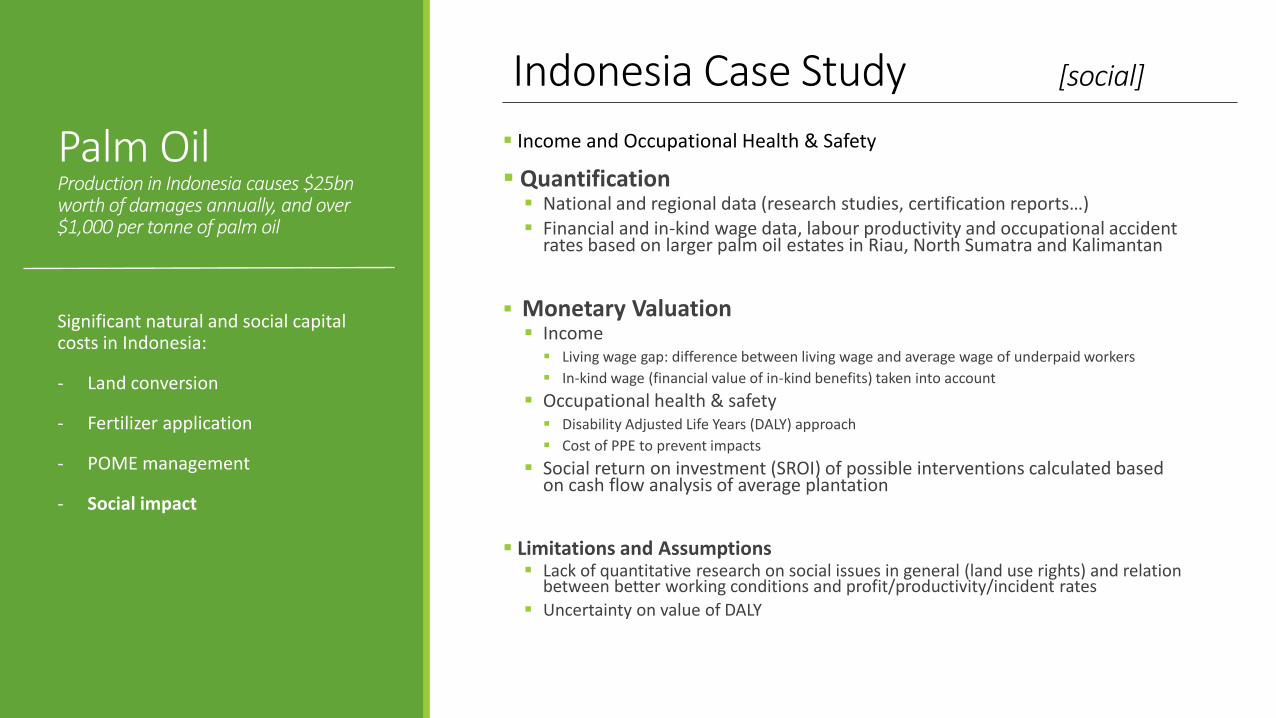
Indonesia Case Study

Palm Oil Production in Indonesia causes $25bn worth of damages annually, and over $1,000 per tonne of palm oil
Significant natural and social capital costs in Indonesia:
- Land conversion
- Fertilizer application
- POME management
- Social impact
Indonesia Case Study [land conversion]
7 scenarios
Biophysical Quantification
Change in above and belowground carbon stock Primary data used where possible from RSPO and FAO, IPCC, EC,
Blonk Consultants
Same method as in the Materiality Assessment
Air pollution from biomass and peatland burning 24 air pollutants taken into account
Monetary Valuation GHG cost of $126
Indonesia specific air pollutant costs
Financial costs of fire and mechanical clearing Includes labour and input costs

Indonesia Case Study [land conversion scenarios]
Prevailing ecosystem Soil type Land conversion method
1 Primary forest Peat soil Mechanical clearing
2 Primary forest Mineral soil Mechanical clearing
3 Grassland Mineral soil Mechanical clearing
4 Disturbed forest Mineral soil Mechanical clearing
5 Primary forest Peat soil Use of fire
6 Primary forest Mineral soil Use of fire
7 Disturbed forest Mineral soil Use of fire

Palm Oil Production in Indonesia causes $25bn worth of damages annually, and over $1,000 per tonne of palm oil
Significant natural and social capital costs in Indonesia:
- Land conversion
- Fertilizer application
- POME management
- Social impact
Limitations and Assumptions
Assumptions on the amount of carbon held in primary ecosystems can influence results significantly
Mechanical land clearing Linear decay of forest matter
Use of fire in land clearing 50% of forest biomass is burnt; 50% decays linearly over 25 years
7% of land is burnt – approximately 3 tonnes of soil per hectare
Indonesia Case Study [land conversion]

Over 25 years, converting primary forest on: Peat soil emits the most carbon per ha, or 429 tonnes of carbon per ha
Mineral soil leads to emissions of 82 tonnes of carbon per ha
Converting disturbed forest and grassland on mineral soil leads to a positive change in carbon stocks, meaning that oil palm plantation sequesters more carbon than the net loss due to land use change.
Headline results (no discounting vs. discounted)
1. Converting primary forest on peat soil using burning techniques $314,000 per ha or $270,000 per ha
2. Converting primary forest on peat soil using mechanical clearing $198,000 per ha or $146,000 per ha
Indonesia Case Study [land conversion results]

Indonesia Case Study [land conversion]

Palm Oil Production in Indonesia causes $25bn worth of damages annually, and over $1,000 per tonne of palm oil
Significant natural and social capital costs in Indonesia:
- Land conversion
- Fertilizer application
- POME management
- Social impact
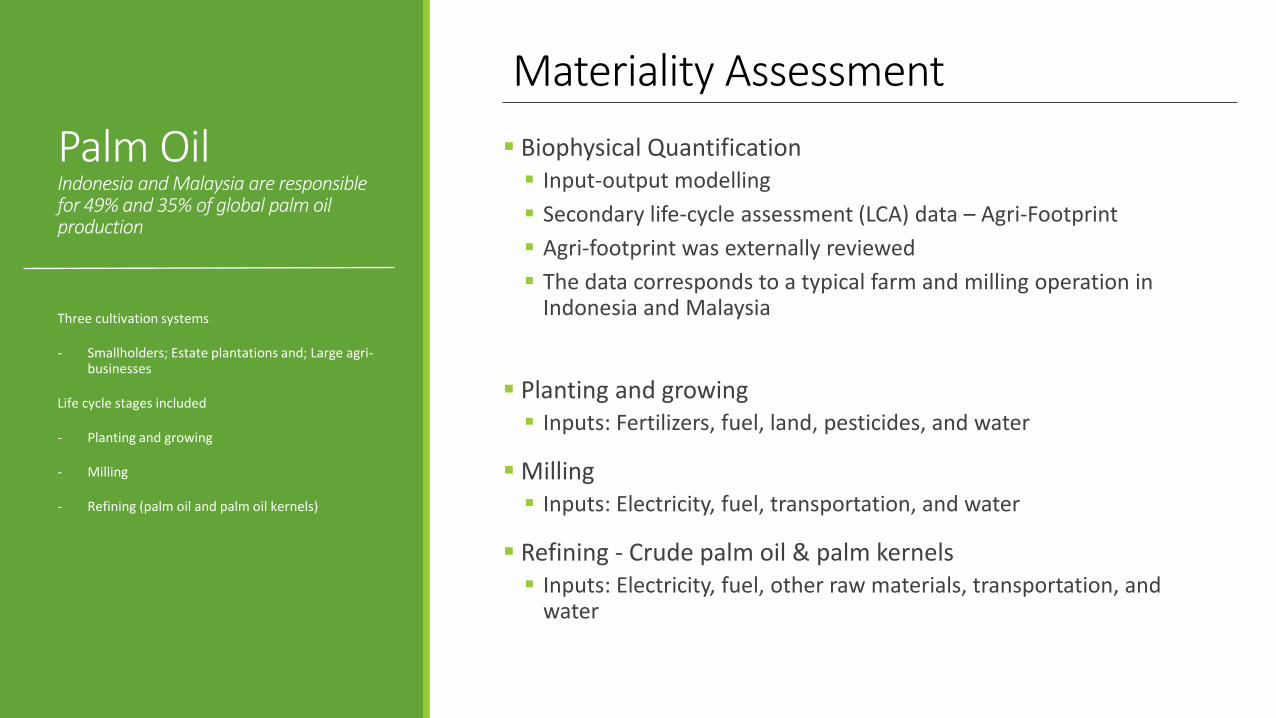
Indonesia Case Study [fertilizer use]
3 scenarios
Biophysical Quantification Calculated nitrogen and phosphorus balance over 25 years
Yield maintained in all scenarios
Monetary Valuation The same coefficients are applied as in the Materiality
Assessment
Average fertilizer cost per type of fertilizer is derived from the UN Comtrade database (Indonesia-specific 2013)
$1,453 to $2,107 per hectare per year
Limitations and Assumptions Full effect of soil erosion on not taken into account
Assumptions in USLE calculation
Cost of improved management practice, such as fertigation, require a large initial investment

Indonesia Case Study [fertilizer use]
Inputs Optimisation?
Baseline EFB, POME, crop cover, use of
pruned fronds, chemical fertilizers No - Surplus of nutrients
1 EFB, POME, crop cover, use of
pruned fronds, chemical fertilizers
Yes - Quantity of each input adjusted to
provide the adequate quantity of nutrients
2 Chemical fertilizer only Yes - Quantity adjusted to provide adequate
quantity of nutrient
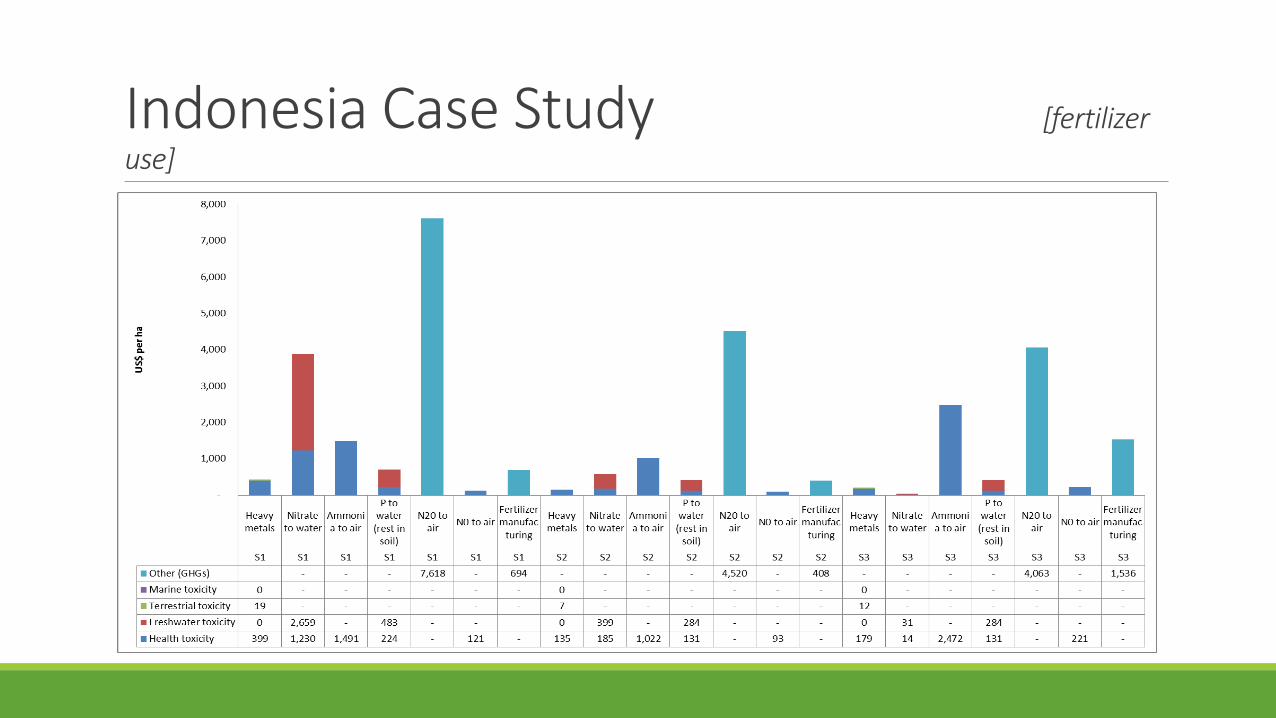
Indonesia Case Study [fertilizer
use]

Palm Oil Production in Indonesia causes $25bn worth of damages annually, and over $1,000 per tonne of palm oil
Significant natural and social capital costs in Indonesia:
- Land conversion
- Fertilizer application
- POME management
- Social impact
Indonesia Case Study [POME]
2 scenarios
Biophysical Quantification Literature review of methane capture and conversion rates
(UNFCCC CDM)
Use of energy
Treatment of wastewater
Fugitive emissions and flaring
Monetary Valuation GHG cost $126 per tonne
Marginal capital and operating expenditure costs
Limitations and Assumptions Limited range of studies providing an evidence base
CAPEX costs means the scenario is only applicable to large businesses

Indonesia Case Study [POME]
The social and natural capital cost of POME with and without methane capture is $29 and $409 per ha per year respectively
Palm Oil Production in Indonesia causes $25bn worth of damages annually, and over $1,000 per tonne of palm oil
Significant natural and social capital costs in Indonesia:
- Land conversion
- Fertilizer application
- POME management
- Social impact
Indonesia Case Study [social]
Income and Occupational Health & Safety
Quantification National and regional data (research studies, certification reports…) Financial and in-kind wage data, labour productivity and occupational accident
rates based on larger palm oil estates in Riau, North Sumatra and Kalimantan
Monetary Valuation Income
Living wage gap: difference between living wage and average wage of underpaid workers
In-kind wage (financial value of in-kind benefits) taken into account
Occupational health & safety Disability Adjusted Life Years (DALY) approach
Cost of PPE to prevent impacts
Social return on investment (SROI) of possible interventions calculated based on cash flow analysis of average plantation
Limitations and Assumptions Lack of quantitative research on social issues in general (land use rights) and relation
between better working conditions and profit/productivity/incident rates
Uncertainty on value of DALY
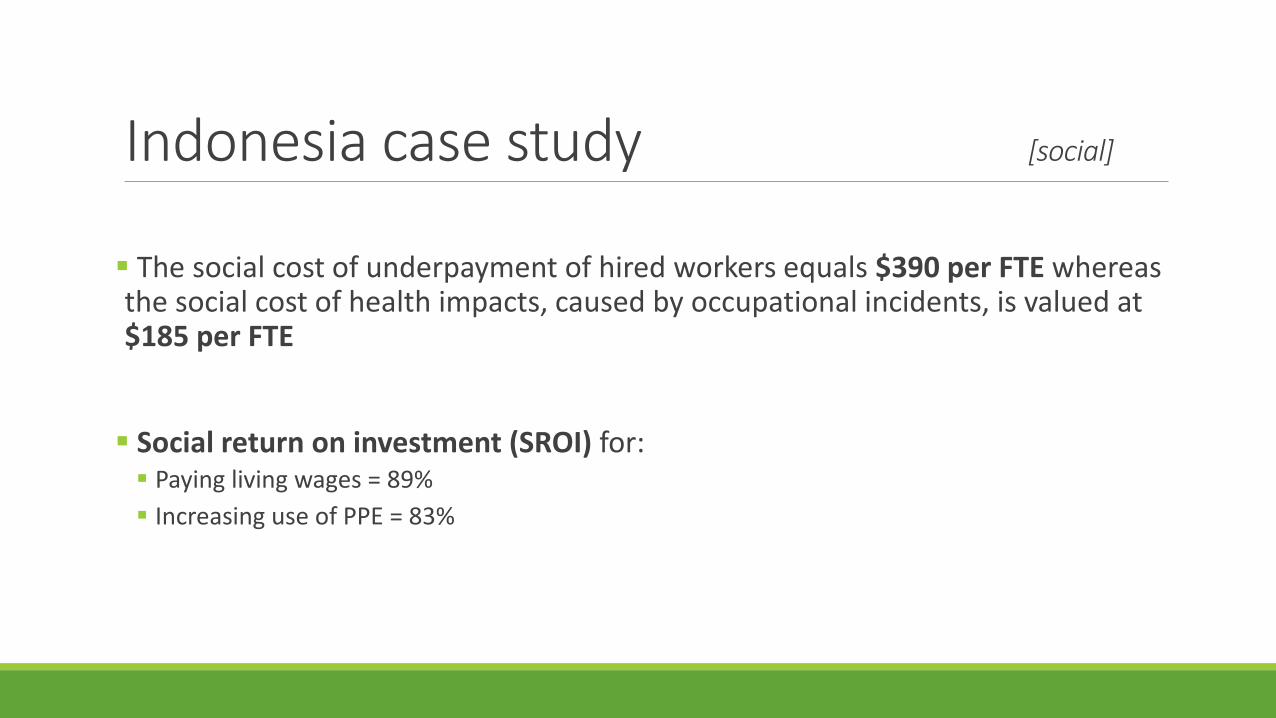
Indonesia case study [social]
The social cost of underpayment of hired workers equals $390 per FTE whereas the social cost of health impacts, caused by occupational incidents, is valued at $185 per FTE
Social return on investment (SROI) for: Paying living wages = 89%
Increasing use of PPE = 83%

Questions...