Palm Beach County Impact Fee Update...
219
Palm Beach County Impact Fee Update Study DRAFT REPORT September 16, 2015 Prepared for: Palm Beach County 2300 N. Jog Road West Palm Beach, FL 33411 Prepared by: Tindale Oliver 1000 N. Ashley Dr., #400 Tampa, Florida, 33602 ph (813) 224-8862 fax (813) 226-2106 E-mail: [email protected] 719001-00.14
Transcript of Palm Beach County Impact Fee Update...

Palm Beach County
Impact Fee Update Study DRAFT REPORT
September 16, 2015
Prepared for:
Palm Beach County
2300 N. Jog Road
West Palm Beach, FL 33411
Prepared by:
Tindale Oliver
1000 N. Ashley Dr., #400
Tampa, Florida, 33602
ph (813) 224-8862
fax (813) 226-2106
E-mail:
719001-00.14
DRAFT
Tindale Oliver Palm Beach County September 2015 i Impact Fee Update Study
PALM BEACH COUNTY
IMPACT FEE UPDATE STUDY
Table of Contents
EXECUTIVE SUMMARY ............................................................................................... ES-1
I. INTRODUCTION .................................................................................................... I-1
II. PUBLIC EDUCATION FACILITIES IMPACT FEE .......................................................... II-1
III. PARKS & RECREATION IMPACT FEE ....................................................................... III-1
IV. PUBLIC LIBRARIES IMPACT FEE.............................................................................. IV-1
V. FIRE PROTECTION & RESCUE IMPACT FEE.............................................................. V-1
VI. LAW ENFORCEMENT IMPACT FEE ......................................................................... VI-1
VII. PUBLIC BUILDINGS IMPACT FEE ............................................................................ VII-1
VIII. TRANSPORTATION ............................................................................................... VIII-1
APPENDICES
Appendix A: Population – Supplemental Information
Appendix B: Public Education Facilities Impact Fee -- Supplemental Information
Appendix C: Building and Land Values Supplemental Information for Parks & Recreation,
Public Libraries, Fire Protection and Rescue, Law Enforcement, and Public
Buildings Impact Fees
Appendix D: Public Buildings Impact Fee – Inventory
Appendix E: Transportation Impact Fee -- Demand Component Calculations
Appendix F: Transportation Impact Fee -- Cost Component Calculations
Appendix G: Transportation Impact Fee -- Credit Component Calculations
Appendix H: Calculated Transportation Impact Fee Schedule

DRAFT
Tindale Oliver Palm Beach County September 2015 ES-1 Impact Fee Update Study
Executive Summary Palm Beach County’s impact fee program includes fees in the following seven service areas:
Public Education Facilities
Parks & Recreation
Public Libraries
Fire Protection & Rescue
Law Enforcement
Public Buildings
Transportation
The most recent technical study for these fees was completed in 2012. It is the policy of the
County to update impact fee technical studies frequently to ensure the fees are based on
most current and localized data.
Palm Beach County has retained Tindale Oliver to prepare an update study to reflect changes
to the cost, credit, and demand components since the last technical study. It should be noted
that figures included in this study represent the technically defensible level of impact fees
that the County could charge; however, the Board of County Commission (BOCC) may choose
to discount the fees as a policy decision.
An impact fee is a one-time capital charge levied against new development to fund
infrastructure capacity consumed by new growth. Impact fee revenues can only be used for
capacity expansion projects and not for expenses related to replacement, maintenance or
operations. In Florida, legal requirements related to impact fees have primarily been
established through case law since the 1980’s. Generally speaking, impact fees must comply
with the “dual rational nexus” test, which requires that they:
Be supported by a study demonstrating that the fees are proportionate in amount to
the need created by new development paying the fee; and
Be spent in a manner that directs a proportionate benefit to new development,
typically accomplished through a list of capacity-adding projects included in the
County’s Capital Improvement Plan, Capital Improvement Element, or another
planning document/Master Plan.

DRAFT
Tindale Oliver Palm Beach County September 2015 ES-2 Impact Fee Update Study
In 2006, the Florida legislature passed the “Florida Impact Fee Act,” which recognized impact
fees as “an outgrowth of home rule power of a local government to provide certain services
within its jurisdiction.” § 163.31801(2), Fla. Stat. The statute – concerned with mostly
procedural and methodological limitations – did not expressly allow or disallow any particular
public facility type from being funded with impact fees. The Act did specify procedural and
methodological prerequisites, such as the requirement of the fee being based on most recent
and localized data, a 90-day requirement for fee changes, and other similar requirements,
most of which were common to the practice already. In 2009, the Act was amended to clarify
that in any action challenging an impact fee, the government has the burden of proving by
a preponderance of the evidence that the imposition or amount of the fee meets the
requirements of state legal precedent or the Impact Fee Act and that the court may not use
a deferential standard.
This technical report has been prepared to support legal compliance with existing case law
and statutory requirements.
Table ES-1 provides a summary of calculated fees for six representative land uses along with
a comparison to the current adopted fees. The complete schedules include approximately 40
land uses and are included in the remaining sections of this report.

DRAFT
Tindale Oliver Palm Beach County September 2015 ES-3 Impact Fee Update Study
Table ES-1 Summary of Palm Beach County Impact Fees - All Program Areas
(1) Source: Table II-10 (2) Source: Table III-7 (3) Source: Table IV-12 (4) Source: Table V-8 (5) Source: Table VI-4 (6) Source: Table VII-7 (7) Source: Appendix H, Table H-1 (8) Sum of each program area's adopted rate and full calculated rate
Adopted Rate Full Calculated Rate Percent Change Adopted Rate Full Calculated Rate Percent Change Adopted Rate Full Calculated Rate Percent Change Adopted Rate Full Calculated Rate Percent Change
Residential:
210 Single Family (detached) 2,000 sf du $1,866 $15,305 720% $860 $2,418 181% $243 $289 19% $0 $356 N/A
Non-Residential:
110 General Light Industrial 1,000 sf N/A N/A N/A N/A N/A N/A N/A N/A N/A $0 $145 N/A
710 Office (50,000 sf) 1,000 sf N/A N/A N/A N/A N/A N/A N/A N/A N/A $0 $297 N/A
820 Retail (125,000 sf) 1,000 sfgla N/A N/A N/A N/A N/A N/A N/A N/A N/A $0 $484 N/A
912 Bank/Savings w/Drive-In 1,000 sf N/A N/A N/A N/A N/A N/A N/A N/A N/A $0 $480 N/A
934 Fast Food Rest. w/Drive-Thru 1,000 sf N/A N/A N/A N/A N/A N/A N/A N/A N/A $0 $1,873 N/A
Adopted Rate Full Calculated Rate Percent Change Adopted Rate Full Calculated Rate Percent Change Adopted Rate Full Calculated Rate Percent Change Adopted Rate Full Calculated Rate Percent Change
Residential:
210 Single Family (detached) 2,000 sf du $128 $192 50% $223 $1,499 572% $7,281 $4,697 -36% $10,601 $24,756 134%
Non-Residential:
110 General Light Industrial 1,000 sf $7 $73 943% $74 $602 714% $1,522 $2,983 96% $1,603 $3,803 137%
710 Office (50,000 sf) 1,000 sf $10 $150 1400% $131 $1,231 840% $3,418 $6,634 94% $3,559 $8,312 134%
820 Retail (125,000 sf) 1,000 sfgla $57 $245 330% $324 $2,008 520% $8,546 $7,615 -11% $8,927 $10,352 16%
912 Bank/Savings w/Drive-In 1,000 sf $10 $243 2330% $382 $1,991 421% $19,056 $16,030 -16% $19,448 $18,744 -4%
934 Fast Food Rest. w/Drive-Thru 1,000 sf $57 $948 1563% $604 $7,770 1186% $30,702 $53,653 75% $31,363 $64,244 105%
Fire Protection & Rescue(4)
ITE LUC Land Use UnitLaw Enforcement(5)
ITE LUC Land Use UnitPublic Education Facilities(1) Parks & Recreation(2) Public Libraries(3)
Public Buildings(6) Transportation(7) Total (All Fees)(8)

DRAFT
Tindale Oliver Palm Beach County September 2015 I-1 Impact Fee Update Study
I. Introduction
Palm Beach County’s impact fee program includes fees in the following seven service areas:
Public Education Facilities
Parks & Recreation
Public Libraries
Fire Protection & Rescue
Law Enforcement
Public Buildings
Transportation
The most recent technical study for these fees was completed in 2012. It is the policy of Palm
Beach County to update impact fee technical studies frequently to ensure the fees are based
on most current and localized data.
Palm Beach County has retained Tindale Oliver to prepare an update study to reflect changes
to the cost, credit, and demand components since the last update studies. It should be noted
that figures calculated in this study represent the technically defensible level of impact fees
that the County could charge; however, the BOCC may choose to discount the fees as a policy
decision.
Methodology
The methodology used to update the Palm Beach County’s impact fee program is a
consumption-based impact fee methodology, which is used throughout Florida. This
methodology was also used in preparing the current adopted impact fees. A consumption-
based impact fee charges new development based upon the burden placed on services from
each land use (demand). The demand component is measured in terms of population per unit
in the case of all impact fee program areas with the exception of transportation and schools.
In the case of schools, student generation rate is used and in the case of transportation,
vehicle-miles of travel is used. A consumption-based impact fee charges new growth the
proportionate share of the cost of providing additional infrastructure available for use by new
growth. In addition, per legal requirements, a credit is subtracted from the total cost to
account for the value of future tax contributions of the new development toward any capacity
expansion projects through other revenue sources. Contributions used to calculate the credit

DRAFT
Tindale Oliver Palm Beach County September 2015 I-2 Impact Fee Update Study
component include estimates of future non-impact fee revenues generated by the new
development that will be used toward capacity expansion projects. In other words, case law
requires that the new development should not be charged twice for the same service.
Legal Standard Overview
In Florida, legal requirements related to impact fees have primarily been established through
case law since the 1980’s. Generally speaking, impact fees must comply with the “dual
rational nexus” test, which requires that they:
Be supported by a study demonstrating that the fees are proportionate in amount to
the need created by new development paying the fee; and
Be spent in a manner that directs a proportionate benefit to new development,
typically accomplished through establishment of benefit districts and a list of capacity-
adding projects included in the County’s Capital Improvement Plan, Capital
Improvement Element, or another planning document/Master Plan.
In 2006, the Florida legislature passed the “Florida Impact Fee Act,” which recognized impact
fees as “an outgrowth of home rule power of a local government to provide certain services
within its jurisdiction.” § 163.31801(2), Fla. Stat. The statute – concerned with mostly
procedural and methodological limitations – did not expressly allow or disallow any particular
public facility type from being funded with impact fees. The Act did specify procedural and
methodological prerequisites, such as the requirement of the fee being based on most recent
and localized data, a 90-day requirement for fee changes, and other similar requirements,
most of which were common to the practice already.
More recent legislation further affected the impact fee framework in Florida, including the
following:
HB 227 in 2009: The Florida legislation statutorily clarified that in any action
challenging an impact fee, the government has the burden of proving by a
preponderance of the evidence that the imposition or amount of the fee meets the
requirements of state legal precedent or the Impact Fee Act and that the court may
not use a deferential standard.
SB 360 in 2009: Allowed fees to be decreased without the 90-day notice period
required to increase the fees and purported to change the standard of legal review
associated with impact fees. SB 360 also required the Florida Department of

DRAFT
Tindale Oliver Palm Beach County September 2015 I-3 Impact Fee Update Study
Community Affairs (now the Department of Economic Opportunity) and Florida
Department of Transportation (FDOT) to conduct studies on “mobility fees,” which
were completed in 2010.
HB 7207 in 2011: Required a dollar-for-dollar credit, for purposes of concurrency
compliance, for impact fees paid and other concurrency mitigation required. The
payment must be reduced by the percentage share the project’s traffic represents of
the added capacity of the selected improvement (up to a maximum of 20% or to an
amount specified by ordinance, whichever results in a higher credit). The courts have
not yet taken up the issue of whether a local government may still charge an
impact/mobility fee in lieu of proportionate share if the impact/mobility fee is higher
than the calculated proportionate share contribution.
HB 319 in 2013: Applied mostly to concurrency management authorities, but also
encouraged local governments to adopt alternative mobility systems using a series of
tools identified in section 3180(5)(f), Florida Statutes, including:
1. Adoption of long-term strategies to facilitate development patterns that
support multimodal solutions, including urban design, and appropriate land use
mixes, including intensity and density.
2. Adoption of an area-wide level of service not dependent on any single road
segment function.
3. Exempting or discounting impacts of locally desired development, such as
development in urban areas, redevelopment, job creation, and mixed use on the
transportation system.
4. Assigning secondary priority to vehicle mobility and primary priority to ensuring
a safe, comfortable, and attractive pedestrian environment, with convenient
interconnection to transit.
5. Establishing multimodal level of service standards that rely primarily on non-
vehicular modes of transportation where existing or planned community design
will provide adequate level of mobility.
6. Reducing impact fees or local access fees to promote development within urban
areas, multimodal transportation districts, and a balance of mixed-use
development in certain areas or districts, or for affordable or workforce housing.
Also, under HB 319, a mobility fee funding system expressly must comply with the dual
rational nexus test applicable to traditional impact fees. Furthermore, any mobility fee
revenues collected must be used to implement the local government’s plan, which served as

DRAFT
Tindale Oliver Palm Beach County September 2015 I-4 Impact Fee Update Study
the basis for the fee. Finally, under HB 319, an alternative mobility system, that is not mobility
fee‐based, must not impose upon new development any responsibility for funding an existing
transportation deficiency.
The following paragraphs provide further detail on the generally applicable legal standards
applicable here.
Impact Fee Definition
An impact fee is a one-time capital charge levied against new development.
An impact fee is designed to cover the portion of the capital costs of infrastructure
capacity consumed by new development.
The principle purpose of an impact fee is to assist in funding the implementation of
projects identified in the Capital Improvements Element (CIE) and other capital
improvement programs for the respective facility/service categories.
Impact Fee vs. Tax
An impact fee is generally regarded as a regulatory function established as a condition
for improving property and is not established for the primary purpose of generating
revenue, as are taxes.
Impact fee expenditures must convey a proportional benefit to the fee payer. This is
accomplished through the establishment of benefit districts, where fees collected in
a benefit district are spent in the same benefit district.
An impact fee must be tied to a proportional need for new infrastructure capacity
created by new development.
This technical report has been prepared to support legal compliance with existing case law
and statutory requirements. The technical report also documents the methodology
components for each of the impact fee areas in the following sections, including an evaluation
of the inventory, service area, level of service (LOS), cost, credit, and demand components.
Information supporting this analysis was obtained from the County and other sources, as
indicated.

DRAFT
Tindale Oliver Palm Beach County September 2015 II-1 Impact Fee Update Study
II. Public Education Facilities Impact Fee
As mentioned previously, the Palm Beach County’s School Impact Fee was last updated in
2012. The study methodology is documented in the following nine sub-sections:
Inventory
Service Area, Benefit Districts, and Enrollment
Facility Service Delivery
Cost Component
Credit Component
Net Impact Cost per Student
Student Generation Rates
Calculated School Impact Fee Schedule
School Impact Fee Schedule Comparison
Information supporting this analysis was obtained from the Palm Beach County School
District and other sources, as indicated.
Inventory
The Palm Beach County School District provides public education facilities that are available
to all school-age residents of Palm Beach County. As such, this analysis will consider all public
elementary, middle, and high school level facilities and the students attending these facilities
located throughout and living within Palm Beach County.
The District currently operates 170 traditional public schools that serve the students of Palm
Beach County and its municipalities, including 107 elementary schools, 33 middle schools, 25
high schools, and 5 multi-level schools. The District also operates a number of other
programs, such as alternative learning programs and adult learning centers throughout the
county. The District’s current school inventory is provided in Appendix B, Table B-1.

DRAFT
Tindale Oliver Palm Beach County September 2015 II-2 Impact Fee Update Study
Service Area, Benefit Districts, and Enrollment
Palm Beach County Public Schools provides public education facilities that are available to
all Kindergarten thru 12th grade (K-12) students throughout the entire county. Currently,
Palm Beach County has four school impact fee benefit districts, which require that impact
fee revenues collected in one district be spent in the same benefit district. In addition, a
fifth no-impact fee district is established in the Glades Area. Benefit districts are typically
created to ensure the fee payer receives the benefit in cases when the capital projects built
with impact fee revenues benefit a limited geographic area. In the case of public schools,
attendance boundaries can be redrawn to balance school enrollment with available school
capacity and therefore can serve different geographic areas over time. In addition, the
State Department of Education (DOE) has been increasing its support of Choice programs
where students can attend schools outside of their designated districts. As such, the
appropriate impact fee benefit district for public schools is countywide. It is our
understanding that the in the 5th district (Glades Area), there is not any significant level of
development activity. As such, it is appropriate to continue to exempt this area from
impact fee collection and spending.
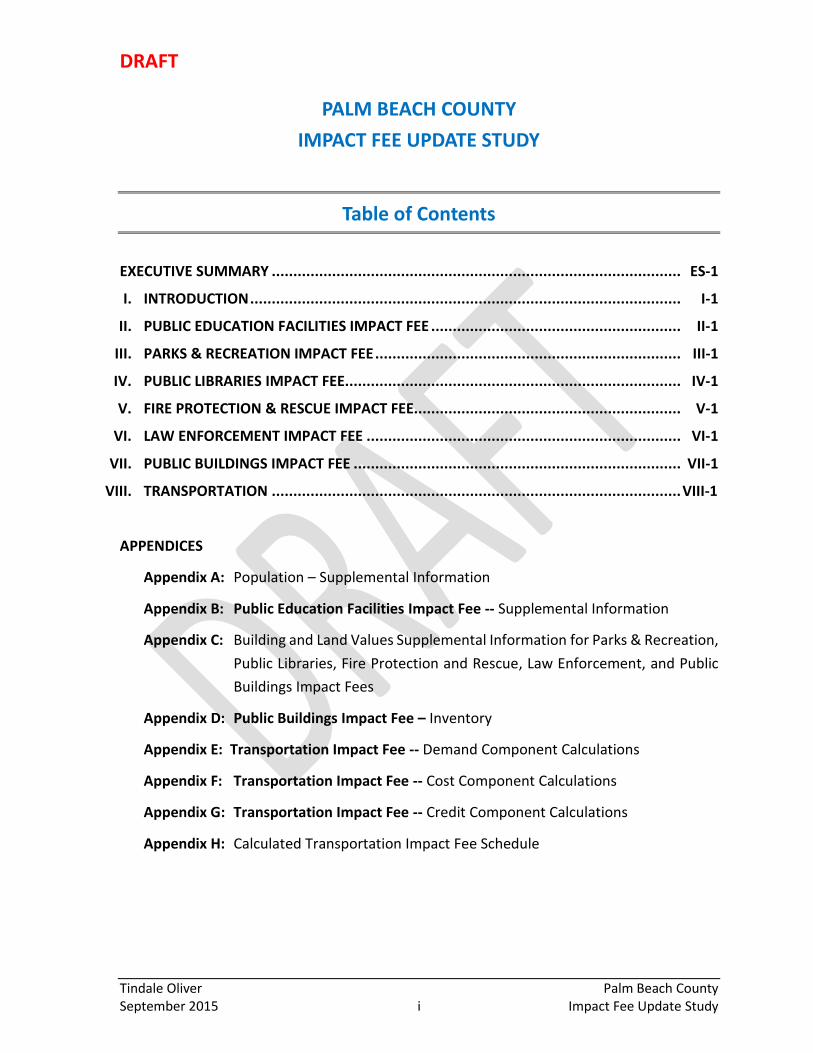
Table II-1 presents the historical student enrollment since 2000, and projected enrollment
through 2033. In order to be consistent with the inventory used in the impact fee analysis,
the figures presented in this table only include those students attending (or projected to
attend) the traditional schools listed in Appendix B, Table B-1. The annual percent change
is presented, as well as a three-year average to account for any random fluctuations.
DRAFT
Tindale Oliver Palm Beach County September 2015 II-3 Impact Fee Update Study
Table II-1 Palm Beach County Enrollment Trends
(1) Source: Palm Beach County School District, includes only
the students attending traditional schools (2) Percent change from one year to the next (3) Average change over the past three years
School
YearEnrollment(1)
Annual
Percent
Change(2)
Three-Year
Average(3)
2000-01 147,234 - -
2001-02 151,308 2.8% -
2002-03 154,572 2.2% -
2003-04 157,990 2.2% 2.4%
2004-05 162,136 2.6% 2.3%
2005-06 162,106 0.0% 1.6%
2006-07 159,226 -1.8% 0.3%
2007-08 159,300 0.0% -0.6%
2008-09 159,304 0.0% -0.6%
2009-10 160,485 0.7% 0.2%
2010-11 161,405 0.6% 0.4%
2011-12 162,461 0.7% 0.7%
2012-13 163,250 0.5% 0.6%
2013-14 162,314 -0.6% 0.2%
2014-15 162,598 0.2% 0.0%
2015-16 162,899 0.2% -0.1%
2016-17 163,218 0.2% 0.2%
2017-18 163,553 0.2% 0.2%
2018-19 165,549 1.2% 0.5%
2019-20 167,575 1.2% 0.9%
2020-21 169,632 1.2% 1.2%
2021-22 171,720 1.2% 1.2%
2022-23 173,853 1.2% 1.2%
2023-24 175,323 0.8% 1.1%
2024-25 176,808 0.8% 0.9%
2025-26 178,307 0.8% 0.8%
2026-27 179,821 0.8% 0.8%
2027-28 181,350 0.9% 0.8%
2028-29 182,893 0.9% 0.9%
2029-30 184,451 0.9% 0.9%
2030-31 186,025 0.9% 0.9%
2031-32 187,615 0.9% 0.9%
2032-33 189,193 0.8% 0.9%

DRAFT
Tindale Oliver Palm Beach County September 2015 II-4 Impact Fee Update Study
Facility Service Delivery
Based on information provided by the School District, current school characteristics in terms
of the number of student stations and permanent square footage are representative of future
schools and used in the impact fee calculations. Using the square footage and student
stations for each school type, the facility service delivery has been identified (Florida
Inventory of School Houses (FISH) net square feet per permanent student station) for the
impact fee calculations.
Table II-2 illustrates the facility service delivery for Palm Beach County Public Schools, which
is 138.5 FISH net square feet per permanent student station for elementary schools, 125.3
FISH net square feet per permanent student station for middle schools, and 144.1 FISH net
square feet per permanent student station for high schools. The weighted average facility
service delivery based on all three school types is 137.0 FISH net square feet per permanent
student station.
Table II-2 Facility Service Delivery – Existing Schools
(1) Source: Appendix B, Table B-1 (2) Source: Appendix B, Table B-1 (3) Permanent net square footage (Item 1) divided by permanent student stations (Item 2)
Elementary Middle High
Permanent Net Square Footage(1) 12,392,252 5,718,972 8,044,452 26,155,676
Permanent Student Stations(2) 89,477 45,628 55,825 190,930
Net Square Feet per Student Station(3) 138.5 125.3 144.1 137.0
DescriptionSchool Type Total /
Weighted Avg
DRAFT
Tindale Oliver Palm Beach County September 2015 II-5 Impact Fee Update Study
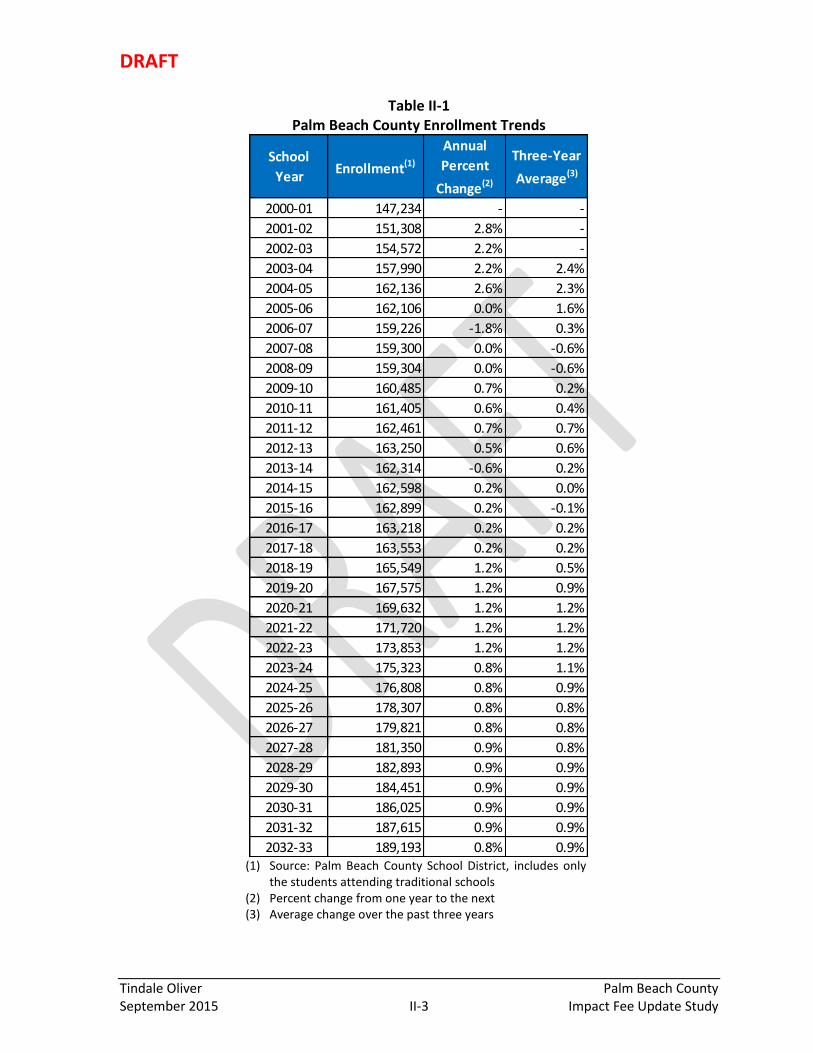
Cost Component
The capital costs of providing school facilities includes several components, such as the
school facility cost, transportation cost, and ancillary facility costs. This section addresses
each of these components.
Facility Cost per Student Station
The first step in determining the cost of providing public schools to Palm Beach County
residents is to calculate the facility cost per student station. Several cost components must
be considered when calculating the total cost of constructing a school, including
architect/site improvement costs; construction costs; furniture, fixtures, and equipment
(FF&E) costs; and the cost to purchase the land. Each component of the school facility cost
is described in more detail in the following sub-sections.
Architect/Site Improvement, Construction and FF&E Costs
To determine the administration, architect/site improvement, construction, and FF&E costs
associated with building a new school in Palm Beach County, several variables were
considered, including:
Cost associated with new schools or additions to existing schools based on most
recently built schools;
Insurance values of existing schools;
Estimates for planned schools;
Information obtained from other jurisdictions regarding recently built schools; and
Discussions with the District’s Division of Support Operations.
Based on this information and analysis, construction costs were estimated at $190 per net
square foot for elementary schools, $225 per net square foot for middle schools, $250 per
net square foot for high schools. In addition, based on a review of historical projects in Palm
Beach County as well as in other jurisdictions, architectural, design and site improvement
costs are estimated at 18 percent of construction cost and cost associated with furniture,
fixtures, and equipment is estimated at 4 percent of the construction cost. Appendix B
provides additional detail on cost estimates.

DRAFT
Tindale Oliver Palm Beach County September 2015 II-6 Impact Fee Update Study
Table II-3 presents the cost per square foot figures for the architect/site improvement,
construction, and FF&E cost components for each school type. For illustration purposes,
Table II-3 also presents the weighted average figure for each cost component, based on all
three school types.
Land Cost
For each school type, the land cost per square foot is based on a value of $200,000 per acre.
This value per acre is based on a review of the following:
Recent purchases or appraisals by the School District;
Values of land where current schools are located, as reported by the Palm Beach
County Property Appraiser;
Vacant land sales of similarly sized parcels;
Value of all vacant land of similarly sized parcels; and
Discussions with the District’s Real Estate Division.
Appendix B documents the results of the land value analysis in further detail. The land cost
per square foot by school type was developed based on the acres per 1,000 permanent net
square feet for the future prototype schools. The resulting land cost figures for each type of
school also are presented in Table II-3.

DRAFT
Tindale Oliver Palm Beach County September 2015 II-7 Impact Fee Update Study
Table II-3 School Facility Cost per Student Station
(1) Source: Table II-2 (2) Source: Table II-2 (3) Estimated at 18% of construction cost based on estimates obtained from the Palm Beach County School District and recent costs obtained
from other Florida School Districts. See Appendix B for further detail. (4) Construction cost is estimated to range from $190 per net square foot to $250 per net square foot, based on information obtained from
the Palm Beach County School District and recently constructed schools in other Florida jurisdictions. Detailed information on cost estimates is included in Appendix B.
(5) Estimated at 4% of the construction cost based on estimates obtained from the Palm Beach County School District and recent cost obtained from other Florida School Districts. Detailed information on cost estimates is included in Appendix B.
(6) The land cot per square foot for each school type is based on the acreage per 1,000 permanent square feet for future schools at a cost of $200,000 per acre. This cost per acre figure is based on the land value of current schools within the county and average land values for vacant land throughout the county. Further information is included in Appendix B.
(7) Sum of the school facility cost per net square foot (Items 3 thru 6) (8) The net square feet per student station (Item 1) multiplied by the total school facility cost per net square foot (Item 7) for each respective
school type. Weighted average is based on the distribution of existing stations for each school type (Item 2).
Cost ComponentElementary
School
Middle
School
High
School
Weighted
Average
Net Square Feet per Student Station(1) 138.5 125.3 144.1 137.0
Existing Permanent Stations(2) 89,477 45,628 55,825 190,930
Architect/Site Improvement Cost per Net Sq Ft(3) $34.20 $40.50 $45.00 $38.90
Construction Cost per Net Sq Ft(4) $190.00 $225.00 $250.00 $216.11
FF&E Cost per Net Sq Ft(5) $7.60 $9.00 $10.00 $8.64
Land Cost per Net Sq Ft(6) $27.20 $28.80 $24.80 $27.20
Total Facility Cost per Net Sq Ft(7) $259.00 $303.30 $329.80 $290.85
Total Facility Cost per Student Station(8) $35,872 $38,003 $47,524 $39,846
School Facility Cost Components:
DRAFT
Tindale Oliver Palm Beach County September 2015 II-8 Impact Fee Update Study
Total Facility Cost per Student by School Type
The total facility impact cost per student for each school type is based on the facility cost per
student station figures derived in Table II-3, and is typically calculated by multiplying the cost
per student station by the number of total permanent stations and dividing by current
student enrollment. This adjustment of dividing the cost per student station by the ratio of
current student enrollment to available capacity converts the cost per student station to a
cost per student. This calculation accounts for the current availability or shortage in
permanent capacity and adjusts the costs accordingly. If there is available capacity (e.g.,
currently more permanent student stations than expected students), then the total facility
cost per student increases because the cost of building available capacity is being recouped.
Similarly, if there are currently more students enrolled than available capacity, the cost per
student is adjusted downward.
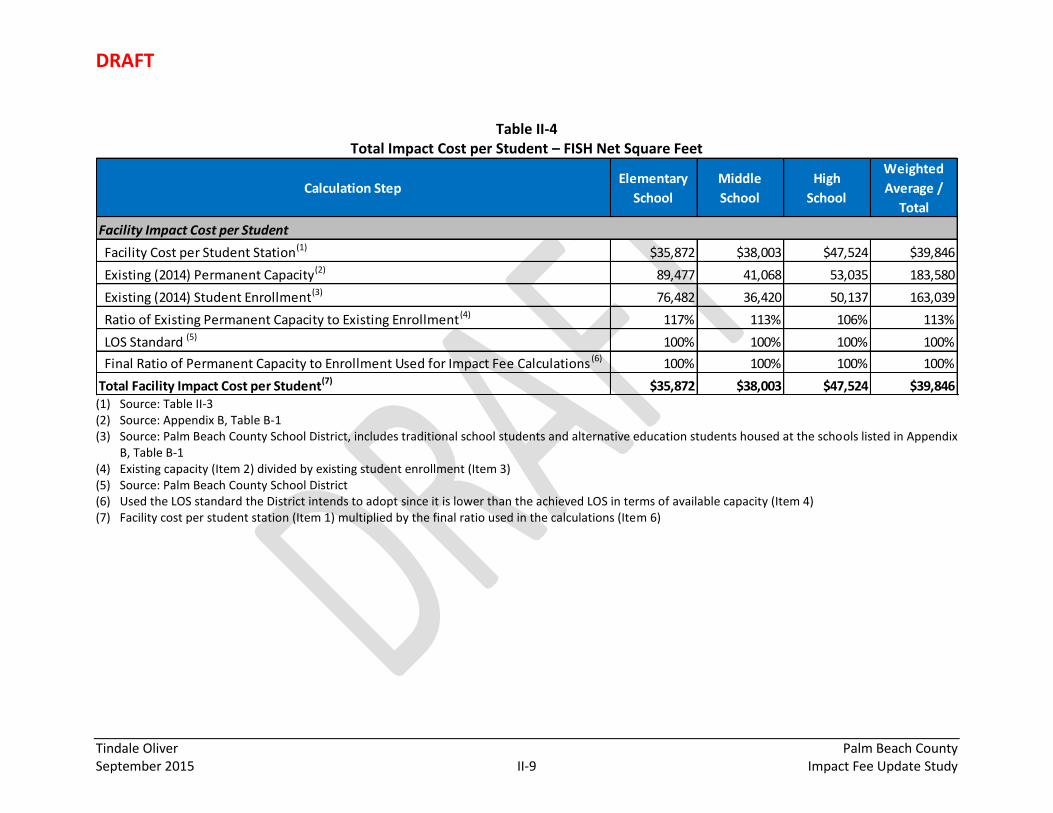
As presented in Table II-4, in the case of Palm Beach County, there is approximately 13
percent available capacity. Although there is available capacity countywide, because the
District is intending to change its adopted LOS standard to 100 percent, the cost per student
station calculated in Table II-3 also represents the facility cost per student and results in a
more conservative impact fee.
The District’s current adopted LOS standard for concurrency purposes has a tiered system
where the school utilization could reach 110 percent to 120 percent of FISH capacity.
However, the District intends to adopt an LOS standard of 100 percent to be able to provide
students with satisfactory stations and accommodate State-mandated class size
requirements. It is important to note that the school system in Florida is the only public
service that has State-mandated level of service requirements. More specifically, Article IX,
Section 1 of the State of Florida Constitution states that beginning with the 2010 school year,
a sufficient number of classrooms needs to be provided to accommodate the following:
A maximum of 18 students per classroom for pre-kindergarten through grade 3;
A maximum of 22 students per classroom for Grades 4 through 8; and
A maximum of 25 students per classroom for Grades 9 through 12.
Palm Beach County School District fully complied with class size requirements since 2011-12
school year. Although the District uses available mitigation options such as the allocation of
additional teachers in KG through 3rd grade and extra period supplements for select
teachers at the middle and high school level, combining classes of multiple grade levels as
well as gifted and high performing students, etc., adoption of an LOS standard of 100
percent will assist the District in complying with State requirements.
DRAFT
Tindale Oliver Palm Beach County September 2015 II-9 Impact Fee Update Study
Table II-4 Total Impact Cost per Student – FISH Net Square Feet
(1) Source: Table II-3 (2) Source: Appendix B, Table B-1 (3) Source: Palm Beach County School District, includes traditional school students and alternative education students housed at the schools listed in Appendix
B, Table B-1 (4) Existing capacity (Item 2) divided by existing student enrollment (Item 3) (5) Source: Palm Beach County School District (6) Used the LOS standard the District intends to adopt since it is lower than the achieved LOS in terms of available capacity (Item 4) (7) Facility cost per student station (Item 1) multiplied by the final ratio used in the calculations (Item 6)
Calculation StepElementary
School
Middle
School
High
School
Weighted
Average /
Total
Facility Impact Cost per Student
Facility Cost per Student Station(1) $35,872 $38,003 $47,524 $39,846
Existing (2014) Permanent Capacity(2) 89,477 41,068 53,035 183,580
Existing (2014) Student Enrollment(3) 76,482 36,420 50,137 163,039
Ratio of Existing Permanent Capacity to Existing Enrollment(4) 117% 113% 106% 113%
LOS Standard (5) 100% 100% 100% 100%
Final Ratio of Permanent Capacity to Enrollment Used for Impact Fee Calculations (6) 100% 100% 100% 100%
Total Facility Impact Cost per Student(7) $35,872 $38,003 $47,524 $39,846
DRAFT
Tindale Oliver Palm Beach County September 2015 II-10 Impact Fee Update Study
Total Cost per Student
In addition to the facility cost per student calculated in Table II-4, the total facility cost per
student includes two additional cost components: the capital costs associated with providing
transportation services and ancillary facilities. Both of these cost components are calculated
on a per-student basis and are not dependent on school type. Each of these additional cost
components is discussed in further detail below.
Transportation Costs
The first additional capital cost component is the cost of providing transportation services to
students. The District currently owns 855 buses used for student transportation at a value of
approximately $137,500 per bus, which reflects the estimates provided by the District. In
addition to its bus fleet, the District has 941 support vehicles, which include vehicles such as
cars, vans, trailers, and trucks. The current value of the support vehicles varies depending on
the type of vehicle, with an average value of approximately $19,600 per vehicle, based on the
information provided by the District. The result is a total value of $136 million for
transportation services, including $117.6 million for buses and $18.4 million for support
vehicles. The total value of the transportation fleet is divided by the District’s enrollment for
traditional schools as well as drop-out prevention/alternative education/ESE students who
attend District-owned schools and seven charter schools, as this is the total student
population benefiting from services provided by the District’s transportation fleet. The result
is a cost of $821 per student for transportation services, as presented in Table II-5.
Ancillary Facilities Costs
The other additional capital cost component is the ancillary facilities that are necessary for
the District to provide support services to students, schools, transportation services, and
administrative personnel. The District currently has approximately 740,000 FISH net square
feet of permanent ancillary facilities for maintenance, warehouse, and administrative
functions. Current costs for each existing ancillary facility depend on the type of facility and
were based on the insurance values of these facilities, with the weighted average cost
equaling $195 per square foot. It should be noted that the cost estimates for ancillary
facilities are consistent with costs of similar buildings observed in other jurisdictions
throughout Florida.
The cost of land for ancillary facilities also is included in the ancillary facility values. The land
value for ancillary facilities is estimated same as what was used for schools ($200,000 per
acre) since many of these facilities are on the same parcels as schools.
DRAFT
Tindale Oliver Palm Beach County September 2015 II-11 Impact Fee Update Study
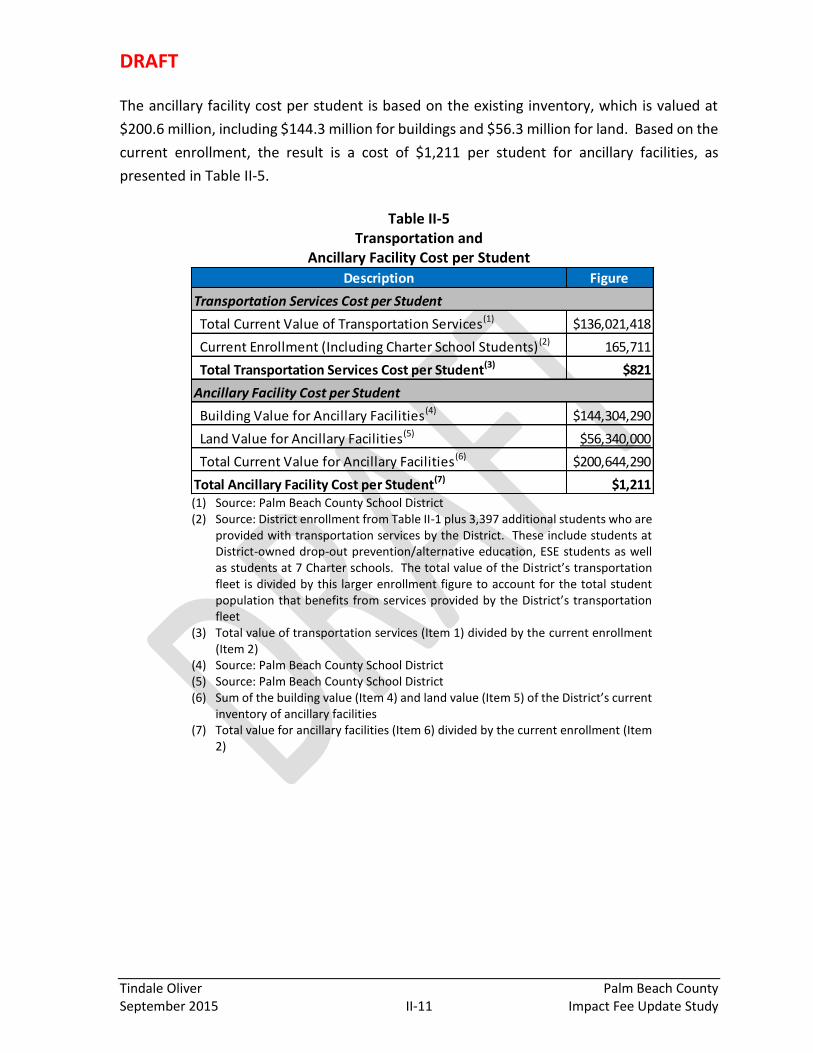
The ancillary facility cost per student is based on the existing inventory, which is valued at
$200.6 million, including $144.3 million for buildings and $56.3 million for land. Based on the
current enrollment, the result is a cost of $1,211 per student for ancillary facilities, as
presented in Table II-5.
Table II-5
Transportation and Ancillary Facility Cost per Student
(1) Source: Palm Beach County School District (2) Source: District enrollment from Table II-1 plus 3,397 additional students who are
provided with transportation services by the District. These include students at District-owned drop-out prevention/alternative education, ESE students as well as students at 7 Charter schools. The total value of the District’s transportation fleet is divided by this larger enrollment figure to account for the total student population that benefits from services provided by the District’s transportation fleet
(3) Total value of transportation services (Item 1) divided by the current enrollment (Item 2)
(4) Source: Palm Beach County School District (5) Source: Palm Beach County School District (6) Sum of the building value (Item 4) and land value (Item 5) of the District’s current
inventory of ancillary facilities (7) Total value for ancillary facilities (Item 6) divided by the current enrollment (Item
2)
Description Figure
Transportation Services Cost per Student
Total Current Value of Transportation Services(1) $136,021,418
Current Enrollment (Including Charter School Students) (2) 165,711
Total Transportation Services Cost per Student(3) $821
Ancillary Facility Cost per Student
Building Value for Ancillary Facilities(4) $144,304,290
Land Value for Ancillary Facilities(5) $56,340,000
Total Current Value for Ancillary Facilities(6) $200,644,290
Total Ancillary Facility Cost per Student(7) $1,211

DRAFT
Tindale Oliver Palm Beach County September 2015 II-12 Impact Fee Update Study
Credit Component
To ensure that new development is not being overcharged for construction of future student
stations, any non-impact fee revenue that will be generated by new development and that
will be used towards the capital expansion of school facilities must be included as a credit to
reduce the total cost per student. It is important to note that a credit for school impact fees
is not given for revenue generated by new development that is used for capital renovation of
existing educational facilities or for maintenance or operational costs.
Based on a review of the District’s capacity addition expenditures over the past five years and
planned expenditures over the next five years, it has been determined that revenue credits
will be calculated for cash expenditures as well as debt service funding.
Capital Improvement Credit
The Florida Statutes authorize several sources of revenue for school districts, such as Public
Education Capital Outlay (PECO) and Capital Outlay & Debt Service (CO & DS) that can be used
for the construction of capital facilities. With regard to State revenue, over the past five
years, the District used these resources almost exclusively for non-capacity capital projects.
The primary revenue sources for capacity projects were the School Capital Outlay Surtax
(0.5% sales tax) and capital improvement tax. Because the sales tax has expired in 2010 and
the associated fund balance is already depleted, a credit is not given for this revenue source.
The capital improvement revenue credit per student is calculated by dividing the total
amount of capital revenue by the average enrollment during this ten-year period. As
presented in Table II-6, the resulting capital improvement revenue available for the capital
expansion of public schools in Palm Beach County $12 per student per year.
Once the capital improvement credit per student is calculated, a credit adjustment is made
for the portion of the capital expansion credit per student funded with ad valorem revenues.
The credit is adjusted to account for the fact that new homes tend to pay higher taxes per
dwelling unit. This adjustment factor was estimated based on a comparison of the average
taxable value of homes built over the past five years to that of all homes. As shown in table
II-6, this adjusted credit amounts to $21 per student per year.
Finally, the total credit over a 25-year period, which is considered to be the time frame when
major repairs or replacement is needed for structures built, is estimated at $296 per student.

DRAFT
Tindale Oliver Palm Beach County September 2015 II-13 Impact Fee Update Study
Table II-6 Revenue Credit per Student
(1) Source: Palm Beach County School District, expenditures shown represent cash payments during the
indicated time period and excludes portions that were funded with bond issues or impact fee revenues, or outside of the time frame indicated.
(2) Total expenditures divided by 10 to calculate the average annual expenditures (3) Source: Table II-1 (4) Average annual expenditures (Item 2) divided by the average enrollment (Item 3) (5) Adjustment factor to reflect higher ad valorem taxes paid by new homes (6) Revenue credit per student (Item 4) multiplied by the credit adjustment factor (Item 5) (7) Interest rate the District is likely to pay for future bonds, estimated based on interest rate on recent COPs
issues (8) Time period after which major repairs are needed (9) Present value of adjusted revenue credit per student (Item 6) at 5.0% interest rate (Item 7) over a 25-year
capitalization period (Item 8)
Debt Service Credit per Student
The District has been using Certificates of Participation (COPs) and other types of bonds to
pay for a portion of the capacity expansion projects. Given that there is still an outstanding
debt service on COPs, a credit is calculated for future debt service payments related to
capacity expansion projects. The District uses primarily local capital outlay millage to pay the
debt service.
Project Type 2010-2014 2015-2019 Total
Capital Improvement Tax/Local Funding (1) :
Additions $13,316,424 $1,706,210 $15,022,634
New Schools $158,576 - $158,576
Site Acquistions $4,236,184 $4,236,184
Ancillary Facility Construction $135,793 - $135,793
Subtotal - Local Funding $17,846,977 $1,706,210 $19,553,187
State Funding (1) :
Additions $2,861 $2,861
New Schools - - $0
Site Acquistions - - $0
Ancillary Facility Construction - - $0
Subtotal - State Funding $2,861 $0 $2,861
Total Expenditures $17,849,838 $1,706,210 $19,556,048
$1,955,605
162,773
$12
1.75
$21
5.0%
25
$296
Average Annual Expenditures(2)
Average Enrollment(3)
Credit Adjustment Factor(5)
Capitalization Rate(7)
Capitalization Period, Years(8)
Revenue Credit per Student(4)
Adjusted Revenue Credit per Student(6)
Present Value of Capital Improvement Revenue Credit per Student(9)

DRAFT
Tindale Oliver Palm Beach County September 2015 II-14 Impact Fee Update Study
A revenue credit is calculated for the remaining portion of each outstanding COP/bond issue
used to fund capacity expansion projects that will be paid back with non-impact fee revenue
sources. The remaining payments were brought back to present value, based on the
remaining number of years and average annual interest rate. A similar adjustment made to
the capital expansion credit is needed for the debt obligations being repaid with ad valorem
revenues. As presented in Table II-7, the debt service credit is $6,235 per student.
Table II-7 Debt Service Credit per Student
(1), (2) Source: Palm Beach County School District. (3) Present value of the total remaining payments due, based on the interest rate of each payment
and the number of years of remaining payments. (4) Source: Table II-1 (5) Present value of total remaining payments (Item 3) divided by the average annual enrollment
over the life of the remaining payments (Item 4) (6) Adjustment factor to reflect higher ad valorem taxes paid by new homes (7) Total debt service credit per student multiplied by the credit adjustment factor (Item 6)
Description
Number of
Years of
Remaining
Payments(1)
Remaining
Payments Due
for Expansion(2)
Present Value
of Total
Remaining
Payments(3)
Average
Annual
Enrollment(4)
Debt Service
Credit per
Student(5)
Certificates of Participation
COPS 2002E Issue 1 $2,366,203 $2,275,195 163,218 $14
COPS 2003B Issue 14 $41,308,033 $27,716,965 173,861 $159
COPS 2005A Issue 7 $86,598,489 $74,255,040 167,871 $442
COPS 2006A Issue 16 $39,509,593 $27,446,758 175,481 $156
COPS 2007A Issue 16 $45,266,722 $29,392,802 175,481 $167
COPS 2007C Issue 12 $162,780,792 $114,143,270 172,226 $663
COPS 2007E Issue 17 $92,541,941 $61,643,451 176,287 $350
COPS 2011A Issue 17 $66,963,016 $41,490,004 176,287 $235
COPS 2011C Issue 3 $5,632,377 $5,491,300 164,107 $33
COPS 2011D Issue 6 $23,523,382 $21,660,340 166,875 $130
COPS 2012A Issue 13 $17,246,326 $10,624,966 173,046 $61
COPS 2012B Issue 13 $88,854,952 $56,722,024 173,046 $328
COPS 2012C Issue 14 $15,662,465 $11,145,751 173,861 $64
COPS 2014A Issue 12 $57,091,325 $41,332,890 172,226 $240
COPS 2014B Issue 10 $107,742,605 $83,524,519 170,554 $490
QZAB 2002 Issue 1 $135,714 $135,714 163,218 $1
QZAB 2004 Issue 5 $882,711 $882,711 165,905 $5
QZAB 2005 Issue 6 $753,399 $753,399 165,404 $5
COBI 2011A Issue 8 $4,026,725 $3,415,215 168,803 $20
Total Debt Service Credit per Student $3,563
Credit Adjustment Factor(6) 1.75
Adjusted Total Debt Service Credit per Student(7) $6,235

DRAFT
Tindale Oliver Palm Beach County September 2015 II-15 Impact Fee Update Study
Net Impact Cost per Student
The net impact fee per student is the difference between the cost component and the
credit component. Table II-8 summarizes the three-step process used to calculate the net
impact cost per student for public schools in Palm Beach County by residential land use for
each fee schedule option.
First, the total impact cost per student is determined, which is the sum of the weighted
average facility impact cost per student from Table II-4 and the transportation and ancillary
facility cost components per student from Table II-5. As previously mentioned, the
transportation and ancillary cost components are calculated on a per-student basis and do
not differ by type of school or by type of residential land use.
Second, the total revenue credit per student is determined. This is the sum of the capital
improvement credit per student and the debt service credit per student presented in Tables
II-6 and Table II-7.
Third, the net impact cost per student is determined, which is the difference between the
total impact cost per student and total revenue credit per student.

DRAFT
Tindale Oliver Palm Beach County September 2015 II-16 Impact Fee Update Study
Table II-8 Net Impact Cost per Student
(1) Source: Table II-4 (2) Source: Table II-5 (3) Source: Table II-5 (4) Sum of the total facility impact cost per student (Item 1),
transportation service cost per student (Item 2), and ancillary facility cost per student (Item 3)
(5) Source: Table II-6 (6) Source: Table II-7 (7) Sum of the capital improvement revenue credit per
student (Item 5) and the debt service credit per student (Item 6)
(8) The net impact cost per student is the total impact cost per student (Item 4) less the total revenue credit per student (Item 7)
Student Generation Rates
The number of students living in a household typically varies depending on the type of
residential housing. Therefore, school impact fees are typically assessed based on the specific
student generation rates for different types of residential land uses. Palm Beach County’s
updated school impact fee schedule includes four land uses: single family detached/mobile
homes on an individual lot, townhouses, multi-family (condominiums and apartments), and
mobile home parks.
This impact fee study employs a methodology using Geographic Information Systems (GIS) to
develop the student generation rate for Palm Beach County. Specifically, GIS was used to link
student addresses to parcels in the Palm Beach County Property Appraiser’s database in order
to generate the number of students per unit by school type and land use based on the latest
tax roll. This process is described in more detail in the following sections.
Total Impact Cost Per Student
Facility Impact Cost(1) $39,846
Transportation Impact Cost(2) $821
Ancillary Facility Cost(3) $1,211
Total Impact Cost per Student(4) $41,878
Revenue Credit Per Student
Capital Improvement Credit(5) $296
Debt Service Credit(6) $6,235
Total Revenue Credit per Student(7) $6,531
Net Impact Cost Per Student
Net Impact Cost per Student(8) $35,347
DRAFT
Tindale Oliver Palm Beach County September 2015 II-17 Impact Fee Update Study
Determination of Total Housing Units by Type of Land Use
Depending on the purpose, there are multiple ways a dwelling unit can be classified in terms
of the type of residential land use. For the purposes of this analysis, the number of building
units for each land use obtained from the Palm Beach County Property Appraiser’s database
was supplemented by additional analysis and counts provided by the Property Appraiser’s
Office to ensure all relevant units were included. In addition, an effort was made to exclude
age restricted units since these do not generate students and are not subject to the school
impact fee.
Determination of Students by School Type and Land Use
The determination of the number of students per land use by type of school (e.g., elementary,
middle, and high school) for traditional schools was completed using the following process.
First, Palm Beach County School District provided a GIS shapefile containing geocoded
student addresses. Then, the student addresses were linked to its respective parcel in the
Property Appraiser database using address point data.
The student generation rates used as the demand component for the impact fee only includes
those students for which the impact fee is based, or students attending traditional schools
listed in Appendix B, Table B-1. Therefore, the school code associated with each student
record was used to exclude students attending schools or other facilities not included in the
impact fee inventory, such as charter schools, private schools, etc. In addition, the grade level
field for each student record was used to calculate the student generation rates by school
type (e.g., elementary, middle, high).
As previously mentioned, once the GIS shapefile with the geocoded student addresses was
provided, the second step in the analysis was to link each student address to data from the
parcel database. This allows for determining which type of land use is assigned to a given
parcel (or address) where a student lives. This was accomplished by spatially joining the
student address to the respective parcel in the database using GIS. Based on this analysis,
over 94 percent of the student addresses were able to be matched to the properties in the
Palm Beach County Property Appraiser’s database and 93 percent were linked to a residential
land use. The Parcel ID’s associated with the remaining student addresses were either not
found or suggested a non-residential land use. The result of this analysis is presented in Table
II-9.

DRAFT
Tindale Oliver Palm Beach County September 2015 II-18 Impact Fee Update Study
Table II-9 Student Generation Rates
(1) Source: Palm Beach County Property Appraiser, excludes age-restricted
units (2) Source: Palm Beach County (3) Number of Students (Item 2) divided by the number of units (Item 1) for
each residential type
Residential Land Use
Total
Housing
Units(1)
Number of
Students(2)
Students
per Unit(3)
Single Family (detached) / Mobile Homes on Lot
Less than 1,500 sf 54,437 21,606 0.397
1,500 to 2,499 sf 90,130 39,049 0.433
2,500 sf or more 136,666 43,656 0.319
Single Family (Total) 281,233 104,311 0.371
Multi-Family (Townhouses/Apartments/Condominiums)
Townhouses 61,493 13,807 0.225
Low-Rise Apts/Condos 214,882 34,698 0.161
High-Rise Apts/Condos 73,318 2,008 0.027
Mobile Home Parks
Mobile Home Parks 12,404 5,891 0.475
Total/Weighted Average 581,837 146,908 0.252
DRAFT
Tindale Oliver Palm Beach County September 2015 II-19 Impact Fee Update Study
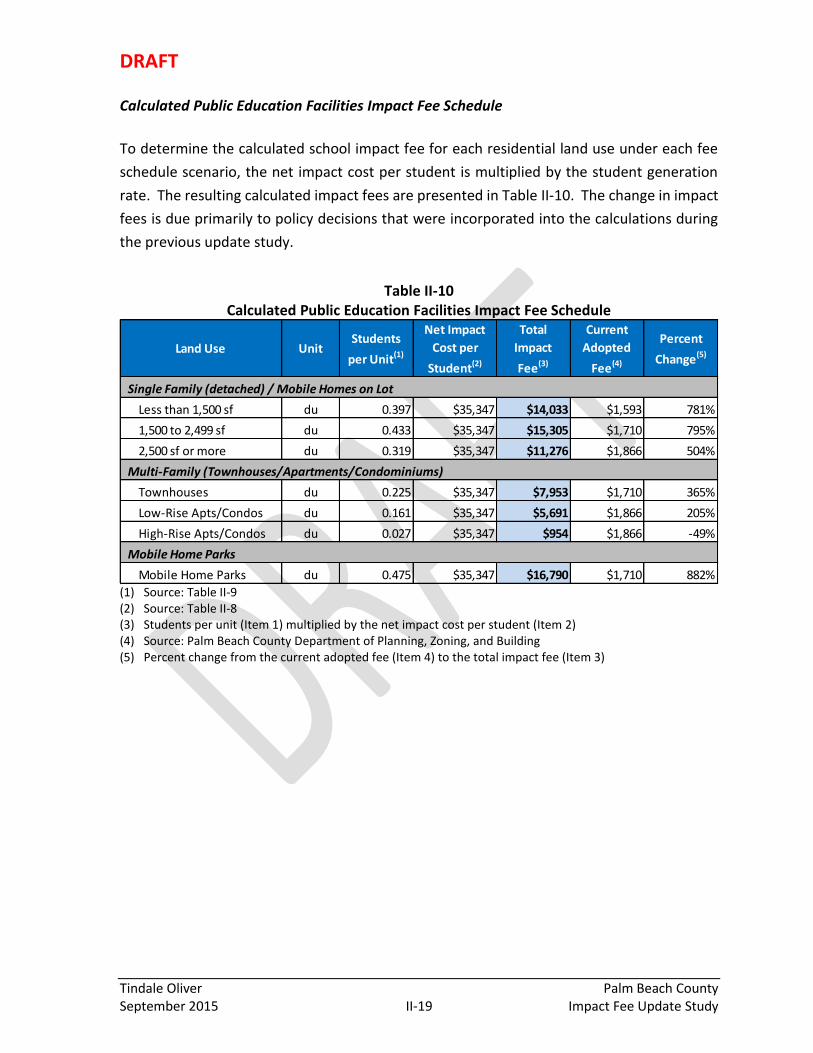
Calculated Public Education Facilities Impact Fee Schedule
To determine the calculated school impact fee for each residential land use under each fee
schedule scenario, the net impact cost per student is multiplied by the student generation
rate. The resulting calculated impact fees are presented in Table II-10. The change in impact
fees is due primarily to policy decisions that were incorporated into the calculations during
the previous update study.
Table II-10 Calculated Public Education Facilities Impact Fee Schedule
(1) Source: Table II-9 (2) Source: Table II-8 (3) Students per unit (Item 1) multiplied by the net impact cost per student (Item 2) (4) Source: Palm Beach County Department of Planning, Zoning, and Building (5) Percent change from the current adopted fee (Item 4) to the total impact fee (Item 3)
Land Use UnitStudents
per Unit(1)
Net Impact
Cost per
Student(2)
Total
Impact
Fee(3)
Current
Adopted
Fee(4)
Percent
Change(5)
Single Family (detached) / Mobile Homes on Lot
Less than 1,500 sf du 0.397 $35,347 $14,033 $1,593 781%
1,500 to 2,499 sf du 0.433 $35,347 $15,305 $1,710 795%
2,500 sf or more du 0.319 $35,347 $11,276 $1,866 504%
Multi-Family (Townhouses/Apartments/Condominiums)
Townhouses du 0.225 $35,347 $7,953 $1,710 365%
Low-Rise Apts/Condos du 0.161 $35,347 $5,691 $1,866 205%
High-Rise Apts/Condos du 0.027 $35,347 $954 $1,866 -49%
Mobile Home Parks
Mobile Home Parks du 0.475 $35,347 $16,790 $1,710 882%

DRAFT
Tindale Oliver Palm Beach County September 2015 II-20 Impact Fee Update Study
Public Education Facilities Impact Fee Schedule Comparison
As part of the work effort in updating Palm Beach County’s school impact fee program, a
comparison of the calculated single family school impact fees for Palm Beach County is made
to the single family school impact fees adopted by other counties throughout Florida has
been prepared. Table VI-11 presents this comparison. For those where the information was
available, the percentage that the impact fee was adopted at is shown.
Table II-11
Public Education Facilties Impact Fee Schedule Comparison
* County fees are currently suspended (1) Represents percent assessed compared to the full calculated fee. The difference indicates
adjustments due to policy decisions or indexing. (2) Source: County Impact Fee Schedules. Fees presented are for a 3-bedroom or a 2,000-square foot
single family home. (3) Represents maximum calculated rate at the time of technical study.
County(1)
Date of
Last
Update
Adoption
Percentage
Adopted
Single Family
Impact Fee(2)
Single Family
Impact Fee
@100%(3)
Brevard County 2004 100% $4,445 $4,445
Citrus County 2010 50% $1,936 $3,871
Sarasota County* 2004 100% $2,032 $2,032
Lake County 2011 25% $2,573 $10,292
Volusia County 2013 67% $3,000 $4,483
Flagler County 2004 76% $3,600 $4,756
Marion County* 2006 54% $3,967 $7,375
Hillsborough County 2007 100% $4,000 $4,000
Polk County 2010 44% $4,160 $9,456
Palm Beach County Current Adopted 2012 95% $1,866 $1,964
Pasco County 2005 100% $4,876 $4,313
Seminole County 2007 99% $5,000 $5,068
Collier County 2011 50% $5,378 $10,755
Martin County 2006 100% $5,567 $4,555
Highlands County* 2006 50% $2,901 $5,801
St. Johns County 2011 100% $6,242 $5,779
St. Lucie County 2009 100% $6,188 $5,447
Manatee County* 2004 100% $6,350 $5,886
Orange County 2007 55% $6,525 $11,829
Clay County 2009 77% $7,034 $9,096
Hernando County* 2013 100% $7,103 $7,103
Broward County 2007 80% $7,804 $9,755
Osceola County 2010 90% $8,702 $9,669
Palm Beach County Calculated 2014 100% N/A $15,305
DRAFT
Tindale Oliver Palm Beach County September 2015 III-1 Impact Fee Update Study
III. Parks & Recreation Impact Fee
This section discusses the analysis used in the update of the parks and recreation impact fee.
To update the parks and recreation impact fee schedule, there are several major elements
that need to be addressed, including:
Inventory of Land and Recreation Facilities
Service Area and Population
Level of Service
Cost Component
Credit Component
Net Parks & Recreation Facilities Impact Cost
Calculated Parks & Recreation Facilities Impact Fee Schedule
Parks & Recreation Facilities Impact Fee Schedule Comparison
Parks & Recreation Facilities Impact Fee Benefit Districts
These elements are summarized throughout this section, with the result being the proposed
parks and recreation impact fee schedule.
Inventory of Land and Recreation Facilities
Palm Beach County parks inventory used to calculate the impact fee includes regional, beach
and parks. Smaller parks such as community and neighborhood parks, are not included in the
inventory because of their limited service areas. Total acreage associated with the parks in
the inventory includes 5,493 developed acres and 7,917 total acres.
Service Area and Population
Palm Beach County provides regional, beach, and district parks; as well as, recreation facilities
and services throughout the entire county. As a result, the parks and recreation impact fee
analysis will utilize countywide population figures. Appendix A, Table A-1, provides the
estimated countywide area population for 2014 and the projected population through 2040.
Appropriate benefit districts for parks and recreation facilities are addressed at the end of
this section.

DRAFT
Tindale Oliver Palm Beach County September 2015 III-2 Impact Fee Update Study
Parks impact fees are charged only to residential land uses. As such, the weighted seasonal
population per housing unit is used to measure demand from each residential land use.
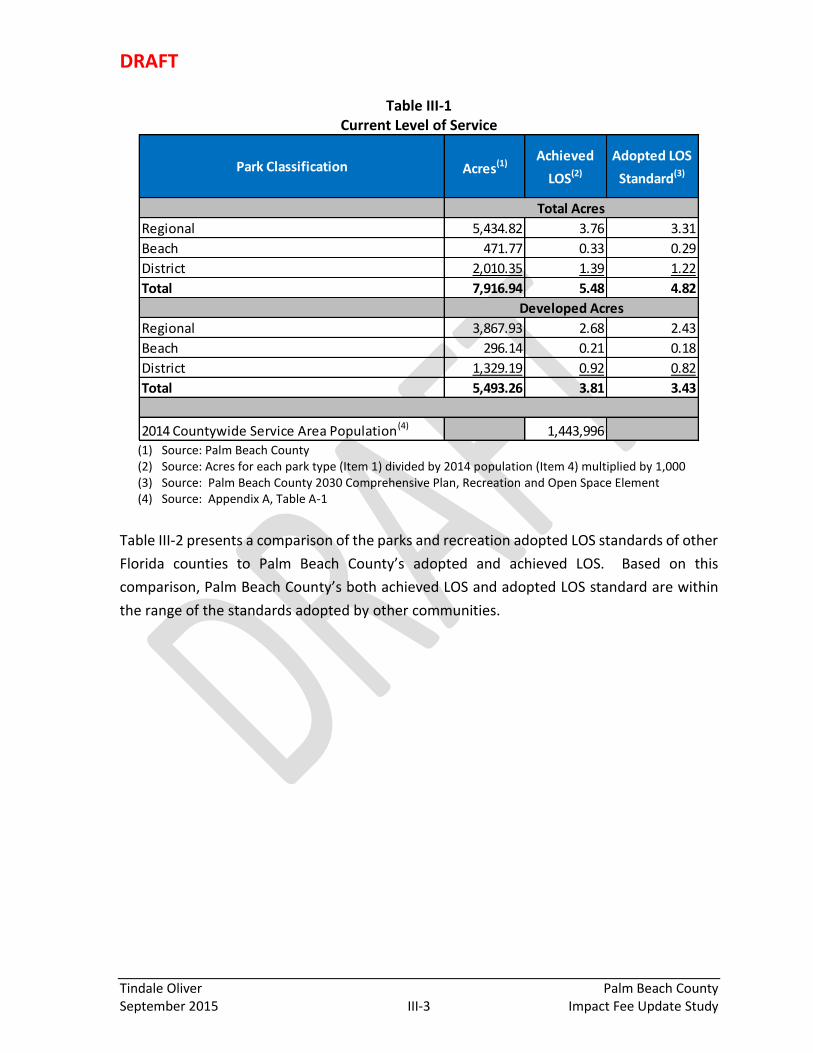
Level of Service
As shown in Table III-1, the achieved LOS for all county-owned and maintained parks is higher
than the adopted LOS standard for all park types. Currently, the achieved LOS ranges from
0.33 total acres per 1,000 residents for beach parks to 3.76 total acres per 1,000 residents for
regional parks. Additionally, the achieved LOS for developed acres ranges from 0.21 acres
per 1,000 residents for beach parks to 2.68 acres per 1,000 residents for regional parks. For
all park types, the achieved LOS is 5.48 total acres per 1,000 residents and 3.81 developed
acres per 1,000 residents. Because the adopted LOS standards are lower than achieved LOS,
adopted standards are used for the remaining impact fee calculations. This is to ensure that
new development is not overcharged since the County’s adopted standards suggest some of
the existing capacity is due to temporal fluctuations and the County does not intend to
maintain the current achieved LOS.
For the purposes of impact fee calculations, LOS is generally measured in terms of the net
capital asset value per resident. However, for planning and tracking purposes, it is typically
attached to acreage in the case of parks impact fees.
DRAFT
Tindale Oliver Palm Beach County September 2015 III-3 Impact Fee Update Study
Table III-1 Current Level of Service
(1) Source: Palm Beach County (2) Source: Acres for each park type (Item 1) divided by 2014 population (Item 4) multiplied by 1,000 (3) Source: Palm Beach County 2030 Comprehensive Plan, Recreation and Open Space Element (4) Source: Appendix A, Table A-1
Table III-2 presents a comparison of the parks and recreation adopted LOS standards of other
Florida counties to Palm Beach County’s adopted and achieved LOS. Based on this
comparison, Palm Beach County’s both achieved LOS and adopted LOS standard are within
the range of the standards adopted by other communities.
Park Classification Acres(1)Achieved
LOS(2)
Adopted LOS
Standard(3)
Regional 5,434.82 3.76 3.31
Beach 471.77 0.33 0.29
District 2,010.35 1.39 1.22
Total 7,916.94 5.48 4.82
Regional 3,867.93 2.68 2.43
Beach 296.14 0.21 0.18
District 1,329.19 0.92 0.82
Total 5,493.26 3.81 3.43
2014 Countywide Service Area Population(4) 1,443,996
Total Acres
Developed Acres

DRAFT
Tindale Oliver Palm Beach County September 2015 III-4 Impact Fee Update Study
Table III-2 Level of Service Comparison (Adopted)
(1) Source: Miami-Dade County Comprehensive Development
Master Plan; 2.75 acres for Local parks (2) Source: Martin County FY 2015 Capital Improvement Plan; 3.0
acres for developed active parkland (3) Source: Collier County Annual Update and Inventory Report; 1.2
acres for community parks and 2.7 acres for regional parks (4) Source: Hendry County Comprehensive Plan; 2.0 acres or
greater for community parks and 2.0 acres or greater for neighborhood parks
(5) Source: Table III-1 (6) Source: Table III-1 (7) Source: Okeechobee County Parks & Recreation Master Plan;
5.5 acres for all parks (8) Source: Broward County Comprehensive Plan; 3.0 acres for local
parks and 3.0 acres for regional parks (9) Source: Orange County Comprehensive Plan (2010 - 2030); 1.5
acres for activity based parkland and trails and 6.0 acres for publicly owned resource based parkland
(10) Highlands County 2030 Comprehensive Plan; 10 acres for developed parkland
(11) Comprehensive Plan for Unincorporated Hillsborough County Florida; 1.6 acre for neighborhood parks, 1.6 acres for district parks, 20 acres for regional parks, and 3.4 acres for local parks
(12) Source: St. Lucie County Comprehensive Plan; 5.0 acres for community parks, 2.5 acres for regional parks, and 21.2 acres for resource-based parks
Jurisdiction
LOS Standard
(Acres per 1,000
Residents)
Miami - Dade County(1) 2.75
Martin County(2) 3.00
Collier County(3) 3.90
Hendry County(4) 4.00
Palm Beach County (Adopted)(5) 4.82
Palm Beach County (Achieved)(6) 5.48
Okeechobee County(7) 5.50
Broward County(8) 6.00
Orange County(9) 7.50
Highlands County(10) 10.00
Hillsborough County(11) 25.20
St. Lucie County(12) 28.70
Average (excluding PBC) 9.66

DRAFT
Tindale Oliver Palm Beach County September 2015 III-5 Impact Fee Update Study
Cost Component
The total cost per resident for parks and recreation facilities consists of two components: the
cost of purchasing and developing land for each park and the cost of facilities and equipment
located at each park.
Land Cost
Because of recent fluctuations in land values statewide, a detailed analysis of land values for
each type of park was conducted. This analysis takes into consideration current land value of
the existing parks as reported by the Palm Beach County Property Appraiser as well as an
analysis of recent sales of vacant land similar in size and location to Palm Beach County’s
parks. Based on this analysis, an average land value of $50,000 per acre for district parks,
$60,000 per acre for regional parks, and $865,000 per acre for beach parks are used in the
impact fee calculations. Appendix C provides the data used for this analysis.
Park Development and Recreational Facility Costs
The second step in calculating the total cost for parks and recreation services in Palm Beach
County involves estimating the site development and recreational facility costs. The cost of
land for parks and recreation facilities includes more than just the purchase cost of the land.
Landscaping/site improvement and utilities/paving costs are also considered. These costs
can vary greatly, depending on the type of services offered at each park. In addition,
recreational facility costs tend to vary depending on the facility characteristics, size and
scope.
Park development and recreational facility costs were estimated based on historical data
provided by the County’s Parks and Recreation Department and were estimated at $200,000
per acre for district parks, $80,000 per acre for regional parks, and $640,000 per acre for
beach parks. Appendix C provides further detail on these estimates.
As presented in Table III-3, the total park land and facility value is $636 million for regional
parks, $598 million for beach parks, and $366 million for district parks, for a total of $1.6
billion, including land, site development, facilities, equipment, and architecture and
engineering (A&E) costs. This cost results in an overall value of approximately $202,000 per
acre and $977 per resident.

DRAFT
Tindale Oliver Palm Beach County September 2015 III-6 Impact Fee Update Study
Table III-3 Land and Facility Cost per Resident
(1) Source: Appendix C (2) Source: Table III-1 (3) Land purchase cost per acre (Item 1) multiplied by total acres (Item 2) (4) Source: Appendix C (5) Source: Table III-1 (6) Park development and facility value per developed acre (Item 4) multiplied by developed acres (Item 5) (7) Sum of total land value (Item 3) and total facility value (Item 6) (8) Total land and facility value (Item 7) divided by total acres (Item 2) (9) Table III-1 (10) Total land and facility value (Item 7) multiplied by the adopted LOS standard (Item 9) divided by 1,000
Regional Beach DistrictTotal/ Weighted
Average
Land Purchase Cost per Acre (1) $60,000 $865,000 $50,000 $105,431
Total Acres(2) 5,434.82 471.77 2,010.35 7,916.94
Total Land Value(3) $326,089,200 $408,081,050 $100,517,500 $834,687,750
Park Development and Facility Value per Develped Acre (4) $80,000 $640,000 $200,000 $139,226
Developed Acres(5) 3,867.93 296.14 1,329.19 5,493.26
Total Facility Value(6) $309,434,400 $189,529,600 $265,838,000 $764,802,000
Total Land and Facility Value(7) $635,523,600 $597,610,650 $366,355,500 $1,599,489,750
Total Land and Facility Value per Acre (8) $116,936 $1,266,742 $182,235 $202,034
Adopted LOS Standard(9) 3.31 0.29 1.22 4.82
Total Land and Facility Value per Resident(10) $387.06 $367.36 $222.33 $976.75
Park Type
Variable/Calculation Step
Land Value:
Park Development and Facility Value:

DRAFT
Tindale Oliver Palm Beach County September 2015 III-7 Impact Fee Update Study
Credit Component
To avoid overcharging new development for the capital cost of providing parks and recreation
services, a review of the capital funding program for the parks and recreation program was
completed. The purpose of this review was to estimate any future revenues generated by
new development, other than impact fees, which will be used to fund the expansion of capital
facilities and land related to Palm Beach County’s parks and recreation program.
Capital Expansion Expenditures Credit
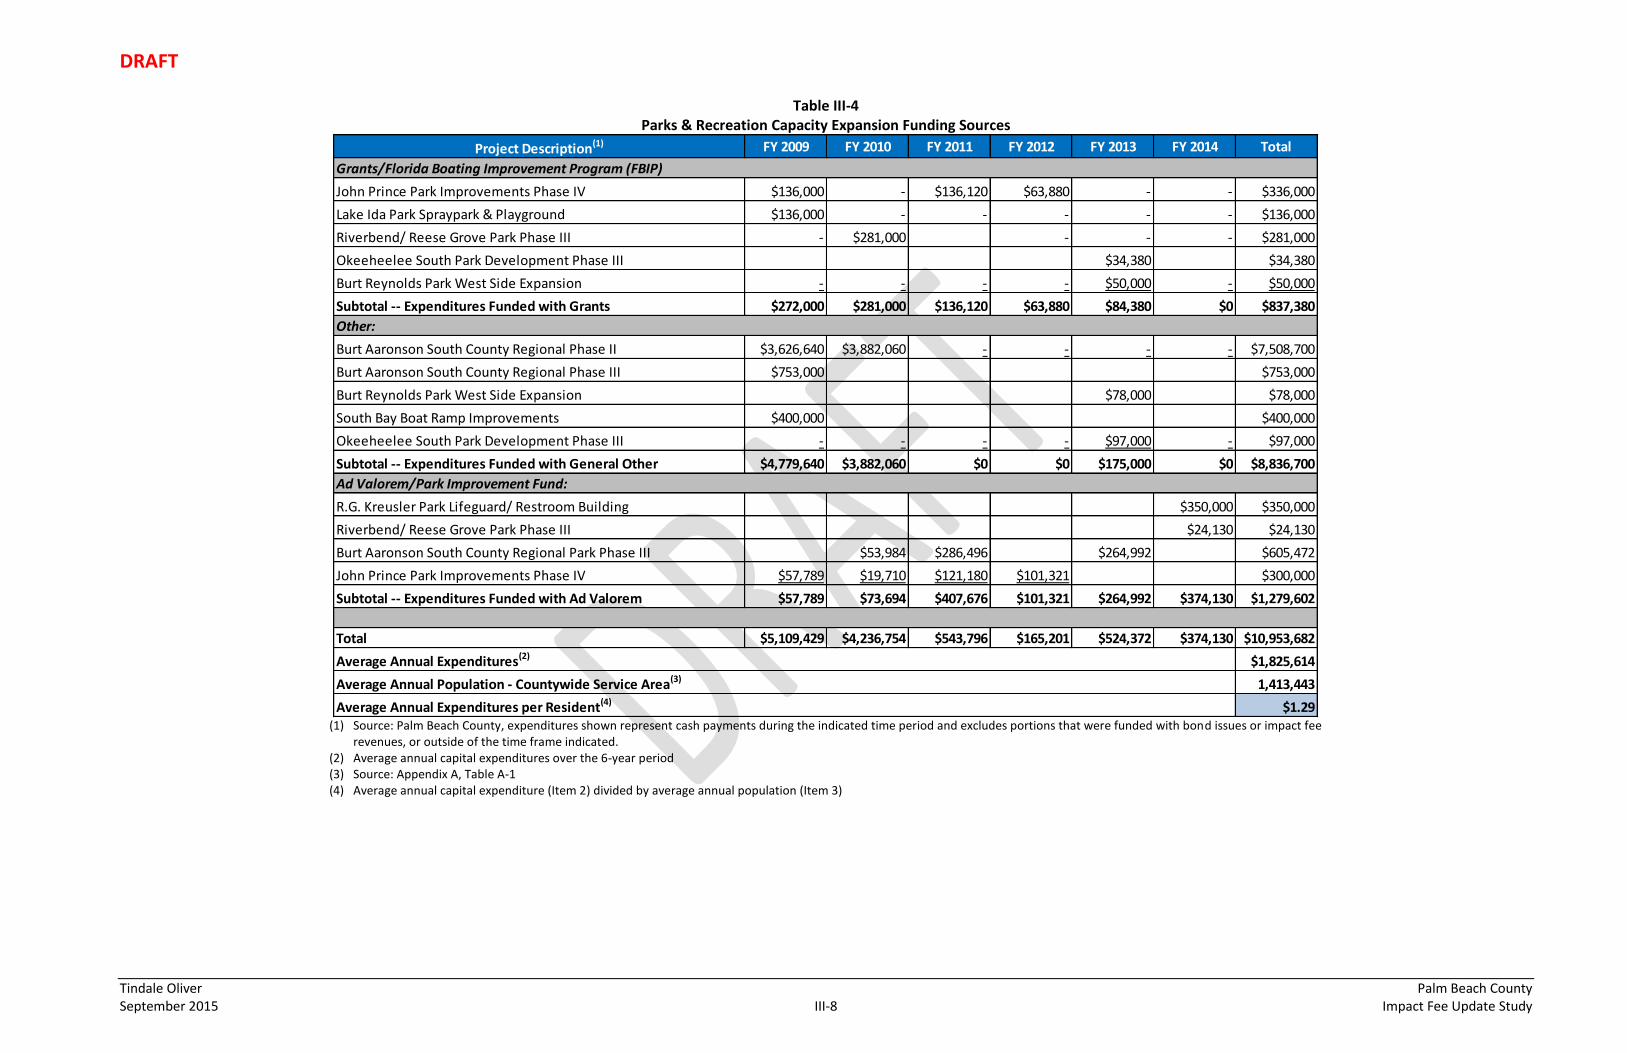
Between 2009 and 2014, Palm Beach County spent a total of approximately $11.0 million for
capital expansion of parks. These expenditures were funded with grants, ad valorem tax
revenues, and other general revenues. Since the review of these expenditures spanned FY
2009 through FY 2014, the average annual capital expansion cost is divided by the average
population for this same period. As presented in Table III-4, the average annual capital
expansion expenditure is $1.29 per resident.
DRAFT
Tindale Oliver Palm Beach County September 2015 III-8 Impact Fee Update Study
Table III-4 Parks & Recreation Capacity Expansion Funding Sources
(1) Source: Palm Beach County, expenditures shown represent cash payments during the indicated time period and excludes portions that were funded with bond issues or impact fee
revenues, or outside of the time frame indicated. (2) Average annual capital expenditures over the 6-year period (3) Source: Appendix A, Table A-1 (4) Average annual capital expenditure (Item 2) divided by average annual population (Item 3)
Project Description(1) FY 2009 FY 2010 FY 2011 FY 2012 FY 2013 FY 2014 Total
Grants/Florida Boating Improvement Program (FBIP)
John Prince Park Improvements Phase IV $136,000 - $136,120 $63,880 - - $336,000
Lake Ida Park Spraypark & Playground $136,000 - - - - - $136,000
Riverbend/ Reese Grove Park Phase III - $281,000 - - - $281,000
Okeeheelee South Park Development Phase III $34,380 $34,380
Burt Reynolds Park West Side Expansion - - - - $50,000 - $50,000
Subtotal -- Expenditures Funded with Grants $272,000 $281,000 $136,120 $63,880 $84,380 $0 $837,380
Other:
Burt Aaronson South County Regional Phase II $3,626,640 $3,882,060 - - - - $7,508,700
Burt Aaronson South County Regional Phase III $753,000 $753,000
Burt Reynolds Park West Side Expansion $78,000 $78,000
South Bay Boat Ramp Improvements $400,000 $400,000
Okeeheelee South Park Development Phase III - - - - $97,000 - $97,000
Subtotal -- Expenditures Funded with General Other $4,779,640 $3,882,060 $0 $0 $175,000 $0 $8,836,700
Ad Valorem/Park Improvement Fund:
R.G. Kreusler Park Lifeguard/ Restroom Building $350,000 $350,000
Riverbend/ Reese Grove Park Phase III $24,130 $24,130
Burt Aaronson South County Regional Park Phase III $53,984 $286,496 $264,992 $605,472
John Prince Park Improvements Phase IV $57,789 $19,710 $121,180 $101,321 $300,000
Subtotal -- Expenditures Funded with Ad Valorem $57,789 $73,694 $407,676 $101,321 $264,992 $374,130 $1,279,602
Total $5,109,429 $4,236,754 $543,796 $165,201 $524,372 $374,130 $10,953,682
$1,825,614
1,413,443
$1.29
Average Annual Expenditures(2)
Average Annual Population - Countywide Service Area(3)
Average Annual Expenditures per Resident(4)

DRAFT
Tindale Oliver Palm Beach County September 2015 III-9 Impact Fee Update Study
Debt Service Credit
Any outstanding bond issues related to the expansion of parks and recreation facilities also
will result in a credit to the impact fee. Currently, Palm Beach County is paying for debt
service on general obligation bonds used for parks capacity expansion projects.
To calculate the credit of the outstanding loan, the present value of the total remaining
payments of the bond issue is calculated and then divided by the average annual population
estimated over the remaining life of the bond issue. As presented in table III-5, the resulting
credit is $3.90 per resident.
Once the debt service credit per resident is calculated, because the County is using ad
valorem tax revenues to pay the debt service, an adjusted credit figure is calculated. For
residential land uses, the debt service credit per resident funded with ad valorem revenues
is adjusted to account for the fact that new homes tend to pay higher taxes per dwelling unit.
This adjustment factor was estimated based on a comparison of the average taxable value of
homes built over the past five years to that of all homes. As presented in Table III-5, the
adjusted debt service credit per resident is $6.83.
Table III-5
Debt Service Credit
(1), (2), (3), (4) Source: Palm Beach County (5) Source: Appendix A, Table A-1 (6) Present value of payments remaining (Item 4) divided by average annual population (Item 5) (7) Adjustment factor to reflect higher ad valorem taxes paid by new homes (8) Debt service credit per resident ($3.90) multiplied by the credit adjustment factor (Item 7)
Description
Total Number of
Fiscal Years of
Debt Issue(1)
Fiscal Years
Remaining(2)
Total Remaining Parks
& Rec. Debt Service
(Capacity Expansion)(3)
Present Value of
Payments Remaining
(Capacity Expansion)(4)
Avg Annual
Population During
Remaining Bond
Issue Period(5)
Credit per
Resident(6)
General Obligation Bonds, Series 2010 15 11 $7,510,944 $6,027,138 1,546,898 $3.90
Credit Adjustment Factor(7) 1.75
Residential Land Uses -- Adjusted Debt Service Credit per Resident(8) $6.83

DRAFT
Tindale Oliver Palm Beach County September 2015 III-10 Impact Fee Update Study
Net Parks & Recreation Impact Cost per Resident
The net impact fee per resident is the difference between the Cost Component and the Credit
Component. Table III-6 summarizes the calculation of the net impact cost per resident.
Table III-6
Net Parks & Recreation Impact Cost per Resident
(1) Source: Table III-3 (2) Source: Table III-4 (3) Source: The present value of the capital improvement credit per resident
(Item 2) at a discount rate of 3.4% with a capitalization period of 25 years. Capitalization rate estimate is provided by Palm Beach County and 25 years reflects the time frame when structures start needing major repairs/renovation.
(4) Source: Table III-5 (5) Total impact cost per resident (Item 1) less capital expansion credit per
resident (Item 3) less debt service credit resident (Item 4)
Impact Cost / Credit Element Figure
Total Impact Cost per Resident(1) $976.75
Avg Annual Capital Expansion Credit per Resident(2) $1.29
Capitalization Rate 3.4%
Capitalization Period (in years) 25
Capital Expansion Credit per Resident(3) $21.49
Debt Service Credit per Resident(4):
- Residential Units $6.83
- Hotel/Motel $3.90
Net Impact Cost per Resident(5):
- Residential Units $948.43
- Hotel/Motel $951.36
Net Impact Cost
Revenue Credit
Impact Cost

DRAFT
Tindale Oliver Palm Beach County September 2015 III-11 Impact Fee Update Study
Calculated Parks & Recreation Impact Fee Schedule
Table III-7 presents the updated parks and recreation impact fee schedule for residential land
uses in Palm Beach County, based on the net impact cost per resident figures presented in
table III-6.
Table III-7 Parks & Recreation Impact Fee Schedule
(1) Source: Appendix A, Tables A-2 (2) Source: Table III-6 (3) Residents per unit (Item 1) for each land use category multiplied by the net cost per resident (Item 2) (4) Source: Palm Beach County Department of Planning, Zoning, and Building (5) Percent change from the current adopted rates (Item 4) to the calculated total impact fee rate (Item 3)
Parks & Recreation Impact Fee Schedule Comparison
As part of the work effort in updating Palm Beach County’s parks & recreation impact fee
schedule, the County’s calculated impact fee schedule was compared to the adopted fee
schedule and those in similar or nearby jurisdictions. Table III-8 presents this comparison.
Land UseImpact
Unit
Residents
per Unit(1)
Net Cost per
Resident(2)
Total
Impact
Fee(3)
Current
Adopted
Fee(4)
Percent
Change(5)
Residential
Single Family/Townhouse (less than 1,500 sf) du 2.35 $948.43 $2,229 $734 204%
Single Family/Townhouse (1,500 to 2,499 sf) du 2.55 $948.43 $2,418 $788 207%
Single Family/Townhouse (2,500 sf or more) du 2.83 $948.43 $2,684 $860 212%
Multi-Family (Apartment/Condo) du 1.46 $948.43 $1,385 $788 76%
Accessory Apartment/Grooms Quarters du 1.46 $948.43 $1,385 $734 89%
Mobile Home du 2.45 $948.43 $2,324 $734 217%
Hotel/Motel room 1.39 $951.36 $1,322 $273 384%

DRAFT
Tindale Oliver Palm Beach County September 2015 III-12 Impact Fee Update Study
Table III-8 Parks & Recreation Impact Fee Schedule Comparison
(1) Represents the portion of the maximum calculated fee for each respective county that is actually charged. Fee may have been lowered/increased through annual indexing or policy discounts. Does not account for
moratorium/suspensions. (2) du = dwelling unit (3) Source: Table III-7 (4) Source: Palm Beach County Department of Planning, Zoning, and Building (5) Source: Martin County Growth Management Department (6) Source: Broward County Planning Department. Fees are calculated using a 3 bedroom tier plus administration fees (7) Source: Glades County Planning Zoning Department. IF moratorium in effect until February 12, 2016 (8) Source: Miami-Dade County Impact Fee Division. Fees shown are an average of the three park districts (9) Source: St. Lucie County planning & Development Services Department. Fees were adopted at 100% and have since been indexed annually using the CPI. (10) Source: Collier County Impact Fee Administration Department. Community & Regional park fees are combined. (11) Source: Municode; Highlands County Code of Ordinances, Section 13-28; IF moratorium in effect through June 30, 2017 (12) Source: Orange County Planning & Development Department (13) Source: Hillsborough County Development Services Department. Fee shown are an average of four impact fee zones for three bedroom homes.
Calculated(3) Existing(4)
Date of Last Update 2014 2012 2012 n/a 2006 n/a 2009 2009 2006 2012 1985
Assessed Portion of Calculated(1) N/A 95% 100% n/a 100% n/a 100% 100% 25% 100% 100%
Residential:
Single Family (2,000 sq ft) du $2,418 $860 $1,972 $488 $366 $2,960 $1,558 $3,133 $189 $972 $354
Multi-Family (Apt) du $1,385 $788 $1,972 $488 $340 $2,536 $1,390 $1,685 $131 $702 $372
Mobile Home du $2,324 $734 $1,972 $496 $388 $2,960 $1,020 $2,393 $108 $728 $387
Orange
County(12)
Hillsborough
County(13)
Broward
County(6)
Glades
County(7)
Miami-Dade
County(8)
St. Lucie
County(9)
Collier
County(10)
Highlands
County(11)
Martin
County(5)Land Use Unit(2)
Palm Beach County

DRAFT
Tindale Oliver Palm Beach County September 2015 III-13 Impact Fee Update Study
Parks & Recreation Impact Fee Benefit Districts
Currently, Palm Beach County has four impact fee benefit districts/zones, as illustrated in
Article 13, Figure 13.H.3.6-7 of the County’s impact fee ordinance. These districts include
the western portion of the County, which is not charged parks impact fees.
Benefit districts dictate where impact fee revenues can be spent to ensure that fee payers
receive the associated benefit. Typically, these boundaries are based on land use patterns,
growth rates, major roadway boundaries, and major geographical/environmental
boundaries.
As part of this update study, Tindale Oliver reviewed the existing fee district boundaries. In
addition to evaluating geographical boundaries, the impact fee revenue and expenditure
monies were reviewed to determine the effectiveness of the existing boundaries and
discussions were held with Palm Beach County staff to discuss any issues that have arisen due
to the current district alignments.
Based on this review and the discussions with staff, it is recommended that there should be
a single countywide (excluding the Glades Area) district for regional and beach parks. The
characteristics and amenities available at these parks results in a countywide draw. In the
case of district parks, the current three district can be reduced to two benefit districts
separated by Southern Boulevard, which divides the county into equal south and north
portions.
Map III-1 illustrates the existing benefit districts and Map III-2 presents the proposed
change to the District Park benefit districts, as discussed above.

DRAFT
Tindale Oliver Palm Beach County September 2015 III-14 Impact Fee Update Study
Map III-1 Existing Parks & Recreation Impact Fee Benefit Districts
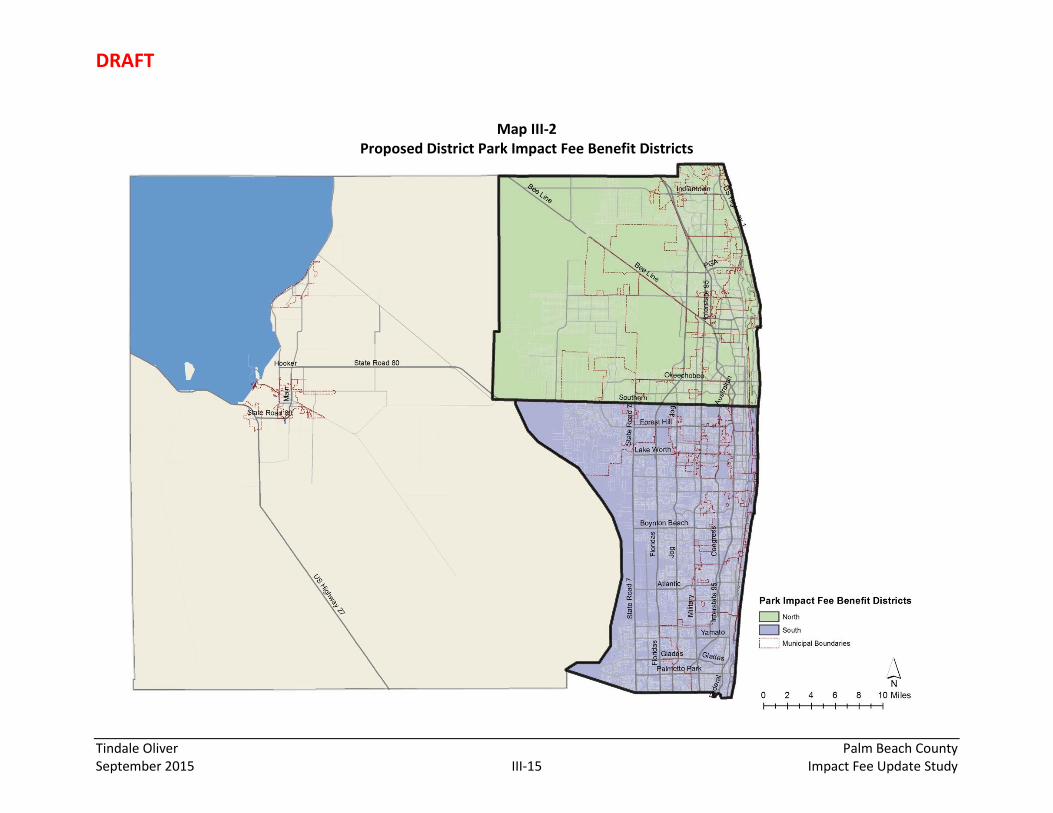
DRAFT
Tindale Oliver Palm Beach County September 2015 III-15 Impact Fee Update Study
Map III-2 Proposed District Park Impact Fee Benefit Districts

DRAFT
Tindale Oliver Palm Beach County September 2015 IV-1 Impact Fee Update Study
IV. Public Libraries Impact Fee
Library impact fees are used to fund the capital construction and expansion of library services
related buildings, land, and materials/equipment required to support the additional library
facilities demand created by new growth. This section provides the results of the library
impact fee analysis. There are several major elements associated with the development of
the library facilities impact fee:
Facility Inventory
Service Area, Benefit Districts, and Population
Level of Service
Cost Component
Credit Component
Net Public Libraries Impact Cost
Calculated Public Libraries Impact Fee Schedule
Public Libraries Impact Fee Schedule Comparison
These various elements are summarized in this section.
Facility Inventory
The Palm Beach County Library Service owns and operates 17 libraries and one support
facility, totaling approximately 406,000 square feet.
The following table presents the inventory of library facilities that are owned by the County.
The building value is estimated at $300 per square foot for library branches based on recent
library construction in Palm Beach County and other Florida jurisdictions, and insurance
values of existing libraries. The County recently completed the construction of the Library
Annex, and this actual cost ($176 per square foot) is used to determine the value of this
building. Land value for library buildings is estimated at $190,000 per acre based on value of
current parcels and an analysis of vacant land values and recent vacant land sales in Palm
Beach County. Appendix C provides additional information on building and land value
estimates.

DRAFT
Tindale Oliver Palm Beach County September 2015 IV-2 Impact Fee Update Study
Table IV-1 Palm Beach County Library Building Inventory
(1) Source: Palm Beach County (2) Source: Palm Beach County (3) Source: Palm Beach County (4) Acres (Item 2) multiplied by land value per acre (Item 10) (5) Square footage (Item 3) multiplied by $300 per square foot for libraries and the current cost of construction for Library Annex ($176 per square foot) (6) Sum of land value and building value (Items 4 and 5) (7) Building value for the Library Annex reflects the current construction cost since the facility is recently built. This facility is not a library branch, but a
warehouse facility where all library materials are ordered, received and processed before going out to the branches. The Library System's outreach services are also located in this building, which include youth services, talking books, and books by mail and the bookmobile.
(8) Land is leased (9) Land is owned by the City of Belle Glade (10) Based on a review of vacant land sales and values. See Appendix C for further detail. (11) Based on recent construction, insurance values and other available information. See Appendix C for further detail.
Facility Description AddressYear
Built(1) Acres(2)Square
Footage(3) Land Value(4)Building
Value(5)
Total Building
and Land
Value(6)
Central Area:
Palm Beach County Library Main Branch 3650 Summit Boulevard 1972 10.30 46,480 $1,957,000 $13,944,000 $15,901,000
Library Annex(7) 4289 Cherry Road 2015 2.03 29,164 $385,700 $5,130,401 $5,516,101
North Area:
Gardens Branch Library 11303 Campus Drive 1996 6.60 40,000 $1,254,000 $12,000,000 $13,254,000
Wellington Branch Library 1951 Royal Fern Drive 1997 4.13 30,000 $784,700 $9,000,000 $9,784,700
Tequesta Branch Library 461 Old Dixie Highway North 1995 N/A(8) 4,000 N/A $1,200,000 $1,200,000
Royal Palm Beach Branch Library 500 Civic Center Way 1994 3.53 20,000 $670,700 $6,000,000 $6,670,700
Okeechobee Boulevard Branch Library 5689 Okeechobee Boulevard 1992 2.73 17,000 $518,700 $5,100,000 $5,618,700
Jupiter Branch Library 705 North Military Trail 1992 3.72 22,000 $706,800 $6,600,000 $7,306,800
South Area:
Glades Road Branch Library 20701 95th Avenue South 1991 4.01 24,000 $761,900 $7,200,000 $7,961,900
Greenacres Branch Library 3750 Jog Road 1992 1.70 17,000 $323,000 $5,100,000 $5,423,000
Boynton Beach Branch Library 9451 Jog Road 1994 2.29 17,538 $435,100 $5,261,400 $5,696,500
Hagen Ranch Road 14350 Hagen Ranch Road 2008 15.03 34,000 $2,855,700 $10,200,000 $13,055,700
Lantana Road Branch 4020 Lantana Road 2009 5.94 29,000 $1,128,600 $8,700,000 $9,828,600
West Boca Branch 18685 State Road 7 2009 20.62 20,000 $3,917,800 $6,000,000 $9,917,800
West Area:
Clarence E. Anthony Library (South Bay) 375 South West 2nd Avenue 1992 0.59 4,000 $112,100 $1,200,000 $1,312,100
Loula V. York Library (Pahokee) 525 Bacom Point Road 1967 0.44 4,565 $83,600 $1,369,500 $1,453,100
Belle Glade Library 725 NW 4th Street 2013 N/A(9) 17,000 N/A $5,100,000 $5,100,000
Acreage Library 15801 Orange Blvd. 2012 N/A(8) 30,000 N/A $9,000,000 $9,000,000
83.66 405,747 $15,895,400 $118,105,301 $134,000,701
$190,000
$291
Land Value per Acre(10)
Total
Building Value per Square Foot(11)

DRAFT
Tindale Oliver Palm Beach County September 2015 IV-3 Impact Fee Update Study
In addition to buildings and land, the Palm Beach County Library System houses a wide variety
of materials that are owned by the County and are available to the public. Table IV-2 presents
the inventory of library materials.
Table IV-2 Palm Beach County Library Material Inventory
(1) Source: Palm Beach County (2) Number of units multiplied by the unit cost (3) Total value for all library materials divided by the total units for all library materials
The Palm Beach County Library System also owns a variety of equipment, both for public use
and for its own operations. Table IV-3 presents the inventory of library equipment.
Description Units(1) Unit Cost(1) Total Value(2)
Books:
Library Books & Publications 1,549,999 $17.57 $27,233,482
Compact Discs/Books on CD 124,535 $19.66 $2,448,358
Digital Video Discs 172,089 $18.73 $3,223,227
Video Cassettes 2,141 $2.64 $5,652
Total - All Library Materials 1,848,764 $32,910,719
Total Value per Item(3) $18

DRAFT
Tindale Oliver Palm Beach County September 2015 IV-4 Impact Fee Update Study
Table IV-3 Library Equipment Inventory
Alarm System $3,860 3 $1,287
Aluminum cart $3,060 1 $3,060
Assistive Listening Apparatus $2,418 2 $1,209
Battery Charging Station $1,339 1 $1,339
Belt Sorter System (Cost < $ 25,000) $39,215 3 $13,072
Belt Sorter System $2,921,407 14 $208,672
Book Cart $45,323 20 $2,266
Book Return/ Chute $48,992 18 $2,722
Burster Machine $5,800 1 $5,800
Camcorder $4,555 2 $2,278
Camera Lens (Long Throw) $3,499 1 $3,499
Canopy $18,961 2 $9,481
Cassettes $2,174 1 $2,174
Computer $738,717 647 $1,142
Computer Networking $19,003 8 $2,375
Computer Networking (Cost > $ 40,000) $44,835 1 $44,835
Detection System $198,806 12 $16,567
Digital Data Manager (Software) $3,443 1 $3,443
Digital Library Assistant $110,032 16 $6,877
Digital Matrix Processor $1,913 1 $1,913
Digital Reader $9,568 1 $9,568
Disc Dispensing System $41,194 2 $20,597
Disc Repair Machine $1,481 1 $1,481
Display Board $3,430 3 $1,143
Drawing Tablet $3,678 2 $1,839
Flat Surface Cleaner $1,091 1 $1,091
Fork Truck $16,035 1 $16,035
Generator (Cost > $30,000) $31,559 1 $31,559
Generator $7,975 2 $3,987
Ladder $2,957 1 $2,957
Laminator $9,768 6 $1,628
LAN Station Racks $1,164 1 $1,164
Large Print Reader $5,620 3 $1,873
Laser Barcode Scanner $3,012 2 $1,506
Lockers (Set of 3) $4,440 2 $2,220
Mailbox/ Sorter $8,100 5 $1,620
Marker Board $1,508 1 $1,508
Microfiche Cabinet $2,755 2 $1,378
Microfiche Table $2,423 2 $1,211
Microfilm/ Film Cabinet $20,545 12 $1,712
Microform Reader/Printer $2,808 2 $1,404
Unit
Cost(3)Equipment Total Equipment Value(1)Number of
Items(2)
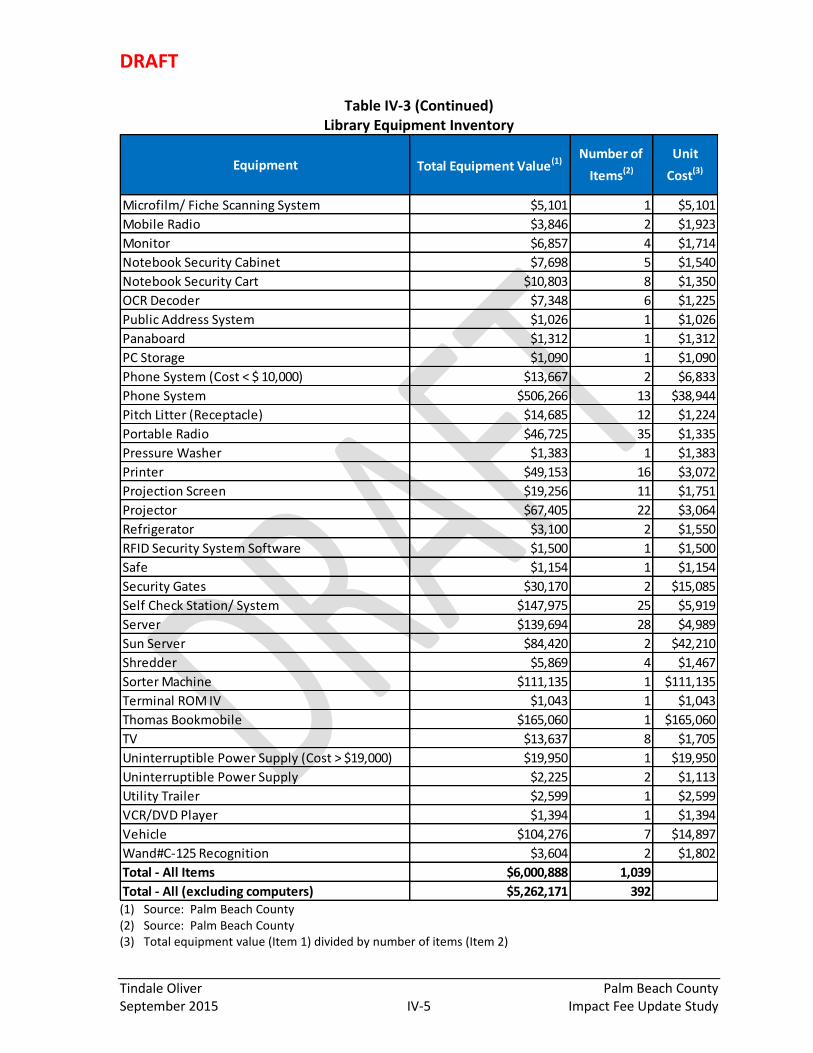
DRAFT
Tindale Oliver Palm Beach County September 2015 IV-5 Impact Fee Update Study
Table IV-3 (Continued) Library Equipment Inventory
(1) Source: Palm Beach County (2) Source: Palm Beach County (3) Total equipment value (Item 1) divided by number of items (Item 2)
Microfilm/ Fiche Scanning System $5,101 1 $5,101
Mobile Radio $3,846 2 $1,923
Monitor $6,857 4 $1,714
Notebook Security Cabinet $7,698 5 $1,540
Notebook Security Cart $10,803 8 $1,350
OCR Decoder $7,348 6 $1,225
Public Address System $1,026 1 $1,026
Panaboard $1,312 1 $1,312
PC Storage $1,090 1 $1,090
Phone System (Cost < $ 10,000) $13,667 2 $6,833
Phone System $506,266 13 $38,944
Pitch Litter (Receptacle) $14,685 12 $1,224
Portable Radio $46,725 35 $1,335
Pressure Washer $1,383 1 $1,383
Printer $49,153 16 $3,072
Projection Screen $19,256 11 $1,751
Projector $67,405 22 $3,064
Refrigerator $3,100 2 $1,550
RFID Security System Software $1,500 1 $1,500
Safe $1,154 1 $1,154
Security Gates $30,170 2 $15,085
Self Check Station/ System $147,975 25 $5,919
Server $139,694 28 $4,989
Sun Server $84,420 2 $42,210
Shredder $5,869 4 $1,467
Sorter Machine $111,135 1 $111,135
Terminal ROM IV $1,043 1 $1,043
Thomas Bookmobile $165,060 1 $165,060
TV $13,637 8 $1,705
Uninterruptible Power Supply (Cost > $19,000) $19,950 1 $19,950
Uninterruptible Power Supply $2,225 2 $1,113
Utility Trailer $2,599 1 $2,599
VCR/DVD Player $1,394 1 $1,394
Vehicle $104,276 7 $14,897
Wand#C-125 Recognition $3,604 2 $1,802
Total - All Items $6,000,888 1,039
Total - All (excluding computers) $5,262,171 392
Unit
Cost(3)Equipment Total Equipment Value(1)Number of
Items(2)

DRAFT
Tindale Oliver Palm Beach County September 2015 IV-6 Impact Fee Update Study
Service Area, Benefit Districts, and Population
Palm Beach County provides library services in the unincorporated area, as well as, in 23 cities
located throughout the County. These cities are shown in Appendix A, Table A-21. As such,
the appropriate service area as well as the benefit district for library impact fees is the
unincorporated county plus these 23 cities, excluding the Glades Area that is exempt from
paying impact fees.
Because library impact fees are charged only to residential development, countywide
weighted seasonal population is used in the calculation. The County’s current population
estimates and future population projections are provided in Appendix A, Table A-1.
Level of Service
The following table provides a summary of the current LOS as well as the adopted LOS
standard for library buildings, books, other library materials, and computers in Palm Beach
County.
As presented in the table, the County’s achieved LOS is below the adopted LOS standard for
library buildings. As such, for impact fee calculations, the achieved LOS is used in order to
ensure new development is not overcharged.
Table IV-4 Current Level of Service (2014)
(1) Source: Table IV-1 for buildings and Table IV-2 for materials (2) Source: Appendix A, Table A-1 (3) Square footage/count (Item 1) divided by population (Item 2) multiplied by 1,000 (4) Source: Palm Beach County (5) Source: Table IV-3, only computers and equipment available for public use are included
2013 2020
Library Buildings (sf) 405,747 952,314 426 490 600
Library Materials (items) 1,848,764 952,314 1,941 2,000 2,500
Computers(5) 647 952,314 0.7 N/A N/A
Other Library Equipment (items)(5) 392 952,314 0.4 N/A N/A
Adopted LOS Standard (per
1,000 Residents)(4)Item
Sq.
Footage/
Count(1)
2014
Population(2)
Achieved LOS
(per 1,000
Residents)(3)

DRAFT
Tindale Oliver Palm Beach County September 2015 IV-7 Impact Fee Update Study
A comparison of the current Palm Beach County LOS, the adopted LOS standard, and the
suggested State standards are presented in Tables IV-5.
Table IV-5 Comparison of Palm Beach County Current LOS to FL Standards
– Library Materials and Computers
(1) Source: Table IV-4 (2) Source: Standards for Florida Public Libraries, 2004; Updated April 2013 (3) Library materials include books, online resources, subscriptions, and other library items
Palm Beach County’s achieved LOS for buildings and library materials are below the Florida
Library Association’s (FLA) essential standard. However, the County’s LOS for computers
exceeds the enhanced standard.
It is important to note that Palm Beach County designed an ambitious expansion program for
its library facilities/materials to improve the achieved LOS. The County completed first two
phases of its expansion program in 2013, and at the same time, recognized that a Phase III of
the Library Expansion Program (LEP III) will be necessary to address the remaining concerns
regarding the library service levels.
The following table provides a comparison of the current Palm Beach County LOS to those of
surrounding counties as well as other Florida counties with similar population levels. The
comparison is based on the information obtained from the Library Directory with Statistics,
published by the Department of State, Division of Library and Information Services. Palm
Beach County’s LOS is within the range of its peer group.
Essential Enhanced Exemplary
Library Buildings (sq. ft.) 426 600 600 650 850
Library Materials(3) 1,941 2,500 2,000 2,500 3,000
Computers 0.7 n/a 0.3 0.5 1.0
FL Public Library Standards(2)
Item
PBC LOS
Standard (per
1,000
Residents)(1)
PBC Achieved
LOS (per 1,000
Residents)(1)

DRAFT
Tindale Oliver Palm Beach County September 2015 IV-8 Impact Fee Update Study
Table IV-6 Comparison of LOS (per 1,000 residents)
Palm Beach County and Other Florida Counties
(1) Library materials for PBC include books, CDs, DVDs, videos, print and online resource subscriptions. Library materials for other counties include books, serial
subscriptions, audio and video volumes. (2) Source: Department of State - Division of Library & Information Services, 2012/13 Library Directory with Statistics; Includes public computers ONLY (3) Source: Table IV-4 (4) Peers group includes jurisdiction’s with 750,001+ service area population; PBC is not included (5) Includes all jurisdictions in Florida; PBC is not included
Palm Beach
(Existing)(3)
Martin
County
Broward
County
Heartland Library
Cooperative
Miami-Dade
County
St. Lucie
CountyCollier County
Orange
County
Hendry
County
Peer Group
(Excludes PBC)(4)
FL Counties
(Excludes PBC)(5)
Library Buildings (sq. ft.) 426 711 823 390 336 323 543 389 819 561 498
Library Materials(1) 1,941 2,284 1,929 2,245 1,759 985 2,059 1,497 2,657 1,965 1,933
Computers(2) 0.7 1.5 1.1 0.7 1.0 0.4 0.6 0.5 1.2 0.9 0.8
Item
Per 1,000 Residents

DRAFT
Tindale Oliver Palm Beach County September 2015 IV-9 Impact Fee Update Study
Cost Component
Costs are calculated separately for facilities and items/equipment. Facility costs are based on
the estimated cost to add the next library building, and the cost of library items and
equipment is based on the estimated current value per unit.
Buildings and Land
Table IV-7 summarizes the calculation of library facility and land values. The total impact cost
or total value per resident for library buildings and land in Palm Beach County is $141.
Table IV-7 Summary of Building and Land Cost per Resident
(1) Source: Table IV-1 (2) Source: Table IV-1 (3) Sum of building value (Item 1) and land value (item 2) (4) Source: Table IV-1 (5) Building and land value (Item 3) divided by building square footage
(Item 4) (6) Source: Table IV-4 (7) Total building and land cost per square foot (Item 5) multiplied by the
LOS (Item 6) divided by 1,000
Library Materials and Equipment
The following table provides a summary of library materials and equipment costs per
resident, which amounts to $41.
Element Figure
Total Building Value (1) $118,105,301
Total Land Value(2) $15,895,400
Total Building and Land Value(3) $134,000,701
Building Square Footage(4) 405,747
Total Building and Land Cost per Square Foot(5) $330.26
Achieved LOS (sf per 1,000 residents)(6) 426
Total Building and Land Cost per Resident(7) $140.69
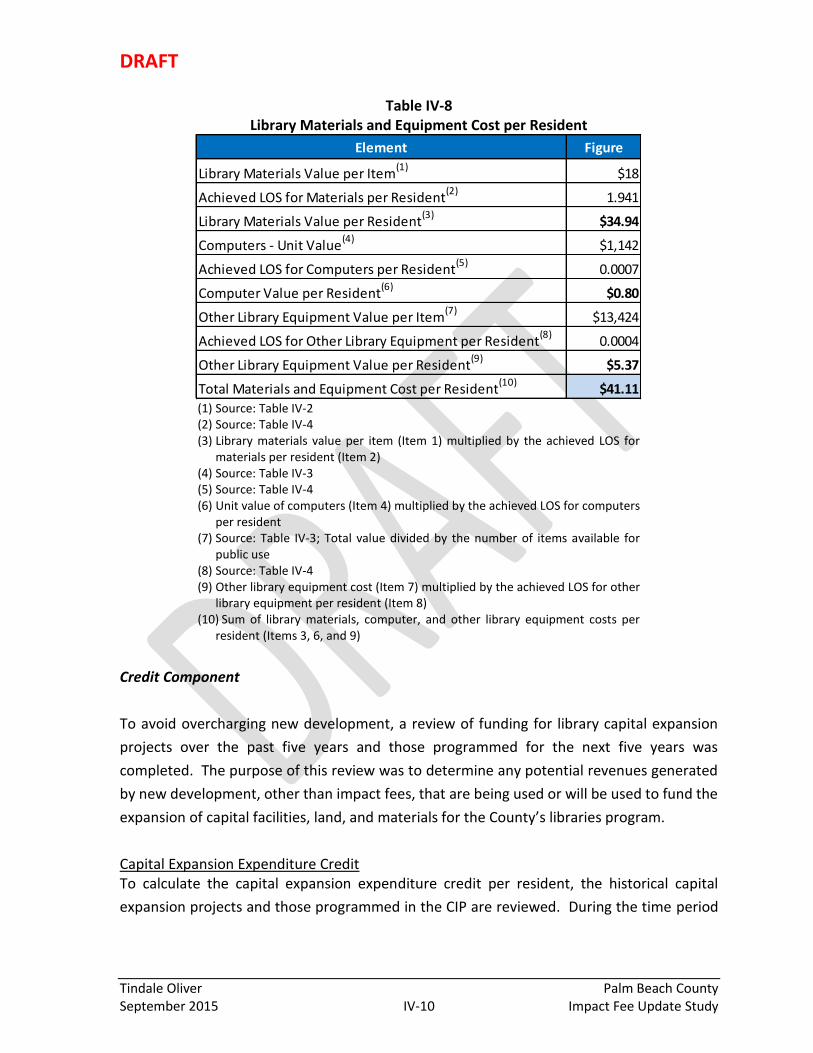
DRAFT
Tindale Oliver Palm Beach County September 2015 IV-10 Impact Fee Update Study
Table IV-8 Library Materials and Equipment Cost per Resident
(1) Source: Table IV-2 (2) Source: Table IV-4 (3) Library materials value per item (Item 1) multiplied by the achieved LOS for
materials per resident (Item 2) (4) Source: Table IV-3 (5) Source: Table IV-4 (6) Unit value of computers (Item 4) multiplied by the achieved LOS for computers
per resident (7) Source: Table IV-3; Total value divided by the number of items available for
public use (8) Source: Table IV-4 (9) Other library equipment cost (Item 7) multiplied by the achieved LOS for other
library equipment per resident (Item 8) (10) Sum of library materials, computer, and other library equipment costs per
resident (Items 3, 6, and 9)
Credit Component
To avoid overcharging new development, a review of funding for library capital expansion
projects over the past five years and those programmed for the next five years was
completed. The purpose of this review was to determine any potential revenues generated
by new development, other than impact fees, that are being used or will be used to fund the
expansion of capital facilities, land, and materials for the County’s libraries program.
Capital Expansion Expenditure Credit To calculate the capital expansion expenditure credit per resident, the historical capital
expansion projects and those programmed in the CIP are reviewed. During the time period
Element Figure
Library Materials Value per Item(1)
$18
Achieved LOS for Materials per Resident(2)
1.941
Library Materials Value per Resident(3)
$34.94
Computers - Unit Value(4)
$1,142
Achieved LOS for Computers per Resident(5)
0.0007
Computer Value per Resident(6)
$0.80
Other Library Equipment Value per Item(7)
$13,424
Achieved LOS for Other Library Equipment per Resident(8)
0.0004
Other Library Equipment Value per Resident(9)
$5.37
Total Materials and Equipment Cost per Resident(10)
$41.11

DRAFT
Tindale Oliver Palm Beach County September 2015 IV-11 Impact Fee Update Study
from 2009 through 2018, the County allocated an average annual non-impact fee funding of
$431,000 toward library capital facilities.
The annual capital expansion expenditures for library facilities was divided by the average
annual population during the same time period in order to calculate the average capital
expansion cost per resident. As presented in Table IV-9, the result is an average annual
expansion cost of $0.45 per resident.
Once the capital expansion credit per resident is calculated, an adjustment is needed since
library projects were funded with ad valorem revenues. This adjustment accounts for the
fact that new homes tend to pay higher taxes per dwelling unit and is estimated based on a
comparison of the average taxable value of homes built over the past five years to that of all
homes. As presented in Table IV-9, the adjusted capital expansion credit per resident is $0.79.
Table IV-9 Library Capital Expansion Funding Sources
(1) Source: Palm Beach County, expenditures shown represent cash payments during the indicated time period
and excludes portions that were funded with bond issues or impact fee revenues, or outside of the time frame indicated.
(2) Average annual capital expenditures over the 10-year period (3) Source: Appendix A, Table A-1 (4) Average annual capacity expansion expenditures (Item 2) divided by average annual population (Item 3) (5) Adjustment factor to reflect higher ad valorem taxes paid by new homes (6) Annual capital expansion expenditures per resident ($0.45) multiplied by the credit adjustment factor (Item
5)
Description(1) FY 2009-2013 FY 2014-2018 Total
Ad Valorem:
Acreage Branch $750,780 $0 $750,780
Main Library Expansion $1,133,697 $0 $1,133,697
West Boca Branch $230,825 $0 $230,825
West Lantana $47,613 $0 $47,613
Royal Palm Expansion $43,987 $0 $43,987
North County Regional Expansion $200,025 $0 $200,025
Library Annex $0 $1,906,245 $1,906,245
Total Capital Expansion Expenditures $2,406,927 $1,906,245 $4,313,172
Average Annual Capacity Expansion Expenditures(2) $431,317
Average Annual Population(3) 951,657
Annual Capital Expansion Expenditures per Resident(4) $0.45
Credit Adjustment Factor(5) 1.75
Adjusted Annual Capital Expansion Expenditures per Resident(6) $0.79

DRAFT
Tindale Oliver Palm Beach County September 2015 IV-12 Impact Fee Update Study
Debt Service Credit
Table IV-10 summarizes the outstanding debt service related to library capital expansion
projects. The County is currently paying the library debt service obligations with ad-valorem
tax revenues. To calculate the credit of the current debt obligations, the present value of the
total remaining payments is calculated and then divided by the average annual population
estimated over the remaining life of the bond issue. As shown in Table IV-10, the resulting
credit for library facilities-related debt is $32.61 per resident.
Similar to the capital expansion credit per resident, because the library debt service is being
retired using ad valorem tax revenues, an adjustment of the credit per resident is also
necessary. As shown, the adjusted debt service credit per resident amounts to $57.07.
Table IV-10 Palm Beach County Library Debt Service Credit
(1), (2), (3), (4) Source: Palm Beach County (5) Source: Appendix A, Table A-1 (6) Present value of payments remaining (Item 4) divided by average annual population (Item 5) (7) Adjustment factor to reflect higher ad valorem taxes paid by new homes (8) Credit per resident ($32.61) multiplied by the credit adjustment factor (Item 7)
Net Public Libraries Impact Cost
The net impact fee per residence is the difference between the cost component and the
credit component. Table IV-11 summarizes the calculation of the net library impact cost,
which amounts to $112 per resident.
Description
Total Number of
Fiscal Years of
Debt Issue(1)
Fiscal Years
Remaining(2)
Total Remaining Library
Debt Service (Capacity
Expansion)(3)
Present Value of
Payments Remaining
(Capacity Expansion)(4)
Avg Annual Population
During Remaining
Bond Issue Period(5)
Credit per
Resident(6)
Library Expansion General Obligation Bonds, Series 2006 20 11 $19,073,071 $15,607,319 1,022,753 $15.26
General Obligation Refunding Bond, Series 2010 13 9 $19,674,900 $17,553,224 1,011,569 $17.35
Total Debt Service Credit per Resident $32.61
Credit Adjustment Factor(7) 1.75
Adjusted Debt Service Credit per Resident(8) $57.07

DRAFT
Tindale Oliver Palm Beach County September 2015 IV-13 Impact Fee Update Study
Table IV-11 Net Public Libraries Impact Cost
(1) Source: Table IV-7 (2) Source: Table IV-8 (3) Source: Table IV-8 (4) Source: Table IV-9 (5) Average annual capital expansion credit per resident (Item 4) over a
capitalization rate of 3.4% for 25 years. Capitalization rate estimate is provided by Palm Beach County and 25 years reflects the time frame when structures start needing major repairs/renovation.
(6) Source: Table IV-10 (7) Sum of the capital expansion credit per resident (Item 5) and the debt
service credit per resident (Item 6) (8) Total impact cost per resident less total revenue credit per resident
(Item 7)
Calculated Public Libraries Impact Fee Schedule
The calculated library impact fee for each residential land use is presented in Table IV-12. The
net impact cost per resident calculated in the previous section is applied to the average
persons per unit by land use. The resulting total impact fees per dwelling unit range from
$166 for the multi-family residential land uses to $320 for single family homes 2,500 square
feet or larger.
Building and Land Cost per Resident(1) $140.69
Library Materials Cost per Resident(2) $34.94
Library Equipment Cost per Resident(3) $6.17
Total Impact Cost per Resident $181.80
Avg Annual Capital Expansion Credit per Resident(4) $0.79
Capitalization Rate 3.4%
Capitalization Period (in years) 25
Capital Expansion Credit per Resident(5) $13.16
Debt Service Credit per Resident(6) $57.07
Total Revenue Credit per Resident(7) $70.23
Net Impact Cost per Resident $111.57
Revenue Credit per Resident
Net Impact Cost per Resident (8)
FigureCalculation Step
Impact Cost

DRAFT
Tindale Oliver Palm Beach County September 2015 IV-14 Impact Fee Update Study
Table IV-12 Calculated Public Libraries Impact Fee Schedule
(1) Source: Appendix A, Table A-5 (2) Source: Table IV-11 (3) Residents per unit (Item 1) multiplied by net cost per resident (Item 2) (4) Source: Palm Beach County Department of Planning, Zoning, and Building (5) Percent change from the current adopted rates (Item 4) to the total impact fee (Item 3)
Residential Land UseResidents
per Unit (1)
Net Cost per
Resident(2)
Total Impact
Fee(3)
Current
Adopted Fee(4)
Percent
Change(5)
Residential
Single Family/Townhouse less than 1,500 sf 2.38 $111.57 $266 $186 43%
Single Family/Townhouse 1,500-2,499 sf 2.59 $111.57 $289 $212 36%
Single Family/Townhouse 2,500 sf or more 2.87 $111.57 $320 $243 32%
Multi-Family (Apartment/Condo) 1.49 $111.57 $166 $212 -22%
Accessory Apartment/Grooms Quarters 1.49 $111.57 $166 $186 -11%
Mobile Home 2.45 $111.57 $273 $186 47%

DRAFT
Tindale Oliver Palm Beach County September 2015 IV-15 Impact Fee Update Study
Public Libraries Impact Fee Schedule Comparison
As part of the work effort in updating Palm Beach County’s library impact fee program, a
comparison of library facilities impact fee schedules was completed for other Florida
counties. Table IV-13 presents this comparison. As presented, Palm Beach County’s
calculated fee is within the range of fees assessed by other Counties

DRAFT
Tindale Oliver Palm Beach County September 2015 IV-16 Impact Fee Update Study
Table IV-13 Public Libraries Impact Fee Schedule Comparison
(1) Represents the portion of the maximum calculated fee for each respective county that is actually charged. Fee may have been
lowered/increased through annual indexing or policy discounts. Does not account for moratorium/suspensions. (2) du = dwelling unit (3) Source: Table IV-12 (4) Palm Beach County Department of Planning, Zoning, and Building (5) Source: Martin County Growth Management Department (6) Source: St. Lucie County Planning & Development Services Department. Fees were adopted at 100% and have since been indexed annually
using the CPI. (7) Source: Collier County Impact Fee Administration Department (8) Source: Municode; Highlands County Code of Ordinances, Section 13-28; IF moratorium in effect through June 30, 2017
Calculated(3) Existing(4)
Date of Last Update 2014 2012 2012 2009 2010 2006
Assessed Portion of Calculated(1) N/A 75% 100% 100% 100% 25%
Residential:
Single Family (2,000 sf) du $289 $243 $527 $220 $315 $61
Multi-Family du $166 $212 $527 $143 $160 $42
Mobile Home du $273 $186 $527 $173 $237 $34
Collier
County(7)
Highlands
County(8)Land Use Unit(2)
Palm Beach County Martin
County(5)
St. Lucie
County(6)

DRAFT
Tindale Oliver Palm Beach County September 2015 V-1 Impact Fee Update Study
V. Fire Protection & Rescue Impact Fee
This section provides the results of the fire protection and rescue impact fee analysis. There
are several major elements associated with the development of the fire protection and rescue
impact fees:
Facility Inventory
Service Area, Benefit Districts, and Population
Level of Service
Cost Component
Credit Calculation
Net Fire Protection and Rescue Impact Cost
Calculated Fire Protection & Rescue Impact Fee Schedule
Fire Protection & Rescue Impact Fee Schedule Comparison
These various elements are summarized in the remainder of this section. At this time, the
County is not collecting this fee.
Facility Inventory
Palm Beach County fire rescue provides fire protection and rescue services from 40 stations
that are owned by the County. In addition, Palm Beach County has two
administrative/ancillary facilities associated with fire rescue services.
Table V-1 presents the fire rescue building and land inventory owned by Palm Beach County.
The values of the buildings are based primarily on recent construction in Palm Beach County
and other Florida jurisdictions and insurance values of existing buildings. The land value
estimates are based on land values of the existing facilities, recent land purchases, vacant
land sales and values of parcels with similar characteristics. A more detailed explanation of
building and land value estimates is included in Appendix C.

DRAFT
Tindale Oliver Palm Beach County September 2015 V-2 Impact Fee Update Study
Table V-1 Land & Buildings Inventory
Facility
Description(1) Location(1)
Year
Acquired/
Built(1)
Number of
Bays(1)
Square
Feet(2) Acres(3)
Total
Square Feet
on Site(4)
Allocated
Acres(5) Building Value(6)
Land
Value(7)
Total Building
and Land
Value(8)
Fire Station 14 12015 Indiantown Rd., Jupiter 33478 2010 2 6,485 6.75 6,485 6.75 $1,686,100 $1,012,500 $2,698,600
Fire Station 15 12870 S. U.S. Hwy 1., Juno 33408 1988 5 6,739 0.85 6,739 0.85 $1,752,140 $127,500 $1,879,640
Fire Station 16 3550 Military Trail, Jupiter 33458 2001 2 5,355 1.43 5,355 1.43 $1,392,300 $214,500 $1,606,800
Fire Station 18 777 N. US Hwy 1., Jupiter 33477 2002 2 6,463 N/A(9)
6,463 N/A(9)
$1,680,380 N/A(9)
$1,680,380
Fire Station 19 HQ 322 N. Central Blvd., Jupiter 33458 1998 3 9,620 1.34 9,620 1.34 $2,501,200 $201,000 $2,702,200
Fire Station 20 1000 Greenview Shores Blvd., Jupiter 33458 2003 2 5,355 2.03 5,355 2.03 $1,392,300 $304,500 $1,696,800
Fire Station 21 14200 Okeechobee Blvd., W. Palm Beach 33470 1992 3 6,540 3.32 6,540 3.32 $1,700,400 $498,000 $2,198,400
Fire Station 25 1060 Wellington Trace, Wellington 33414 1979 3 6,892 1.80 6,892 1.80 $1,791,920 $270,000 $2,061,920
Fire Station 26 6085 Avocado Blvd., W. Palm Beach 33411 1997 2 5,268 2.65 5,268 2.65 $1,369,680 $397,500 $1,767,180
Fire Station 27 3411 Southshore Blvd., Wellington 33414 2000 2 5,355 1.00 5,355 1.00 $1,392,300 $150,000 $1,542,300
Fire Station 17 8130 N. Jog Rd., W. Palm Beach 33412 1990 0 1,440 6.00 24,266 0.36 $374,400 $54,000 $428,400
Fire Station 23 HQ 5471 Okeechobee Blvd., W. Palm Beach 33417 2006 3 9,684 3.75 9,684 3.75 $2,517,840 $562,500 $3,080,340
Fire Station 24 1734 Seminole Blvd., W. Palm Beach 33409 1960 3 5,588 0.33 5,588 0.33 $1,452,880 $49,500 $1,502,380
Fire Station 30 9610 Stribling Way., Wellington 33414 2006 2 6,146 2.76 6,146 2.76 $1,597,960 $414,000 $2,011,960
Fire Station 31 3439 Lake Worth Rd., Lake Worth 33461 2012 2 6,222 1.22 6,222 1.22 $1,617,720 $183,000 $1,800,720
Fire Station 32 4022 Charleston St., Lake Worth 33461 2010 2 5,811 0.98 5,811 0.98 $1,510,860 $147,000 $1,657,860
Fire Station 33 830 Kirk Rd., W. Palm Beach 33406 1988 3 7,921 1.99 7,921 1.99 $2,059,460 $298,500 $2,357,960
Fire Station 34 HQ 231 Benoist Farms Rd., W. Plam Beach 33411 1991 3 9,620 5.61 9,620 5.61 $2,501,200 $841,500 $3,342,700
Fire Station 35(13)
2501 W. Lantana Rd., Lantana 33462 1969 4 5,706 21.27 N/A 3.00 $1,483,560 $450,000 $1,933,560
Fire Station 36 5395 Purdy Lane, W. Palm Beach 33415 2007 2 5,631 1.60 5,631 1.60 $1,464,060 $240,000 $1,704,060
Fire Station 43 5970 Military Trail, Lake Worth 33460 1983 2 5,541 0.43 5,541 0.43 $1,440,660 $64,500 $1,505,160
Fire Station 68 1000 Park Ave., Lake Park, FL 33403 2000 2 11,852 0.91 11,852 0.91 $3,081,520 $136,500 $3,218,020
Fire Station 41 5105 Woolbright Rd., Boynton Beach 33435 2005 2 5,355 2.43 5,355 2.43 $1,392,300 $364,500 $1,756,800
Fire Station 42 HQ(10)
14276 Hagen Ranch Rd., Delray Beach 33446 1983 5 22,011 5.00 22,011 5.00 $5,722,860 $750,000 $6,472,860
Fire Station 44(13)
6670 Flavor Pict Rd., Boynton Beach 2008 2 5,691 47.44 N/A 3.00 $1,479,660 $450,000 $1,929,660
Fire Station 45 15450 Jog Rd., Delray Beach 33446 1999 2 5,355 2.00 5,355 2.00 $1,392,300 $300,000 $1,692,300
Fire Station 46 7550 Jog Rd., Lake Worth 33467 1997 2 5,190 1.72 5,190 1.72 $1,349,400 $258,000 $1,607,400
Fire Station 47 7950 Enterprise Ctr. Cir., Boynton Bch 33437 2001 2 5,355 1.74 5,355 1.74 $1,392,300 $261,000 $1,653,300
Fire Station 48(13) 8560 Hypoluxo Rd., Lake Worth 33467 2007 2 5,300 33.63 N/A 3.00 $1,378,000 $450,000 $1,828,000
Fire Station 52 4659 Pheasant Way, Boca Raton 33431 1998 2 4,694 0.76 4,694 0.76 $1,220,440 $114,000 $1,334,440

DRAFT
Tindale Oliver Palm Beach County September 2015 V-3 Impact Fee Update Study
Table V-1 (Continued) Land & Buildings Inventory
(1) Source: Palm Beach County (2) Source: Palm Beach County, 2014 Schedule of Values (3) Source: Palm Beach County and Palm Beach County Property Appraiser (4) Source: Palm Beach County, 2014 Schedule of Values and Palm Beach County Property Appraiser. Sum of all buildings on site. (5) Square feet (Item 2) divided by total square feet on site (Item 4) multiplied by acres (Item 3) (6) Square feet (Item 2) multiplied by the estimated building value per square foot of $260 for fire rescue stations, $160 for the support services facility, and $230 for the fire rescue training and administrative facility (7) Allocated acres (Item 5) multiplied by land value per acre (Item 12) (8) Sum of building value (Item 6) and land value (Item 7) (9) Located at Burt Reynolds Park. Acreage included under the parks impact fee. (10) Total square footage includes vehicle maintenance garage that is used by Fire Rescue. As such, the entire acreage is allocated to Fire Rescue. (11) Total building value divided by total square feet (12) Source: Appendix C (13) Allocated acreage estimate provided by Palm Beach County
Facility
Description(1) Location(1)
Year
Acquired/
Built(1)
Number of
Bays(1)
Square
Feet(2) Acres(3)
Total
Square Feet
on Site(4)
Allocated
Acres(5) Building Value(6)Land
Value(7)
Total Building
and Land
Value(8)
Fire Station 51 10050 Judge Winikoff Rd., Boca Raton 33433 1976 3 5,088 1.39 5,088 1.39 $1,322,880 $208,500 $1,531,380
Fire Station 53 19950 Lyons Rd., Boca Raton 33434 2003 2 5,355 3.90 7,983 2.62 $1,392,300 $393,000 $1,785,300
Fire Station 54 18501 State Road 7, Boca Raton 33498 1983 3 5,369 1.31 5,369 1.31 $1,395,940 $196,500 $1,592,440
Fire Station 55 6787 Palmetto Circle No., Boca Raton 33433 1979 3 6,346 2.36 6,346 2.36 $1,649,960 $354,000 $2,003,960
Fire Station 56 6250 SW 18th St, Boca Raton, 33433 2009 2 5,511 1.86 5,511 1.86 $1,432,860 $279,000 $1,711,860
Fire Station 57 HQ 9030 Vista Del Lago, Boca Raton 33428 2001 3 9,649 2.50 9,649 2.50 $2,508,740 $375,000 $2,883,740
Fire Station 58 12245 Glades Rd., Boca Raton 33428 2002 2 5,355 3.00 5,355 3.00 $1,392,300 $450,000 $1,842,300
Fire Station 72 615 S Lake Ave, Pahokee 33476 2012 3 7,690 2.53 7,690 2.53 $1,999,400 $379,500 $2,378,900
Fire Station 73 525 SW 2nd St, Belle Glade 33430 1976/2009 5 10,157 1.75 10,157 1.75 $2,640,820 $262,500 $2,903,320
Fire Station 74 530 US Highway 27 N South Bay 33493 2013 3 7,690 3.00 7,690 3.00 $1,999,400 $450,000 $2,449,400
Support Services 2601 Vista Parkway, West Palm Beach 33411 2007 n/a 13,299 46.23 147,526 4.17 $2,127,840 $625,500 $2,753,340
Fire Rescue Training &
Administrative Facility 405 Pike Road, West Palm Beach 33411 2008 n/a 59,403 9.84 91,183 6.41 $13,662,690 $961,500 $14,624,190
345,097 96.66 $86,613,230 $14,499,000 $101,112,230
$251
$150,000
Total
Building Value per Square Foot(11)
Land Value per Acre(12)

DRAFT
Tindale Oliver Palm Beach County September 2015 V-4 Impact Fee Update Study
In addition to land and buildings, Palm Beach County fire rescue capital assets include the
necessary vehicles and equipment required to perform its services. As presented in Table V-
2, the current value of total vehicle and equipment is approximately $79 million for fire rescue
services.
Table V-2
Vehicle and Equipment Value
(1) Source: Palm Beach County
Description(1) Units(1)Vehicle Unit
Cost(1)
Equipment
Unit Cost(1)
Total Unit
Cost(1) Total Value(1)
Firefighting Apparatus
Aerial Ladder (Quint) 5 $738,146 $57,953 $796,099 $3,980,495
Brush Truck 27 $215,819 $51,528 $267,347 $7,218,369
Pumper/Engine 70 $448,062 $54,598 $502,660 $35,186,200
Haz Mat Vehicle 2 $595,000 $474,237 $1,069,237 $2,138,474
Tanker/Tender 4 $359,516 $51,528 $411,044 $1,644,176
Air and Light Truck 2 $277,282 $0 $277,282 $554,564
Trench Rescue Truck 1 $234,529 $0 $234,529 $234,529
Tactical Command Unit 1 $380,846 $0 $380,846 $380,846
Subtotal: 112 $51,337,653
Rescue Apparatus
Rescue Pumper 1 $244,109 $113,091 $357,200 $357,200
ALS Rescue 69 $254,273 $60,001 $314,274 $21,684,906
EMS Capt Truck 10 $58,456 $30,390 $88,846 $888,460
Subtotal: 80 $22,930,566
Staff Vehicles
Staff Vehicle Non-Emergency 34 $15,809 $0 $15,809 $537,506
Crown Vic or Similar Cars 20 $28,062 $1,220 $29,282 $585,640
Sports Utility Non-Emergency 17 $22,472 $0 $22,472 $382,024
Sports Utility 27 $38,163 $15,090 $53,253 $1,437,831
Pick up trucks 35 $27,372 $0 $27,372 $958,020
Utility Truck 11 $45,003 $0 $45,003 $495,033
Box Truck w/lift gate 1 $45,000 $0 $45,000 $45,000
Other Trucks 2 $24,909 $0 $24,909 $49,818
Cargo Van 7 $21,963 $0 $21,963 $153,741
Passenger Van 2 $19,769 $0 $19,769 $39,538
Mini Van 15 $17,592 $0 $17,592 $263,880
Step Vans 4 $35,000 $0 $35,000 $140,000
Special Event Cart 1 $18,180 $0 $18,180 $18,180
Training Buses 2 $10,000 $0 $10,000 $20,000
Subtotal: 178 $5,126,211
Grand Total: 370 $79,394,430

DRAFT
Tindale Oliver Palm Beach County September 2015 V-5 Impact Fee Update Study
Service Area, Benefit Districts, and Population
Palm Beach County provides fire rescue services in the unincorporated county, as well as, 18
cities located throughout the County. These additional cities are shown in Appendix A, Table
A-21. As such, the proper benefit district for fire rescue services is the unincorporated county
plus the 18 cities. For impact fee calculations, the current 2014 weighted and functional
population estimates were used, which are provided in Appendix A. Because simply using
weighted population does not fully address all of the benefactors of fire rescue services, the
“functional” weekly 24-hour population approach is used to establish a common unit of
demand across different land uses (See Appendix A for further information).
Level of Service
For impact fee purposes, level of service for fire rescue is expressed in terms of stations per
1,000 residents. Using this method, Palm Beach County’s current LOS is 1 station per 23,019
residents or 0.043 stations per 1,000 residents for fire rescue services.
As mentioned in the previous sections, the LOS needs to be measured using functional
population to capture all residents, workers, and visitors that benefit from fire rescue
services. In terms of functional population, the LOS is calculated at 0.050 stations per 1,000
functional residents for fire services. Table V-3 summarizes the calculation of the LOS using
the 2014 weighted population and functional population.
Table V-3 Level of Service (2014)
(1) Source: Appendix A, Table A-1 for weighted population and Table A-12 for functional
population (2) Source: Table V-1 (3) Population (Item 1) divided by the number of stations (Item 2) (4) Number of stations (Item 2) divided by the population (Item 1) divided by 1,000
Weighted
Population
Functional
Population
Population(1) 920,758 802,752
Number of Stations(2) 40 40
Population per Station(3) 23,019 20,069
LOS (Stations per 1,000 Residents)(4) 0.043 0.050
Year 2014
Calculation Step

DRAFT
Tindale Oliver Palm Beach County September 2015 V-6 Impact Fee Update Study
Table V-4 compares the levels of service for other Florida counties as well as the statewide
average. The LOS is displayed in terms of permanent population for 2013 for the service area
of all entities.
Table V-4 Level of Service Comparison
(1) Source: BEBR: April 1, 2013 Final Population Estimates (2) Source: County websites and the U.S. Fire Administration; National Fire Department Census (3) Service area population (Item 1) divided by the number of stations (Item 2) (4) Number of stations (Item 2) divided by the service area population (Item 1) divided by 1,000
Cost Component
Table V-5 summarizes the total current asset value of land, buildings, and equipment for fire
rescue services, including:
$86.6 million for buildings, $14.5 million for land, and $79.4 million for vehicles and
equipment, for a total asset value of $180.5 million.
Table V-5 also presents the total impact cost per functional resident for fire rescue facilities
in Palm Beach County, which is calculated by multiplying the total cost per station by the LOS
(stations per 1,000 functional residents) and dividing that figure by 1,000.
Jurisdiction
Service Area
Population
(2013)(1)
Number of
Stations(2)
Residents per
Station(3)
LOS (Stations)
per 1,000
Residents)(4)
Miami-Dade County 1,780,937 65 27,399 0.036
Hillsborough County 869,181 42 20,695 0.048
Palm Beach County (Existing) 817,458 40 20,436 0.049
Orange County 772,657 41 18,845 0.053
St. Lucie County 281,151 17 16,538 0.060
Broward County 258,108 22 11,732 0.085
Collier County 297,103 27 11,004 0.091
Martin County 131,447 15 8,763 0.114
Hendry County 25,888 3 8,629 0.116
Okeechobee County 34,212 4 8,553 0.117
Highlands County 79,342 18 4,408 0.227
Glades County 12,658 5 2,532 0.395

DRAFT
Tindale Oliver Palm Beach County September 2015 V-7 Impact Fee Update Study
Table V-5 Total Impact Cost per Resident
(1) Source: Table V-1 (2) Source: Table V-1 (3) Source: Table V-2 (4) Sum of building value (Item 1), land value (Item 2), and vehicle and
equipment value (Item 3) (5) Source: Table V-3 (6) Total asset value (Item 4) divided by the number of stations (Item 5) (7) Source: Table V-3 (8) Cost per station (Item 6) multiplied by the LOS (Item 7) divided by 1,000 (9) Distribution of building, land, vehicle, and equipment values
Credit Component
To avoid overcharging new development for the fire rescue impact fees, a review of the
capital financing program was completed. The purpose of this review was to determine any
potential revenue credits generated by new development that are being used for expansion
of capital facilities, land, vehicles, and equipment included in the inventory. It should be
noted that the credit component does not include any capital renovation, maintenance, or
operations expenses, as these types of expenditures cannot be funded with impact fee
revenue.
Capital Expansion Expenditure Credit To calculate the capital expansion expenditure credit per functional resident, the historical
capital expansion projects and those programmed in the CIP are reviewed. During the time
period from 2009 through 2019, the County allocated an average annual non-impact fee
funding of $732,000 toward fire rescue capital facilities. The annual capital expansion
expenditures for fire rescue was divided by the average functional residents for its respective
service area for the same period in order to calculate the average capital expansion cost per
Description FigurePercent of
Total Value(9)
Building Value(1) $86,613,230 47.98%
Land Value(2) $14,499,000 8.03%
Vehicle and Equipment Value(3) $79,394,430 43.99%
Total Asset Value(4) $180,506,660 100.00%
Number of Stations(5) 40
Cost per Station(6) $4,512,667
LOS(7) 0.050
Total Impact Cost per Resident(8) $225.63

DRAFT
Tindale Oliver Palm Beach County September 2015 V-8 Impact Fee Update Study
functional resident. As presented in Table V-6, the result is an average annual expansion cost
of $0.91 per functional resident.
Once the capital expansion credit per functional resident is calculated, because the fire rescue
capacity projects were funded with ad valorem revenues, an adjustment was made to
account for the fact that new homes tend to pay higher taxes per dwelling unit. This
adjustment factor was estimated based on a comparison of the average taxable value of
homes built over the past five years to that of all homes. As presented in Table V-6, the
adjusted capital expansion credit per resident is $1.59.
Table V-6 Fire Protection & Rescue Capital Expansion Funding Sources
(1) Source: Palm Beach County, expenditures shown represent cash payments during the indicated time period
and excludes portions that were funded with impact fee revenues, or outside of the time frame indicated. (2) Average annual capital expenditures over the 11-year period (3) Source: Appendix A, Table A-12 (4) Average annual capital expansion expenditures (Item 2) divided by average annual functional population
(Item 3) (5) Adjustment factor to reflect higher ad valorem taxes paid by new homes (6) Capital expansion expenditures per functional resident (Item 4) multiplied by the credit adjustment factor
(Item 5)
Description(1) FY 2009 - FY 2013 FY 2014 - FY 2019 Total
Ad Valorem
Station 56 $287,384 $0 $287,384
Training Facility $3,135,446 $0 $3,135,446
Sem Pratt/Bee Ln $349 $0 $349
Station 44 $26,650 $0 $26,650
Agriculture Reserve South $0 $2,500,000 $2,500,000
Fire Station #41 South $0 $100,000 $100,000
Southern Blvd 20 Mile Bend Station $0 $2,000,000 $2,000,000
Total Capital Expansion Expenditures $3,449,830 $4,600,000 $8,049,830
$731,803
805,144
$0.91
1.75
$1.59
Capital Expansion Expenditures per Functional Resident(4)
Average Annual Functional Population(3)
Average Annual Capital Expansion Expenditures(2)
Credit Adjustment Factor(5)
Adjusted Capital Expansion Expenditures per Resident(6)

DRAFT
Tindale Oliver Palm Beach County September 2015 V-9 Impact Fee Update Study
Net Fire Protection & Rescue Impact Cost
The net impact fee per functional resident is the difference between the cost component and
the credit component. Table V-7 summarizes the calculation of the net fire rescue impact
costs per functional resident.
The first section of this table identifies the total impact cost as $226 per functional resident
for fire rescue services. The second section of the table identifies the revenue credits for the
fire rescue services based on the adjusted capital expansion credit from Table V-6. The net
impact cost per functional resident is the difference between the total impact cost and the
total capital improvement credit per functional resident, and is calculated at $199 per
resident for residential land uses and at $210 for non-residential land uses.
Table V-7
Net Fire Protection & Rescue Impact Cost per Functional Resident
(1) Source: Table V-5 (2) Source: Table V-6 (3) Average annual capital improvement credit per functional resident (Item 2) over a
capitalization rate of 3.4% for 25 years. Capitalization rate estimate is provided by Palm Beach County and 25 years reflects the time frame when structures start needing major repairs/renovation.
(4) Total impact cost per functional resident (Item 1) less total revenue credit per functional resident (Item 3)
Impact Cost / Credit Element Figure
Total Impact Cost per Functional Resident(1) $225.63
- Residential Land Uses $1.59
- Non-residential Land Uses $0.91
Capitalization Rate 3.4%
Capitalization Period (in years) 25
- Residential Land Uses $26.49
- Non-residential Land Uses $15.16
Net Impact Cost per Functional Resident(4):
- Residential Land Uses $199.14
- Non-residential Land Uses $210.47
Net Impact Cost
Impact Cost
Revenue Credit
Capital Improvement Credit per Functional Resident (2):
Total Capital Improvement Credit per Resident(3)

DRAFT
Tindale Oliver Palm Beach County September 2015 V-10 Impact Fee Update Study
Calculated Fire Protection & Rescue Impact Fee Schedule
Table V-8 presents the calculated fire rescue impact fee schedule developed for Palm Beach
County for both residential and non-residential land uses, based on the net impact cost per
functional resident for fire rescue services previously presented in Table V-7. These fees will
only apply to development in the fire rescue service area mentioned previously. Because the
County is currently not collecting these fees, a fee comparison is not provided in this table.
Fire Protection & Rescue Fee Schedule Comparison
As part of the work effort in updating Palm Beach County’s fire rescue impact fee program, a
comparison to impact fee schedules of other Florida counties was completed. Table V-9
presents this comparison. The fees shown for Palm Beach County are applicable to
development in the fire rescue service area mentioned previously.
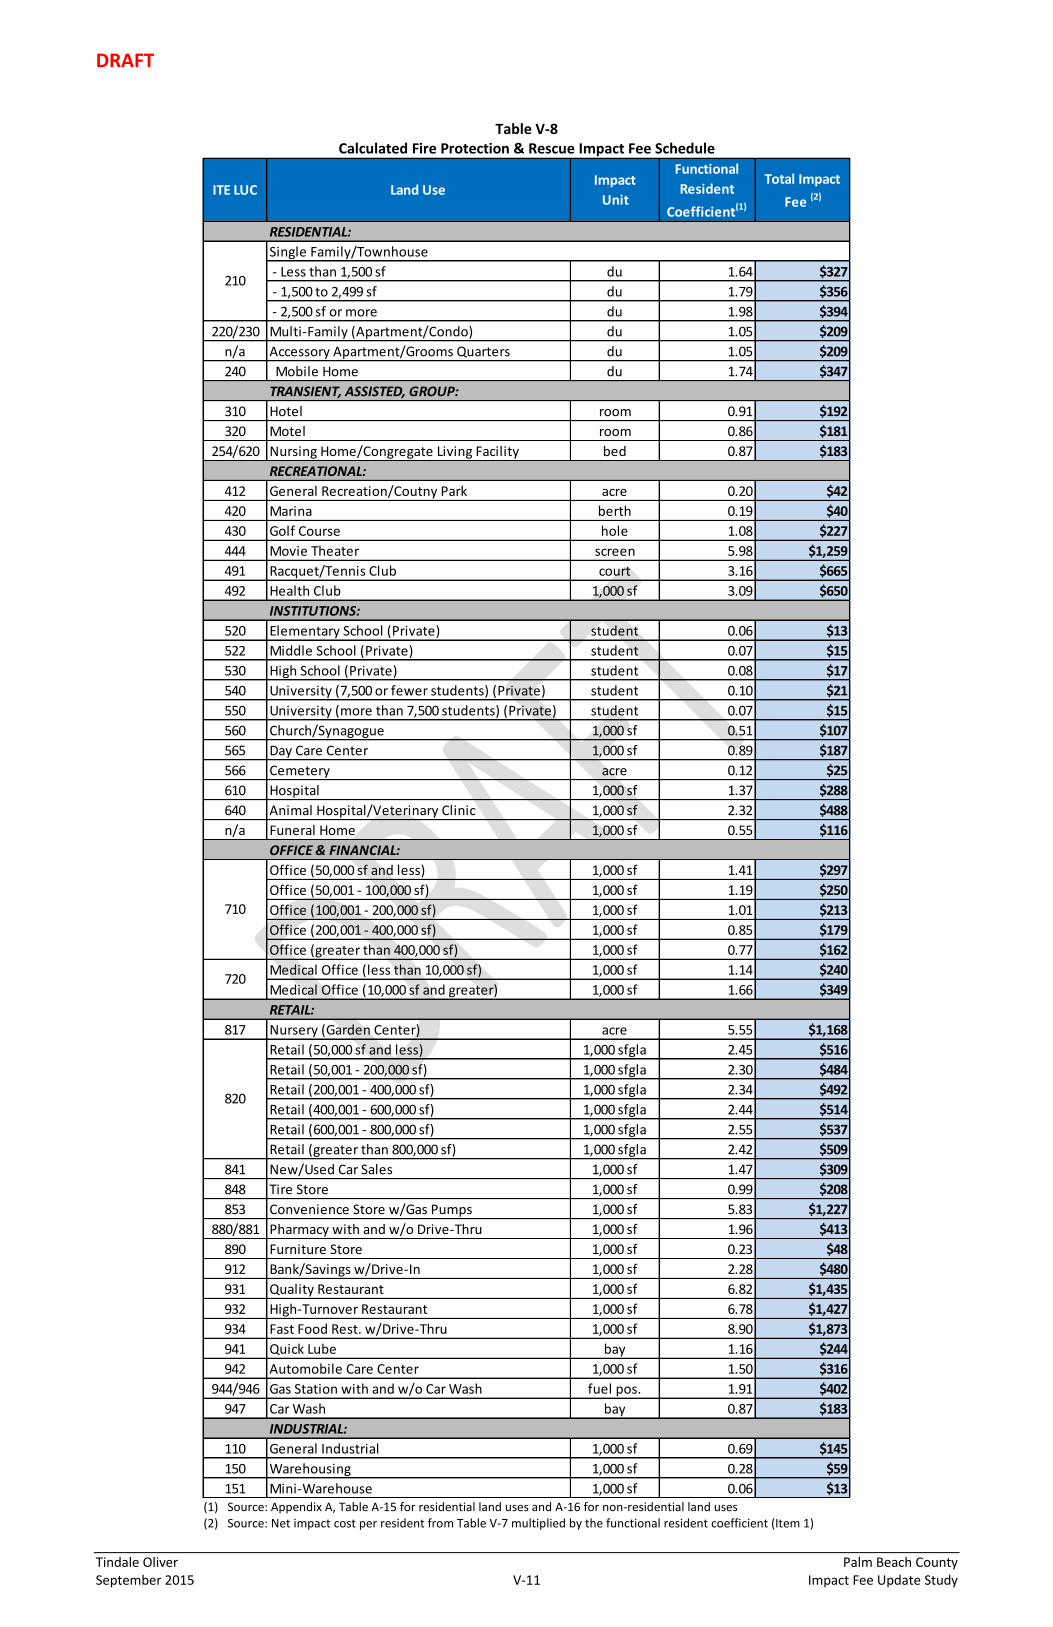
DRAFT
Tindale Oliver Palm Beach County September 2015 V-11 Impact Fee Update Study
Table V-8 Calculated Fire Protection & Rescue Impact Fee Schedule
(1) Source: Appendix A, Table A-15 for residential land uses and A-16 for non-residential land uses (2) Source: Net impact cost per resident from Table V-7 multiplied by the functional resident coefficient (Item 1)
ITE LUC Land UseImpact
Unit
Functional
Resident
Coefficient(1)
Total Impact
Fee (2)
RESIDENTIAL:
- Less than 1,500 sf du 1.64 $327
- 1,500 to 2,499 sf du 1.79 $356
- 2,500 sf or more du 1.98 $394
220/230 Multi-Family (Apartment/Condo) du 1.05 $209
n/a Accessory Apartment/Grooms Quarters du 1.05 $209
240 Mobile Home du 1.74 $347
TRANSIENT, ASSISTED, GROUP:
310 Hotel room 0.91 $192
320 Motel room 0.86 $181
254/620 Nursing Home/Congregate Living Facility bed 0.87 $183
RECREATIONAL:
412 General Recreation/Coutny Park acre 0.20 $42
420 Marina berth 0.19 $40
430 Golf Course hole 1.08 $227
444 Movie Theater screen 5.98 $1,259
491 Racquet/Tennis Club court 3.16 $665
492 Health Club 1,000 sf 3.09 $650
INSTITUTIONS:
520 Elementary School (Private) student 0.06 $13
522 Middle School (Private) student 0.07 $15
530 High School (Private) student 0.08 $17
540 University (7,500 or fewer students) (Private) student 0.10 $21
550 University (more than 7,500 students) (Private) student 0.07 $15
560 Church/Synagogue 1,000 sf 0.51 $107
565 Day Care Center 1,000 sf 0.89 $187
566 Cemetery acre 0.12 $25
610 Hospital 1,000 sf 1.37 $288
640 Animal Hospital/Veterinary Clinic 1,000 sf 2.32 $488
n/a Funeral Home 1,000 sf 0.55 $116
OFFICE & FINANCIAL:
Office (50,000 sf and less) 1,000 sf 1.41 $297
Office (50,001 - 100,000 sf) 1,000 sf 1.19 $250
Office (100,001 - 200,000 sf) 1,000 sf 1.01 $213
Office (200,001 - 400,000 sf) 1,000 sf 0.85 $179
Office (greater than 400,000 sf) 1,000 sf 0.77 $162
Medical Office (less than 10,000 sf) 1,000 sf 1.14 $240
Medical Office (10,000 sf and greater) 1,000 sf 1.66 $349
RETAIL:
817 Nursery (Garden Center) acre 5.55 $1,168
Retail (50,000 sf and less) 1,000 sfgla 2.45 $516
Retail (50,001 - 200,000 sf) 1,000 sfgla 2.30 $484
Retail (200,001 - 400,000 sf) 1,000 sfgla 2.34 $492
Retail (400,001 - 600,000 sf) 1,000 sfgla 2.44 $514
Retail (600,001 - 800,000 sf) 1,000 sfgla 2.55 $537
Retail (greater than 800,000 sf) 1,000 sfgla 2.42 $509
841 New/Used Car Sales 1,000 sf 1.47 $309
848 Tire Store 1,000 sf 0.99 $208
853 Convenience Store w/Gas Pumps 1,000 sf 5.83 $1,227
880/881 Pharmacy with and w/o Drive-Thru 1,000 sf 1.96 $413
890 Furniture Store 1,000 sf 0.23 $48
912 Bank/Savings w/Drive-In 1,000 sf 2.28 $480
931 Quality Restaurant 1,000 sf 6.82 $1,435
932 High-Turnover Restaurant 1,000 sf 6.78 $1,427
934 Fast Food Rest. w/Drive-Thru 1,000 sf 8.90 $1,873
941 Quick Lube bay 1.16 $244
942 Automobile Care Center 1,000 sf 1.50 $316
944/946 Gas Station with and w/o Car Wash fuel pos. 1.91 $402
947 Car Wash bay 0.87 $183
INDUSTRIAL:
110 General Industrial 1,000 sf 0.69 $145
150 Warehousing 1,000 sf 0.28 $59
151 Mini-Warehouse 1,000 sf 0.06 $13
820
720
210
Single Family/Townhouse
710

DRAFT
Tindale Oliver Palm Beach County September 2015 V-12 Impact Fee Update Study
Table V-9 Fire Protection & Rescue Impact Fee Schedule Comparison
(1) du = dwelling unit (2) Source: Table V-8 (3) Source: Palm Beach County Department of Planning, Zoning, and Building (4) Source: Martin County Growth Management Department. Fire rescue fee shown (5) Source: Glades County Planning Zoning Department. No fee for Fire. EMS fee is currently under moratorium through February 12, 2016 (6) Source: Miami-Dade County Impact Fee Division. No fee for EMS (7) Source: St. Lucie County planning & Development Department. Fire and EMS rates combined. Fees were adopted at 100% and have since been indexed annually using the CPI (8) Source: Collier County Impact Fee Administration Department. Fees were adopted at 100%; Fees shown include the EMS fee and an average fire fee across all districts (9) Source: Municode; Highlands County Code of Ordinances, Section 13-28; IF moratorium in effect through June 30, 2017. Fire and EMS rates combined (10) Source: Orange County Planning & Development Department. No fee for EMS (11) Source: Hillsborough County Development Services Department. No fee for EMS (12) Source: Okeechobee County Planning & Development Department
Calculated(2) Existing(3)
Date of Last Update 2014 2012 2012 2008 N/A 2009 2010 2006 2011 1985 2012
Adoption Percentage N/A 0% 100% 100% N/A 100% 100% 25% N/A 100% 100%
Residential:
Single Family (2,000 sf) du $356 $0 $599 $118 $409 $566 $1,065 $190 $270 $49 $574
Non-Residential:
Light Industrial 1,000 sf $145 $0 $12 $42 $1,326 $75 $676 $83 $50 $9 $119
Office (50,000 sq ft) 1,000 sf $297 $0 $80 $75 $325 $334 $725 $200 $117 $41 $278
Retail (125,000 sq ft) 1,000 sfgla $484 $0 $319 $115 $438 $525 $781 $280 $297 $22 $595
Bank w/Drive-Thru 1,000 sf $480 $0 $80 $163 $325 $525 $783 $284 $297 $23 $595
Fast Food w/Drive-Thru 1,000 sf $1,873 $0 $575 $468 $438 $525 $1,233 $1,079 $297 $23 $595
Okeechobee
County(12)Land Use Unit(1)
Palm Beach County Martin
County(4)
Glades
County(5)
Miami-Dade
County(6)
St. Lucie
County(7)
Collier
County(8)
Highlands
County(9)
Orange
County(10)
Hillsborough
County(11)

DRAFT
Tindale Oliver Palm Beach County September 2015 VI-1 Impact Fee Update Study
VI. Law Enforcement Impact Fee
Law enforcement impact fees are typically used to fund the capital construction and
expansion of police service related land, facilities and capital equipment required to support
the additional law enforcement service demand created by new growth. In the case of Palm
Beach County’s law enforcement impact fee program, the inventory is limited to vehicles and
equipment because buildings and land are included in the public buildings impact fee
program. This section of the report presents the results of the law enforcement impact fee
update study for Palm Beach County and will serve as the technical support document for the
calculated law enforcement impact fee schedule.
There are several major elements associated with the development of the law enforcement
impact fee. These include:
Capital Asset Inventory
Service Area, Benefit Districts, and Population
Level of Service
Cost Component
Credit Component
Net Law Enforcement Impact Cost
Calculated Law Enforcement Impact Fee Schedule
Law Enforcement Impact Fee Schedule Comparison
Capital Asset Inventory
As mentioned previously, all buildings and land associated with law enforcement have been
captured as part of the public buildings impact fee section of this report (Section VII).
Therefore, the law enforcement impact fee will be based only on the vehicle and equipment
value. Because local data was not available, the vehicle and equipment cost is based on
figures observed in other Florida jurisdictions and is estimated at $50,000 per officer.

DRAFT
Tindale Oliver Palm Beach County September 2015 VI-2 Impact Fee Update Study
Service Area, Benefit Districts, and Population
Palm Beach County provides law enforcement services in the unincorporated county, as well
as, additional 13 cities located throughout the county. These additional cities are shown in
Appendix A, Table A-21. Therefore, the appropriate benefit district for law enforcement is the
combination of the unincorporated county plus the 13 additional cities, excluding the Glades
area, which is exempt from paying impact fees. For impact fee calculations, the current 2014
weighted and functional population estimates are used for the law enforcement impact fee.
Level of Service
Based on the information provided by Palm Beach County, the 2014 achived LOS is 1.82 sworn
officers per 1,000 weighted residents. Table VI-1 presents the calculation of the existing LOS.
While the 2014 LOS is 1.82 officers per 1,000 weighted residents, in order to calculate the
law enforcement impact fee, the LOS needs to be calculated in terms of officers per 1,000
functional residents. Table VI-1 also illustrates the calculation of the current LOS using the
total functional residents within the service area. The current LOS of law enforcement
services is 2.13 officers per 1,000 functional residents.
Table VI-1 Level of Service (2014)
(1) Source: Appendix A, Table A-1 for weighted population and Table A-12 for functional
population; Unincorporated population and several cities served by the Palm Beach County Sheriff
(2) Source: Palm Beach County (3) Number of officers (Item 2) divided by the population (Item 1) and multiplied by 1,000
Table VI-2 summarizes a LOS comparison between Palm Beach County and other Florida
counties. The LOS is displayed in terms of permanent population for all jurisdictions because
a functional population analysis has not been completed for these entities. The LOS
comparison is based on the permanent population for 2013, as this is the most recent
Weighted
Population
Functional
Population
Population(1) 818,439 699,882
Number of Officers(2) 1,492 1,492
LOS (officers per 1,000 residents)(3) 1.82 2.13
Component
Year 2014

DRAFT
Tindale Oliver Palm Beach County September 2015 VI-3 Impact Fee Update Study
population data available for all jurisdictions. For consistency purposes, all data was retrieved
from the FDLE Criminal Justice Agency Profile Report.
Table VI-2 Level of Service Comparison
(1) Source: Florida Department of Law Enforcement Criminal Justice Agency Profile Report,
2013 (2) Permanent population (Item 1) divided by the number of officers (Item 2) and
multiplied by 1,000
Cost Component
The cost component of the study evaluates the cost of vehicles and equipment only. Table
VI-3 also presents the cost per functional resident for the impact fee analysis. This cost was
calculated as the estimated capital cost of $50,000 per officer multiplied by the LOS of 2.13
officers per 1,000 functional residents divided by 1,000. As shown in the following table, the
total impact cost per resident is approximately $107 for law enforcement facilities.
Table VI-3 Unit Cost per Functional Resident
(1) Source: Based on the information from other Florida jurisdictions. See Appendix
C for further detail (2) Source: Table VI-1 (3) Vehicle and equipment value per officer (Item 1) multiplied by the LOS (Item 2)
divided by 1,000
Jurisdiction
Service Area
Population
(2013)(1)
Number of
Officers(1)
LOS (Officers
per 1,000
Residents)(2)
Collier County 297,512 270 0.91
Highlands County 77,026 99 1.29
Hillsborough County 869,181 1,123 1.29
Okeechobee County 34,212 47 1.37
Martin County 129,434 183 1.41
Palm Beach County (Existing) 771,775 1,245 1.61
Hendry County 30,557 52 1.70
Orange County 772,688 1,376 1.78
St. Lucie County 71,508 137 1.92
Glades County 12,658 25 1.98
Component Cost
Vehicle and Equipment Value per Officer(1) $50,000
LOS (Officers/1,000 Functional Residents)(2) 2.13
Cost per Functional Resident(3) $106.50

DRAFT
Tindale Oliver Palm Beach County September 2015 VI-4 Impact Fee Update Study
Credit Component
Discussion with the Palm Beach County Sheriff’s Office suggested that there were no new
officers added in the past five years and none is planned to be added in the near future. As
such, the Sheriff’s Office did not purchase any additional vehicles or equipment. Given this,
a credit is not necessary.
Net Law Enforcement Impact Cost
Because there is no credit, net law enforcement impact cost per resident is $107.
Calculated Law Enforcement Impact Fee Schedule
Table VI-4 presents the calculated law enforcement impact fee schedule developed for Palm
Beach County for both residential and non-residential land uses, based on the unit impact
cost per functional resident previously presented in Table VI-3. The table also includes a
comparison to the current/adopted fees.
Law Enforcement Impact Fee Schedule Comparison
As part of the work effort in updating Palm Beach County’s law enforcement impact fee
schedule, the County’s calculated impact fee schedule was compared to the adopted fee
schedule and those in similar or nearby jurisdictions. Table VI-5 presents this comparison.
The calculated fees for Palm Beach County are lower than most other jurisdictions because
in the case of Palm Beach County law enforcement impact fee, the inventory is limited to
vehicles and equipment while in the case of most other counties, law enforcement buildings
are included in the law enforcement impact fee calculations.

DRAFT
Tindale Oliver Palm Beach County September 2015 VI-5 Impact Fee Update Study
Table VI-4 Calculated Law Enforcement Impact Fee Schedule
(1) Source: Appendix A, Table A-14 for residential land uses and A-16 for non-residential land uses
(2) Source: Net impact cost per resident from Table VI-3 multiplied by the functional resident coefficient (Item 1)
(3) Source: Palm Beach County Department of Planning, Zoning, and Building
(4) Percent change from the current adopted fee (Item 3) to the total impact fee (Item 2)
(5) N/A - Land use is not specifically identified in the County's current fee schedule.
“Unit change” refers to a change in the impact unit, and therefore, a change in the fee level is not provided.
ITE LUC Land UseImpact
Unit
Functional
Resident
Coefficient(1)
Total Impact
Fee (2)
Current
Adopted
Fee(3)
Percent
Change(4)
RESIDENTIAL:
- Less than 1,500 sf du 1.66 $177 $128 38%
- 1,500 to 2,499 sf du 1.80 $192 $128 50%
- 2,500 sf or more du 2.00 $213 $128 66%
220/230 Multi-Family (Apartment/Condo) du 1.06 $113 $70 61%
n/a Accessory Apartment/Grooms Quarters du 1.06 $113 $70 61%
240 Mobile Home du 1.79 $191 $70 173%
TRANSIENT, ASSISTED, GROUP:
310 Hotel room 0.91 $97 $82 18%
320 Motel room 0.86 $92 $82 12%
254/620 Nursing Home/Congregate Living Facility bed 0.87 $93 $10 Unit Change
RECREATIONAL:
412 General Recreation/County Park acre 0.20 $21 N/A N/A
420 Marina berth 0.19 $20 N/A N/A
430 Golf Course hole 1.08 $115 N/A N/A
444 Movie Theater screen 5.98 $637 $57 Unit Change
491 Raquet/Tennis Club court 3.16 $337 $57 491%
492 Health Club 1,000 sf 3.09 $329 N/A N/A
INSTITUTIONS:
520 Elementary School (Private) student 0.06 $6 N/A N/A
522 Middle School (Private) student 0.07 $7 N/A N/A
530 High School (Private) student 0.08 $9 N/A N/A
540 University (7,500 or fewer students) (Private) student 0.10 $11 N/A N/A
550 University (more than 7,500 students) (Private) student 0.07 $7 N/A N/A
560 Church/Synagogue 1,000 sf 0.51 $54 $57 -5%
565 Day Care Center 1,000 sf 0.89 $95 $57 67%
566 Cemetery acre 0.12 $13 N/A N/A
610 Hospital 1,000 sf 1.37 $146 $10 1360%
640 Animal Hospital/Veterinary Clinic 1,000 sf 2.32 $247 $57 333%
n/a Funeral Home 1,000 sf 0.55 $59 $57 4%
OFFICE & FINANCIAL:
Office (50,000 sf and less) 1,000 sf 1.41 $150 $10 1400%
Office (50,001 - 100,000 sf) 1,000 sf 1.19 $127 $10 1170%
Office (100,001 - 200,000 sf) 1,000 sf 1.01 $108 $10 980%
Office (200,001 - 400,000 sf) 1,000 sf 0.85 $91 $10 810%
Office (greater than 400,000 sf) 1,000 sf 0.77 $82 $10 720%
Medical Office (less than 10,000 sf) 1,000 sf 1.14 $121 $10 1110%
Medical Office (10,000 sf and greater) 1,000 sf 1.66 $177 $10 1670%
RETAIL:
817 Nursery (Garden Center) acre 5.55 $591 $57 937%
Retail (50,000 sf and less) 1,000 sfgla 2.45 $261 $57 358%
Retail (50,001 - 200,000 sf) 1,000 sfgla 2.30 $245 $57 330%
Retail (200,001 - 400,000 sf) 1,000 sfgla 2.34 $249 $57 337%
Retail (400,001 - 600,000 sf) 1,000 sfgla 2.44 $260 $57 356%
Retail (600,001 - 800,000 sf) 1,000 sfgla 2.55 $272 $57 377%
Retail (greater than 800,000 sf) 1,000 sfgla 2.42 $258 $57 353%
841 New/Used Car Sales 1,000 sf 1.47 $157 $57 175%
848 Tire Store 1,000 sf 0.99 $105 $57 84%
853 Convenience Store w/Gas Pumps 1,000 sf 5.83 $621 $57 990%
880/881 Pharmacy with and w/o Drive-Thru 1,000 sf 1.96 $209 $57 267%
890 Furniture Store 1,000 sf 0.23 $24 $57 -58%
912 Bank/Savings w/Drive-In 1,000 sf 2.28 $243 $10 2330%
931 Quality Restaurant 1,000 sf 6.82 $726 $57 1174%
932 High-Turnover Restaurant 1,000 sf 6.78 $722 $57 1167%
934 Fast Food Rest. w/Drive-Thru 1,000 sf 8.90 $948 $57 1563%
941 Quick Lube bay 1.16 $124 $57 Unit Change
942 Automobile Care Center 1,000 sf 1.50 $160 $57 181%
944/946 Gas Station with and w/o Car Wash fuel pos. 1.91 $203 $57 256%
947 Car Wash bay 0.87 $93 $57 Unit Change
INDUSTRIAL:
110 General Industrial 1,000 sf 0.69 $73 $7 943%
150 Warehousing 1,000 sf 0.28 $30 $21 43%
151 Mini-Warehouse 1,000 sf 0.06 $6 $21 -71%
820
210
Single Family/Townhouse
710
720
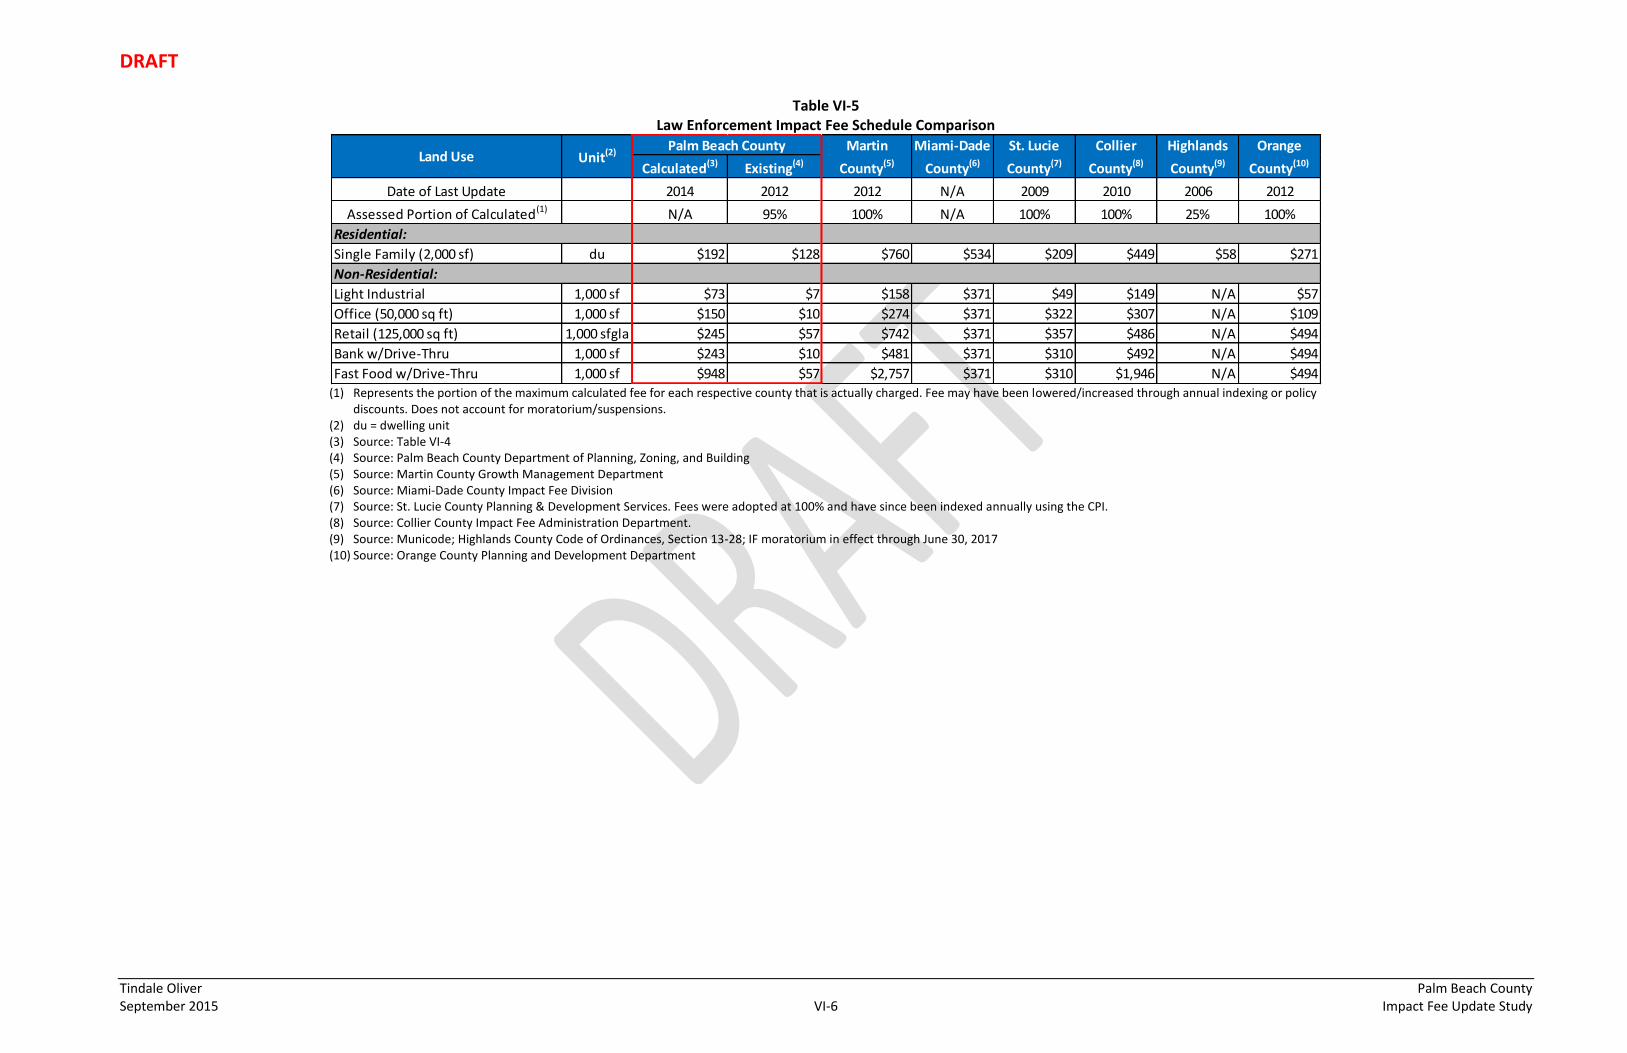
DRAFT
Tindale Oliver Palm Beach County September 2015 VI-6 Impact Fee Update Study
Table VI-5 Law Enforcement Impact Fee Schedule Comparison
(1) Represents the portion of the maximum calculated fee for each respective county that is actually charged. Fee may have been lowered/increased through annual indexing or policy
discounts. Does not account for moratorium/suspensions. (2) du = dwelling unit (3) Source: Table VI-4 (4) Source: Palm Beach County Department of Planning, Zoning, and Building (5) Source: Martin County Growth Management Department (6) Source: Miami-Dade County Impact Fee Division (7) Source: St. Lucie County Planning & Development Services. Fees were adopted at 100% and have since been indexed annually using the CPI. (8) Source: Collier County Impact Fee Administration Department. (9) Source: Municode; Highlands County Code of Ordinances, Section 13-28; IF moratorium in effect through June 30, 2017 (10) Source: Orange County Planning and Development Department
Calculated(3) Existing(4)
Date of Last Update 2014 2012 2012 N/A 2009 2010 2006 2012
Assessed Portion of Calculated(1) N/A 95% 100% N/A 100% 100% 25% 100%
Residential:
Single Family (2,000 sf) du $192 $128 $760 $534 $209 $449 $58 $271
Non-Residential:
Light Industrial 1,000 sf $73 $7 $158 $371 $49 $149 N/A $57
Office (50,000 sq ft) 1,000 sf $150 $10 $274 $371 $322 $307 N/A $109
Retail (125,000 sq ft) 1,000 sfgla $245 $57 $742 $371 $357 $486 N/A $494
Bank w/Drive-Thru 1,000 sf $243 $10 $481 $371 $310 $492 N/A $494
Fast Food w/Drive-Thru 1,000 sf $948 $57 $2,757 $371 $310 $1,946 N/A $494
Martin
County(5)Land Use Unit(2)
Palm Beach County Orange
County(10)
Miami-Dade
County(6)
Collier
County(8)
Highlands
County(9)
St. Lucie
County(7)

DRAFT
Tindale Oliver Palm Beach County September 2015 VII-1 Impact Fee Update Study
VII. Public Buildings Impact Fee
Public buildings impact fees are used to fund the land purchases, capital construction &
expansion of facilities, and capital equipment required to support the additional government
service demand created by growth.
There are several major elements associated with the development of the public buildings
impact fee. These include:
Facility Inventory
Service Area, Benefit Districts, and Population
Level of Service
Cost Component
Credit Component
Net Public Buildings Impact Cost
Calculated Public Buildings Impact Fee Schedule
Public Buildings Impact Fee Schedule Comparison
Facility Inventory
The public facilities inventory includes law enforcement and correctional facilities as well as
other public facilities that are primarily for the provision of essential county services and do
not include any of the buildings included in the calculation of other impact fees.
According to the information provided by Palm Beach County, the County has approximately
6.4 million square feet of general public facility space. This includes the square footage of
both primary and industrial support buildings. Support facilities are defined as trailers,
facilities without air-conditioning, lands used for staging, storage or other functions that are
integral to a particular government facility or facilities that are unlikely to be occupied by
personnel.
Table VII-1 shows a summary of the public buildings inventory and the current value of
buildings and land. As presented, the inventory includes a total of 4.7 million square feet of
primary building space and 1.7 million square feet of support space. Primary building square
footage is broken down into 2.0 million office and administrative square feet, 1.0 million

DRAFT
Tindale Oliver Palm Beach County September 2015 VII-2 Impact Fee Update Study
courthouse square feet, 1.3 million jail square feet, and 436,000 industrial square feet. For
further details, refer to Appendix D, Table D-1.
The building value of the facilities included in the inventory were estimated based on
insurance values, estimates for future buildings, and cost information obtained from other
jurisdictions. This analysis resulted in an estimated cost ranging from $25 per square foot for
industrial support buildings to $325 per square foot for primary courthouse square footage.
It is important to note that the County estimates are higher than unit costs used for impact
fee calculations, which are shown in Appendix C.
In addition to building value, land values were estimated for future land purchases. Land
value was determined primarily through a review of the value of parcels where the current
public buildings are located, as reported by the Palm Beach County Property Appraiser, an
analysis of vacant land sales and values of parcels of 0.6 to 20 acres in Palm Beach County,
and discussions with the County representatives. This analysis resulted in an average land
value of $175,000 per acre. Additional information, including the County’s estimates for
future land cost, is included in Appendix C.

DRAFT
Tindale Oliver Palm Beach County September 2015 VII-3 Impact Fee Update Study
Table VII-1 Summary of Public Building Facilities Inventory
(1) Source: Appendix D, Table D-1 (2) Source: Appendix C (3) Total square feet (Item 1) multiplied by building value per square foot (Item 2) (4) Source: Palm Beach County, represents the construction cost of communication towers, fuel islands, and
other similar structures (5) Source: Appendix D, Table D-2 (6) Source: Appendix C (7) Total allocated acreage (Item 5) multiplied by the land value per acre (Item 6) (8) Total building value ($1.3 billion) divided by total building square footage (Item 1) (9) Sum of total building value (Item 3), total building value of other structures (Item 4), and total land value
(Item 7) Service Area, Benefit Districts, and Population
Palm Beach County provides all residents, workers, and visitors the benefit of government
services. As such, the service area was determined to be the entire county. The appropriate
benefit district is also countywide, excluding the Glades Area.
To be consistent with the County’s Comprehensive Plan, for purposes of this technical
analysis, the weighted seasonal population is used in all population estimates and
projections. In addition, public buildings is one of the program areas where functional
population is used to capture the presence of all people within the community (including
residents, workers, and visitors) to arrive at a total estimate of effective population that
needs to be served. A more detailed explanation of weighted and functional population
estimates is provided in Appendix A.
Building Type LandTotal Square
Feet(1)
Building Value
per Square
Foot(2)
Total Asset
Value(3)
Primary Building - Office/Administrative 1,959,113 $250 $489,778,250
Primary Building - Court 953,711 $325 $309,956,075
Primary Building - Jail 1,307,947 $290 $379,304,630
Primary Building - Industrial 436,284 $200 $87,256,800
Industrial Support 1,730,219 $25 $43,255,475
Total - All Buildings 6,387,274 - $1,309,551,230
Other Structures(4) N/A $16,162,274
Total Allocated Acreage(5) 601.79
Land Value per Acre(6) $175,000
Total Land Value(7) $105,313,250
Weighted Building Cost per Square Foot(8) $205
$1,431,026,754Total Building, Other Structures and Land Value (9)

DRAFT
Tindale Oliver Palm Beach County September 2015 VII-4 Impact Fee Update Study
Level of Service
Based on the information provided by the County, Palm Beach County’s 2014 achieved level
of service (LOS) is 3.23 square feet of primary facilities per weighted resident. Table VII-2
presents the calculation of the existing LOS as well as the calculation of the existing LOS per
functional resident. As shown, the 2014 LOS is 3.30 square feet per functional resident.
Table VII-2
Current Level of Service
(1) Source: Appendix A, Tables A-1 and A-12
(2) Source: Table VII-1
(3) Total square footage (Item 2) divided by the countywide population (Item 1)
Cost Component
The cost component of the study evaluates the cost of capital items, including buildings and
land. Table VII-3 provides a summary of all capital costs, which amounts to $307 per square
foot of primary public buildings, and $1,014 per functional resident.
Weighted
Population
Functional
Population
Population(1) 1,443,996 1,410,200
Public Buildings Square Footage (Primary Buildings) (2) 4,657,055 4,657,055
Achieved LOS (Sq. Ft. per Resident) (3) 3.23 3.30
Component
Year 2014

DRAFT
Tindale Oliver Palm Beach County September 2015 VII-5 Impact Fee Update Study
Table VII-3 Public Building Total Cost per Functional Resident
(1) Source: Table VII-1 (2) Source: Table VII-1 (3) Sum of building value (Item 1) and land value (Item 2) (4) Source: Table VII-2 (5) Total building and land value (Item 3) divided by primary building square footage (Item 4) (6) Source: Table VII-2 (7) Building and land value per square foot (Item 5) multiplied by building square footage per
functional resident (Item 6) (8) Percentage distribution of building value and land value in relation to the combined building
and land value
Credit Component
To avoid overcharging development for the public buildings impact fee, a review of the capital
financing program for public buildings was conducted. The purpose of this review was to
determine any potential revenue credits that should be considered for revenues generated
by new development that could be used for capital facilities and land expansion for public
buildings.
It should be noted that the credit component does not include any capital renovation,
maintenance, or operations expenses, as these types of expenditures cannot be funded with
impact fee revenue.
Capital Expansion Expenditure Credit To estimate an average annual non-impact fee expenditure, capital projects funded during
the past six years and programmed for the next five years were reviewed. The County funds
public buildings primarily with ad valorem and grant revenues. Based on this trend, an
average credit of $0.80 per functional resident is calculated as shown in Table VII-4.
Cost Component FigurePercent of
Total Value(8)
Total Building Value(1) $1,325,713,504 92.64%
Total Land Value(2) $105,313,250 7.36%
Total Building and Land Value (3) $1,431,026,754 100.00%
Primary Building Square Footage (4) 4,657,055
Total Building and Land Value per Square Foot(5) $307.28
Achieved LOS - Bldg Sq Ft per Functional Resident(6) 3.30
Total Impact Cost per Functional Resident(7) $1,014.02

DRAFT
Tindale Oliver Palm Beach County September 2015 VII-6 Impact Fee Update Study
Once the capital expansion credit per functional resident is calculated, an adjustment is
needed for the portion funded with ad valorem revenues to account for the fact that new
homes tend to pay higher taxes per dwelling unit. This adjustment factor was estimated
based on a comparison of the average taxable value of homes built over the past five years
to that of all homes. As presented in Table VII-4, the adjusted annual capital expansion credit
per resident is $1.21 for residential land uses. For non-residential land uses, the credit is
$0.80 per resident per year.
Debt Service Credit Table IV-5 summarizes the outstanding debt service related to public buildings capital
expansion projects. To calculate the credit of the current debt obligations, the present value
of the total remaining payments is calculated and then divided by the average annual
functional population estimated over the remaining life of each bond issue. As shown in Table
VII-5, the resulting credit for public buildings-related debt is $127.66 per functional resident.

DRAFT
Tindale Oliver Palm Beach County September 2015 VII-7 Impact Fee Update Study
Table VII-4 Public Buildings Capital Expansion Funding Sources
(1) Source: Palm Beach County, expenditures shown represent cash payments during the indicated time period and excludes
portions that were funded with bond issues or impact fees, or outside of the time frame indicated. (2) Total capital expansion expenditures divided by 11 to calculate the average annual expenditures (3) Source: Appendix A, Table A-12, average annual functional population during the same time period (4) Average annual capital expansion expenditures (Item 2) divided by the average functional population (Item 3) (5) Portion of total capital expansion expenditures funded by ad valorem tax revenue (6) Capital expansion expenditures per functional resident (Item 4) multiplied by the portion of capital expansion projects
funded with ad valorem tax revenues (Item 5) (7) Adjustment factor to reflect higher ad valorem taxes paid by new homes
Expenditure(1) FY 2009-2013 FY 2014 FY 2015 FY 2016 FY 2017 FY 2018 FY 2019 Total
Ad Valorem :
South County Courthouse $195,647 - - - - - - $195,647
Jail Expansion $3,678,967 - - - - - - $3,678,967
Vista Center Parcel 22 $577,941 - - - - - - $577,941
PBSO Aviation $434,521 - - - - - - $434,521
West County Senior Center - - - $510,000 - - - $510,000
High Ridge South County - - - - - - $2,500,000 $2,500,000
High Ridge Athletic Facilities - - - $25,000 - - $25,000
FD&O Land Acquisition $600,000 - - - - - - $600,000
Subtotal -- Expenditures Funded with Ad Valorem $5,487,076 $0 $0 $535,000 $0 $0 $2,500,000 $8,522,076
Grants/Other:
PBSO Aviation $56,643 - - - - - - $56,643
PBSO West Atlantic Avenue - $1,800,000 - - - - - $1,800,000
West County Senior Center - - $250,000 $1,790,000 - - - $2,040,000
Subtotal -- Expenditures Funded with Grants $56,643 $1,800,000 $250,000 $1,790,000 $0 $0 $0 $3,896,643
Total Capital Expansion Expenditures $5,543,719 $1,800,000 $250,000 $2,325,000 $0 $0 $2,500,000 $12,418,719
$1,128,974
1,416,514
$0.80
69%
$0.55
1.75
$0.96
$0.25
$1.21
Average Annual Functional Population(3)
Capital Expansion Expenditures per Functional Resident(4)
Portion of capital expansion projects Funded with Ad Valorem Tax Revenues(5)
Portion Funded with Ad-Valorem Tax Revenues(6)
Average Annual Capital Expansion Expenditures(2)
Residential Land Uses Credit Adjustment Factor(7)
Residential Land Uses: Adjusted Capital Expansion Expenditures per Resident(8)
Portion Funded with Other Revenue Sources(9)
Residential Land Uses: Total Capital Expansion Credit per Resident(10)
DRAFT
Tindale Oliver Palm Beach County September 2015 VII-8 Impact Fee Update Study
(8) Portion funded with ad-valorem tax revenues (Item 6) multiplied by the residential land uses credit adjustment factor (Item 7)
(9) Capital expansion expenditures per functional resident (Item 4) less portion funded with ad-valorem tax revenues (Item 6) (10) Adjusted capital expansion expenditures per resident (Item 8) plus the portion funded with other revenue sources (Item 9)

DRAFT
Tindale Oliver Palm Beach County September 2015 VII-9 Impact Fee Update Study
Table VII-5 Palm Beach County Public Buildings Debt Service
(1), (2), (3), (4) Source: Palm Beach County (5) Source: Appendix A, Table A-12 (6) Present value of payments remaining (Item 4) divided by average annual functional population (Item 5)
Net Public Buildings Impact Cost
The net impact fee per functional resident is the difference between the Cost Component
and the Credit Component. Table VII-6 presents the calculation of the net public buildings
facilities impact cost per functional resident.
The first section of Table VII-6 identifies the total impact cost as $1,014 per functional
resident. The second section of the table identifies the revenue credits for both the capital
expansion improvement credit and the debt service credit for the public buildings facilities
impact fee. The capital expansion improvement credit amounts to $20 per functional
resident for residential lands uses and $13 per functional resident for non-residental land
uses. In addition, the debt service credit is $128 per resident.
The net impact cost per functional resident (third section of the table) is calculated as the
total impact cost per functional resident of $1,014 less the total capital improvement credit
and the debt service credit. These calculations result in a net impact cost per functional
resident of $866 for residential land uses and $873 for non-residential land uses.
Description
Total Number of
Fiscal Years of Debt
Issue(1)
Fiscal Years
Remaining(2)
Total Remaining Public
Bldgs Debt Service
(Capacity Expansion)(3)
Present Value of Payments
Remaining (Capacity
Expansion)(4)
Avg Annual Functional
Population During
Remaining Bond Issue
Period(5)
Credit per
Resident(6)
$9.5M Judicial Parking Revenue Refunding Bonds,
Series 200511 2 $2,295,400 $2,267,400 1,433,629 $1.58
$13.5M Revenue Refunding Bonds; North County
Courthouse/Sheriff's Motor Pool, Series 200513 4 $6,589,425 $6,237,959 1,451,080 $4.30
$14.7M Judicial Parking Facilities Expansion,
Series 200621 13 $14,570,500 $11,362,966 1,526,577 $7.44
$176.6M Public Improvement Revenue Bonds;
Jail Expansion, Series 200830 24 $270,374,180 $165,100,650 1,605,195 $102.85
Initial Funding of Max Planck Proj and Refunding
of SS Loans, Series 20154 4 $17,956,713 $16,666,626 1,451,080 $11.49
Total Debt Service Credit per Functional Resident $127.66

DRAFT
Tindale Oliver Palm Beach County September 2015 VII-10 Impact Fee Update Study
Table VII-6 Net Public Buildings Impact Cost per Functional Resident
(1) Source: Table VII-3 (2) Source: Table VII-4 (3) Average annual capital improvement credit per functional resident (Item
2) over a capitalization rate of 3.4% for 25 years. Capitalization rate estimate is provided by Palm Beach County and 25 years reflects the time frame when structures start needing major repairs/renovation.
(4) Source: Table VII-5 (5) Total impact cost per functional resident (Item 1) less the total capital
improvement credit per functional resident (Item 3) less the debt service credit per functional resident (Item 4)
Calculated Public Buildings Impact Fee Schedule
Table VII-7 presents the calculated public buildings impact fee schedule developed for Palm
Beach County for both residential and non-residential land uses, based on the net impact cost
per functional resident for public buildings previously presented in Table VII-6.
Impact Cost
Total Impact Cost per Functional Resident(1) $1,014.02
Revenue Credit
Capital Improvement Credit per Functional Resident(2):
- Residential Land Uses $1.21
- Non-residential Land Uses $0.80
Capitalization Rate 3.4%
Capitalization Period (in years) 25
Total Capital Improvement Credit per Functional Resident(3)
- Residential Land Uses $20.16
- Non-residential Land Uses $13.33
Debt Service Credit per Functional Resident(4) $127.66
Net Impact Cost
Net Impact Cost per Functional Resident(5):
- Residential Land Uses $866.20
- Non-residential Land Uses $873.03
FigureImpact Cost/ Credit Element

DRAFT
Tindale Oliver Palm Beach County September 2015 VII-11 Impact Fee Update Study
Table VII-7 Calculated Public Buildings Impact Fee Schedule
(1) Source: Appendix A, Table A-13 for residential land uses and A-16 for non-residential land uses (2) Source: Net impact cost per resident from Table VII-6 multiplied by the functional resident coefficient (Item 1) (3) Source: Palm Beach County Department of Planning, Zoning, and Building (4) Percent change from the current adopted fee (Item 3) to the total impact fee (Item 2) (5) N/A - Land use is not specifically identified in the County's current fee schedule.
“Unit change” refers to a change in the impact unit, and therefore, a change in the fee level is not provided.
ITE LUC Land UseImpact
Unit
Functional
Resident
Coefficient(1)
Total Impact
Fee (2)
Current
Adopted Fee(3)
Percent
Change(4)
RESIDENTIAL:
- Less than 1,500 sf du 1.60 $1,386 $171 711%
- 1,500 to 2,499 sf du 1.73 $1,499 $195 669%
- 2,500 sf or more du 1.92 $1,663 $223 646%
220/230 Multi-Family (Apartment/Condo) du 0.99 $858 $195 340%
n/a Accessory Apartment/Grooms Quarters du 0.99 $858 $171 402%
240 Mobile Home du 1.66 $1,438 $171 741%
TRANSIENT, ASSISTED, GROUP:
310 Hotel room 0.91 $794 $57 1293%
320 Motel room 0.86 $751 $57 1218%
254/620 Nursing Home/Congregate Living Facility bed 0.87 $760 $30 2433%
RECREATIONAL:
412 General Recreation/County Park acre 0.20 $175 $1,012 Unit Change
420 Marina berth 0.19 $166 N/A N/A
430 Golf Course hole 1.08 $943 N/A N/A
444 Movie Theater screen 5.98 $5,221 $11 Unit Change
491 Raquet/Tennis Club court 3.16 $2,759 $254 986%
492 Health Club 1,000 sf 3.09 $2,698 N/A N/A
INSTITUTIONS:
520 Elementary School (Private) student 0.06 $52 N/A N/A
522 Middle School (Private) student 0.07 $61 N/A N/A
530 High School (Private) student 0.08 $70 N/A N/A
540 University (7,500 or fewer students) (Private) student 0.10 $87 N/A N/A
550 University (more than 7,500 students) (Private) student 0.07 $61 N/A N/A
560 Church/Synagogue 1,000 sf 0.51 $445 $61 630%
565 Day Care Center 1,000 sf 0.89 $777 $299 160%
566 Cemetery acre 0.12 $105 $69 52%
610 Hospital 1,000 sf 1.37 $1,196 $239 400%
640 Animal Hospital/Veterinary Clinic 1,000 sf 2.32 $2,025 $761 166%
n/a Funeral Home 1,000 sf 0.55 $480 $980 -51%
OFFICE & FINANCIAL:
Office (50,000 sf and less) 1,000 sf 1.41 $1,231 $131 840%
Office (50,001 - 100,000 sf) 1,000 sf 1.19 $1,039 $143 627%
Office (100,001 - 200,000 sf) 1,000 sf 1.01 $882 $174 407%
Office (200,001 - 400,000 sf) 1,000 sf 0.85 $742 $172 331%
Office (greater than 400,000 sf) 1,000 sf 0.77 $672 $172 291%
Medical Office (less than 10,000 sf) 1,000 sf 1.14 $995 $278 258%
Medical Office (10,000 sf and greater) 1,000 sf 1.66 $1,449 $278 421%
RETAIL:
817 Nursery (Garden Center) acre 5.55 $4,845 N/A N/A
Retail (50,000 sf and less) 1,000 sfgla 2.45 $2,139 $336 537%
Retail (50,001 - 200,000 sf) 1,000 sfgla 2.30 $2,008 $324 520%
Retail (200,001 - 400,000 sf) 1,000 sfgla 2.34 $2,043 $356 474%
Retail (400,001 - 600,000 sf) 1,000 sfgla 2.44 $2,130 $362 488%
Retail (600,001 - 800,000 sf) 1,000 sfgla 2.55 $2,226 $362 515%
Retail (greater than 800,000 sf) 1,000 sfgla 2.42 $2,113 $362 484%
841 New/Used Car Sales 1,000 sf 1.47 $1,283 $165 678%
848 Tire Store 1,000 sf 0.99 $864 N/A N/A
853 Convenience Store w/Gas Pumps 1,000 sf 5.83 $5,090 $769 562%
880/881 Pharmacy with and w/o Drive-Thru 1,000 sf 1.96 $1,711 $330 419%
890 Furniture Store 1,000 sf 0.23 $201 $258 -22%
912 Bank/Savings w/Drive-In 1,000 sf 2.28 $1,991 $382 421%
931 Quality Restaurant 1,000 sf 6.82 $5,954 $364 1536%
932 High-Turnover Restaurant 1,000 sf 6.78 $5,919 $397 1391%
934 Fast Food Rest. w/Drive-Thru 1,000 sf 8.90 $7,770 $604 1186%
941 Quick Lube bay 1.16 $1,013 $508 99%
942 Automobile Care Center 1,000 sf 1.50 $1,310 N/A N/A
944/946 Gas Station with and w/o Car Wash fuel pos. 1.91 $1,667 $84 1885%
947 Car Wash bay 0.87 $760 $580 31%
INDUSTRIAL:
110 General Industrial 1,000 sf 0.69 $602 $74 714%
150 Warehousing 1,000 sf 0.28 $244 $36 578%
151 Mini-Warehouse 1,000 sf 0.06 $52 $16 225%
820
210
Single Family/Townhouse
710
720

DRAFT
Tindale Oliver Palm Beach County September 2015 VII-12 Impact Fee Update Study
Public Buildings Impact Fee Schedule Comparison
As part of the work effort in updating Palm Beach County’s public buildings impact fee
schedule, the County’s calculated impact fee schedule was compared to the adopted fee
schedule and those in similar or nearby jurisdictions. Because Palm Beach County public
buildings impact fee includes correctional facilities and law enforcement buildings, which are
typically separate fees in the case of many jurisdictions, to provide a better comparison, Table
VII-8 presents Palm Beach County’s calculated public buildings impact fee schedule compared
to the adopted schedule of similar counties for combined fees of public buildings, law
enforcement, and correctional facilities, if implemented.
Table VII-8 Public Buildings Impact Fee Schedule Comparison
(Implemented Public Buildings, Law Enforcement, and/or Correctional Fees Combined)
(1) Represents the portion of the maximum calculated fee for each respective county that is actually charged.
Fee may have been lowered/increased through annual indexing or policy discounts. Does not account for moratorium/suspensions.
(2) du = dwelling unit (3) Source: Table VII-7 (4) Source: Palm Beach County Department of Planning, Zoning, and Building (5) Source: Martin County Growth Management Division. Public buildings and law enforcement fees combined (6) Source: St. Lucie County Planning & Development Services. Fees were adopted at 100% and have since been
indexed annually using the CPI. Public buildings and law enforcement fees combined (7) Source: Collier County Impact Fee Administration Department. Public buildings, law enforcement, and
correctional fees combined
Calculated(3) Existing(4)
Date of Last Update 2014 2012 2012 2009 2009/2010
Assessed Portion of Calculated(1) N/A 27% 100% 100% 100%
Residential:
Single Family (2,000 sf) du $1,499 $223 $1,406 $550 $1,704
Non-Residential:
Light Industrial 1,000 sf $602 $74 $340 $118 $596
Office (50,000 sq ft) 1,000 sf $1,231 $131 $590 $624 $1,227
Retail (125,000 sq ft) 1,000 sfgla $2,008 $324 $1,293 $869 $1,966
Bank w/Drive-Thru 1,000 sf $1,991 $382 $1,035 $755 $1,992
Fast Food w/Drive-Thru 1,000 sf $7,770 $604 $5,239 $755 $7,781
Land Use Unit(2) Palm Beach County Martin
County(5)
St. Lucie
County(6)
Collier
County(7)

DRAFT
Tindale Oliver Palm Beach County September 2015 VIII-1 Impact Fee Update Study
VIII. Transportation
Palm Beach County’s Transportation Impact Fee was most recently updated in 2012 to assist
the County in providing adequate transportation facilities for expected growth. Palm Beach
County has retained Tindale Oliver to prepare an update study to reflect changes to the cost,
credit, and demand components that have occurred since 2012. It should be noted that
figures calculated in this study represent the technically calculated level of impact fees that
the County could charge; however, the BOCC may choose to discount the fees as a policy
decision. This section of the impact fee report provides the results of the transportation
impact fee analysis and consists of the following sections:
Demand Component
Cost Component
Credit Component
Calculated Transportation Impact Fee Schedule
Transportation Impact Fee Schedule Comparison
Transportation Impact Fee Benefit Districts Analysis
As in the case of other impact fee program areas, the methodology used for the
transportation impact fee study follows a consumption-based impact fee approach, in which
new development is charged based upon the proportion of vehicle-miles of travel (VMT) that
each unit of new development is expected to consume of a lane mile of roadway network.
Included in this section is the necessary support material used in the calculation of the
transportation impact fee. The general equation used to compute the impact fee for a given
land use is:
[Demand x Cost] – Credit = Fee
The demand for travel placed on the transportation system is expressed in units of VMT (daily
vehicle-trip generation rate times the trip length times the percent new trips [of total trips])
for each residential and non-residential land use contained in the impact fee schedule. The
trip generation is expressed in average daily rates since new development consumes trips on
a daily basis. The demand component is based on trip characteristics studies conducted at
different land uses, measuring the impact of each land use on roadway capacity.

DRAFT
Tindale Oliver Palm Beach County September 2015 VIII-2 Impact Fee Update Study
The cost of building new capacity typically is expressed in units of dollars per vehicle mile or
lane mile of roadway capacity. The credit is an estimate of the current value of future non-
impact fee revenues generated by new development that are allocated to transportation
capacity expansion construction projects. Thus, the impact fee is an “up front” payment for
a portion of the cost of building a lane mile of capacity directly related to the amount of
capacity consumed by each unit of land use contained in the impact fee schedule that is not
paid for by tax revenues generated by new development.
It should be noted that the information used to develop the impact fee schedule was based
on the most recent, reliable, and localized data available. The following input variables were
used in the fee equation:
Demand Variables:
Trip generation rate
Trip length
Percent new trips
Interstate & toll facility discount factor (2012 study did not include this factor)
Cost Variables:
Cost per lane mile
Capacity added per lane mile
Credit Variables:
Equivalent gas tax credit (pennies)
Present worth
Fuel efficiency
Effective days per year
A review of impact fee variables and corresponding recommendations are presented in the
following sub-sections.

DRAFT
Tindale Oliver Palm Beach County September 2015 VIII-3 Impact Fee Update Study
Demand Component
Travel Demand
The amount of transportation system consumed by a unit of new land development is
calculated using the following variables and is measured in terms of the vehicle miles of new
travel a unit of development consumes on the existing road system.
Number of daily trips generated;
Average length of those trips; and
Proportion of travel that is new travel, rather than travel that is already traveling on the
road system and is captured by new development.
As part of this update, the trip characteristics variables were obtained primarily from two
sources: (1) trip characteristics studies previously conducted throughout Florida by Tindale
Oliver (Florida Studies Database), and (2) the Institute of Transportation Engineers’ (ITE) Trip
Generation report (9th edition).
The Florida Studies Database is included in Appendix E. This database was used to determine
VMT, which is developed from trip length, percent new trips, and trip rate for most land uses
in the fee schedule. The data in the trip characteristics database is based on actual land use
studies and was collected throughout Florida using machine traffic counts and site specific
land use origin-destination surveys. In addition, trip generation data from the ITE 9th Edition
Trip Generation report was used. In instances where trip generation was available from the
ITE Trip Generation report and the Florida Studies Database, a blended average calculation
was used to increase the sample size.
Interstate and Toll Facility Discount Factor
This variable is used to recognize that improvements to Interstate highways are funded by
the State using earmarked and Federal funds, while toll facility improvements are funded
with toll revenues. Typically, impact fees are not used to pay for these improvements, and
the portion of new development’s travel occurring on the interstate/toll facility system
usually is eliminated from the total travel for each land use.
To calculate the interstate and toll (I/T) facility discount factor, the loaded highway network
file was generated for the Southeast Regional Planning Model v6.5 (SERPM). A select link
analysis was run for all traffic analysis zones located within Palm Beach County in order to
DRAFT
Tindale Oliver Palm Beach County September 2015 VIII-4 Impact Fee Update Study
differentiate trips with an origin and/or destination within the county versus trips with no
origin or destination within the county.
Currently, the only interstate/toll facilities in Palm Beach County are I-95 and the Florida
Turnpike (SR 19). The limited access vehicle miles of travel (Limited Access VMT) for trips
with an origin and/or destination within Palm Beach County was calculated for the identified
limited access facilities. The total Palm Beach County VMT was calculated for all trips with an
origin and/or destination within Palm Beach County for all roads, including limited access
roads, located within Palm Beach County.
The I/T discount factor of 32.5 percent was determined by dividing the total Limited Access
VMT by the total Palm Beach County VMT, excluding external-to-external trips. By applying
this factor to the total Palm Beach County VMT for each land use in the fee schedule, the
reduced VMT is then representative of only the roadways which are funded by impact fees.
Appendix E, Table E-1 provides further detail on this calculation.

DRAFT
Tindale Oliver Palm Beach County September 2015 VIII-5 Impact Fee Update Study
Cost Component
Construction costs increased significantly in Florida between 2005 and 2007 due to additional
construction demand caused by hurricanes, the housing market growth, and other factors.
Appreciation in land values also resulted in higher right-of-way (ROW) costs during the same
period. In early 2008, costs started to stabilize and between 2008 and 2011 most
communities experienced a decrease in construction costs, returning to levels seen before
2005. In 2013/2014, roadway costs started to increase again in Florida. Cost information
from Palm Beach County, other Florida Counties, and the Florida Department of
Transportation (FDOT) was reviewed to develop a unit cost for all phases involved in the
construction of one lane-mile of roadway capacity. The findings were also discussed with the
County staff to obtain additional input. The following subsections summarize the
methodology and findings of the total unit cost analysis for county and state roads. Appendix
F provides the data and other support information utilized in these analyses.
County Roadway Costs
This section examines the right-of-way (ROW), construction, and other cost components
associated with county roads with respect to transportation capacity improvements in Palm
Beach County. For this purpose, recent bid data for ongoing projects provided by the County
and recent construction bid data from county roadway projects throughout Florida were used
to identify and provide supporting cost data for county improvements. The cost for each
roadway capacity project was separated into four phases: design, construction/engineering
inspection (CEI), ROW and construction.
Design and CEI
Design costs for county roads were estimated at 13 percent of construction phase costs based
on a review of recent local improvements and input from County staff. Additional detail is
provided in Appendix F, Tables F-2 and F-10.
CEI costs for county roads were estimated at six percent of construction phase costs based
on a review of recent local improvements and input from County staff. Additional detail is
provided in Appendix F, Tables F-8 and F-16.
Right-of-Way
The ROW cost reflects the total cost of the acquisitions along a corridor that were necessary
to have sufficient cross-section width to widen an existing road or, in the case of new
construction, to build a new road. A review of recent ROW cost data for Palm Beach County

DRAFT
Tindale Oliver Palm Beach County September 2015 VIII-6 Impact Fee Update Study
identified 28 recent improvements with acquisition data. Using the construction costs for
these improvements, a ROW-to-construction factor was calculated for each improvement,
ranging from 1 to 188 percent, with a weighted average of approximately 34 percent. This
calculated local factor was slightly lower than county road ROW factors observed in recent
impact fee studies throughout Florida. County staff indicated that the weighted average of
the all of recent improvements was not indicative of expected costs. When looking at some
of the more recent acquisitions along Seminole Pratt Whitney Rd, West Atlantic Ave, and 60th
St, the average ROW-Construction ratio is over 60 percent. To be conservative, a ROW-to-
construction factor of 40 percent was used in the impact fee calculation, based on the
average used in recent impact fee studies throughout Florida. As seen in Table VIII-1, this
amount is equal to approximately $0.74 million per lane mile for county roads. Additional
detail is provided in Appendix F, Tables F-4, F-12, and F-13.
Construction
The construction cost for county roads was based on a review of local and statewide projects.
A review of recent construction cost data for Palm Beach County identified 18 recent capacity
expansion improvements averaging $1.81 million per lane mile, as shown in Appendix F, Table
F-14.
In addition to local improvements, recent bids from multiple communities throughout the
state were also reviewed. This review included more than 360 lane miles of urban design
roadway improvements from 16 counties and calculated an average cost of $2.17 million per
lane mile. Appendix F, Table F-14 provides a detailed description of the projects reviewed.
Based on this review and a discussion with staff, a county roadway cost of $1.80 million per
lane mile was used in the transportation impact fee calculation for county roads with urban
design characteristics. This estimate relies heavily on the recently bid local projects which
indicate that roadway construction in Palm County has been consistently less expensive than
other jurisdictions in Florida.
To determine the cost per lane mile for county roads with rural design characteristics, the
relationship between urban and rural roadway costs from the FDOT District 7 Long Range
Estimates (LRE)1 was reviewed. District 7 was used due to this type of information not being
readily available for FDOT District 4. Based on these cost estimates, the costs for roadways
with rural design characteristics were estimated at approximately 81 percent of the costs for
1 This data was not available for FDOT District 4; http://www.dot.state.fl.us/planning/policy/costs/
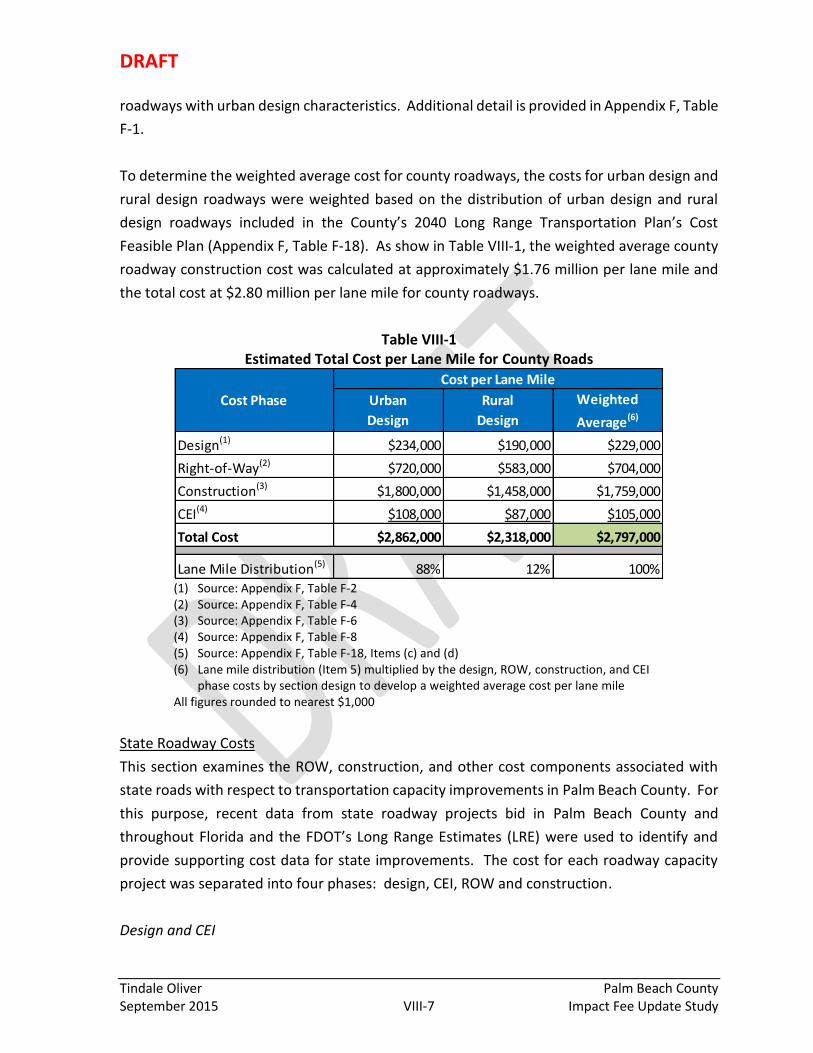
DRAFT
Tindale Oliver Palm Beach County September 2015 VIII-7 Impact Fee Update Study
roadways with urban design characteristics. Additional detail is provided in Appendix F, Table
F-1.
To determine the weighted average cost for county roadways, the costs for urban design and
rural design roadways were weighted based on the distribution of urban design and rural
design roadways included in the County’s 2040 Long Range Transportation Plan’s Cost
Feasible Plan (Appendix F, Table F-18). As show in Table VIII-1, the weighted average county
roadway construction cost was calculated at approximately $1.76 million per lane mile and
the total cost at $2.80 million per lane mile for county roadways.
Table VIII-1 Estimated Total Cost per Lane Mile for County Roads
(1) Source: Appendix F, Table F-2 (2) Source: Appendix F, Table F-4 (3) Source: Appendix F, Table F-6 (4) Source: Appendix F, Table F-8 (5) Source: Appendix F, Table F-18, Items (c) and (d) (6) Lane mile distribution (Item 5) multiplied by the design, ROW, construction, and CEI
phase costs by section design to develop a weighted average cost per lane mile All figures rounded to nearest $1,000
State Roadway Costs
This section examines the ROW, construction, and other cost components associated with
state roads with respect to transportation capacity improvements in Palm Beach County. For
this purpose, recent data from state roadway projects bid in Palm Beach County and
throughout Florida and the FDOT’s Long Range Estimates (LRE) were used to identify and
provide supporting cost data for state improvements. The cost for each roadway capacity
project was separated into four phases: design, CEI, ROW and construction.
Design and CEI
Urban
Design
Rural
Design
Weighted
Average(6)
Design(1) $234,000 $190,000 $229,000
Right-of-Way(2) $720,000 $583,000 $704,000
Construction(3) $1,800,000 $1,458,000 $1,759,000
CEI(4) $108,000 $87,000 $105,000
Total Cost $2,862,000 $2,318,000 $2,797,000
Lane Mile Distribution(5) 88% 12% 100%
Cost Phase
Cost per Lane Mile

DRAFT
Tindale Oliver Palm Beach County September 2015 VIII-8 Impact Fee Update Study
Design costs for state roads were estimated at 11 percent of construction phase costs based
on a review of cost data collected for recent transportation impact fee studies throughout
Florida. Additional detail is provided in Appendix F, Tables F-3 and F-11.
CEI costs for state roads were also estimated at 11 percent of construction phase costs based
on a review of cost data collected for recent transportation impact fee studies throughout
Florida. Additional detail is provided in Appendix F, Tables F-9 and F-11.
Right-of-Way
Given the limited data on ROW costs for state roads in Palm Beach County and based on
experience in other jurisdictions, the ROW cost ratio was based on a review of cost data
collected for recent transportation impact fee studies throughout Florida. Using this ROW-
to-construction ratio of 44 percent (Appendix F, Table F-13), the ROW cost for state roads
with urban design characteristics is approximately $1.36 million per lane mile.
Construction
A review of recent state road capacity improvements in Palm Beach County identified one (1)
recent capacity expansion improvement (along SR 710/Beeline Highway from W. of Congress
Avenue to W. of Australian Avenue) at $7.26 million per lane mile, as shown in Appendix F,
Table F-15.
In addition to local improvements, recent bids from multiple communities throughout the
state were also reviewed. This review included more than 330 lane miles of urban design
roadway improvements from 30 counties and calculated an average cost of $2.78 million per
lane mile. Appendix F, Table F-15 provides a detailed description of the projects reviewed.
From this set of data, the improvements in FDOT District 4 were reviewed separately. Looking
at these nine improvements and the Palm Beach County project on SR 710, a weighted
average cost of $3.10 million per lane mile was calculated for state roads.
Based on this review and a discussion with staff, a state roadway cost of $3.10 million was
used in the transportation impact fee calculation for state roads with urban design
characteristics. This estimate relies heavily on the recently bid projects in Palm Beach County
and District 4 which indicate that state roadway construction in this portion of the Florida has
been consistently more expensive than other jurisdictions in Florida.
To determine the cost per lane mile for state roads with rural design characteristics, the
relationship between urban and rural roadway costs from the FDOT District 7 Long Range

DRAFT
Tindale Oliver Palm Beach County September 2015 VIII-9 Impact Fee Update Study
Estimates (LRE)2 was reviewed. Based on these cost estimates, the costs for roadways with
rural design characteristics were estimated at approximately 81 percent of the costs for
roadways with urban design characteristics. Additional detail is provided in Appendix F, Table
F-1.
To determine the weighted average cost for state roadways, the costs for urban design and
rural design roadways were weighted based on the distribution of urban design and rural
design roadways included in the County’s 2040 Long Range Transportation Plan’s Cost
Feasible Plan (Appendix F, Table F-18). As show in Table VIII-2, the weighted average state
roadway construction cost was calculated at approximately $3.03 million per lane mile
resulting in a total cost of $5.03 million per lane mile for state roadways.
Table VIII-2
Estimated Total Cost per Lane Mile for State Roads
(1) Source: Appendix F, Table F-3 (2) Source: Appendix F, Table F-5 (3) Source: Appendix F, Table F-7 (4) Source: Appendix F, Table F-9 (5) Source: Appendix F, Table F-18, Items (c) and (d) (6) Lane mile distribution (Item 5) multiplied by the design, ROW, construction, and CEI
phase costs by section design to develop a weighted average cost per lane mile All figures rounded to nearest $1,000
Summary of Costs (Blended Cost Analysis)
The weighted average cost per lane mile for county and state roads is presented in Table VIII-
3. The resulting weighted average cost of approximately $3.62 million per lane mile was
utilized as the roadway cost input in the calculation of the transportation impact fee schedule.
The weighted average cost per lane mile includes county and state roads and is based on
2 This data was not available for FDOT District 4; http://www.dot.state.fl.us/planning/policy/costs/
Urban
Design
Rural
Design
Weighted
Average(6)
Design(1) $341,000 $276,000 $333,000
Right-of-Way(2) $1,364,000 $1,105,000 $1,333,000
Construction(3) $3,100,000 $2,511,000 $3,029,000
CEI(4) $341,000 $276,000 $333,000
Total Cost $5,146,000 $4,168,000 $5,028,000
Lane Mile Distribution(5) 88% 12% 100%
Cost Phase
Cost per Lane Mile
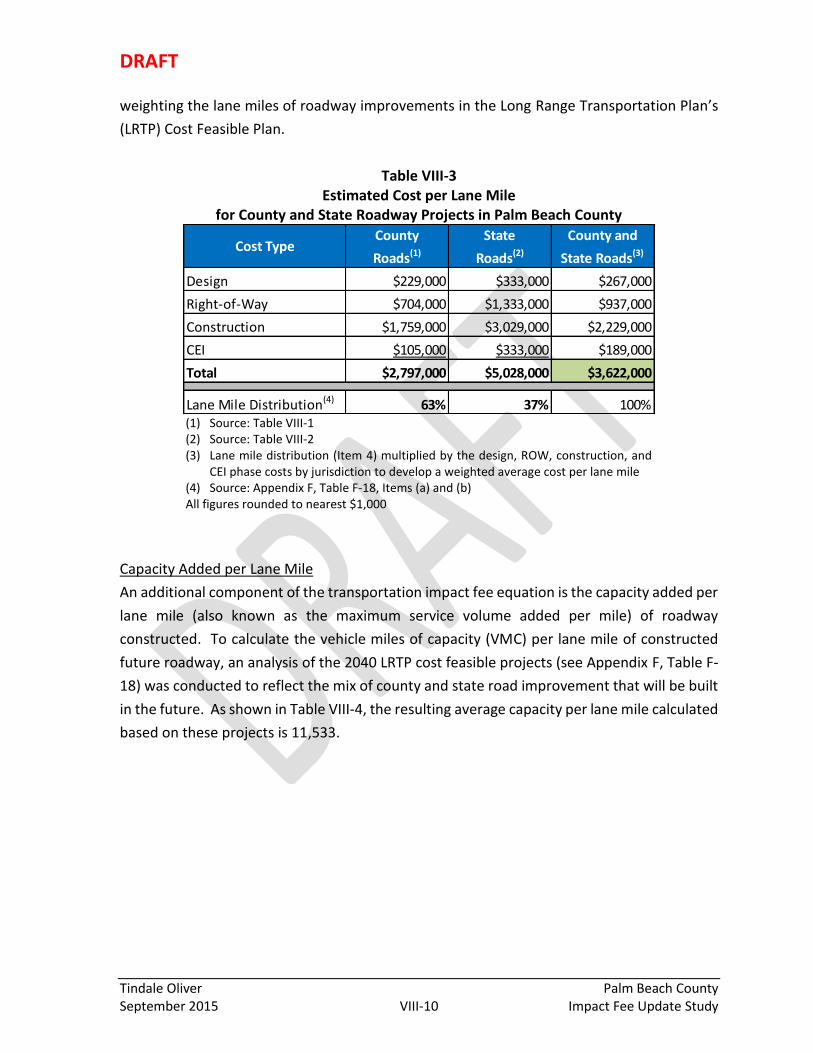
DRAFT
Tindale Oliver Palm Beach County September 2015 VIII-10 Impact Fee Update Study
weighting the lane miles of roadway improvements in the Long Range Transportation Plan’s
(LRTP) Cost Feasible Plan.
Table VIII-3 Estimated Cost per Lane Mile
for County and State Roadway Projects in Palm Beach County
(1) Source: Table VIII-1 (2) Source: Table VIII-2 (3) Lane mile distribution (Item 4) multiplied by the design, ROW, construction, and
CEI phase costs by jurisdiction to develop a weighted average cost per lane mile (4) Source: Appendix F, Table F-18, Items (a) and (b) All figures rounded to nearest $1,000
Capacity Added per Lane Mile
An additional component of the transportation impact fee equation is the capacity added per
lane mile (also known as the maximum service volume added per mile) of roadway
constructed. To calculate the vehicle miles of capacity (VMC) per lane mile of constructed
future roadway, an analysis of the 2040 LRTP cost feasible projects (see Appendix F, Table F-
18) was conducted to reflect the mix of county and state road improvement that will be built
in the future. As shown in Table VIII-4, the resulting average capacity per lane mile calculated
based on these projects is 11,533.
Cost TypeCounty
Roads(1)
State
Roads(2)
County and
State Roads(3)
Design $229,000 $333,000 $267,000
Right-of-Way $704,000 $1,333,000 $937,000
Construction $1,759,000 $3,029,000 $2,229,000
CEI $105,000 $333,000 $189,000
Total $2,797,000 $5,028,000 $3,622,000
Lane Mile Distribution(4) 63% 37% 100%

DRAFT
Tindale Oliver Palm Beach County September 2015 VIII-11 Impact Fee Update Study
Table VIII-4 Weighted Average Vehicle-Miles of Capacity per Lane Mile
(1) Source: Appendix F, Table F-18 (2) Source: Appendix F, Table F-18 (3) Vehicle miles of capacity added (Item 2) divided by lane miles added (Item 1) (4) Total vehicle miles of capacity added for county and state roads (Item 2) divided by the
total lane miles added (Item 1)
Cost per Vehicle-Mile of Capacity Added
The impact fee cost per unit of development is assessed based on the cost per vehicle-mile
of capacity. As shown in Tables VIII-3 and VIII-4, the cost and capacity for county and state
roads have been calculated based on typical roadway improvements. As shown in Table VIII-
5, the cost per VMC for travel within Palm Beach County is approximately $314. This average
cost per VMC figure is used in the impact fee calculation to determine the total impact cost
per unit of development based on the vehicle-miles of travel consumed. For each vehicle-
mile of travel that is added to the road system, approximately $314 of roadway capacity is
consumed.
Table VIII-5 Weighted Average Cost per Vehicle-Mile of Capacity Added
(1) Source: Table VIII-3 (2) Source: Table VIII-4 (3) Cost per lane mile (Item 1) divided by average capacity added per lane mile (Item 2)
It is important to note that capacity projects eligible for impact fee funding include not only
new construction and lane additions, but also associated intersection improvements, traffic
signalization, and other amenities and technology improvements that allow for additional
vehicle capacity.
SourceLane Mile
Added(1)
Vehicle Miles of
Capacity Added(2)
VMC Added per
Lane Mile(3)
County Roads 138.49 1,314,859 9,494
State Roads 81.12 1,217,922 15,014
Total 219.61 2,532,781
Weighted Average VMC Added per Lane Mile(4) 11,533
SourceCost per Lane
Mile(1)
Average VMC
Added per Lane
Mile(2)
Cost per VMC(3)
County Roads $2,797,000 9,494 $294.61
State Roads $5,028,000 15,014 $334.89
Weighted Average $3,622,000 11,533 $314.06
DRAFT
Tindale Oliver Palm Beach County September 2015 VIII-12 Impact Fee Update Study
Credit Component
Gasoline Tax Equivalent Credit
The present value of the portion of future non-impact fee revenues (converted to equivalent
gasoline taxes) generated by a new development over a 25-year period that is projected to
be expended on capacity expansion projects is credited against the cost of the system
consumed by travel associated with new development.
County
A review of the County’s historical roadway financing program and the FY 2015-2019 Capital
Improvement Program (CIP) shows that roadway projects are primarily funded by a
combination of transportation impact fees and fuel taxes. As shown in Table VIII-6, a total
gas tax equivalent revenue credit of 2.0 pennies was calculated for gas tax equivalent
expenditures on roadway capacity expansion projects.
State
State expenditures on state roads were reviewed, and a credit for the capacity expansion
portion attributable to state projects was estimated. The equivalent number of pennies
allocated to fund state projects was determined from projects spanning a 16-year period (FY
2004 to FY 2019). This period represents past expenditures (from FY 2004 to FY 2014) and
projected expenditures (from FY 2015 to 2019) from the FDOT Work Program and the
County’s Transportation Improvement Program (TIP). A list of capacity-adding roadway
projects was developed, including lane additions, new road construction, intersection
improvements, interchanges, traffic signal projects, and other capacity-addition projects.
This review (summarized in Appendix G, Table G-3) indicates that FDOT spending generates
an equivalent gas tax credit of 6.6 pennies of gas tax revenue annually.
In summary, Palm Beach County contributes approximately 2.0 pennies toward roadway
capacity expansion projects, while the State spends an average of 6.6 pennies for state
roadway projects in Palm Beach County. Therefore, a total of 8.6 pennies of revenue credit
are included in the impact fee calculation to recognize the future capital revenue that is
expected to be generated by new development from all non-impact fee revenues, as shown
in Table VIII-6.

DRAFT
Tindale Oliver Palm Beach County September 2015 VIII-13 Impact Fee Update Study
Table VIII-6 Equivalent Pennies of Gas Tax Revenue
(1) Source: Appendix G, Table G-2 (2) Source: Appendix G, Table G-3
Present Worth Variables
Facility Life
The roadway facility life used in the impact fee analysis is 25 years, which represents the
reasonable life of a roadway.
Interest Rate
This is the discount rate at which gasoline tax revenues might be bonded. It is used to
compute the present value of the gasoline taxes generated by new development. The
discount rate of 3.40 percent was used in the transportation impact fee calculation based on
information provided by Palm Beach County.
The 25-year facility life and 3.40 percent interest rate result in a uniform series present worth
factor is 16.6618.
Fuel Efficiency
The fuel efficiency (i.e., the average miles traveled per gallon of fuel consumed) of the fleet
of motor vehicles was estimated using the quantity of gasoline consumed by travel associated
with a particular land use.
Appendix G, Table G-6 documents the calculation of fuel efficiency value based on the
following equation, where “VMT” is vehicle miles of travel and “MPG” is fuel efficiency in
terms of miles per gallon.
TypeRoadwayTypeVehicle
TypeVehicle
TypeRoadwayMPG
VMTVMTEfficiencyFuel
CreditEquivalent Pennies
per Gallon
County Revenues(1) $0.020
State Revenues(2) $0.066
Total $0.086

DRAFT
Tindale Oliver Palm Beach County September 2015 VIII-14 Impact Fee Update Study
The methodology uses non-interstate VMT and average fuel efficiency data for passenger
vehicles (i.e., passenger cars and other 2-axle, 4-tire vehicles, such as vans, pickups, and SUVs)
and large trucks (i.e., single-unit, 2-axle, 6-tire or more trucks and combination trucks) to
calculate the total gallons of fuel used by each of these vehicle types.
The combined total VMT for the vehicle types is then divided by the combined total gallons
of fuel consumed to calculate, in effect, a “weighted” fuel efficiency value that reflects the
existing fleet mix of traffic on non-interstate roadways. The VMT and average fuel efficiency
data were obtained from the most recent Federal Highway Administration’s Highway
Statistics 2013. Based on the calculation completed in Appendix G, Table G-6, the fuel
efficiency rate to be used in the updated impact fee equation is 18.40 miles per gallon.
Effective Days per Year
An effective 365 days per year of operation was assumed for all land uses in the proposed
fee. However, this will not be the case for all land uses since some uses operate only on
weekdays (e.g., office buildings) and/or only seasonally (e.g., schools). The use of 365 days
per year, therefore, provides a conservative estimate, ensuring that gasoline taxes are
adequately credited against the fee.
Calculated Transportation Impact Fee Schedule
The impact fee calculations for each land use are included in Appendix H, which includes the
major land use categories and the impact fees for the individual land uses contained in each
of the major categories. For each land use, Appendix H illustrates the following:
Demand component variables (trip rate, trip length, and percent of new trips)
Total impact fee cost
Annual gas tax credit
Present value of the gas tax credit
Net transportation impact fee
Current Palm Beach County impact fee
Percent difference between the calculated impact fee and the current adopted impact
fee

DRAFT
Tindale Oliver Palm Beach County September 2015 VIII-15 Impact Fee Update Study
It should be noted that the net impact fee illustrated in Appendix H is not necessarily a
recommended fee, but instead represents the technically calculated impact fee per unit of
land use that could be charged in Palm Beach County.
For clarification purposes, the calculation of an impact fee for one land use category is
presented. In the following example, the net impact fee is calculated for the single-family
residential detached land use category (ITE LUC 210) using information from the impact fee
schedule included in Appendix H, Table H-1. For each land use category, the following
equations are utilized to calculate the net impact fee:
Net Impact Fee = Total Impact Cost – Gas Tax Credit
Where:
Total Impact Cost = ([Trip Rate × Assessable Trip Length × % New Trips] / 2) × (1 – Interstate
& Toll Facility Disc. Factor) × (Cost per Vehicle-Mile of Capacity)
Gas Tax Credit = Present Value (Annual Gas Tax), given 3.40% interest rate & 25-year
facility life
Annual Gas/Sales Tax = ([Trip Rate × Total Trip Length × % New Trips] / 2) × (Effective Days
per Year × $/Gallon to Capital) / Fuel Efficiency
Each of the inputs has been discussed previously in this document; however, for purposes of
this example, brief definitions for each input are provided in the following paragraphs, along
with the actual inputs used in the calculation of the fee for the single-family detached
residential land use category:
Trip Rate = the average daily trip generation rate, in vehicle-trips/day (7.81)
Assessable Trip Length = the actual average trip length for the category, in vehicle-miles
(6.62)
Total Trip Length = the assessable trip length plus an adjustment factor of half a mile,
which is added to the trip length to account for the fact that gas taxes are collected for
travel on all roads including local roads (6.62 + 0.50 = 7.12)
% New Trips = adjustment factor to account for trips that are already on the roadway
(100%)
Divide by 2 = the total daily miles of travel generated by a particular category (i.e.,
rate*length*% new trips) is divided by two to prevent the double-counting of travel
generated between two land use codes since every trip has an origin and a destination

DRAFT
Tindale Oliver Palm Beach County September 2015 VIII-16 Impact Fee Update Study
Interstate & Toll Facility Discount Factor = discount factor to account for the travel
demand occurring on interstate highways and/or toll facilities (32.5%)
Cost per Lane Mile = unit cost to construct one lane mile of roadway, in $/lane-mile
($3,622,000)
Average Capacity Added per Lane Mile = represents the average daily traffic on one travel
lane at capacity for one lane mile of roadway, in vehicles/lane-mile/day (11,533)
Cost per Vehicle-Mile of Capacity = unit of vehicle-miles of capacity consumed per unit of
development. Cost per lane mile divided by average capacity added per lane mile
($3,622,000 / 11,533 = $314.06)
Present Value = calculation of the present value of a uniform series of cash flows, gas tax
payments in this case, given an interest rate, “i,” and a number of periods, “n;” for 3.40%
interest and a 25-year facility life, the uniform series present worth factor is 16.6618
Effective Days per Year = 365 days
$/Gallon to Capital = the amount of gas tax revenue per gallon of fuel that is used for
capital improvements, in $/gallon ($0.086)
Fuel Efficiency = average fuel efficiency of vehicles, in vehicle-miles/gallon (18.40)
Transportation Impact Fee Calculation
Using these inputs, a net impact fee can be calculated for the single-family residential detached
land use category as follows:
Total Impact Cost = ([7.81 * 6.62 * 1.0] /2) * (1 - 0.325) * ($3,622,000/11,533) = $5,480
Annual Credit for Gas Tax and Other Sources = ([7.81 * 7.12 * 1.0] /2) * 365 * ($0.086 /18.40)
= $47
Gas Tax Credit = $47 * 16.6618 = $783
Net Impact Fee = $5,480 – $783 = $4,697
Transportation Impact Fee Comparison
A comparison of calculated fee schedule to the current adopted fee by land use is presented in
Table VIII-7. The detailed fee schedule that includes the calculations shown above for all land
uses is presented in Appendix H, Table H-1.

DRAFT
Tindale Oliver Palm Beach County September 2015 VIII-17 Impact Fee Update Study
Table VIII-7 Transportation Impact Fee Schedule Comparison
(1) Represents the portion of the maximum calculated for each fee that is actually charged. Fees may have been lowered through indexing of policy discounts. Does not account for moratoriums/suspensions (2) Du = dwelling unit (3) Source: Appendix H, Table H-1 (4) Source: Palm Beach County Department of Planning, Zoning, and Building. Fees show for Unincorporated Palm Beach County (5) Source: Martin County Growth Management Department (6) Source: Broward County Planning & Redevelopment Division, Development Management. Fees shown are an average of all 46 Impact Fee Zones (7) Source: Glades County Planning Zoning Department. Fees shown are currently suspended (through 2016) (8) Source: Miami-Dade County Impact Fee Division. Fees shown are an average of the Urban Infill Area and Non-Urban Infill Are rates (9) Source: St. Lucie County Planning & Development Services Department. Since adoption in 2009, the fees have been indexed annually to the rates above. Fees shown are an average of the 4 transportation districts (10) Source: Collier County Impact Fee Administration Department. Since adoption, the fees have been indexed annually to the rates above (11) Source: Highlands County Planning and Zoning Department. Fees shown are currently suspended (through June 30, 2017) (12) Source: Orange County Planning & Development Department. Fees shown are an average of the AMA and Non-AMA districts (13) Source: Hillsborough County Development Services Department. Fees shown are an average of the 10 impact fee districts
Calculated(3) Existing(4)
Date of Last Update 2014 2012 2012 n/a 2008 n/a 2009 2010 2006 2012 1985
Assessed Portion of Calculated(1) 100% n/a 100% n/a 100% n/a 100% 100% 25% 42% 100%
Residential:
Single Family (2,000 sf) du $4,697 $7,281 $2,815 $386 $5,550 $6,309 $4,303 $5,753 $1,649 $2,873 $1,475
Non-Residential:
Light Industrial 1,000 sf $2,983 $1,522 $1,857 $431 $3,538 $4,641 $396 $4,333 $1,166 $1,594 $994
Office (50,000 sq ft) 1,000 sf $6,634 $3,418 $2,198 $397 $4,690 $10,281 $1,307 $9,291 $3,095 $4,105 $2,326
Retail (100,000 sq ft) 1,000 sfgla $7,615 $9,831 $5,183 $366 $8,384 $12,428 $2,543 $10,247 $2,455 $4,022 $3,352
Bank w/Drive-Thru 1,000 sf $16,030 $19,056 $6,841 $366 $10,124 $16,677 $2,511 $21,954 $11,232 $8,466 $13,043
Fast Food w/Drive-Thru 1,000 sf $53,653 $30,702 $15,693 $366 $11,531 $33,565 $2,511 $74,793 $25,202 $28,227 $7,726
Hillsborough
County(13)
Miami-Dade
County(8)
St. Lucie
County(9)
Collier
County(10)
Highlands
County(11)
Orange
County(12)
Glades
County(7)Land Use Unit(2)
Palm Beach County Martin
County(5)
Broward
County(6)

DRAFT
Tindale Oliver Palm Beach County September 2015 VIII-18 Impact Fee Update Study
Transportation Impact Fee Benefit Districts
Palm Beach County currently has five impact fee benefit districts/zones, as illustrated in
Article 13, Figure 13.H.3.6-7 of the County’s impact fee ordinance. These districts do not
include the western portion of the County, which is not charged transportation impact fees.
Benefit districts dictate where impact fee revenues can be spent to ensure that fee payers
receive the associated benefit. Typically, these boundaries are based on land use patterns,
growth rates, major roadway boundaries, and major geographical/environmental
boundaries.
As part of this update study, Tindale Oliver conducted a review of the existing fee district
boundaries. In addition to evaluating geographical boundaries and City limits, the impact fee
revenue and expenditure monies were reviewed to determine the effectiveness of the
existing boundaries and discussions were held with Palm Beach County staff to discuss any
issues that have arisen due to the current district alignments.
Based on this review and the discussions with staff, two benefit district adjustments are
recommended:
Extend Benefit District 1 to the southwest to the intersection of Northlake and
Seminole-Pratt Whitney. This realignment will provide greater flexibility in managing
Zones 1, 2, and 3, will ensure that revenues collected in West Palm Beach and Palm
Beach Gardens continue to benefit the eastern areas of Palm Beach County in or near
West Palm (Zone 2) and Palm Beach Gardens (Zone 1), and ensures that large tracts
of westward development remain in their current Zones.
Shift the border between Zones 3 and 4 slightly to follow the City of Wellington
municipal boundary. This re-alignment is designed to keep the entire city in one zone
and also follows a canal which is providing a travel boundary between southeast
Wellington and the rest of Zone 4.
Map VIII-1 illustrates the existing benefit districts and the proposed changes discussed above.

DRAFT
Tindale Oliver Palm Beach County September 2015 VIII-19 Impact Fee Update Study
Map VIII-1 Proposed Transportation Impact Fee Benefit Districts

DRAFT
APPENDIX A Population – Supplemental Information

DRAFT
Tindale Oliver Palm Beach County September 2015 A-1 Impact Fee Update Study
Population
All impact fee programs included in this report require the use of population data in
calculating current levels of service, performance standards, and credit calculations. With
this in mind, a consistent approach to developing population estimates and projections is an
important component of the data compilation process. To accurately determine demand for
services, not only the residents, or permanent population of the County, but also the seasonal
residents and visitors were considered. Seasonal residents include visitors to hotel and motel
facilities, visitors to RV parks, visitors that stay with relatives and friends, and part-time
residents, which are defined as living in Palm Beach County for less than six months each year.
Therefore, for purposes of calculating future demand for capital facilities for each impact fee
program area, the weighted average seasonal population will be used in all population
estimates and projections. References to population contained in this report pertain to the
weighted average seasonal population, unless otherwise noted.
Palm Beach County provides all of the services included in the impact fee program
countywide, with the exception of the law enforcement, libraries, and fire rescue program
areas. Given the differences in services areas, population estimates are provided separately
for the countywide, law enforcement, libraries and fire rescue service areas.
Table A-1 presents the population trend for Palm Beach County. The projections indicate that
the population of Palm Beach County is estimated to increase by 26 percent between 2014
and 2040 countywide.

DRAFT
Tindale Oliver Palm Beach County September 2015 A-2 Impact Fee Update Study
Table A-1 Weighted Population Trends and Projections
(1) Source: Appendix A, Table A-17 (2) Source: Appendix A, Table A-18 (3) Source: Appendix A, Table A-19 (4) Source: Appendix A, Table A-20
Palm Beach
Countywide(1)
Service Area for
Library(2)
Service Area for
Law Enf.(3)
Service Area for
Fire Rescue(4)
2000 1,193,038 768,123 682,850 754,687
2001 1,219,744 786,510 698,831 773,121
2002 1,249,273 812,124 718,604 794,645
2003 1,281,690 834,715 735,376 813,993
2004 1,316,682 852,229 746,707 828,497
2005 1,346,377 868,720 756,893 841,355
2006 1,363,362 877,255 761,221 848,464
2007 1,373,668 886,912 769,682 857,722
2008 1,377,516 890,524 771,155 859,652
2009 1,380,304 892,552 771,762 861,288
2010 1,400,677 927,753 796,420 894,222
2011 1,407,505 932,116 799,594 898,394
2012 1,418,030 938,137 804,186 904,770
2013 1,430,147 943,997 809,864 911,643
2014 1,443,996 952,314 818,439 920,758
2015 1,459,205 964,774 827,791 930,747
2016 1,476,861 976,447 837,807 942,008
2017 1,494,730 988,262 847,944 953,407
2018 1,512,817 1,000,220 858,205 964,943
2019 1,531,122 1,012,323 868,589 976,619
2020 1,549,668 1,024,585 879,110 988,448
2021 1,565,630 1,035,138 888,164 998,629
2022 1,581,757 1,045,800 897,312 1,008,916
2023 1,598,048 1,056,572 906,555 1,019,308
2024 1,614,508 1,067,455 915,893 1,029,807
2025 1,631,531 1,078,710 925,550 1,040,664
2026 1,645,888 1,088,203 933,694 1,049,822
2027 1,660,372 1,097,778 941,911 1,059,060
2028 1,674,983 1,107,438 950,199 1,068,381
2029 1,689,722 1,117,184 958,560 1,077,782
2030 1,704,900 1,127,219 967,171 1,087,463
2031 1,716,494 1,134,884 973,748 1,094,857
2032 1,728,166 1,142,602 980,370 1,102,303
2033 1,739,918 1,150,371 987,036 1,109,799
2034 1,751,749 1,158,194 993,748 1,117,345
2035 1,763,298 1,165,830 1,000,299 1,124,711
2036 1,774,760 1,173,408 1,006,802 1,132,022
2037 1,786,296 1,181,035 1,013,346 1,139,381
2038 1,797,907 1,188,712 1,019,932 1,146,786
2039 1,809,593 1,196,438 1,026,562 1,154,240
2040 1,821,272 1,204,160 1,033,187 1,161,690
Year
Weighted Seasonal Population Figure

DRAFT
Tindale Oliver Palm Beach County September 2015 A-3 Impact Fee Update Study
Apportionment of Demand by Residential Unit Type and Size
The residential land uses to be used for the impact fee calculations are the following:
Single Family/Townhouse
Multi-Family/Accessory Unit
Mobile Home
Tables A-2 (for Countywide), A-3 (for the law enforcement area), A-4 (for the fire rescue
service area), and A-5 (for the library service area) present the number of persons per housing
type for the residential categories identified above in Palm Beach County. This analysis
includes all housing units, both occupied and vacant.
To address fairness and equity issues between land uses and to be consistent with the
County’s current fee schedules, the single family land use is tiered based on three categories
of square footage: less than 1,500 square feet, 1,500 to 2,499 square feet, and 2,500 square
feet or more. To accommodate the tiering of impact fee assessments for the single family
residential land use category, an analysis was completed based on housing unit size and
persons per housing unit. This analysis utilized national data from the 2011 American Housing
Survey (AHS) and data from the 2000 and 2010 U.S. Census Reports to examine this
relationship.

DRAFT
Tindale Oliver Palm Beach County September 2015 A-4 Impact Fee Update Study
Table A-2 Persons per Housing Unit (Countywide)
(1) Source: 2013 American Community Survey (ACS), Table B25033 (adjusted for peak seasonal population) (2) Source: 2013 American Community Survey (ACS), Table DP04 (3) Ratio of people per housing unit for each tier to the mid-size home, developed based on national PPH
data derived from the 2011 American Housing Survey (4) Population (Item 1) divided by housing units (Item 2)
Table A-3 Persons per Housing Unit (Law Enforcement Service Area)
(1) Source: 2013 American Community Survey (ACS), Table B25033 (adjusted for peak seasonal population) (2) Source: 2013 American Community Survey (ACS), Table DP04 (3) Ratio of people per housing unit for each tier to the mid-size home, developed based on national PPH
data derived from the 2011 American Housing Survey (4) Population (Item 1) divided by housing units (Item 2)
Housing Type Population(1) Housing
Units(2) Ratio(3)
Residents /
Housing
Units(4)
Single Family/Townhouse 962,670 376,785 2.55
- Less than 1,500 sf 92% 2.35
- 1,500 to 2,499 sf 100% 2.55
- 2,500 sf or greater 111% 2.83
Multi-Family/Accessory 393,945 270,462 1.46
Mobile Home 44,586 18,166 2.45
Weighted Average 1,401,201 665,413 2.11
Housing Type Population(1) Housing
Units(2) Ratio(3)
Residents /
Housing
Units(4)
Single Family/Townhouse 573,971 216,859 2.65
- Less than 1,500 sf 92% 2.44
- 1,500 to 2,499 sf 100% 2.65
- 2,500 sf or greater 111% 2.94
Multi-Family/Accessory 185,887 118,979 1.56
Mobile Home 36,231 13,775 2.63
Weighted Average 796,089 349,613 2.28

DRAFT
Tindale Oliver Palm Beach County September 2015 A-5 Impact Fee Update Study
Table A-4 Persons per Housing Unit (Fire Rescue Service Area)
(1) Source: 2013 American Community Survey (ACS), Table B25033 (adjusted for peak seasonal population) (2) Source: 2013 American Community Survey (ACS), Table DP04 (3) Ratio of people per housing unit for each tier to the mid-size home, developed based on national PPH
data derived from the 2011 American Housing Survey (4) Population (Item 1) divided by housing units (Item 2)
Table A-5 Persons per Housing Unit (Library Service Area)
(1) Source: 2013 American Community Survey (ACS), Table B25033 (adjusted for peak seasonal population) (2) Source: 2013 American Community Survey (ACS), Table DP04 (3) Ratio of people per housing unit for each tier to the mid-size home, developed based on national PPH
data derived from the 2011 American Housing Survey (4) Population (Item 1) divided by housing units (Item 2)
Housing Type Population(1) Housing
Units(2) Ratio(3)
Residents /
Housing
Units(4)
Single Family/Townhouse 642,121 244,031 2.63
- Less than 1,500 sf 92% 2.42
- 1,500 to 2,499 sf 100% 2.63
- 2,500 sf or greater 111% 2.92
Multi-Family/Accessory 215,944 140,448 1.54
Mobile Home 37,923 14,833 2.56
Weighted Average 895,988 399,312 2.24
Housing Type Population(1) Housing
Units(2) Ratio(3)
Residents /
Housing
Units(4)
Single Family 672,018 259,417 2.59
- Less than 1,500 sf 92% 2.38
- 1,500 to 2,499 sf 100% 2.59
- 2,500 sf or greater 111% 2.87
Multi-Family/Accessory 217,534 146,404 1.49
Mobile Home 39,496 15,532 2.54
Weighted Average 929,048 421,353 2.20
DRAFT
Tindale Oliver Palm Beach County September 2015 A-6 Impact Fee Update Study
Functional Population
Functional population, as used in the impact fee analysis, is a generally accepted
methodology for several impact fee areas and is based on the assumption that demand for
certain facilities is generally proportional to the presence of people at a land use, including
residents, employees, and visitors. It is not enough to simply add resident population to the
number of employees, since the service demand characteristics can vary considerably by type
of industry.
Functional population is the equivalent number of people occupying space within a
community on a 24-hour-day, 7-days-a-week basis. A person living and working in the
community will have the functional population coefficient of 1.0. A person living in the
community but working elsewhere may spend only 16 hours per day in the community on
weekdays and 24 hours per day on weekends for a functional population coefficient of 0.76
(128-hour presence divided by 168 hours in one week). A person commuting into the county
to work five days per week would have a functional population coefficient of 0.30 (50-hour
presence divided by 168 hours in one week). Similarly, a person traveling into the community
to shop at stores, perhaps averaging 8 hours per week, would have a functional population
coefficient of 0.05.
Functional population thus tries to capture the presence of all people within the community,
whether residents, workers, or visitors, to arrive at a total estimate of effective population
need to be served.
This form of adjusting population to help measure real facility needs replaces the population
approach of merely weighting residents two-thirds and workers one-third (Nelson and
Nicholas 1992)3. By estimating the functional and weighted population per unit of land use
across all major land uses in a community, an estimate of the demand for certain facilities
and services in the present and future years can be calculated. The following paragraphs
explain how functional population is calculated for residential and non-residential land uses.
3 Arthur C. Nelson and James C. Nicholas, “Estimating Functional Population for Facility Planning,” Journal of Urban Planning and Development 118(2): 45-58 (1992)

DRAFT
Tindale Oliver Palm Beach County September 2015 A-7 Impact Fee Update Study
Residential Functional Population
Developing the residential component of functional population is simpler than developing
the non-residential component. It is generally estimated that people spend one-half to three-
fourths of their time at home and the rest of each 24-hour day away from their place of
residence. In developing the residential component of the Palm Beach County functional
population, an analysis of the County’s population and employment characteristics was
conducted. Tables A-6 and A-7 presents this analysis for Palm Beach County. Based on this
analysis, people in the county, on average, spend 16.3 hours each day at their place of
residence. This corresponds to approximately 68 percent of each 24-hour day at their place
of residence and the other 32 percent away from home.
Table A-6 Population & Employment Characteristics
(1) Source: Census Transportation Planning Package (CTPP) 2010 (2) Source: 2010 U.S. Census (3) Total workers (Item 1) divided by the census population (Item 2) (4) Source: 2010 U.S. Census (5) School age population (Item 4) divided by the census population (Item 2) (6) Census population (Item 2) less total workers (Item 1) and school age population
(Item 4) (7) Population net of workers and school age population (Item 6) divided by the census
population (Item 2)
Item/Calculation Step Figure
Total workers living in Palm Beach County(1) 568,710
Palm Beach County Census Population (2010)(2) 1,320,134
Total workers as a percent of population(3)43.1%
School age population (5-17 years) (2010) (4) 198,032
School age population as a percent of population(5) 15.0%
Population net of workers and school age population(6) 553,392
Other population as a percent of total population(7) 41.9%

DRAFT
Tindale Oliver Palm Beach County September 2015 A-8 Impact Fee Update Study
Table A-7 Residential Coefficient for Functional Population
(1) Assumed (2) Source: Table A-6 (3) Hours at residence (Item 1) multiplied by the percent of population
(Item 2) (4) Sum of effective hours (Item 3) (5) Sum of effective hours (Item 4) divided by 24
The resulting percentage from Table A-6 is used in the calculation of the residential coefficient
for the 24-hour functional population. These actual calculations are presented in Tables A-9,
A-10, and A-11.
Non-Residential Functional Population
Given the varying characteristics of non-residential land uses, developing the estimates of
functional residents for non-residential land uses is more complicated than developing
estimated functional residents for residential land uses. Nelson and Nicholas originally
introduced a method for estimating functional resident population, now used internationally.
This method uses trip generation data from the Institute of Transportation Engineers’ (ITE)
Trip Generation Manual and Tindale Oliver’s Trip Characteristics Database, information of
passengers per vehicle, workers per vehicle, length of time spent at the land use, and other
variables. Specific calculations include:
Total one-way trips per employee (ITE trips multiplied by 50 percent to avoid double
counting entering and exiting trips as two trips).
Visitors per impact unit based on occupants per vehicle (trips multiplied by occupants
per vehicle less employees).
Worker hours per week per impact unit (such as nine worker-hours per day multiplied
by five days in a work week).
Pop. GroupHours at
Residence(1)
Percent of
Population(2)
Effective
Hours(3)
Workers 13 43.1% 5.6
Students 15 15.0% 2.3
Other 20 41.9% 8.4
Total Hours at Residence(4) 16.3
Residential Functional Population Coefficient(5) 67.9%

DRAFT
Tindale Oliver Palm Beach County September 2015 A-9 Impact Fee Update Study
Visitor hours per week per impact unit (visitors multiplied by number of hours per day
times relevant days in a week, such as five for offices and seven for retail shopping).
Functional population coefficients per employee developed by estimating time spent
by employees and visitors at each land use.
Table A-8 also shows the functional population coefficients for non-residential uses in Palm
Beach County. The functional population coefficients in Table A-8 were used to estimate the
County’s functional population in Table A-9, A-10, and A-11.

DRAFT
Tindale Oliver Palm Beach County September 2015 A-10 Impact Fee Update Study
Table A-8 General Functional Population Coefficients
Population/
Employment CategoryITE LUC
Employee
Hours In-
Place(1)
Trips per
Employee(2)
One-Way
Trips per
Employee(3)
Journey-to-
Work Occupants
per Trip(4)
Daily
Occupants per
Trip(5)
Visitors per
Employee(6)
Visitor Hours
per Trip(1)
Days per
Week(7)
Functional
Population
Coefficient(8)
Population 7.00 0.679
Natural Resources n/a 9.00 3.02 1.51 1.32 1.38 0.09 1.00 7.00 0.379
Construction 110 9.00 3.02 1.51 1.32 1.38 0.09 1.00 5.00 0.271
Manufacturing 140 9.00 2.13 1.07 1.32 1.38 0.06 1.00 5.00 0.270
Transportation, Communication, Utilities 110 9.00 3.02 1.51 1.32 1.38 0.09 1.00 5.00 0.271
Wholesale Trade 150 9.00 3.89 1.95 1.32 1.38 0.12 1.00 5.00 0.271
Retail Trade 820 9.00 52.10 26.05 1.24 1.73 12.76 1.50 7.00 1.173
Finance, Insurance, Real Estate 710 9.00 3.32 1.66 1.24 1.73 0.81 1.00 5.00 0.292
Services(9) n/a 9.00 28.17 14.09 1.24 1.73 6.90 1.00 6.00 0.568
Government(10) 730 9.00 11.95 5.98 1.24 1.73 2.93 1.00 7.00 0.497
(1) Assumed
(2) Trips per employee represents all trips divided by the number of employees and is based on Trip Generation 9th Edition (Institute of Transportation Engineers 2012) as follows:
ITE Code 110 at 3.02 weekday trips per employee, page 93.
ITE Code 140 at 2.13 weekday trips per employee, page 164.
ITE Code 150 at 3.89 weekday trips per employee, page 193.
ITE Code 710 at 3.32 weekday trips per employee, page 1252.
ITE Code 730 at 11.95 weekday trips per employee, page 1304.
ITE Code 820 based on blended average of trips by retail center size calculated below, adapted from page 1561.
Trips per retail employee from the following table:
Assumed Sq Ft per Trips per Weighted
Retail Scale Center Size Trip Rate Employee (11)Employee Share Trips
Neighborhood <50k sq.ft. 50 86.56 802 69 40.0% 27.60
Community 50k-250k sq.ft. 250 49.28 975 48 30.0% 14.40
Regional 250k-500k sq.ft. 500 38.66 1,043 40 20.0% 8.00
Super Reg. 500k-1000k sq.ft. 1,000 30.33 676 21 10.0% 2.10
Sum of Weighted Trips/1k sq.ft. 52.10
(3) Trip per employee (Item 2) multiplied by 0.5.
(4) Journey-to-Work Occupants per Trip from 2001 Nationwide Household Travel Survey (FHWA 2001) as follows:
1.32 occupants per Construction, Manufacturing, TCU, and Wholesale trip
1.24 occupants per Retail Trade, FIRE, and Services trip
(5) Daily Occupants per Trip from 2001 Nationwide Household Travel Survey (FHWA 2001) as follows:
1.38 occupants per Construction, Manufacturing, TCU, and Wholesale trip
1.73 occupants per Retail Trade, FIRE, and Services trip
(6) [Daily occupants per trip (Item 5) multiplied by one-way trips per employee (Item 3)] - [(Journey-to-Work occupants per trip (Item 4) multiplied by one-way trips per employee (Item 3)]
(7) Typical number of days per week that indicated industries provide services and relevant government services are available.
(8) Table A-7 for residential and the equation below to determine the Functional Population Coefficient per Employee for all land-use categories except residential includes the following:
(10) Includes Federal Civil ian Government, Federal Military Government, and State and Local Government categories.
(11) Square feet per retail employee from the Energy Information Administration from Table B-1 of the Commercial Energy Building Survey, 2003
((Days per Week x Employee Hours in Place) + (Visitors per Employee x Visitor Hours per Trip x Days per Week)
(24 Hours per Day x 7 Days per Week)
(9) Trips per employee for the services category is the average trips per employee for the following service related land use categories: quality restaurant, high-turnover restaurant, supermarket, hotel, motel, elementary school, middle
school, high school, hospital, medical office, and church. Source for the trips per employee figure from ITE, 9th ed., when available, or else derived from the square feet per employee for the appropriate land use category from the
Energy Information Administration from Table B-1 of the Commercial Energy Building Survey, 2003.
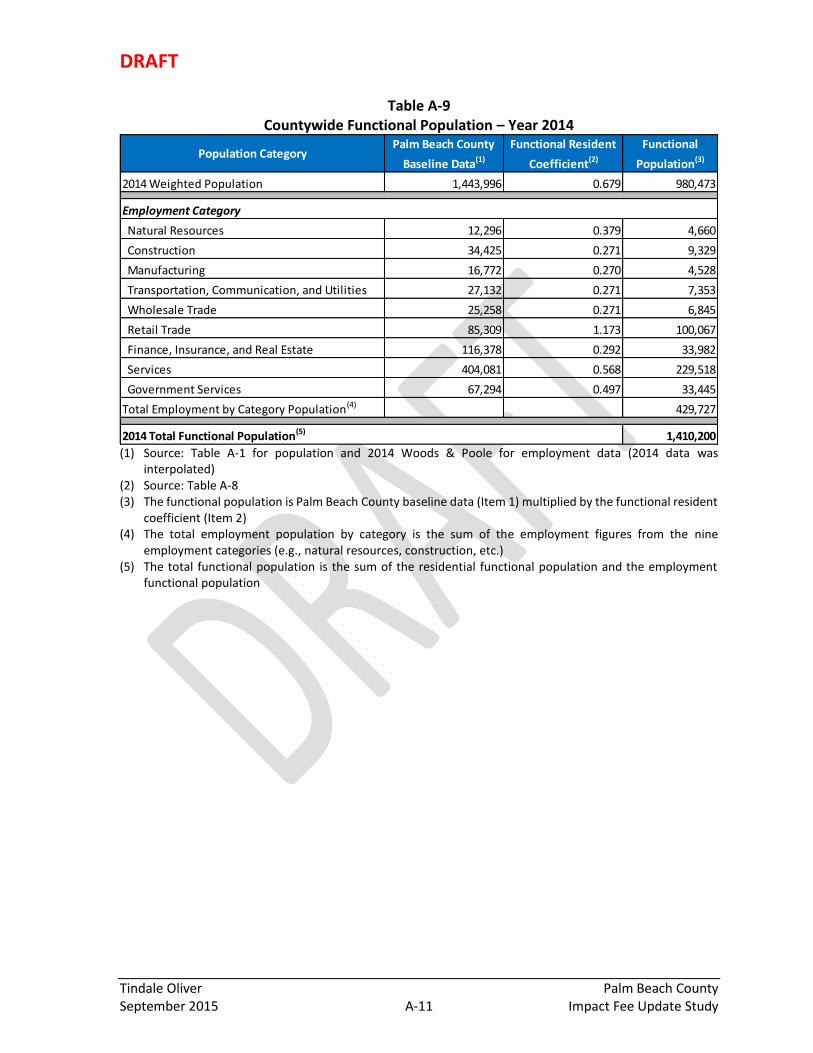
DRAFT
Tindale Oliver Palm Beach County September 2015 A-11 Impact Fee Update Study
Table A-9 Countywide Functional Population – Year 2014
(1) Source: Table A-1 for population and 2014 Woods & Poole for employment data (2014 data was
interpolated) (2) Source: Table A-8 (3) The functional population is Palm Beach County baseline data (Item 1) multiplied by the functional resident
coefficient (Item 2) (4) The total employment population by category is the sum of the employment figures from the nine
employment categories (e.g., natural resources, construction, etc.) (5) The total functional population is the sum of the residential functional population and the employment
functional population
Population CategoryPalm Beach County
Baseline Data(1)
Functional Resident
Coefficient(2)
Functional
Population(3)
2014 Weighted Population 1,443,996 0.679 980,473
Employment Category
Natural Resources 12,296 0.379 4,660
Construction 34,425 0.271 9,329
Manufacturing 16,772 0.270 4,528
Transportation, Communication, and Utilities 27,132 0.271 7,353
Wholesale Trade 25,258 0.271 6,845
Retail Trade 85,309 1.173 100,067
Finance, Insurance, and Real Estate 116,378 0.292 33,982
Services 404,081 0.568 229,518
Government Services 67,294 0.497 33,445
Total Employment by Category Population(4) 429,727
2014 Total Functional Population(5) 1,410,200
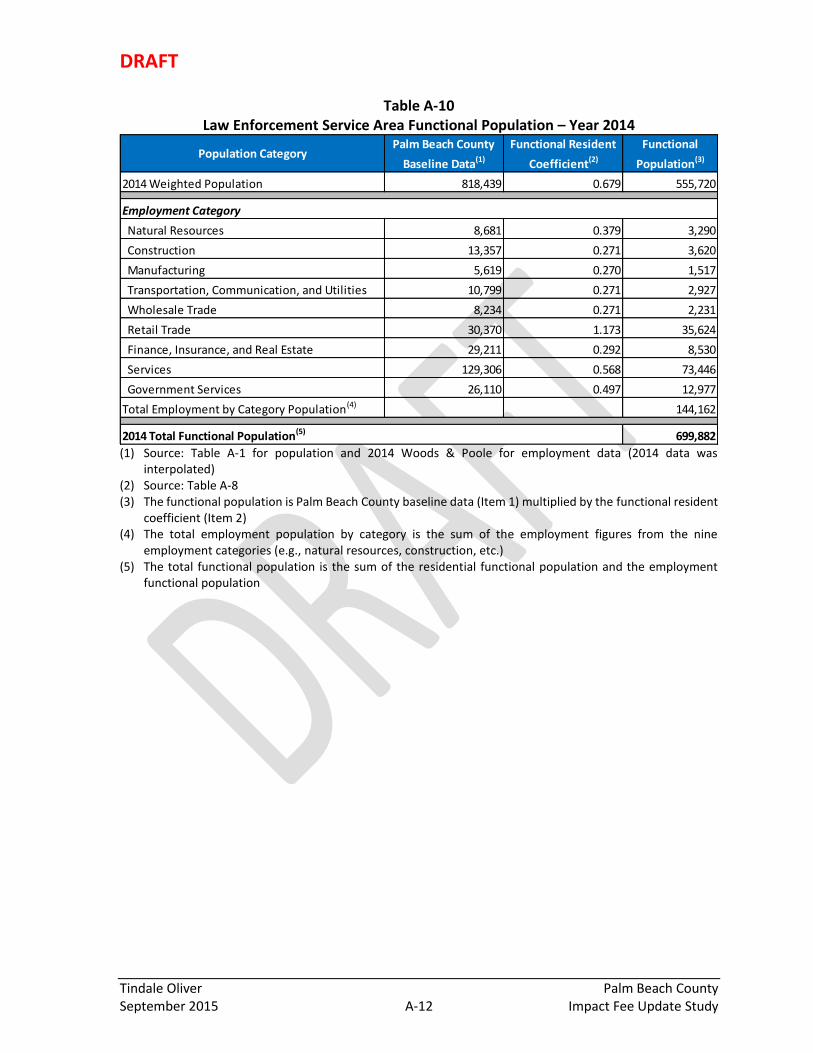
DRAFT
Tindale Oliver Palm Beach County September 2015 A-12 Impact Fee Update Study
Table A-10 Law Enforcement Service Area Functional Population – Year 2014
(1) Source: Table A-1 for population and 2014 Woods & Poole for employment data (2014 data was
interpolated) (2) Source: Table A-8 (3) The functional population is Palm Beach County baseline data (Item 1) multiplied by the functional resident
coefficient (Item 2) (4) The total employment population by category is the sum of the employment figures from the nine
employment categories (e.g., natural resources, construction, etc.) (5) The total functional population is the sum of the residential functional population and the employment
functional population
Population CategoryPalm Beach County
Baseline Data(1)
Functional Resident
Coefficient(2)
Functional
Population(3)
2014 Weighted Population 818,439 0.679 555,720
Employment Category
Natural Resources 8,681 0.379 3,290
Construction 13,357 0.271 3,620
Manufacturing 5,619 0.270 1,517
Transportation, Communication, and Utilities 10,799 0.271 2,927
Wholesale Trade 8,234 0.271 2,231
Retail Trade 30,370 1.173 35,624
Finance, Insurance, and Real Estate 29,211 0.292 8,530
Services 129,306 0.568 73,446
Government Services 26,110 0.497 12,977
Total Employment by Category Population(4) 144,162
2014 Total Functional Population(5) 699,882

DRAFT
Tindale Oliver Palm Beach County September 2015 A-13 Impact Fee Update Study
Table A-11 Fire Rescue Service Area Functional Population – Year 2014
(1) Source: Table A-1 for population and 2014 Woods & Poole for employment data (2014 data was
interpolated) (2) Source: Table A-8 (3) The functional population is Palm Beach County baseline data (Item 1) multiplied by the functional resident
coefficient (Item 2) (4) The total employment population by category is the sum of the employment figures from the nine
employment categories (e.g., natural resources, construction, etc.) (5) The total functional population is the sum of the residential functional population and the employment
functional population
Table A-12 presents the County’s annual functional population figures from 2000 through
2040, based on the 2014 functional population figures from Tables A-9, A-10, and A-11 and
the annual population growth rates from the population figures previously presented in Table
A-1.
Population CategoryPalm Beach County
Baseline Data(1)
Functional Resident
Coefficient(2)
Functional
Population(3)
2014 Weighted Population 920,758 0.679 625,195
Employment Category
Natural Resources 8,804 0.379 3,337
Construction 16,214 0.271 4,394
Manufacturing 6,960 0.270 1,879
Transportation, Communication, and Utilities 14,597 0.271 3,956
Wholesale Trade 9,674 0.271 2,622
Retail Trade 36,427 1.173 42,729
Finance, Insurance, and Real Estate 37,125 0.292 10,841
Services 164,057 0.568 93,184
Government Services 29,407 0.497 14,615
Total Employment by Category Population(4) 177,557
2014 Total Functional Population(5) 802,752

DRAFT
Tindale Oliver Palm Beach County September 2015 A-14 Impact Fee Update Study
Table A-12 Palm Beach County Functional Population (2000-2040)
(1) Source: Table A-9 for 2014. Other years are based on growth rates for Palm
Beach County weighted seasonal population; Table A-1 (Item 1) (2) Source: Table A-10 for 2014. Other years are based on growth rates for Palm
Beach County weighted seasonal population; Table A-1 (Item 2) (3) Source: Table A-11 for 2014. Other years are based on growth rates for Palm
Beach County weighted seasonal population; Table A-1 (Item 3)
Palm Beach
Countywide(1)
Service Area for
Law Enf.(2)
Service Area for
Fire Rescue(3)
2000 1,165,044 583,964 658,067
2001 1,191,141 597,629 674,124
2002 1,219,967 614,542 692,865
2003 1,251,564 628,861 709,702
2004 1,285,732 638,545 722,335
2005 1,314,790 647,229 733,531
2006 1,331,356 650,918 739,693
2007 1,341,474 658,143 747,756
2008 1,345,230 659,393 749,476
2009 1,347,920 659,921 750,900
2010 1,367,869 681,038 779,584
2011 1,374,572 683,762 783,248
2012 1,384,881 687,659 788,809
2013 1,396,652 692,541 794,804
2014 1,410,200 699,882 802,752
2015 1,425,007 707,861 811,422
2016 1,442,250 716,426 821,240
2017 1,459,701 725,095 831,177
2018 1,477,363 733,869 841,234
2019 1,495,239 742,749 851,413
2020 1,513,331 751,736 861,715
2021 1,528,918 759,479 870,591
2022 1,544,666 767,302 879,558
2023 1,560,576 775,205 888,617
2024 1,576,650 783,190 897,770
2025 1,593,205 791,413 907,197
2026 1,607,225 798,377 915,180
2027 1,621,369 805,403 923,234
2028 1,635,637 812,491 931,358
2029 1,650,031 819,641 939,554
2030 1,664,881 827,018 948,010
2031 1,676,202 832,642 954,456
2032 1,687,600 838,304 960,946
2033 1,699,076 844,004 967,480
2034 1,710,630 849,743 974,059
2035 1,721,920 855,351 980,488
2036 1,733,112 860,911 986,861
2037 1,744,377 866,507 993,276
2038 1,755,715 872,139 999,732
2039 1,767,127 877,808 1,006,230
2040 1,778,613 883,514 1,012,770
Functional Population
Year

DRAFT
Tindale Oliver Palm Beach County September 2015 A-15 Impact Fee Update Study
Functional Residents by Specific Land Use Category
When a wide range of land uses impact services, an estimate of that impact is needed for
each land use. This section presents functional population estimates by residential and non-
residential land uses.
Residential and Transient Land Uses
As mentioned previously, different functional population coefficients need to be developed
for each impact fee service area to be analyzed. For residential and transient land uses, these
coefficients are displayed in Tables A-13 (for the countywide service area), A-14 (for the law
enforcement service area) and A-15 (for the fire rescue service area). The average number
of persons per housing unit in Palm Beach County was calculated for the single
family/townhouse, multi-family, and mobile home land uses, based on information obtained
from the 2013 American Community Survey and the 2011 American Housing Survey. Besides
the residential land uses, Tables A-13, A-14 and A-15 also include transient land uses, such as
hotels, and nursing homes/congregate living facilities. Secondary sources, such as the Palm
Beach County Tourist Development Council and the Convention and Visitors Bureau and the
Florida Department of Elderly Affairs, are used to determine the occupancy rate for hotels,
motels, nursing homes, and CLF land uses.
Non-Residential Land Uses
A similar approach is used to estimate functional residents for non-residential land uses.
Table A-16 presents basic assumptions and calculations, such as trips per unit, trips per
employee, employees per impact unit, one-way trips per impact unit, worker hours,
occupants per vehicle trip, visitors (patrons, etc.) per impact unit, visitor hours per trip, and
days per week for non-residential land uses. The final column in the tables shows the
estimated functional resident coefficients by land use. These coefficients by land use create
the demand component for the certain impact fee programs and will be used in the
calculation of the cost per unit for each land use category in the select impact fee schedules.

DRAFT
Tindale Oliver Palm Beach County September 2015 A-16 Impact Fee Update Study
Table A-13 Functional Residents for Residential and Transient Land Uses - Countywide Service Area
Residential Land UseImpact
Unit
ITE
LUC(1)
Residents/
Visitors Per
Unit(2)
Occupancy
Rate(3)
Adjusted
Residents
Per Unit(4)
Peak Visitor
Hours at
Place(5)
Workers
Per Unit(6)
Work Day
Hours(7)
Days Per
Week(8)
Work Week
Residents Per
Unit(9)
Residential
Single Family/Townhouse
- Less than 1,500 sf du 210 2.35 - - - - - - 1.60
- 1,500 to 2,499 sf du 210 2.55 - - - - - - 1.73
- 2,500 sf or more du 210 2.83 - - - - - - 1.92
Multi-Family (Apartment/Condo) du 220/230 1.46 - - - - - - 0.99
Accessory Apartment/Grooms Quarters du n/a 1.46 - - - - - - 0.99
Mobile Home du 240 2.45 - - - - - - 1.66
Transient, Assisted, Group
Hotel room 310 2.08 67% 1.39 12 0.57 9 7 0.91
Motel room 320 2.08 67% 1.39 12 0.44 9 7 0.86
Nursing Home/Congregate Living Facility bed 254/620 1.00 83% 0.83 16 0.84 9 7 0.87
[(Adjusted Residents per Unit X Hours at Place X Days per Week) + (Workers Per Unit X Work Hours Per Day X Days per Week)]
(2) Estimates for the single family, multi-family, and mobile home land use from Table A-2; estimates for the hotel/motel land use is based on data obtained from Palm Beach County Tourist
Development Council and the Convention and Visitors Bureau. One person per bed is assumed for nursing homes/congregate living facil ities.
(24 Hours per Day X 7 Days per Week)
(3) Source for hotel/motel occupancy: Palm Beach County Tourist Development Council and the Convention and Visitors Bureau. Average hotel/motel occupancy rate for 2005 through 2013. Source
for nursing home/CLF occupancy rate is the Florida Department of Elderly Affairs, Palm Beach County Profile. Average occupancy rate for 2012 and 2013.
(1) Land use code from the Institute of Transportation Engineers (ITE) Trip Generation Handbook, 9th Edition
(4) Residents per unit times occupancy rate
(5), (7), (8) Estimated
(6) Adapted from ITE Trip Generation Handbook, 9th Edition
(9) For residential this is Residents Per Unit times 0.679. For Transient, Assisted, and Group it is:

DRAFT
Tindale Oliver Palm Beach County September 2015 A-17 Impact Fee Update Study
Table A-14 Functional Residents for Residential and Transient Land Uses – Law Enforcement Service Area
Residential Land UseImpact
Unit
ITE
LUC(1)
Residents/
Visitors Per
Unit(2)
Occupancy
Rate(3)
Adjusted
Residents
Per Unit(4)
Peak Visitor
Hours at
Place(5)
Workers
Per Unit(6)
Work Day
Hours(7)
Days Per
Week(8)
Work Week
Residents Per
Unit(9)
Residential
Single Family/Townhouse
- Less than 1,500 sf du 210 2.44 - - - - - - 1.66
- 1,500 to 2,499 sf du 210 2.65 - - - - - - 1.80
- 2,500 sf or more du 210 2.94 - - - - - - 2.00
Multi-Family (Apartment/Condo) du 220/230 1.56 - - - - - - 1.06
Accessory Apartment/Grooms Quarters du n/a 1.56 - - - - - - 1.06
Mobile Home du 240 2.63 - - - - - - 1.79
Transient, Assisted, Group
Hotel room 310 2.08 67% 1.39 12 0.57 9 7 0.91
Motel room 320 2.08 67% 1.39 12 0.44 9 7 0.86
Nursing Home/Congregate Living Facility bed 254/620 1.00 83% 0.83 16 0.84 9 7 0.87
[(Adjusted Residents per Unit X Hours at Place X Days per Week) + (Workers Per Unit X Work Hours Per Day X Days per Week)]
(3) Source for hotel/motel occupancy: Palm Beach County Tourist Development Council and the Convention and Visitors Bureau. Average hotel/motel occupancy rate for 2005 through 2013. Source
for nursing home/CLF occupancy rate is the Florida Department of Elderly Affairs, Palm Beach County Profile. Average occupancy rate for 2012 and 2013.
(4) Residents per unit times occupancy rate
( 24 Hours per Day X 7 Days per Week)
(5), (7), (8) Estimated
(6) Adapted from ITE Trip Generation Handbook, 9th Edition
(9) For residential this is Residents Per Unit times 0.679. For Transient, Assisted, and Group it is:
(1) Land use code from the Institute of Transportation Engineers (ITE) Trip Generation Handbook, 9th Edition
(2) Estimates for the single family, multi-family, and mobile home land use from Table A-3; estimates for the hotel/motel land use is based on data obtained from Palm Beach County Tourist
Development Council and the Convention and Visitors Bureau. One person per bed is assumed for nursing homes/congregate living facil ities.

DRAFT
Tindale Oliver Palm Beach County September 2015 A-18 Impact Fee Update Study
Table A-15 Functional Residents for Residential and Transient Land Uses – Fire Rescue Service Area
Residential Land UseImpact
Unit
ITE
LUC(1)
Residents/
Visitors Per
Unit(2)
Occupancy
Rate(3)
Adjusted
Residents
Per Unit(4)
Peak Visitor
Hours at
Place(5)
Workers
Per Unit(6)
Work Day
Hours(7)
Days Per
Week(8)
Work Week
Residents Per
Unit(9)
Residential
Single Family/Townhouse
- Less than 1,500 sf du 210 2.42 - - - - - - 1.64
- 1,500 to 2,499 sf du 210 2.63 - - - - - - 1.79
- 2,500 sf or more du 210 2.92 - - - - - - 1.98
Multi-Family (Apartment/Condo) du 220/230 1.54 - - - - - - 1.05
Accessory Apartment/Grooms Quarters du n/a 1.54 - - - - - - 1.05
Mobile Home du 240 2.56 - - - - - - 1.74
Transient, Assisted, Group
Hotel room 310 2.08 67% 1.39 12 0.57 9 7 0.91
Motel room 320 2.08 67% 1.39 12 0.44 9 7 0.86
Nursing Home/Congregate Living Facility bed 254/620 1.00 83% 0.83 16 0.84 9 7 0.87
[(Adjusted Residents per Unit X Hours at Place X Days per Week) + (Workers Per Unit X Work Hours Per Day X Days per Week)]
(1) Land use code from the Institute of Transportation Engineers (ITE) Trip Generation Handbook, 9th Edition
(2) Estimates for the single family, multi-family, and mobile home land use from Table A-4; estimates for the hotel/motel land use is based on data obtained from Palm Beach County Tourist
Development Council and the Convention and Visitors Bureau. One person per bed is assumed for nursing homes/congregate living facil ities.
(3) Source for hotel/motel occupancy: Palm Beach County Tourist Development Council and the Convention and Visitors Bureau. Average hotel/motel occupancy rate for 2005 through 2013. Source
for nursing home/CLF occupancy rate is the Florida Department of Elderly Affairs, Palm Beach County Profile. Average occupancy rate for 2012 and 2013.
(4) Residents per unit times occupancy rate
(6) Adapted from ITE Trip Generation Handbook, 9th Edition
(9) For residential this is Residents Per Unit times 0.679. For Transient, Assisted, and Group it is:
( 24 Hours per Day X 7 Days per Week)
(5), (7), (8) Estimated

DRAFT
Tindale Oliver Palm Beach County September 2015 A-19 Impact Fee Update Study
Table A-16 Functional Residents for Non-Residential Land Uses
ITE
LUC(1) Land Use Impact Unit Trips Per
Unit(2)
Trips Per
Employee(3)
Employees
Per Unit(4)
One-Way
Factor @
50%(5)
Worker
Hours(6)
Occupants
Per Trip(7) Visitors(8)
Visitor
Hours Per
Trip(9)
Days Per
Week(10)
Functional
Resident
Coefficient(11)
RECREATIONAL:
412 General Recreation/County Park acre 2.28 n/a 0.10 1.14 9 2.39 2.62 1.50 7 0.20
420 Marina berth 2.96 20.52 0.14 1.48 9 2.39 3.40 1.00 7 0.19
430 Golf Course hole 35.74 20.52 1.74 17.87 9 2.39 40.97 0.25 7 1.08
444 Movie Theater w/Matinee screen 106.63 53.12 2.01 53.32 9 2.39 125.42 1.00 7 5.98
491 Raquet/Tennis Club court 38.70 45.71 0.85 19.35 9 2.39 45.40 1.50 7 3.16
492 Health Club 1,000 sf 32.93 n/a 2.00 16.47 9 2.39 37.36 1.50 7 3.09
INSTITUTIONS:
520 Elementary School (Private) student 1.29 15.71 0.08 0.65 9 1.11 0.64 2.00 5 0.06
522 Middle School (Private) student 1.62 16.39 0.10 0.81 9 1.11 0.80 2.00 5 0.07
530 High School (Private) student 1.71 19.74 0.09 0.86 9 1.11 0.86 2.00 5 0.08
540 University (7,500 or fewer students) (Private) student 2.00 12.26 0.16 1.00 9 1.11 0.95 2.00 5 0.10
550 University (more than 7,500 students) (Private) student 1.50 12.26 0.12 0.75 9 1.11 0.71 2.00 5 0.07
560 Church/Synagogue 1,000 sf 9.11 20.64 0.44 4.56 9 1.90 8.22 1.00 7 0.51
565 Day Care Center 1,000 sf 71.88 26.73 2.69 35.94 9 1.11 37.20 0.15 5 0.89
566 Cemetery acre 4.73 58.09 0.08 2.37 9 1.90 4.42 0.50 7 0.12
610 Hospital 1,000 sf 13.22 4.50 2.94 6.61 9 1.42 6.45 1.00 7 1.37
640 Animal Hospital/Veterinary Clinic 1,000 sf 32.80 n/a 4.05 16.40 9 1.42 19.24 1.00 7 2.32
n/a Funeral Home 1,000 sf 12.60 n/a 0.44 6.30 9 1.90 11.53 1.00 6 0.55
OFFICE & FINANCIAL:
Office (50,000 sf and less) 1,000 sf 15.50 3.32 4.67 7.75 9 1.28 5.25 1.00 5 1.41
Office (50,001 - 100,000 sf) 1,000 sf 13.13 3.32 3.95 6.57 9 1.28 4.46 1.00 5 1.19
Office (100,001 - 200,000 sf) 1,000 sf 11.12 3.32 3.35 5.56 9 1.28 3.77 1.00 5 1.01
Office (200,001 - 400,000 sf) 1,000 sf 9.41 3.32 2.83 4.71 9 1.28 3.20 1.00 5 0.85
Office (greater than 400,000 sf) 1,000 sf 8.54 3.32 2.57 4.27 9 1.28 2.90 1.00 5 0.77
720 Medical Office (less than 10,000 sf) 1,000 sf 23.83 8.91 2.67 11.92 9 1.42 14.26 1.00 5 1.14
720 Medical Office (10,000 sf and greater) 1,000 sf 34.72 8.91 3.90 17.36 9 1.42 20.75 1.00 5 1.66
710

DRAFT
Tindale Oliver Palm Beach County September 2015 A-20 Impact Fee Update Study
Table A-16 (continued) Functional Residents for Non-Residential Land Uses
ITE
LUC(1) Land Use Impact Unit
Trips Per
Unit(2)
Trips Per
Employee(3)
Employees
Per Unit(4)
One-Way
Factor @
50%(5)
Worker
Hours(6)
Occupants
Per Trip(7) Visitors(8)
Visitor
Hours Per
Trip(9)
Days Per
Week(10)
Functional
Resident
Coefficient(11)
RETAIL:
817 Nursery (Garden Center) acre 108.10 21.83 4.95 54.05 9 1.73 88.56 1.00 7 5.55
Retail 50,000 sf and less 1,000 sf 86.56 n/a 2.50 43.28 9 1.73 72.37 0.50 7 2.45
Retail 50,001 - 200,000 sf 1,000 sf 53.28 n/a 2.50 26.64 9 1.73 43.59 0.75 7 2.30
Retail 200,001 - 400,000 sf 1,000 sf 41.80 n/a 2.50 20.90 9 1.73 33.66 1.00 7 2.34
Retail 400,001 - 600,000 sf 1,000 sf 36.27 n/a 2.50 18.14 9 1.73 28.88 1.25 7 2.44
Retail 600,001 - 800,000 sf 1,000 sf 32.80 n/a 2.50 16.40 9 1.73 25.87 1.50 7 2.55
Retail greater than 800,000 sf 1,000 sf 30.33 n/a 2.50 15.17 9 1.73 23.74 1.50 7 2.42
841 New/Used Car Sales 1,000 sf 28.25 21.14 1.34 14.13 9 1.73 23.10 1.00 7 1.47
848 Tire Store 1,000 sf 24.87 41.35 0.60 12.44 9 1.52 18.31 1.00 7 0.99
853 Convenience Store w/Gas Pumps 1,000 sf 775.14 n/a 2.50 387.57 9 1.52 586.61 0.20 7 5.83
880/881 Pharmacy with and w/o Drive-Thru 1,000 sf 95.96 n/a 2.50 47.98 9 1.52 70.43 0.35 7 1.96
890 Furniture Store 1,000 sf 5.06 12.19 0.42 2.53 9 1.52 3.43 0.50 7 0.23
912 Bank/Savings w/Drive-In 1,000 sf 159.34 30.94 5.15 79.67 9 1.52 115.95 0.15 6 2.28
931 Quality Restaurant 1,000 sf 91.10 n/a 9.92 45.55 9 1.85 74.35 1.00 7 6.82
932 High-Turnover Restaurant 1,000 sf 116.60 n/a 9.92 58.30 9 1.85 97.94 0.75 7 6.78
934 Fast Food Rest. w/Drive-Thru 1,000 sf 511.00 n/a 10.90 255.50 9 1.85 461.78 0.25 7 8.90
941 Quick Lube bay 40.00 n/a 1.50 20.00 9 1.52 28.90 0.50 7 1.16
942 Automobile Care Center 1,000 sf 31.43 n/a 1.50 15.72 9 1.52 22.39 1.00 7 1.50
944/946 Gas Station with and w/o Car Wash fuel pos. 157.33 n/a 2.50 78.67 9 1.52 117.08 0.20 7 1.91
947 Car Wash bay 43.94 n/a 0.50 21.97 9 1.52 32.89 0.50 7 0.87
INDUSTRIAL:
110 General Industrial 1,000 sf 6.97 3.02 2.31 3.49 9 1.38 2.51 1.00 5 0.69
150 Warehousing 1,000 sf 3.56 3.89 0.92 1.78 9 1.38 1.54 0.75 5 0.28
151 Mini-Warehouse 1,000 sf 2.15 61.90 0.03 1.08 9 1.38 1.46 0.75 7 0.06
Sources:
(1) Land use code found in the Institute of Transportation Engineers (ITE) Trip Generation Handbook, 9th Edition
(2) Land uses and trip generation rates consistent with those included in the Transportation Impact Fee Update Study
(3) Trips per employee from ITE Trip Generation Handbook, 9th Edition, when available
(4) Trips per impact unit divided by trips per person (usually employee). When trips per person are not available, the employees per unit is estimated.
(5) Trips per unit (Item 2) multiplied by 50 percent
(6), (9), (10) Estimated
(7) Nationwide Personal Transportation Survey
(8) [(One-way Trips/Unit X Occupants/Trip) - Employees].
(11) [(Workers X Hours/Day X Days/Week) + (Visitors X Hours/Visit X Days/Week)]/(24 Hours x 7 Days)
820

DRAFT
Tindale Oliver Palm Beach County September 2015 A-21 Impact Fee Update Study
Table A-17 Weighted Seasonal Population Projections (Countywide Service Area)
(1) BEBR-Medium projection for 2040. Interim years were
interpolated to smooth out annual population growth rates (2) Source: Census 2000, Palm Beach County, Palm Beach County
Tourist Development Council (3) Sum of permanent population (Item 1) and seasonal population
(Item 2)
YearPermanent
Population(1)
Seasonal
Population(2)
Total Weighted
Season Pop.(3)
2000 1,131,191 61,847 1,193,038
2001 1,156,550 63,194 1,219,744
2002 1,184,549 64,724 1,249,273
2003 1,215,286 66,404 1,281,690
2004 1,248,466 68,216 1,316,682
2005 1,273,752 72,625 1,346,377
2006 1,291,426 71,936 1,363,362
2007 1,302,451 71,217 1,373,668
2008 1,307,784 69,732 1,377,516
2009 1,312,016 68,288 1,380,304
2010 1,320,134 80,543 1,400,677
2011 1,325,758 81,747 1,407,505
2012 1,335,415 82,615 1,418,030
2013 1,345,652 84,495 1,430,147
2014 1,359,976 84,020 1,443,996
2015 1,374,300 84,905 1,459,205
2016 1,390,929 85,932 1,476,861
2017 1,407,759 86,971 1,494,730
2018 1,424,793 88,024 1,512,817
2019 1,442,033 89,089 1,531,122
2020 1,459,500 90,168 1,549,668
2021 1,474,533 91,097 1,565,630
2022 1,489,721 92,036 1,581,757
2023 1,505,065 92,983 1,598,048
2024 1,520,567 93,941 1,614,508
2025 1,536,600 94,931 1,631,531
2026 1,550,122 95,766 1,645,888
2027 1,563,763 96,609 1,660,372
2028 1,577,524 97,459 1,674,983
2029 1,591,406 98,316 1,689,722
2030 1,605,700 99,200 1,704,900
2031 1,616,619 99,875 1,716,494
2032 1,627,612 100,554 1,728,166
2033 1,638,680 101,238 1,739,918
2034 1,649,823 101,926 1,751,749
2035 1,660,700 102,598 1,763,298
2036 1,671,495 103,265 1,774,760
2037 1,682,360 103,936 1,786,296
2038 1,693,295 104,612 1,797,907
2039 1,704,301 105,292 1,809,593
2040 1,715,300 105,972 1,821,272

DRAFT
Tindale Oliver Palm Beach County September 2015 A-22 Impact Fee Update Study
Table A-18 Weighted Seasonal Population Projections (Library Service Area)
(1) BEBR-Medium projection for 2040. Interim years were
interpolated to smooth out annual population growth rate (2) Source: Census 2000, Palm Beach County, Palm Beach County
Tourist Development Council (3) Sum of permanent population (Item 1) and seasonal population
YearPermanent
Population
Seasonal
Population
Total
Weighted
Season Pop.
2000 731,460 36,663 768,123
2001 749,043 37,467 786,510
2002 773,437 38,687 812,124
2003 794,952 39,763 834,715
2004 811,631 40,598 852,229
2005 825,469 43,251 868,720
2006 834,620 42,635 877,255
2007 844,631 42,281 886,912
2008 849,169 41,355 890,524
2009 852,136 40,416 892,552
2010 876,834 50,919 927,753
2011 880,417 51,699 932,116
2012 885,934 52,203 938,137
2013 890,688 53,309 943,997
2014 899,394 52,920 952,314
2015 911,161 53,613 964,774
2016 922,186 54,261 976,447
2017 933,344 54,918 988,262
2018 944,638 55,582 1,000,220
2019 956,068 56,255 1,012,323
2020 967,649 56,936 1,024,585
2021 977,615 57,523 1,035,138
2022 987,685 58,115 1,045,800
2023 997,858 58,714 1,056,572
2024 1,008,136 59,319 1,067,455
2025 1,018,766 59,944 1,078,710
2026 1,027,731 60,472 1,088,203
2027 1,036,775 61,003 1,097,778
2028 1,045,898 61,540 1,107,438
2029 1,055,102 62,082 1,117,184
2030 1,064,579 62,640 1,127,219
2031 1,071,818 63,066 1,134,884
2032 1,079,107 63,495 1,142,602
2033 1,086,445 63,926 1,150,371
2034 1,093,833 64,361 1,158,194
2035 1,101,044 64,786 1,165,830
2036 1,108,201 65,207 1,173,408
2037 1,115,405 65,630 1,181,035
2038 1,122,655 66,057 1,188,712
2039 1,129,952 66,486 1,196,438
2040 1,137,244 66,916 1,204,160

DRAFT
Tindale Oliver Palm Beach County September 2015 A-23 Impact Fee Update Study
Table A-19 Weighted Seasonal Population Projections (Law Enforcement Service Area)
(1) BEBR-Medium projection for 2040. Interim years were
interpolated to smooth out annual population growth rates (2) Source: Census 2000, Palm Beach County, Palm Beach County
Tourist Development Council (3) Sum of permanent population (Item 1) and seasonal population
YearPermanent
Population(1)
Seasonal
Population(2)
Total
Weighted
Season Pop.(3)
2000 653,200 29,650 682,850
2001 668,482 30,349 698,831
2002 687,396 31,208 718,604
2003 703,440 31,936 735,376
2004 714,279 32,428 746,707
2005 722,380 34,513 756,893
2006 727,423 33,798 761,221
2007 736,229 33,453 769,682
2008 738,597 32,558 771,155
2009 740,080 31,682 771,762
2010 757,096 39,324 796,420
2011 759,766 39,828 799,594
2012 763,981 40,205 804,186
2013 768,700 41,164 809,864
2014 777,585 40,854 818,439
2015 786,469 41,322 827,791
2016 795,986 41,821 837,807
2017 805,617 42,327 847,944
2018 815,365 42,840 858,205
2019 825,231 43,358 868,589
2020 835,227 43,883 879,110
2021 843,830 44,334 888,164
2022 852,521 44,791 897,312
2023 861,302 45,253 906,555
2024 870,174 45,719 915,893
2025 879,349 46,201 925,550
2026 887,087 46,607 933,694
2027 894,893 47,018 941,911
2028 902,768 47,431 950,199
2029 910,712 47,848 958,560
2030 918,893 48,278 967,171
2031 925,141 48,607 973,748
2032 931,432 48,938 980,370
2033 937,766 49,270 987,036
2034 944,143 49,605 993,748
2035 950,367 49,932 1,000,299
2036 956,545 50,257 1,006,802
2037 962,763 50,583 1,013,346
2038 969,020 50,912 1,019,932
2039 975,319 51,243 1,026,562
2040 981,613 51,574 1,033,187

DRAFT
Tindale Oliver Palm Beach County September 2015 A-24 Impact Fee Update Study
Table A-20 Weighted Seasonal Population Projections (Fire Rescue Service Area)
(1) BEBR-Medium projection for 2040. Interim years were
interpolated to smooth out annual population growth rates (2) Source: Census 2000, Palm Beach County, Palm Beach County
Tourist Development Council (3) Sum of permanent population (Item 1) and seasonal population
(Item 2)
YearPermanent
Population(1)
Seasonal
Population(2)
Total
Weighted
Season Pop.(3)
2000 719,884 34,803 754,687
2001 737,471 35,650 773,121
2002 758,003 36,642 794,645
2003 776,459 37,534 813,993
2004 790,294 38,203 828,497
2005 800,744 40,611 841,355
2006 808,521 39,943 848,464
2007 818,141 39,581 857,722
2008 821,046 38,606 859,652
2009 823,609 37,679 861,288
2010 847,592 46,630 894,222
2011 850,929 47,465 898,394
2012 856,802 47,968 904,770
2013 862,554 49,089 911,643
2014 872,013 48,745 920,758
2015 881,472 49,275 930,747
2016 892,138 49,870 942,008
2017 902,933 50,474 953,407
2018 913,858 51,085 964,943
2019 924,916 51,703 976,619
2020 936,119 52,329 988,448
2021 945,761 52,868 998,629
2022 955,503 53,413 1,008,916
2023 965,345 53,963 1,019,308
2024 975,288 54,519 1,029,807
2025 985,571 55,093 1,040,664
2026 994,244 55,578 1,049,822
2027 1,002,993 56,067 1,059,060
2028 1,011,820 56,561 1,068,381
2029 1,020,723 57,059 1,077,782
2030 1,029,892 57,571 1,087,463
2031 1,036,895 57,962 1,094,857
2032 1,043,946 58,357 1,102,303
2033 1,051,045 58,754 1,109,799
2034 1,058,192 59,153 1,117,345
2035 1,065,168 59,543 1,124,711
2036 1,072,092 59,930 1,132,022
2037 1,079,061 60,320 1,139,381
2038 1,086,075 60,711 1,146,786
2039 1,093,134 61,106 1,154,240
2040 1,100,189 61,501 1,161,690

DRAFT
Tindale Oliver Palm Beach County September 2015 A-25 Impact Fee Update Study
Palm Beach County Impact Fee Program Service Areas
Table A-21 displays the service areas of Palm Beach County’s impact fee programs.
Table A-21
Palm Beach County Impact Fee Program Service Areas
Note: “Y” indicates service is provided in the area Note: “N” indicates service is not directly provided in the area
Roads Parks Public Bldgs Schools
City of Atlantis Y Y Y Y Y N N
City of Belle Glade Y Y Y Y Y Y Y
City of Boca Raton Y Y Y Y N N N
City of Boynton Beach Y Y Y Y N N N
City of Briny Breezes Y Y Y Y Y N N
Town of Cloud Lake Y Y Y Y Y Y Y
City of Delray Beach Y Y Y Y N N N
Town of Glen Ridge Y Y Y Y Y Y Y
City of Greenacres Y Y Y Y Y N N
Town of Gulfstream Y Y Y Y N N N
Town of Haverhill Y Y Y Y Y Y Y
Town of Highland Beach Y Y Y Y N N N
Town of Hypoluxo Y Y Y Y Y N N
Town of Juno Beach Y Y Y Y Y N Y
Town of Jupiter Inlet Colony Y Y Y Y Y N N
Town of Jupiter Y Y Y Y Y N Y
Town of Lake Clarke Shores Y Y Y Y Y N Y
Town of Lake Park Y Y Y Y N Y Y
City of Lake Worth Y Y Y Y N Y Y
Town of Lantana Y Y Y Y N N Y
Town of Loxahatchee Groves Y Y Y Y Y Y Y
Town of Manalapan Y Y Y Y N N Y
Town of Mangonia Park Y Y Y Y Y Y N
Village of North Palm Beach Y Y Y Y N N N
Town of Ocean Ridge Y Y Y Y Y N N
City of Pahokee Y Y Y Y Y Y Y
Town of Palm Beach Y Y Y Y N N N
City of Palm Beach Gardens Y Y Y Y Y N N
Town of Palm Beach Shores Y Y Y Y Y N N
Village of Palm Springs Y Y Y Y N N Y
City of Riviera Beach Y Y Y Y N N N
Village of Royal Palm Beach Y Y Y Y Y Y Y
City of South Palm Beach Y Y Y Y Y N Y
City of South Bay Y Y Y Y Y Y Y
Village of Tequesta Y Y Y Y Y N N
Village of Golf Y Y Y Y N Y N
Village of Wellington Y Y Y Y Y Y Y
City of West Palm Beach Y Y Y Y N N N
PBC Unincorporated Y Y Y Y Y Y Y
Palm Beach County/ CitiesCountywide Service Area Library Service
Area
Law Enf.
Service Area
Fire Rescue
Service Area

DRAFT
APPENDIX B Public Education Facilities Impact Fee –
Supplemental Information

DRAFT
Tindale Oliver Palm Beach County September 2015 B-1 Impact Fee Update Study
Public Education Facilities Supplemental Information This appendix presents the inventory of traditional schools in Palm Beach County as well as
an explanation of building and land value estimates used in the impact fee calculations.
School District Inventory
The current inventory of traditional and alternative schools in Palm Beach County that are
owned by the Palm Beach County School District is presented in Table B-1.

DRAFT
Tindale Oliver Palm Beach County September 2015 B-2 Impact Fee Update Study
Table B-1 Palm Beach County School District Existing School Inventory
Number SchoolsYear
AcquiredGrade
FISH Permanent
Net Square Footage
Permanent Student
Stations
Permanent
Capacity
1 Acreage Pines Elementary 1987 KG-5 85,958 553 553
2 Addison Mizner Elementary 1966 PK-5 68,003 528 528
3 Allamanda Elementary 1963 KG-5 130,872 720 720
4 Banyan Creek Elementary 1986 PK-5 141,298 1,136 1136
5 Barton Elementary 1956 KG-5 154,476 1,400 1400
6 Beacon Cove Intermediate Bessie Dubois Campus 2000 KG-5 111,271 857 857
7 Belle Glade Elementary 1968 PK-5 119,752 978 978
8 Belvedere Elementary 1941 KG-5 90,837 586 586
9 Benoist Farms Elementary 2001 KG-5 117,508 856 856
10 Berkshire Elementary 1958 KG-5 138,137 1,229 1229
11 Binks Forest Elementary 1999 PK-5 101,924 774 774
12 Boca Raton Elementary 1937 PK-5 67,630 401 401
13 Calusa Elementary 1986 PK-5 91,416 584 584
14 Cholee Lake Elementary 2000 PK-5 109,967 766 766
15 Citrus Cove Elementary 1987 KG-5 131,689 1,227 1227
16 Clifford O Taylor/Kirklane Elementary 1969 KG-5 171,432 1,439 1439
17 Coral Reef Elementary 1999 KG-5 132,405 1,162 1162
18 Coral Sunset Elementary 1984 KG-5 129,391 990 990
19 Crosspointe Elementary 2000 KG-5 103,952 738 738
20 Crystal Lakes Elementary 1986 KG-5 103,946 890 890
21 Cypress Trails Elementary 1987 KG-5 80,457 659 659
22 Del Prado Elementary 1987 PK-5 78,438 605 605
23 Diamond View Elementary 2002 KG-5 127,491 750 750
24 Discovery Key Elementary 1983 PK-5 109,097 738 738
25 Dr Mary Mcleod Bethune Elementary 1998 KG-5 117,962 806 806
26 Dwight D Eisenhower Elementary 1969 KG-5 207,034 1,522 1522
27 Egret Lake Elementary 1991 KG-5 93,785 583 583
28 Elbridge Gale Elementary 2004 PK-5 125,858 1,038 1038
29 Equestrian Trails Elementary 2002 PK-5 119,703 766 766
30 Everglades Elementary School (03-W) 2007 PK-5 119,246 942 942
31 Forest Hill Elementary 1961 PK-5 101,926 754 754
32 Forest Park Elementary 1955 KG-5 122,127 780 780
33 Freedom Shores Elementary 1966 KG-5 112,589 806 806
34 Frontier Elementary 2000 KG-5 108,101 738 738
35 Galaxy Elementary 1957 KG-5 143,992 761 761
36 Glade View Elementary 1964 PK-5 72,447 580 580
37 Gold Coast Community School 1957 KG-12 77,878 585 585
38 Golden Grove Elementary 1996 KG-5 106,750 749 749
39 Gove Elementary 2011 CA CA 116,174 924 924
40 Grassy Waters Elementary 2001 KG-5 113,990 785 785
41 Greenacres Elementary 1926 KG-5 84,903 498 498
42 Grove Park Elementary 1965 KG-5 80,844 702 702
43 H L Johnson Elementary 1982 KG-5 138,266 1,000 1000
44 Hagen Road Elementary 2006 KG-5 123,115 849 849
45 Hammock Pointe Elementary 1989 PK-5 141,603 980 980
46 Heritage Elementary 1999 KG-5 115,928 738 738
47 Hidden Oaks Elementary 2003 KG-5 129,081 978 978
48 Highland Elementary 1949 KG-5 138,103 1,072 1072
49 Hope Centennial Elementary (06-D) 2006 KG-5 123,111 952 952
50 Indian Pines Elementary 1987 KG-5 136,265 1,158 1158
51 Indian Ridge School 1994 KG-12 76,691 269 269
52 J C Mitchell Elementary 1957 KG-5 137,995 1,032 1032
53 Jerry Thomas Elementary 1979 KG-5 130,805 1,100 1100
54 Jupiter Elementary 1925 KG-5 119,071 820 820
55 Jupiter Farms Elementary 1988 KG-5 87,508 587 587
56 K E Cunningham/Canal Point Elementary 1984 PK-5 80,168 707 707
57 Lake Park Elementary 1923 KG-5 74,620 411 411
58 Lantana Elementary 1930 KG-5 95,745 599 599
59 Liberty Park Elementary 1987 PK-5 135,187 981 981
60 Lighthouse Elementary 1987 KG-5 77,895 679 679
61 Limestone Creek Elementary 1987 KG-5 128,426 1,022 1022
62 Lincoln Elementary 1954 KG-5 163,261 968 968
63 Loxahatchee Groves Elementary 1986 KG-5 94,688 564 564
64 Manatee Elementary 1989 PK-5 160,500 1,441 1441
65 Marsh Pointe Elementary (03-X) 2002 KG-5 115,984 1,022 1022
66 Meadow Park Elementary 1954 KG-5 113,725 672 672
67 Melaleuca Elementary 1966 KG-5 69,491 658 658
68 Morikami Park Elementary 1986 PK-5 104,397 772 772
69 New Horizons Elementary 1988 KG-5 81,822 623 623
70 North Grade Elementary 1927 KG-5 102,866 586 586
71 North Palm Beach Elementary 1958 KG-5 32,248 239 239
72 Northboro Elementary 1889 KG-5 125,775 970 970
73 Northmore Elementary 1949 KG-5 95,673 637 637
74 Orchard View Elementary 1994 PK-5 111,201 764 764
75 Pahokee Elementary 1957 KG-5 81,140 671 671
76 Palm Beach Gardens Elementary 1962 KG-5 111,459 739 739
77 Palm Beach Public School 1921 KG-5 68,595 393 393
78 Palm Springs Elementary 1958 KG-5 121,160 760 760
Elementary Schools

DRAFT
Tindale Oliver Palm Beach County September 2015 B-3 Impact Fee Update Study
Table B-1 (Continued) Palm Beach County School District Existing School Inventory
Number SchoolsYear
AcquiredGrade
FISH Permanent
Net Square Footage
Permanent Student
Stations
Permanent
Capacity
79 Palmetto Elementary 1926 KG-5 124,584 882 882
80 Panther Run Elementary 1988 KG-5 130,092 978 978
81 Pierce Hammock Elementary 2003 KG-5 120,813 790 790
82 Pine Grove Elementary 1957 PK-5 83,331 654 654
83 Pine Jog Elementary (03-Y) 2006 PK-5 125,990 974 974
84 Pioneer Park Elementary 1990 KG-5 102,411 800 800
85 Pleasant City Elementary 2000 KG-5 69,462 386 386
86 Plumosa Elementary School Of The Arts 1949 KG-5 169,344 711 711
87 Poinciana Elementary 1925 KG-5 96,907 685 685
88 Rolling Green Elementary 1957 KG-5 146,744 1,109 1109
89 Roosevelt Elementary 1954 KG-5 117,695 801 801
90 Royal Palm Beach Elementary 2001 KG-5 104,677 774 774
91 Royal Palm School 1977 PK-12 147,481 623 623
92 S D Spady Elementary 1994 KG-5 91,371 697 697
93 Sandpiper Shores Elementary 1986 KG-5 86,974 592 592
94 Seminole Trails Elementary 1979 KG-5 137,032 1,066 1066
95 South Grade Elementary 1924 KG-5 93,653 607 607
96 South Olive Elementary 1954 KG-5 95,382 601 601
97 Starlight Cove Elementary 1994 KG-5 128,790 1,086 1086
98 Sunrise Park Elementary 1998 KG-5 109,029 738 738
99 Sunset Palms Elementary (03-Z) 2004 KG-5 127,106 978 978
100 Timber Trace Elementary 1990 KG-5 85,671 569 569
101 Turning Points Academy 1994 KG-12 71,047 820 820
102 U B Kinsey/Palmview Elementary 1929 KG-5 102,657 664 664
103 Verde Elementary 1975 PK-5 90,181 571 571
104 Village Academy 1957 KG-12 176,884 1,203 1203
105 Washington Elementary 1963 KG-5 70,005 484 484
106 Waters Edge Elementary 1994 KG-5 106,191 746 746
107 Wellington Elementary 1980 KG-5 118,684 1,022 1022
108 West Gate Elementary 1925 KG-5 108,199 734 734
109 West Riviera Elementary 1964 KG-5 82,391 729 729
110 Westward Elementary 1960 KG-5 119,796 890 890
111 Whispering Pines Elementary 1983 PK-5 112,711 642 642
112 Wynnebrook Elementary 1965 KG-5 72,743 573 573
Subtotal - Elementary Schools 12,392,252 89,477 89,477
1 Bak Middle School Of The Arts 1965 6-8 223,324 1,483 1,335
2 Bear Lakes Middle 1986 6-8 180,507 1,591 1,432
3 Boca Raton Community Middle 1966 6-8 195,394 1,574 1,417
4 Carver Community Middle 1986 6-8 168,564 1,704 1,534
5 Christa Mcauliffe Middle 1984 6-8 143,553 1,149 1,034
6 Congress Middle 1975 6-8 192,959 1,591 1,432
7 Conniston Community Middle 1927 6-8 172,808 1,307 1,176
8 Crestwood Middle 1980 6-8 133,423 1,045 941
9 Don Estridge High Tech Middle 2002 6-8 182,994 1,327 1,194
10 Eagles Landing Middle 1997 6-8 142,044 1,231 1,108
11 Emerald Cove Middle (02-Jj) 2004 6-8 201,305 1,565 1,409
12 Howell L Watkins Middle 1961 6-8 188,224 1,281 1,153
13 Independence Middle 2000 6-8 171,018 1,362 1,226
14 Jeaga Middle 2001 6-8 172,396 1,207 1,086
15 John F Kennedy Middle 1962 6-8 188,925 1,671 1,504
16 Jupiter Middle 1960 6-8 155,685 1,228 1,105
17 L.C. Swain Middle 2003 6-8 192,805 1,621 1,459
18 Lake Shore Middle 1944 6-8 201,618 1,466 1,319
19 Lake Worth Middle 1988 6-8 172,515 1,580 1,422
20 Lantana Community Middle 1963 6-8 149,001 901 811
21 Loggers Run Middle 1981 6-8 120,203 1,073 966
22 Odyssey Middle 1999 6-8 175,341 1,369 1,232
23 Okeeheelee Middle 1995 6-8 178,042 1,793 1,614
24 Omni Middle 1987 6-8 150,645 1,199 1,079
25 Osceola Creek Middle 2002 6-8 170,721 1,194 1,075
26 Palm Springs Community Middle 1960 6-8 212,472 1,893 1,704
27 Polo Park Middle 1966 6-8 176,031 1,326 1,193
28 Roosevelt Community Middle 1994 6-8 209,934 1,653 1,488
29 Tradewinds Middle 2002 6-8 192,066 1,383 1,245
30 Watson B Duncan Middle 1989 6-8 143,833 1,223 1,101
31 Wellington Landings Middle 1980 6-8 140,286 1,119 1,007
32 Western Pines Middle 1996 6-8 143,361 1,171 1,054
33 Woodlands Middle 1985 6-8 176,975 1,348 1,213
Subtotal - Middle Schools 5,718,972 45,628 41,068
1 Alexander W Dreyfoos Jr School Of The Arts 1907 9-12 248,348 1,353 1,285
2 Atlantic Community High 2002 9-12 404,920 2,423 2,302
3 Boca Raton Community High 1961 9-12 353,579 3,082 2,928
4 Boynton Beach Community High 1994 9-12 348,393 2,313 2,197
5 Forest Hill Community High 1957 9-12 312,415 1,934 1,837
6 Glades Central Community High 1992 9-12 245,163 1,655 1,572
7 John I Leonard Senior High 1964 9-12 381,773 3,056 2,903
Elementary Schools
Middle Schools
High Schools
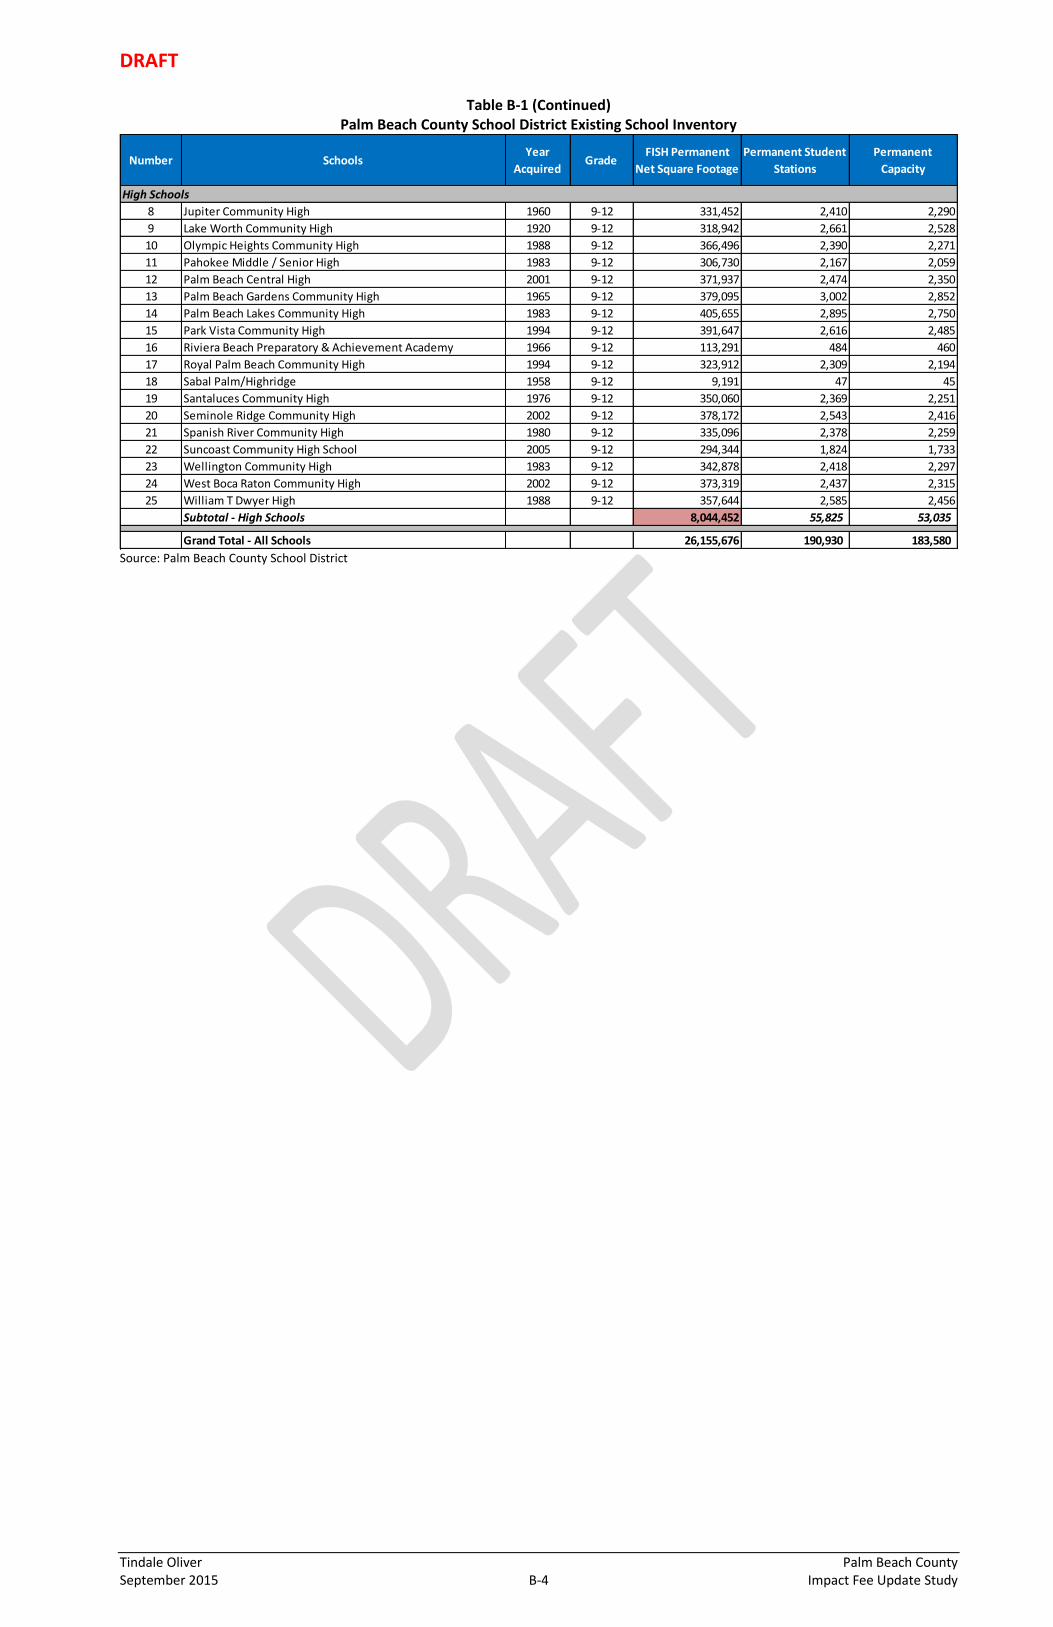
DRAFT
Tindale Oliver Palm Beach County September 2015 B-4 Impact Fee Update Study
Table B-1 (Continued) Palm Beach County School District Existing School Inventory
Source: Palm Beach County School District
Number SchoolsYear
AcquiredGrade
FISH Permanent
Net Square Footage
Permanent Student
Stations
Permanent
Capacity
8 Jupiter Community High 1960 9-12 331,452 2,410 2,290
9 Lake Worth Community High 1920 9-12 318,942 2,661 2,528
10 Olympic Heights Community High 1988 9-12 366,496 2,390 2,271
11 Pahokee Middle / Senior High 1983 9-12 306,730 2,167 2,059
12 Palm Beach Central High 2001 9-12 371,937 2,474 2,350
13 Palm Beach Gardens Community High 1965 9-12 379,095 3,002 2,852
14 Palm Beach Lakes Community High 1983 9-12 405,655 2,895 2,750
15 Park Vista Community High 1994 9-12 391,647 2,616 2,485
16 Riviera Beach Preparatory & Achievement Academy 1966 9-12 113,291 484 460
17 Royal Palm Beach Community High 1994 9-12 323,912 2,309 2,194
18 Sabal Palm/Highridge 1958 9-12 9,191 47 45
19 Santaluces Community High 1976 9-12 350,060 2,369 2,251
20 Seminole Ridge Community High 2002 9-12 378,172 2,543 2,416
21 Spanish River Community High 1980 9-12 335,096 2,378 2,259
22 Suncoast Community High School 2005 9-12 294,344 1,824 1,733
23 Wellington Community High 1983 9-12 342,878 2,418 2,297
24 West Boca Raton Community High 2002 9-12 373,319 2,437 2,315
25 William T Dwyer High 1988 9-12 357,644 2,585 2,456
Subtotal - High Schools 8,044,452 55,825 53,035
Grand Total - All Schools 26,155,676 190,930 183,580
High Schools

DRAFT
Tindale Oliver Palm Beach County September 2015 B-5 Impact Fee Update Study
Building Cost Analysis
To determine the architectural, design, site improvement, construction, and FF&E costs
associated with building a new school in Palm Beach County, the following information was
evaluated:
Recently built schools in Palm Beach County;
Cost estimates included in the Educational Plant Survey;
Insurance values of the existing schools;
School cost information for over 100 schools in other Florida counties; and
Discussions with the District’s Division of Support Operations.
The following paragraphs provide further detail on this research and analysis.
Construction Cost
Most recent construction of new schools in Palm Beach County included the construction of
Everglades Elementary in 2007, Hope Centennial Elementary in 2007 through 2009, and
Pahokee Area Middle School between 2006 and 2010. In addition, several modernization
projects were completed over the past eight to ten years. The construction cost associated
with these schools ranged from $145 per net square foot for the elementary school to $255
per net square foot for the high school, as shown in Table B-2. In addition, the District’s Five-
Year Plan and Educational Plant Survey include several school expansion/renovation projects.
The estimated cost associated with these expansions ranges from $225 per net square foot
to $320 per net square foot. These figures are on the high end of the range of construction
costs observed in other jurisdictions, reflecting the higher costs encountered in Palm Beach
County. This is partially due to the active building market in the county, which results in
higher prices and the lack of ability to negotiate due to hard-bids. Other factors affecting the
school construction costs in Palm Beach County include the requirements for LEED standards,
specifications for durable construction, and integration of Energy Management System to
minimize operating expenses in the long-term.
Finally, the insurance values of existing school buildings range from approximately $190 per
net square foot for elementary schools to $215 per net square foot for high schools, with an
average of $200 per net square foot for all traditional schools. It is important to note
insurance values do not include the full cost of constructing a school since certain

DRAFT
Tindale Oliver Palm Beach County September 2015 B-6 Impact Fee Update Study
components of a building, such as the foundation, are excluded from these values. As such,
insurance values are considered to be a conservative estimate.
Table B-3 summarizes data obtained from the Florida Department of Education for schools
built in 2011 and 2013. As shown, the average construction cost is approximately $165 per
net square foot, with a range of $140 per net square foot for elementary schools to $180 per
net square foot for high schools.
Given this data and information, average construction costs of $190 per net square foot for
elementary schools, $200 per net square foot for middle schools, and $225 per net square
foot for high schools are used in this study, which reflect the local cost factors related to
design characteristics of Palm Beach County schools.

DRAFT
Tindale Oliver Palm Beach County September 2015 B-7 Impact Fee Update Study
Table B-2 Construction Cost Analysis – Palm Beach County
(1), (2), (3), (4), (6), (7), (8) Source: Palm Beach County School District (5) Construction cost divided by net permanent square feet
Year Built(1)
Facility Name(2) Construction
Cost(3)
Net Permanent
Square Feet(4)
Constrution Cost
per NSF(5)
2007 Everglades Elementary $18,272,709 124,124 $147
2006-2010 Hope Centennial Elementary $24,021,666 132,754 $181
2006-2010 Pahokee Middle School $29,997,619 117,239 $256
Modernization Cost per Net Square Foot(6) $100 - $250
Educational Plant Survey Estimates for School Additions(7)
$225 - $320
$190
$200
$215
$200
$190
$225
$250 - High Schools
New School Construction:
Estimates Used in the Study:
- Elementary Schools
- Middle Schools
- Elementary Schools
- Middle Schools
- High Schools
- All Traditional Schools
Insurance Values of Existing School Buildings:(8)

DRAFT
Tindale Oliver Palm Beach County September 2015 B-8 Impact Fee Update Study
Table B-3 Construction Cost Analysis – Other Florida Jurisdictions
Source: PBC School District for PBC Schools; Florida Department of Education for all other jurisdictions
Architectural, Design, Site Preparation, Furniture, Fixture and Equipment Costs
The architectural, design, site preparation (including on-site improvement and traffic control
costs), and FF&E costs (including technology) are calculated based on the ratio of these costs
to the construction costs observed in Palm Beach County and other jurisdictions. These
figures were also discussed with the District representatives and are estimated at 18 percent
of construction for architectural/ design and site preparation costs, and 4 percent for FF&E
Year Built County Facility Name/TypeConstruction
CostTotal Cost Net Sq. Ft.
Construction
Cost per
Net SF
2011 Charlotte Meadow Park Elementary $12,696,116 $18,415,280 89,652 $142
2011 Duval Waterleaf Elementary $14,882,021 $24,786,442 82,062 $181
2011 Escambia Global Learning Academy $17,019,155 $24,108,501 120,015 $142
2011 Osceola Highlands Elementary $14,534,309 $18,145,244 106,918 $136
2011 Pasco Connerton Elementary "R" $11,598,590 $19,102,688 84,972 $136
2012 Alachua Meadowbrook Elementary $12,388,973 $19,444,444 97,000 $128
2012 Indian River Vero Beach Elementary $17,243,103 $21,533,893 110,495 $156
2012 Lee Tortuga Preserve $16,021,554 $23,456,732 129,936 $123
2012 Orange SunRidge Elementary $10,031,097 $14,162,606 66,645 $151
2012 St. Johns Palencia Elementary $12,677,682 $15,290,832 102,314 $124
2012 Volusia Citrus Grove Elementary $13,854,183 $19,661,608 98,842 $140
2013 Marion Legacy Elementary $14,047,310 $18,245,314 104,324 $135
2013 Orange Sun Blaze Elementary $10,269,207 $12,707,954 64,410 $159
2013 Orange Hackney Prairies Road Area Elementary $11,261,094 $14,797,447 75,189 $150
2013 Palm Beach Galaxy Elementary $22,515,045 $30,714,055 108,674 $207
2013 Palm Beach Gove Elementary $28,528,459 $38,416,048 129,500 $220
Total/Weighted Average -- Elementary Schools $239,567,898 $332,989,088 1,570,948 $152
Total/Weighted Average -- Elementary Schools (excluding Palm Beach County Schools) $188,524,394 $263,858,985 1,332,774 $141
Middle Schools
2011 Dade North Dade Middle $18,921,534 $21,216,883 94,660 $200
2011 Orange Lake Nona Middle $16,923,455 $23,466,083 149,897 $113
2011 Polk Boone Middle $17,900,963 $20,312,468 69,921 $256
2011 Walton Emerald Coast Middle $15,918,884 $25,134,830 126,770 $126
2012 Collier Bethune Education Center $5,538,155 $7,813,329 34,851 $159
2012 Dade North Dade Middle and North Dade Center for Modern Languages $18,921,534 $21,216,883 94,660 $200
2012 Lee Hams Marsh Middle $23,750,925 $30,653,842 164,662 $144
2012 Orange Sunridge Middle $23,617,116 $30,375,846 152,436 $155
2013 Monroe Horace O'Bryant $30,596,297 $38,366,941 196,598 $156
Total/Weighted Average -- Middle Schools $172,088,863 $218,557,105 1,084,455 $159
High Schools
2011 Broward Lanier James Education Center $8,889,147 $12,412,686 42,608 $209
2011 Calhoun Blountstown High $19,407,910 $25,135,928 100,366 $193
2011 Charlotte Charlotte High $61,755,842 $92,390,747 258,700 $239
2011 Dade International Studies SHS $7,192,325 $21,846,054 35,137 $205
2011 Dade Medical Academy or Science and Technology $9,303,705 $18,811,197 78,845 $118
2011 Okeechobee Okeechobee Achievement Academy $5,499,975 $6,696,931 43,024 $128
2011 Polk Auburndale Senior $19,522,053 $24,482,933 101,466 $192
2011 Polk Davenport School of the Arts $29,136,512 $32,548,129 157,446 $185
2011 Polk Kathleen Senior $24,323,662 $27,493,666 112,017 $217
2011 Polk Winter Haven Senior $26,374,234 $29,588,106 140,940 $187
2012 Dade International Studies SHS $7,192,325 $21,846,054 35,137 $205
2012 Dade Medical Academy or Science and Technology $9,303,705 $18,811,197 78,845 $118
2012 Orange Evans High $55,507,691 $81,091,877 289,061 $192
2012 St. Lucie Lincoln Park Academy $10,928,736 $24,423,402 93,703 $117
2013 Lake Lake Minneola High $46,974,201 $57,354,621 294,664 $159
2013 Martin Martin County High $7,623,316 $9,854,403 63,601 $120
Total/Weighted Average -- High Schools $348,935,339 $504,787,931 1,925,560 $181
$760,592,100 $1,056,334,124 4,580,963 $166
$709,548,596 $987,204,021 4,342,789 $163
Elementary Schools
Total/Weighted Average (All Schools)
Total/Weighted Average (All Schools, Excluding Palm Beach County Schools)
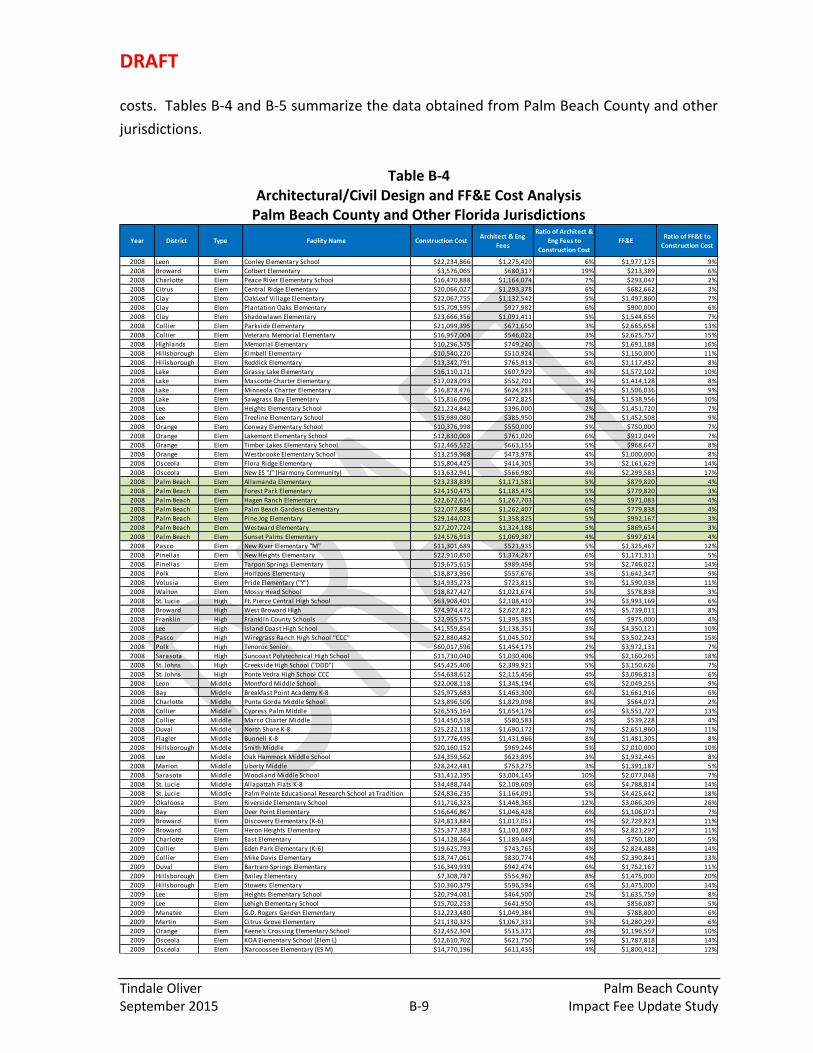
DRAFT
Tindale Oliver Palm Beach County September 2015 B-9 Impact Fee Update Study
costs. Tables B-4 and B-5 summarize the data obtained from Palm Beach County and other
jurisdictions.
Table B-4 Architectural/Civil Design and FF&E Cost Analysis
Palm Beach County and Other Florida Jurisdictions
Year District Type Facility Name Construction CostArchitect & Eng
Fees
Ratio of Architect &
Eng Fees to
Construction Cost
FF&ERatio of FF&E to
Construction Cost
2008 Leon Elem Conley Elementary School $22,234,866 $1,275,420 6% $1,977,175 9%
2008 Broward Elem Colbert Elementary $3,576,065 $680,317 19% $213,389 6%
2008 Charlotte Elem Peace River Elementary School $16,470,888 $1,164,074 7% $293,047 2%
2008 Citrus Elem Central Ridge Elementary $20,066,027 $1,293,378 6% $682,662 3%
2008 Clay Elem OakLeaf Vil lage Elementary $22,067,755 $1,132,542 5% $1,497,860 7%
2008 Clay Elem Plantation Oaks Elementary $15,709,595 $927,982 6% $900,000 6%
2008 Clay Elem Shadowlawn Elementary $23,666,356 $1,091,411 5% $1,544,656 7%
2008 Collier Elem Parkside Elementary $21,099,395 $671,650 3% $2,665,658 13%
2008 Collier Elem Veterans Memorial Elementary $16,957,004 $546,022 3% $2,625,757 15%
2008 Highlands Elem Memorial Elementary $10,296,575 $749,240 7% $1,691,188 16%
2008 Hillsborough Elem Kimbell Elementary $10,540,220 $510,924 5% $1,150,000 11%
2008 Hillsborough Elem Reddick Elementary $13,342,791 $765,913 6% $1,117,452 8%
2008 Lake Elem Grassy Lake Elementary $16,110,171 $607,929 4% $1,572,102 10%
2008 Lake Elem Mascotte Charter Elementary $17,028,093 $552,701 3% $1,414,128 8%
2008 Lake Elem Minneola Charter Elementary $16,878,476 $624,283 4% $1,506,036 9%
2008 Lake Elem Sawgrass Bay Elementary $15,816,096 $472,825 3% $1,538,956 10%
2008 Lee Elem Heights Elementary School $21,224,842 $396,000 2% $1,451,720 7%
2008 Lee Elem Treeline Elementary School $15,989,080 $385,950 2% $1,452,508 9%
2008 Orange Elem Conway Elementary School $10,376,998 $550,000 5% $750,000 7%
2008 Orange Elem Lakemont Elementary School $12,830,008 $761,020 6% $912,049 7%
2008 Orange Elem Timber Lakes Elementary School $12,465,522 $663,155 5% $968,647 8%
2008 Orange Elem Westbrooke Elementary School $13,259,968 $473,978 4% $1,000,000 8%
2008 Osceola Elem Flora Ridge Elementary $15,804,425 $414,305 3% $2,161,629 14%
2008 Osceola Elem New ES "J" (Harmony Community) $13,632,941 $566,980 4% $2,299,583 17%
2008 Palm Beach Elem Allamanda Elementary $23,238,839 $1,171,581 5% $879,820 4%
2008 Palm Beach Elem Forest Park Elementary $24,150,475 $1,185,476 5% $779,820 3%
2008 Palm Beach Elem Hagen Ranch Elementary $22,672,614 $1,267,703 6% $971,083 4%
2008 Palm Beach Elem Palm Beach Gardens Elementary $22,077,886 $1,262,407 6% $779,838 4%
2008 Palm Beach Elem Pine Jog Elementary $29,144,023 $1,358,825 5% $992,167 3%
2008 Palm Beach Elem Westward Elementary $27,207,724 $1,324,188 5% $869,654 3%
2008 Palm Beach Elem Sunset Palms Elementary $24,576,913 $1,069,387 4% $997,614 4%
2008 Pasco Elem New River Elementary "M" $11,301,689 $521,935 5% $1,325,467 12%
2008 Pinellas Elem New Heights Elementary $22,910,850 $1,374,287 6% $1,171,311 5%
2008 Pinellas Elem Tarpon Springs Elementary $19,675,615 $989,498 5% $2,746,022 14%
2008 Polk Elem Horizons Elementary $18,873,956 $557,676 3% $1,642,347 9%
2008 Volusia Elem Pride Elementary ("Y") $14,935,273 $723,815 5% $1,590,038 11%
2008 Walton Elem Mossy Head School $18,827,427 $1,021,674 5% $578,838 3%
2008 St. Lucie High Ft. Pierce Central High School $63,908,401 $2,108,410 3% $3,993,169 6%
2008 Broward High West Broward High $74,974,472 $2,627,821 4% $5,739,011 8%
2008 Franklin High Franklin County Schools $22,955,575 $1,395,385 6% $975,000 4%
2008 Lee High Island Coast High School $41,559,854 $1,138,351 3% $4,350,121 10%
2008 Pasco High Wiregrass Ranch High School "CCC" $22,880,482 $1,045,502 5% $3,502,243 15%
2008 Polk High Tenoroc Senior $60,017,596 $1,454,175 2% $3,972,131 7%
2008 Sarasota High Suncoast Polytechnical High School $11,730,040 $1,030,406 9% $2,160,265 18%
2008 St. Johns High Creekside High School ("DDD") $45,425,406 $2,399,921 5% $3,150,626 7%
2008 St. Johns High Ponte Vedra High School CCC $54,638,612 $2,115,456 4% $3,096,813 6%
2008 Leon Middle Montford Middle School $22,008,118 $1,345,194 6% $2,049,255 9%
2008 Bay Middle Breakfast Point Academy K-8 $25,975,683 $1,463,300 6% $1,661,916 6%
2008 Charlotte Middle Punta Gorda Middle School $23,896,506 $1,829,098 8% $564,072 2%
2008 Collier Middle Cypress Palm Middle $26,535,164 $1,654,176 6% $3,551,727 13%
2008 Collier Middle Marco Charter Middle $14,450,518 $580,583 4% $539,228 4%
2008 Duval Middle North Shore K-8 $25,222,118 $1,690,172 7% $2,651,960 11%
2008 Flagler Middle Bunnell K-8 $17,776,495 $1,431,966 8% $1,481,305 8%
2008 Hillsborough Middle Smith Middle $20,160,152 $969,246 5% $2,010,000 10%
2008 Lee Middle Oak Hammock Middle School $24,359,562 $623,895 3% $1,932,445 8%
2008 Marion Middle Liberty Middle $28,242,481 $753,275 3% $1,391,187 5%
2008 Sarasota Middle Woodland Middle School $31,412,195 $3,004,145 10% $2,077,048 7%
2008 St. Lucie Middle Allapattah Flats K-8 $34,488,744 $2,109,609 6% $4,788,814 14%
2008 St. Lucie Middle Palm Pointe Educational Research School at Tradition $24,836,235 $1,164,091 5% $4,425,642 18%
2009 Okaloosa Elem Riverside Elementary School $11,716,323 $1,448,365 12% $3,066,309 26%
2009 Bay Elem Deer Point Elementary $16,646,867 $1,046,428 6% $1,106,071 7%
2009 Broward Elem Discovery Elementary (K-6) $24,813,884 $1,017,051 4% $2,729,823 11%
2009 Broward Elem Heron Heights Elementary $25,377,383 $1,101,087 4% $2,821,297 11%
2009 Charlotte Elem East Elementary $14,128,364 $1,189,449 8% $750,180 5%
2009 Collier Elem Eden Park Elementary (K-6) $19,625,793 $743,765 4% $2,824,488 14%
2009 Collier Elem Mike Davis Elementary $18,747,061 $830,774 4% $2,390,841 13%
2009 Duval Elem Bartram Springs Elementary $16,349,939 $942,474 6% $1,752,167 11%
2009 Hillsborough Elem Bailey Elementary $7,308,787 $554,962 8% $1,475,000 20%
2009 Hillsborough Elem Stowers Elementary $10,360,379 $596,594 6% $1,475,000 14%
2009 Lee Elem Heights Elementary School $20,794,081 $464,500 2% $1,635,759 8%
2009 Lee Elem Lehigh Elementary School $15,702,253 $641,950 4% $856,087 5%
2009 Manatee Elem G.D. Rogers Garden Elementary $12,223,480 $1,049,384 9% $788,800 6%
2009 Martin Elem Citrus Grove Elementary $21,130,325 $1,067,331 5% $1,280,297 6%
2009 Orange Elem Keene's Crossing Elementary School $12,452,304 $515,371 4% $1,196,557 10%
2009 Osceola Elem KOA Elementary School (Elem L) $12,610,702 $621,750 5% $1,787,818 14%
2009 Osceola Elem Narcoossee Elementary (ES M) $14,770,196 $611,435 4% $1,800,412 12%

DRAFT
Tindale Oliver Palm Beach County September 2015 B-10 Impact Fee Update Study
Table B-4 (Continued) Architectural/Civil Design and FF&E Cost Analysis
Palm Beach County and Other Florida Jurisdictions
` Source: PBC School District for PBC Schools; Florida Department of Education for all other jurisdictions
Year District Type Facility NameConstruction
Cost
Architect & Eng
Fees
Ratio of Architect &
Eng Fees to
Construction Cost
FF&E
Ratio of FF&E
to Construction
Cost
2009 Palm Beach Elem C.O. Taylor/Kirklane Elementary $33,403,046 $1,864,969 6% $995,496 3%
2009 Palm Beach Elem Hope-Centennial Elementary $24,021,666 $1,984,792 8% $1,029,700 4%
2009 Polk Elem Spessard Holland Elementary $15,642,049 $572,492 4% $1,508,553 10%
2009 Sarasota Elem Atwater Elementary School $12,524,430 $1,802,665 14% $651,817 5%
2009 Volusia Elem Champion Elementary $14,696,164 $725,513 5% $950,364 6%
2009 Wakulla Elem Riversink Elementary $15,363,460 $817,426 5% $967,599 6%
2009 Washington Elem Vernon Elementary School $6,259,105 $492,392 8% $267,742 4%
2009 Brevard High Satellite High School $4,736,903 $225,000 5% $358,000 8%
2009 Brevard High Heritage High School $57,088,946 $2,328,706 4% $5,470,874 10%
2009 Hillsborough High Steinbrenner High School $38,437,165 $1,588,553 4% $4,945,000 13%
2009 Hillsborough High Strawberry Crest High School $43,204,430 $3,051,138 7% $4,945,000 11%
2009 Orange High East River High School $58,970,282 $1,860,628 3% $5,304,005 9%
2009 Orange High Lake Nona High School $60,857,702 $1,721,299 3% $5,217,696 9%
2009 Sarasota High Suncoast Polytechnical High School $11,730,040 $1,030,406 9% $2,160,265 18%
2009 Walton High Walton Senior High $35,764,000 $1,992,342 6% $645,000 2%
2009 Okaloosa Middle Shoal River Middle School $12,779,256 $1,297,594 10% $3,229,106 25%
2009 Duval Middle Westview K-8 $29,119,287 $2,600,719 9% $3,013,790 10%
2009 Hernando Middle Explorer K-8 $41,212,410 $1,748,584 4% $3,220,587 8%
2009 Hillsborough Middle Barrington Middle School $16,315,050 $961,428 6% $2,259,000 14%
2009 Indian River Middle Storm Grove Middle School $34,106,673 $2,205,007 6% $4,191,001 12%
2009 Lake Middle East Ridge Middle School $27,281,965 $1,283,420 5% $2,491,107 9%
2009 Osceola Middle Westside K-8 School $23,051,370 $1,363,350 6% $2,686,144 12%
2009 Sarasota Middle Woodland Middle School $31,412,195 $3,004,145 10% $2,077,048 7%
2009 St. Johns Middle Liberty Pines Academy (K-8) $25,277,687 $971,288 4% $1,197,445 5%
2010 Broward Elem Norcrest Elementary $22,286,245 $885,319 4% $1,257,845 6%
2010 Collier Elem Palmetto Elementary $20,224,743 $889,743 4% $2,671,470 13%
2010 Lake Elem Sorrento Elemenatry $15,842,160 $668,339 4% $1,896,206 12%
2010 Orange Elem Old Cheney/North Forsyth Elementary $12,096,899 $783,588 6% $987,926 8%
2010 Osceola Elem East Lake Elementary $11,747,305 $537,980 5% $1,885,002 16%
2010 Palm Beach Elem Everglades Elementary $18,272,709 $1,828,811 10% $1,071,745 6%
2010 Palm Beach Elem Northboro Elementary $25,556,083 $2,054,031 8% $779,741 3%
2010 Palm Beach Elem Plumosa Elementary $24,127,146 $2,101,474 9% $730,067 3%
2010 Seminole Elem New Midway Elementary $12,297,322 $810,700 7% $1,133,007 9%
2010 Clay High Oakleaf High $50,819,745 $2,562,240 5% $3,064,772 6%
2010 Duval High Atlantic Coast High $50,466,294 $5,220,136 10% $5,048,820 10%
2010 Hernando High Weeki Watchee High $33,006,787 $1,939,097 6% $4,719,813 14%
2010 Sarasota High Riverview High $78,561,000 $5,999,998 8% $4,377,536 6%
2010 Collier High Lorenzo Walker Institute of Technology High $9,843,413 $795,386 8% $1,312,405 13%
2010 Orange High Apopka HS Replacement $70,267,621 $2,112,349 3% $4,733,044 7%
2010 Palm Beach High Palm Beach Gardens Community High $88,425,828 $3,817,726 4% $3,331,487 4%
2010 Palm Beach High Suncoast High $72,435,808 $3,762,353 5% $2,273,221 3%
2010 Volusia High University High $72,990,143 $3,092,214 4% $6,096,162 8%
2011 Charlotte Elem Meadow Park Elementary $12,696,116 $944,273 7% $674,842 5%
2011 Duval Elem Waterleaf Elementary $14,882,021 $1,621,628 11% $1,899,236 13%
2011 Escambia Elem Global Learning Academy $17,019,155 $1,682,415 10% $2,861,931 17%
2011 Osceola Elem Highlands Elementary $14,534,309 $666,978 5% $1,650,318 11%
2011 Pasco Elem Connerton Elementary "R" $11,598,590 $858,671 7% $1,298,389 11%
2011 Calhoun High Blountstown High $19,407,910 $1,968,893 10% $994,719 5%
2011 Charlotte High Charlotte High $61,755,842 $6,502,129 11% $2,676,408 4%
2011 Broward High Lanier James Education Center $8,889,147 $1,075,459 12% $1,304,137 15%
2011 Dade High International Studies SHS $7,192,325 $684,965 10% $757,496 11%
2011 Dade High Medical Academy or Science and Technology $9,303,705 $762,932 8% $919,966 10%
2011 Okeechobee High Okeechobee Achievement Academy $5,499,975 $453,761 8% $427,114 8%
2011 Polk High Auburndale Senior $19,522,053 $1,462,146 7% $3,124,050 16%
2011 Polk High Davenport School of the Arts $29,136,512 $1,042,674 4% $2,330,971 8%
2011 Polk High Kathleen Senior $24,323,662 $875,094 4% $2,267,250 9%
2011 Polk High Winter Haven Senior $26,374,234 $853,483 3% $2,360,389 9%
2011 Dade Middle North Dade Middle $18,921,534 $867,900 5% $1,122,762 6%
2011 Hernando Middle Winding Waters K-8 $14,559,177 $880,709 6% $4,279,500 29%
2011 Orange Middle Lake Nona Middle $16,923,455 $1,277,253 8% $1,795,567 11%
2011 Polk Middle Boone Middle $17,900,963 $1,080,157 6% $1,331,348 7%
2011 Walton Middle Emerald Coast Middle $15,918,884 $1,709,689 11% $700,000 4%
2012 Alachua Elem Meadowbrook Elementary $12,388,973 $1,010,997 8% $1,974,896 16%
2012 Indian River Elem Vero Beach Elementary $17,243,103 $1,476,006 9% $1,342,512 8%
2012 Lee Elem Tortuga Preserve $16,021,554 $214,042 1% $1,487,461 9%
2012 Orange Elem SunRidge Elementary $10,031,097 $580,395 6% $951,358 9%
2012 St. Johns Elem Palencia Elementary $12,677,682 $956,170 8% $1,500,000 12%
2012 Volusia Elem Citrus Grove Elementary $13,854,183 $1,098,766 8% $1,555,729 11%
2012 Collier Middle Bethune Education Center $5,538,155 $561,233 10% $734,057 13%
2012 Dade Middle North Dade Middle $18,921,534 $867,900 5% $1,122,762 6%
2012 Lee Middle Hams Marsh Middle $23,750,925 $721,076 3% $1,814,273 8%
2012 Orange Middle SunRidge Middle $23,617,116 $1,137,698 5% $1,591,755 7%
2012 Dade High International Studies SHS $7,192,325 $684,965 10% $757,496 11%
2012 Dade High Medical Academy or Science and Technology $9,303,705 $762,932 8% $919,966 10%
2012 Orange High Evans High $55,507,691 $3,568,884 6% $3,743,130 7%
2012 St. Lucie High Lincoln Park Academy $10,928,736 $1,623,543 15% $3,246,193 30%
2013 Marion Elem Legacy Elementary $14,047,310 $675,267 5% $1,680,825 12%
2013 Orange Elem Sun Blaze Elementary $10,269,207 $587,445 6% $1,035,369 10%
2013 Orange Elem Hackney Prairies Road Area Elementary $11,261,094 $890,931 8% $1,057,127 9%
2013 Palm Beach Elem Galaxy Elementary $22,515,045 $1,595,664 7% $790,823 4%
2013 Palm Beach Elem Gove Elementary $28,528,459 $1,871,815 7% $917,852 3%
2013 Monroe Middle Horace O'Bryant $30,596,297 $3,221,414 11% $1,320,362 4%
2013 Lake High Lake Minneola High $46,974,201 $3,030,934 6% $6,483,383 14%
2013 Martin High Martin County High $7,623,316 $1,274,200 17% $419,893 6%
$3,786,923,780 $212,522,123 6% $316,887,327 8%
$510,354,264 $29,521,202 6% $18,190,128 4%
$3,276,569,516 $183,000,921 6% $298,697,199 9%
Total/Weighted Average
Total/Weighted Average (Palm Beach County Schools ONLY)
Total/Weighted Average (Excluding Palm Beach County Schools)
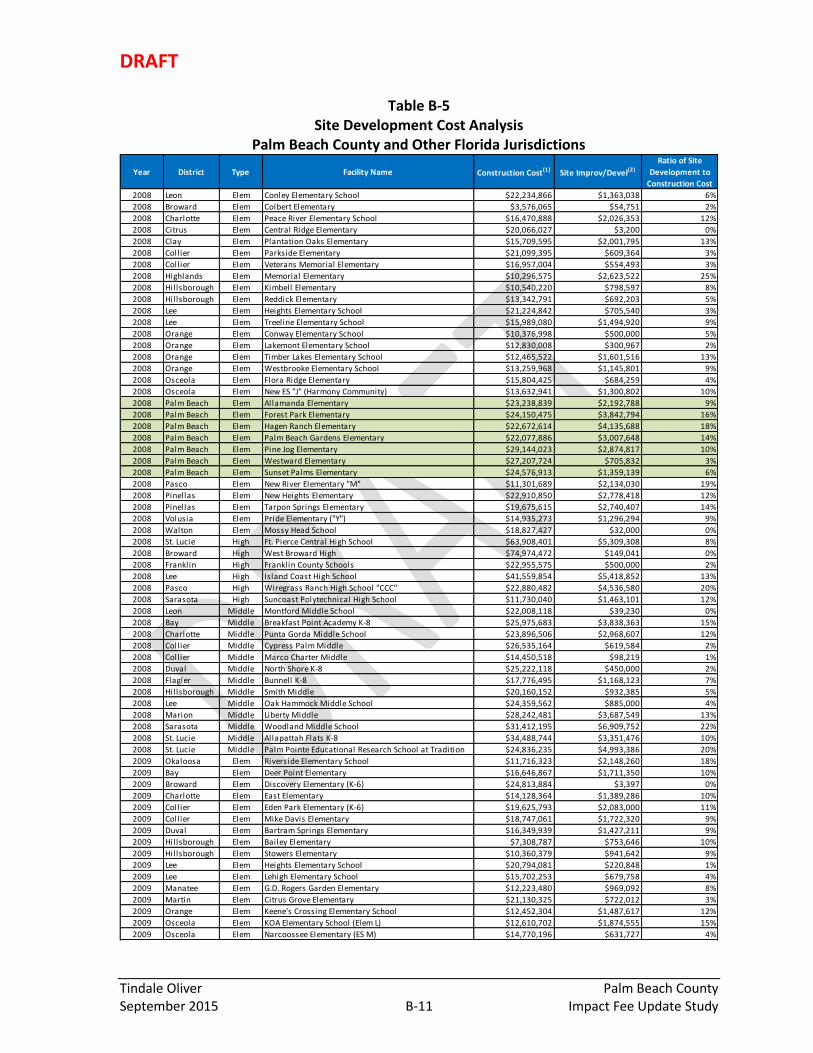
DRAFT
Tindale Oliver Palm Beach County September 2015 B-11 Impact Fee Update Study
Table B-5 Site Development Cost Analysis
Palm Beach County and Other Florida Jurisdictions
Year District Type Facility Name Construction Cost(1) Site Improv/Devel(2)
Ratio of Site
Development to
Construction Cost
2008 Leon Elem Conley Elementary School $22,234,866 $1,363,038 6%
2008 Broward Elem Colbert Elementary $3,576,065 $54,751 2%
2008 Charlotte Elem Peace River Elementary School $16,470,888 $2,026,353 12%
2008 Citrus Elem Central Ridge Elementary $20,066,027 $3,200 0%
2008 Clay Elem Plantation Oaks Elementary $15,709,595 $2,001,795 13%
2008 Collier Elem Parkside Elementary $21,099,395 $609,364 3%
2008 Collier Elem Veterans Memorial Elementary $16,957,004 $554,493 3%
2008 Highlands Elem Memorial Elementary $10,296,575 $2,623,522 25%
2008 Hillsborough Elem Kimbell Elementary $10,540,220 $798,597 8%
2008 Hillsborough Elem Reddick Elementary $13,342,791 $692,203 5%
2008 Lee Elem Heights Elementary School $21,224,842 $705,540 3%
2008 Lee Elem Treeline Elementary School $15,989,080 $1,494,920 9%
2008 Orange Elem Conway Elementary School $10,376,998 $500,000 5%
2008 Orange Elem Lakemont Elementary School $12,830,008 $300,967 2%
2008 Orange Elem Timber Lakes Elementary School $12,465,522 $1,601,516 13%
2008 Orange Elem Westbrooke Elementary School $13,259,968 $1,145,801 9%
2008 Osceola Elem Flora Ridge Elementary $15,804,425 $684,259 4%
2008 Osceola Elem New ES "J" (Harmony Community) $13,632,941 $1,300,802 10%
2008 Palm Beach Elem Allamanda Elementary $23,238,839 $2,192,788 9%
2008 Palm Beach Elem Forest Park Elementary $24,150,475 $3,842,794 16%
2008 Palm Beach Elem Hagen Ranch Elementary $22,672,614 $4,135,688 18%
2008 Palm Beach Elem Palm Beach Gardens Elementary $22,077,886 $3,007,648 14%
2008 Palm Beach Elem Pine Jog Elementary $29,144,023 $2,874,817 10%
2008 Palm Beach Elem Westward Elementary $27,207,724 $705,832 3%
2008 Palm Beach Elem Sunset Palms Elementary $24,576,913 $1,359,139 6%
2008 Pasco Elem New River Elementary "M" $11,301,689 $2,134,030 19%
2008 Pinellas Elem New Heights Elementary $22,910,850 $2,778,418 12%
2008 Pinellas Elem Tarpon Springs Elementary $19,675,615 $2,740,407 14%
2008 Volusia Elem Pride Elementary ("Y") $14,935,273 $1,296,294 9%
2008 Walton Elem Mossy Head School $18,827,427 $32,000 0%
2008 St. Lucie High Ft. Pierce Central High School $63,908,401 $5,309,308 8%
2008 Broward High West Broward High $74,974,472 $149,041 0%
2008 Franklin High Franklin County Schools $22,955,575 $500,000 2%
2008 Lee High Island Coast High School $41,559,854 $5,418,852 13%
2008 Pasco High Wiregrass Ranch High School "CCC" $22,880,482 $4,536,580 20%
2008 Sarasota High Suncoast Polytechnical High School $11,730,040 $1,463,101 12%
2008 Leon Middle Montford Middle School $22,008,118 $39,230 0%
2008 Bay Middle Breakfast Point Academy K-8 $25,975,683 $3,838,363 15%
2008 Charlotte Middle Punta Gorda Middle School $23,896,506 $2,968,607 12%
2008 Collier Middle Cypress Palm Middle $26,535,164 $619,584 2%
2008 Collier Middle Marco Charter Middle $14,450,518 $98,219 1%
2008 Duval Middle North Shore K-8 $25,222,118 $450,000 2%
2008 Flagler Middle Bunnell K-8 $17,776,495 $1,168,123 7%
2008 Hillsborough Middle Smith Middle $20,160,152 $932,385 5%
2008 Lee Middle Oak Hammock Middle School $24,359,562 $885,000 4%
2008 Marion Middle Liberty Middle $28,242,481 $3,687,549 13%
2008 Sarasota Middle Woodland Middle School $31,412,195 $6,909,752 22%
2008 St. Lucie Middle Allapattah Flats K-8 $34,488,744 $3,351,476 10%
2008 St. Lucie Middle Palm Pointe Educational Research School at Tradition $24,836,235 $4,993,386 20%
2009 Okaloosa Elem Riverside Elementary School $11,716,323 $2,148,260 18%
2009 Bay Elem Deer Point Elementary $16,646,867 $1,711,350 10%
2009 Broward Elem Discovery Elementary (K-6) $24,813,884 $3,397 0%
2009 Charlotte Elem East Elementary $14,128,364 $1,389,286 10%
2009 Collier Elem Eden Park Elementary (K-6) $19,625,793 $2,083,000 11%
2009 Collier Elem Mike Davis Elementary $18,747,061 $1,722,320 9%
2009 Duval Elem Bartram Springs Elementary $16,349,939 $1,427,211 9%
2009 Hillsborough Elem Bailey Elementary $7,308,787 $753,646 10%
2009 Hillsborough Elem Stowers Elementary $10,360,379 $941,642 9%
2009 Lee Elem Heights Elementary School $20,794,081 $220,848 1%
2009 Lee Elem Lehigh Elementary School $15,702,253 $679,758 4%
2009 Manatee Elem G.D. Rogers Garden Elementary $12,223,480 $969,092 8%
2009 Martin Elem Citrus Grove Elementary $21,130,325 $722,012 3%
2009 Orange Elem Keene's Crossing Elementary School $12,452,304 $1,487,617 12%
2009 Osceola Elem KOA Elementary School (Elem L) $12,610,702 $1,874,555 15%
2009 Osceola Elem Narcoossee Elementary (ES M) $14,770,196 $631,727 4%

DRAFT
Tindale Oliver Palm Beach County September 2015 B-12 Impact Fee Update Study
Table B-5 (Continued) Site Development Cost Analysis
Palm Beach County and Other Florida Jurisdictions
Year District Type Facility Name Construction Cost(1) Site Improv/Devel(2)
Ratio of Site
Development to
Construction Cost
2009 Palm Beach Elem C.O. Taylor/Kirklane Elementary $33,403,046 $3,628,916 11%
2009 Palm Beach Elem Hope-Centennial Elementary $24,021,666 $2,733,790 11%
2009 Sarasota Elem Atwater Elementary School $12,524,430 $4,737,875 38%
2009 Volusia Elem Champion Elementary $14,696,164 $1,615,729 11%
2009 Wakulla Elem Riversink Elementary $15,363,460 $1,300,000 8%
2009 Washington Elem Vernon Elementary School $6,259,105 $450,421 7%
2009 Brevard High Satellite High School $4,736,903 $307,888 6%
2009 Brevard High Heritage High School $57,088,946 $9,834,384 17%
2009 Hillsborough High Steinbrenner High School $38,437,165 $4,391,015 11%
2009 Hillsborough High Strawberry Crest High School $43,204,430 $3,443,506 8%
2009 Orange High East River High School $58,970,282 $10,333,793 18%
2009 Orange High Lake Nona High School $60,857,702 $7,186,702 12%
2009 Sarasota High Suncoast Polytechnical High School $11,730,040 $1,463,101 12%
2009 Walton High Walton Senior High $35,764,000 $50,000 0%
2009 Okaloosa Middle Shoal River Middle School $12,779,256 $2,170,119 17%
2009 Duval Middle Westview K-8 $29,119,287 $1,708,817 6%
2009 Hernando Middle Explorer K-8 $41,212,410 $1,200,000 3%
2009 Hillsborough Middle Barrington Middle School $16,315,050 $1,368,167 8%
2009 Indian River Middle Storm Grove Middle School $34,106,673 $6,629,160 19%
2009 Lake Middle East Ridge Middle School $27,281,965 $599,565 2%
2009 Osceola Middle Westside K-8 School $23,051,370 $2,162,558 9%
2009 Sarasota Middle Woodland Middle School $31,412,195 $6,909,752 22%
2010 Broward Elem Norcrest Elementary $22,286,245 $37,949 0%
2010 Collier Elem Palmetto Elementary $20,224,743 $2,440,985 12%
2010 Lake Elem Sorrento Elemenatry $15,842,160 $48,712 0%
2010 Orange Elem Old Cheney/North Forsyth Elementary $12,096,899 $1,815,172 15%
2010 Osceola Elem East Lake Elementary $11,747,305 $1,255,467 11%
2010 Palm Beach Elem Everglades Elementary $18,272,709 $2,286,725 13%
2010 Palm Beach Elem Northboro Elementary $25,556,083 $1,482,606 6%
2010 Palm Beach Elem Plumosa Elementary $24,127,146 $1,967,540 8%
2010 Clay High Oakleaf High $50,819,745 $274,000 1%
2010 Duval High Atlantic Coast High $50,466,294 $7,648,460 15%
2010 Sarasota High Riverview High $78,561,000 $14,665,000 19%
2010 Collier High Lorenzo Walker Institute of Technology High $9,843,413 $287,278 3%
2010 Orange High Apopka HS Replacement $70,267,621 $9,439,283 13%
2010 Palm Beach High Palm Beach Gardens Community High $88,425,828 $10,693,532 12%
2010 Palm Beach High Suncoast High $72,435,808 $9,785,603 14%
2010 Volusia High University High $72,990,143 $12,232,947 17%
2011 Charlotte Elem Meadow Park Elementary $12,696,116 $1,802,689 14%
2011 Duval Elem Waterleaf Elementary $14,882,021 $1,361,500 9%
2011 Escambia Elem Global Learning Academy $17,019,155 $200,000 1%
2011 Osceola Elem Highlands Elementary $14,534,309 $1,293,639 9%
2011 Pasco Elem Connerton Elementary "R" $11,598,590 $2,313,586 20%
2011 Calhoun High Blountstown High $19,407,910 $1,362,604 7%
2011 Charlotte High Charlotte High $61,755,842 $7,904,370 13%
2011 Broward High Lanier James Education Center $8,889,147 $918,943 10%
2011 Okeechobee High Okeechobee Achievement Academy $5,499,975 $1,300 0%
2011 Walton Middle Emerald Coast Middle $15,918,884 $1,717,116 11%
2012 Alachua Elem Meadowbrook Elementary $12,388,973 $86,278 1%
2012 Indian River Elem Vero Beach Elementary $17,243,103 $1,196,000 7%
2012 Lee Elem Tortuga Preserve $16,021,554 $1,367,613 9%
2012 Orange Elem SunRidge Elementary $10,031,097 $1,296,632 13%
2012 St. Johns Elem Palencia Elementary $12,677,682 $0 0%
2012 Volusia Elem Citrus Grove Elementary $13,854,183 $415,026 3%
2012 Collier Middle Bethune Education Center $5,538,155 $479,652 9%
2012 Dade Middle North Dade Middle $18,921,534 $0 0%
2012 Lee Middle Hams Marsh Middle $23,750,925 $2,100,258 9%
2012 Orange Middle SunRidge Middle $23,617,116 $1,051,252 4%
2012 Dade High International Studies SHS $7,192,325 $0 0%
2012 Dade High Medical Academy or Science and Technology $9,303,705 $0 0%
2012 Orange High Evans High $55,507,691 $2,151,931 4%
2012 St. Lucie High Lincoln Park Academy $10,928,736 $7,901,452 72%
2013 Marion Elem Legacy Elementary $14,047,310 $477,607 3%
2013 Orange Elem Sun Blaze Elementary $10,269,207 $658,487 6%
2013 Orange Elem Hackney Prairies Road Area Elementary $11,261,094 $657,635 6%
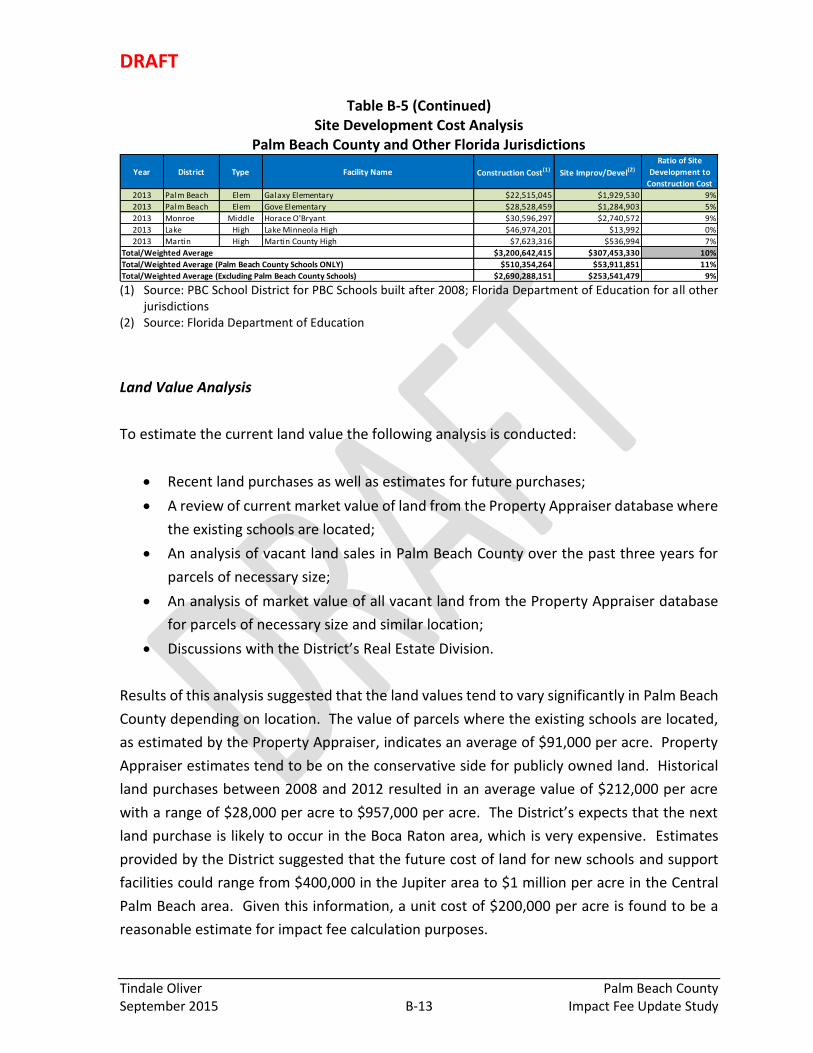
DRAFT
Tindale Oliver Palm Beach County September 2015 B-13 Impact Fee Update Study
Table B-5 (Continued) Site Development Cost Analysis
Palm Beach County and Other Florida Jurisdictions
(1) Source: PBC School District for PBC Schools built after 2008; Florida Department of Education for all other
jurisdictions (2) Source: Florida Department of Education
Land Value Analysis
To estimate the current land value the following analysis is conducted:
Recent land purchases as well as estimates for future purchases;
A review of current market value of land from the Property Appraiser database where
the existing schools are located;
An analysis of vacant land sales in Palm Beach County over the past three years for
parcels of necessary size;
An analysis of market value of all vacant land from the Property Appraiser database
for parcels of necessary size and similar location;
Discussions with the District’s Real Estate Division.
Results of this analysis suggested that the land values tend to vary significantly in Palm Beach
County depending on location. The value of parcels where the existing schools are located,
as estimated by the Property Appraiser, indicates an average of $91,000 per acre. Property
Appraiser estimates tend to be on the conservative side for publicly owned land. Historical
land purchases between 2008 and 2012 resulted in an average value of $212,000 per acre
with a range of $28,000 per acre to $957,000 per acre. The District’s expects that the next
land purchase is likely to occur in the Boca Raton area, which is very expensive. Estimates
provided by the District suggested that the future cost of land for new schools and support
facilities could range from $400,000 in the Jupiter area to $1 million per acre in the Central
Palm Beach area. Given this information, a unit cost of $200,000 per acre is found to be a
reasonable estimate for impact fee calculation purposes.
Year District Type Facility Name Construction Cost(1) Site Improv/Devel(2)
Ratio of Site
Development to
Construction Cost
2013 Palm Beach Elem Galaxy Elementary $22,515,045 $1,929,530 9%
2013 Palm Beach Elem Gove Elementary $28,528,459 $1,284,903 5%
2013 Monroe Middle Horace O'Bryant $30,596,297 $2,740,572 9%
2013 Lake High Lake Minneola High $46,974,201 $13,992 0%
2013 Martin High Martin County High $7,623,316 $536,994 7%
$3,200,642,415 $307,453,330 10%
$510,354,264 $53,911,851 11%
$2,690,288,151 $253,541,479 9%
Total/Weighted Average
Total/Weighted Average (Palm Beach County Schools ONLY)
Total/Weighted Average (Excluding Palm Beach County Schools)

DRAFT
APPENDIX C Building and Land Values Supplemental
Information

DRAFT
Tindale Oliver Palm Beach County September 2015 C-1 Impact Fee Update Study
This Appendix provides a summary of building and land value estimates for all impact fee
program areas with the exception of transportation and educational facilities. Information
related to cost estimates for educational facilities is included in Appendix B, and
transportation cost estimates are included in Appendix E.
Building Values
For all of the program areas, the following information was reviewed to estimate building
values:
Recent construction completed by Palm Beach County (if any);
Estimates for any planned facilities;
Insurance values of existing facilities;
Data from other jurisdictions for recently completed facilities; and
Discussions with and estimates provided by the County.
The following paragraphs provide a summary for each program area.
Recreational Facilities
To estimate recreation facility values in Palm Beach County, historical construction data was
obtained from the Palm Beach County Parks and Recreation Department. As presented in
Table C-1, the costs for each park type between 1996 and 2012 were evaluated and an
average figure that relied more heavily on the past 10 years was used. These estimates were
applied to the developed acreage of each park type.

DRAFT
Tindale Oliver Palm Beach County September 2015 C-2 Impact Fee Update Study
Table C-1 Recreation Facility Development Cost
Source: Palm Beach County Parks and Recreation Department
Total Cost Total Acres TC/Acre Total Cost Total Acres TC/Acre Total Cost Total Acres TC/Acre
1996 - - - - - - $1,748,000 9.04 $193,363
1997 $2,156,000 23.80 $90,588 $10,464,000 226.48 $46,203 - - -
1998 $6,133,448 60.00 $102,224 $5,867,307 130.00 $45,133 - - -
1999 $851,000 6.00 $141,833 - - - $2,943,000 1.85 $1,590,811
2000 - - - $26,724,000 238.76 $111,928 - - -
2001 - - - - - - $3,358,942 11.44 $293,614
2002 $8,780,643 47.12 $186,346 - - - - - -
2003 $5,587,711 27.00 $206,952 - - - $1,574,517 2.15 $732,333
2004 - - - $3,442,337 15.90 $216,499 - - -
2005 $603,026 6.50 $92,773 - - - - - -
2006 $21,798,084 67.65 $322,219 $11,615,688 65.70 $176,799 - - -
2007 $21,143,551 214.71 $98,475 $13,642,979 65.29 $208,960 $799,241 0.28 $2,854,432
2008 $11,656,971 27.80 $419,316 $6,368,960 47.73 $133,437 $214,224 0.34 $630,071
2009 $6,542,836 14.71 $444,788 - - - $1,523,481 4.50 $338,551
2010 $1,491,277 2.65 $562,746 $1,565,000 6.95 $225,180 - - -
2011 $5,426,773 44.83 $121,052 $50,760,165 787.56 $64,452 $6,118,884 7.90 $774,542
2012 - - - - - - $132,016 0.36 $366,711
All Years $92,171,320 542.77 $169,817 $130,450,436 1,584.37 $82,336 $18,412,305 37.86 $486,326
1996 - 2001 $9,140,448 89.80 $101,787 $43,055,307 595.24 $72,333 $8,049,942 22.33 $360,499
2002 - 2012 $83,030,872 452.97 $183,303 $87,395,129 989.13 $88,356 $10,362,363 15.53 $667,248
2008 - 2012 $25,117,857 89.99 $279,118 $58,694,125 842.24 $69,688 $7,988,605 13.10 $609,817
Used in the Study $200,000 $80,000 $640,000
YearDistrict Regional Beach

DRAFT
Tindale Oliver Palm Beach County September 2015 C-3 Impact Fee Update Study
Public Libraries
Most recent library construction in Palm Beach County, completed between 2010 and 2013,
resulted in building cost ranging from $285 per square foot to $431 per square foot. Of these,
Acreage Library is a LEED-certified building, which tends to increase the construction cost.
This is the only LEED-certified County library and the County does not have a policy to build
LEED-certified buildings. The high cost of Belle Glades library could be partially due to the
location and site characteristics of this building. The current average insurance value of
existing libraries is $309 per square foot with contents, and $204 without contents. Insurance
values tend to represent a conservative estimate. Library building costs observed in other
jurisdictions over the past five years averaged $240 per square foot. Given this information,
building cost of $300 per square foot is found to be a reasonable estimate for the library
impact fee calculation purposes.
Table C-2
Public Libraries Construction Cost
(1) Source: Palm Beach County (2) Source: Palm Beach County, includes contents (3) Previous impact fee studies over the past five years
Fire Protection & Rescue
As part of this analysis, Tindale Oliver contacted several Florida jurisdictions to obtain more
recent fire station construction cost information. The bids and estimates for facilities built in
2010 or 2012 range from $190 to $300 per square foot (excluding
furniture/fixture/equipment, site preparation cost, permits, fees and other similar expenses).
The following chart presents the station construction cost trends based on bids, estimates,
and other information obtained during the previous impact fee studies completed by Tindale
Oliver. As presented, the variation in station costs is relatively minor over the past few years.
Source YearBuilding Cost per
Square Foot
Construction/Renovation of Gardens Library Branch (1) 2009/10 $285
Construction of Acreage Library Branch(1) 2011/12 $431
Construction of Belle Glade Library Branch(1) 2012/13 $403
Insurance Values of Existing Libraries(2) 2014 $309
Library Construction in Other Florida Counties(3) 2010-2014 $240
Used in the Study 2014 $300

DRAFT
Tindale Oliver Palm Beach County September 2015 C-4 Impact Fee Update Study
Figure C-1
Fire/EMS Station Construction Cost per Square Foot
Source: Fire station construction cost data collected from Florida jurisdictions
In determining the appropriate unit cost for station construction in Palm Beach County, in
addition to these trends, the following data was evaluated:
The most recent fire station expansion and renovation project cost was approximately
$262 per square foot (replacement of Station 31 in 2012). The high cost associated
with the replacement of Station 74 ($436 per square foot) is partially due to its
location in the Glades area, which requires higher site preparation costs.
The insurance value of existing fire/EMS stations is $190 per square foot, which is
considered to be a conservative value.
Based on this information, an average value of $260 per square foot for fire station
construction cost is estimated for impact fee calculation purposes, which is also
consistent with statewide trends.
$0
$50
$100
$150
$200
$250
$300
2004 2005 2006 2007 2008 2009 2010 2011 2012 2013 2014

DRAFT
Tindale Oliver Palm Beach County September 2015 C-5 Impact Fee Update Study
Table C-3 Fire Protection & Rescue Cost
(1) Source: Palm Beach County, includes FF&E (2) Source: Palm Beach County, includes FF&E and located in the Glades Area, which may increase the cost (3) Source: Palm Beach County, includes contents (4) Source: Local jurisdictions (5) Based on discussions with architects for a range of a typical fire station in Florida based on their experience
(includes adjustment for FF&E, site preparation, permits, etc.)
Public Buildings
Public buildings include a variety of building types, such as office and industrial buildings
and courthouses. In addition, in the case of Palm Beach County’s public buildings impact
fee, correctional facilities and law enforcement buildings are also grouped with other public
buildings. The following paragraphs provide estimates for each type of building.
Correctional Facilities
As shown in Table C-4, Palm Beach County Facilities Development & Operations Department
(FD&O) provided an estimate of $106,432 per bed for jail facilities. This estimate resulted in
a cost of $290 per square foot, which was then compared to construction cost estimates
obtained from other Florida jurisdictions, information obtained from architects and
contracts, and the County’s insurance values. This analysis confirmed that the County’s
estimate is within the range of other jurisdictions and is appropriate to be used for impact
fee calculation purposes.
Source YearBuilding Cost per
Square Foot
Replacement of Station 31(1) 2012 $262
Replacement of Station 74(2) 2011 $436
Insurance Values of Existing Fire Stations(3) 2014 $192
Recent Fire Station Construction in Other Florida Counties (4) 2010-2014 $190 - $300
Estimates from Florida Architects(5) 2013 $230 - $280
Used in the Study 2014 $260

DRAFT
Tindale Oliver Palm Beach County September 2015 C-6 Impact Fee Update Study
Table C-4 Correctional Facilities Construction Cost
(1) Source: Palm Beach County (2) Source: Palm Beach County (3) Source: Palm Beach County Facilities Development & Operations Department (4) Number of beds (Item 1) multiplied by County estimate per bed (Item 2) (5) Total cost (Item 4) divided by square footage (Item 2) (6) Source: Palm Beach County (7) Source: AJAX Engineering and Florida Department of Correctional Facilities as well as other Florida Counties, figures rounded (8) Source: Reed Construction Company (9) Based on discussions with architects for a range of typical jail in Florida based on their experience
Source Year Beds(1) Square Foot(2)
County
Estimate Per
Bed(3)
Total Cost(4)Cost per
Square Foot(5)
Correctional Facilities:
Main Jail 2014 2,156 800,305 $229,467,392 $287
Stockade 2014 265 153,633 $28,204,480 $184
West County Jail (Belle Glade) 2014 999 314,199 $106,325,568 $338
Eagle Academy (Belle Glade) 2014 144 39,810 $15,326,208 $385
Total/Weighted Average 1,307,947 $379,323,648 $290
Insurance Values(6) 2014 $243
Recent Jail Construction in Other Florida Counties(7) $240 - $300
Estimates from National Construction Companies(8) 2014 $270 - $300
Estimates from Florida Architects(9) 2013 $285 - $445
Used in the Study 2014 $290
$106,432
County Estimates:
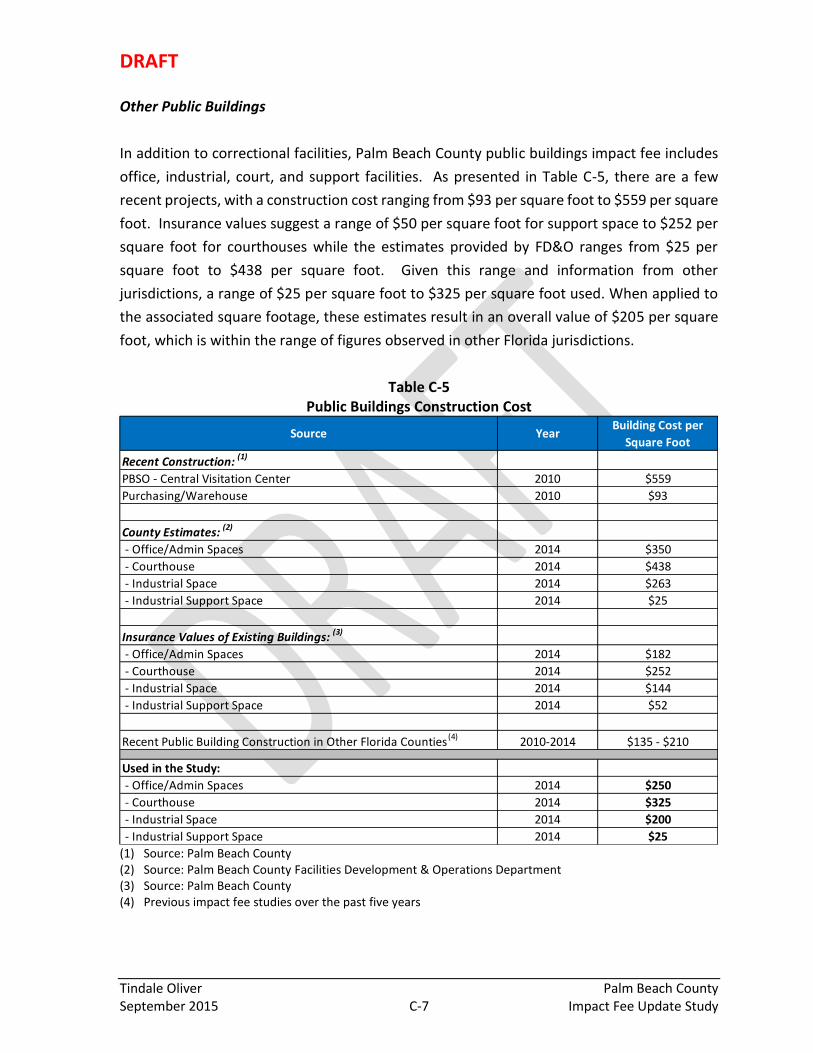
DRAFT
Tindale Oliver Palm Beach County September 2015 C-7 Impact Fee Update Study
Other Public Buildings
In addition to correctional facilities, Palm Beach County public buildings impact fee includes
office, industrial, court, and support facilities. As presented in Table C-5, there are a few
recent projects, with a construction cost ranging from $93 per square foot to $559 per square
foot. Insurance values suggest a range of $50 per square foot for support space to $252 per
square foot for courthouses while the estimates provided by FD&O ranges from $25 per
square foot to $438 per square foot. Given this range and information from other
jurisdictions, a range of $25 per square foot to $325 per square foot used. When applied to
the associated square footage, these estimates result in an overall value of $205 per square
foot, which is within the range of figures observed in other Florida jurisdictions.
Table C-5 Public Buildings Construction Cost
(1) Source: Palm Beach County (2) Source: Palm Beach County Facilities Development & Operations Department (3) Source: Palm Beach County (4) Previous impact fee studies over the past five years
Source YearBuilding Cost per
Square Foot
Recent Construction: (1)
PBSO - Central Visitation Center 2010 $559
Purchasing/Warehouse 2010 $93
County Estimates: (2)
- Office/Admin Spaces 2014 $350
- Courthouse 2014 $438
- Industrial Space 2014 $263
- Industrial Support Space 2014 $25
Insurance Values of Existing Buildings: (3)
- Office/Admin Spaces 2014 $182
- Courthouse 2014 $252
- Industrial Space 2014 $144
- Industrial Support Space 2014 $52
Recent Public Building Construction in Other Florida Counties (4) 2010-2014 $135 - $210
Used in the Study:
- Office/Admin Spaces 2014 $250
- Courthouse 2014 $325
- Industrial Space 2014 $200
- Industrial Support Space 2014 $25

DRAFT
Tindale Oliver Palm Beach County September 2015 C-8 Impact Fee Update Study
Land Values
For each impact fee program area, land values were determined based on the following
analysis, as data available:
Recent land purchases for the related infrastructure (if any);
Value of current parcels as reported by the Palm Beach County Property Appraiser;
Value of vacant land by size and by land use;
Vacant land sales over the past three years by size and by land use; and
Discussions with County representatives.
It should be noted that the land value and sales analysis suggested that there is a large
variation in land values throughout the county, and the sales data indicated higher values
possibly due to the location of parcels sold as well as a lag in the update of the values in the
Property Appraiser database. The analysis and estimates used for impact fee calculation
purposes need to balance the cost of future purchases, which in many cases are likely to be
in more expensive areas due to the development activity and the value of land included in
impact fee calculations as part of the current inventory.
Parks
The County’s parks impact fee includes regional, district, and beach parks. As such, the
average land value of each type of park is estimated. Palm Beach County Parks and
Recreation Department provided recent purchases that are representative of each park type.
This information was supplemented by the current value of park parcels as estimated by the
Palm Beach County Property Appraiser. Given that the Property Appraiser values tend to
have a lag in estimating current sales values and the higher costs observed in recent
purchases, an estimate that is approximately 15 percent higher than the current Property
Appraiser values is found to be a reasonable estimate for park land for the purposes of impact
fee calculations.
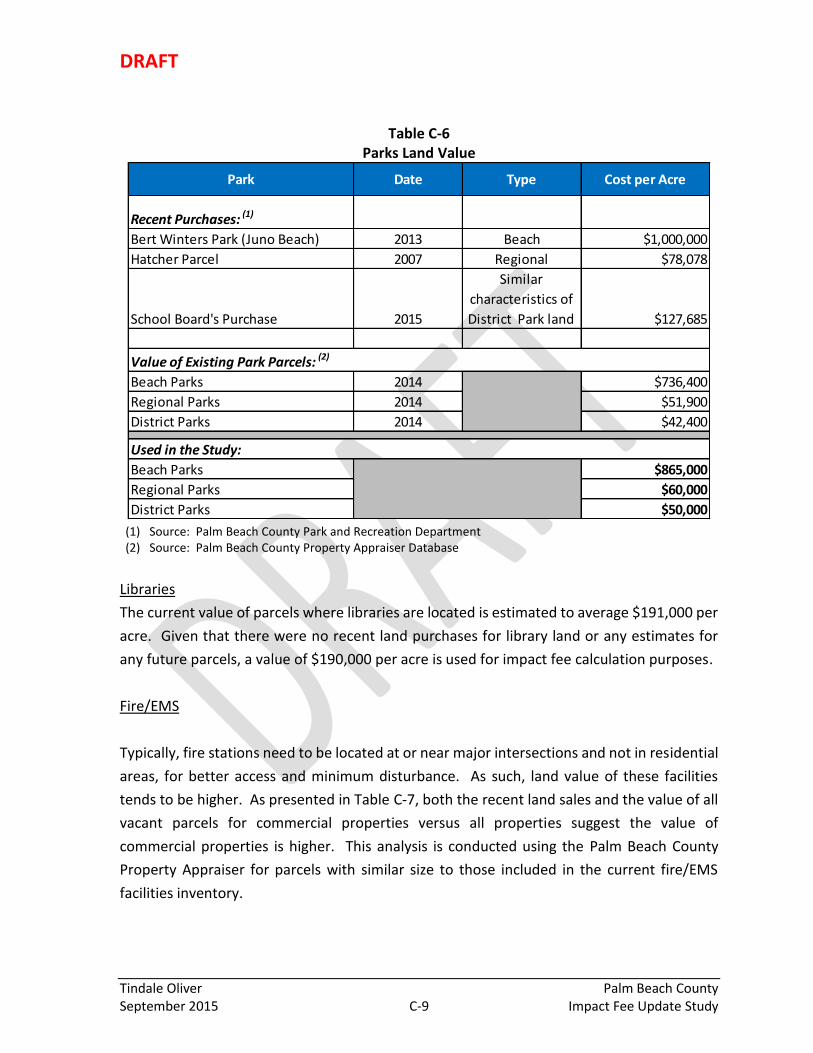
DRAFT
Tindale Oliver Palm Beach County September 2015 C-9 Impact Fee Update Study
Table C-6 Parks Land Value
(1) Source: Palm Beach County Park and Recreation Department (2) Source: Palm Beach County Property Appraiser Database
Libraries
The current value of parcels where libraries are located is estimated to average $191,000 per
acre. Given that there were no recent land purchases for library land or any estimates for
any future parcels, a value of $190,000 per acre is used for impact fee calculation purposes.
Fire/EMS
Typically, fire stations need to be located at or near major intersections and not in residential
areas, for better access and minimum disturbance. As such, land value of these facilities
tends to be higher. As presented in Table C-7, both the recent land sales and the value of all
vacant parcels for commercial properties versus all properties suggest the value of
commercial properties is higher. This analysis is conducted using the Palm Beach County
Property Appraiser for parcels with similar size to those included in the current fire/EMS
facilities inventory.
Park Date Type Cost per Acre
Recent Purchases: (1)
Bert Winters Park (Juno Beach) 2013 Beach $1,000,000
Hatcher Parcel 2007 Regional $78,078
School Board's Purchase 2015
Similar
characteristics of
District Park land $127,685
Beach Parks 2014 $736,400
Regional Parks 2014 $51,900
District Parks 2014 $42,400
Beach Parks $865,000
Regional Parks $60,000
District Parks $50,000
Value of Existing Park Parcels: (2)
Used in the Study:

DRAFT
Tindale Oliver Palm Beach County September 2015 C-10 Impact Fee Update Study
The large variation in land values discussed previously is observed in the value of parcels
where the current fire/EMS stations are located. The average value of these parcels is
$101,000 per acre with a range of $10,000 per acre to $523,000 per acre.
Given this information, an average value of $150,000 per acre is found to be a reasonable
estimate for impact fee calculation purposes. This estimate takes into account both the high
value of recent sales and the average value of the parcels that are in the inventory.
Table C-7 Fire/EMS Station Land Value
(1) Source: Palm Beach County Property Appraiser Database
Public Buildings
The County has not purchased any land for public buildings recently; however, recent
appraisals resulted in estimates ranging from $103,000 per acre to $2.7 milllion per acre. The
value of current parcels, as reported by the Property Appraiser, averages $112,500 per acre.
To supplement this figure, Tindale Oliver conducted an analysis of vacant land sales and
values based on the data included in the Palm Beach County Property Appraiser database.
Value of Current Parcels 2014 $101,000
Value of Vacant Land:
0.5 to 5 Acres:
- All 2014 $81,700
- Commercial 2014 $285,900
5.01 to 10 Acres:
- All 2014 $64,600
- Commercial 2014 $162,900
Vacant Land Sales:
0.5 to 5 Acres:
- All 2011-2013 $211,400
- Commercial 2011-2013 $634,500
5.01 to 10 Acres:
- All 2011-2013 $128,900
- Commercial 2011-2013 $330,000
Used in the Study 2014 $150,000
Variable(1) YearAverage Land
Value per Acre
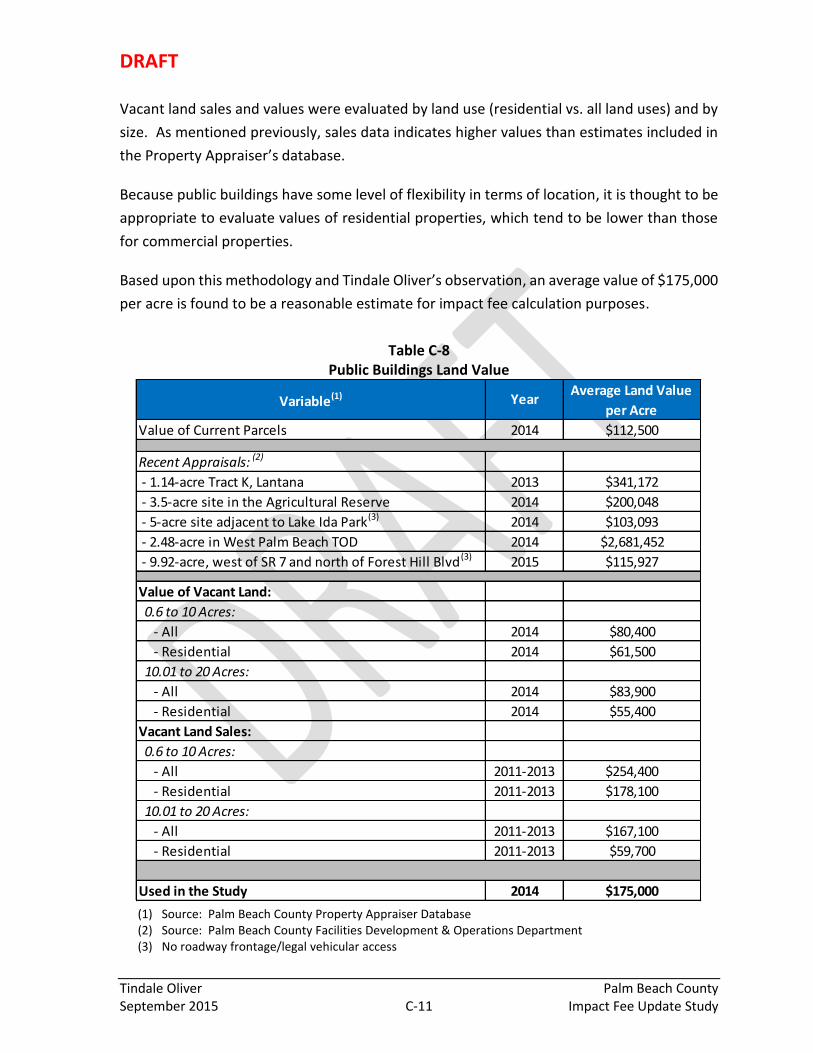
DRAFT
Tindale Oliver Palm Beach County September 2015 C-11 Impact Fee Update Study
Vacant land sales and values were evaluated by land use (residential vs. all land uses) and by
size. As mentioned previously, sales data indicates higher values than estimates included in
the Property Appraiser’s database.
Because public buildings have some level of flexibility in terms of location, it is thought to be
appropriate to evaluate values of residential properties, which tend to be lower than those
for commercial properties.
Based upon this methodology and Tindale Oliver’s observation, an average value of $175,000
per acre is found to be a reasonable estimate for impact fee calculation purposes.
Table C-8 Public Buildings Land Value
(1) Source: Palm Beach County Property Appraiser Database (2) Source: Palm Beach County Facilities Development & Operations Department (3) No roadway frontage/legal vehicular access
Value of Current Parcels 2014 $112,500
Recent Appraisals: (2)
- 1.14-acre Tract K, Lantana 2013 $341,172
- 3.5-acre site in the Agricultural Reserve 2014 $200,048
- 5-acre site adjacent to Lake Ida Park(3) 2014 $103,093
- 2.48-acre in West Palm Beach TOD 2014 $2,681,452
- 9.92-acre, west of SR 7 and north of Forest Hill Blvd(3) 2015 $115,927
Value of Vacant Land:
0.6 to 10 Acres:
- All 2014 $80,400
- Residential 2014 $61,500
10.01 to 20 Acres:
- All 2014 $83,900
- Residential 2014 $55,400
Vacant Land Sales:
0.6 to 10 Acres:
- All 2011-2013 $254,400
- Residential 2011-2013 $178,100
10.01 to 20 Acres:
- All 2011-2013 $167,100
- Residential 2011-2013 $59,700
Used in the Study 2014 $175,000
Variable(1) YearAverage Land Value
per Acre
DRAFT
APPENDIX D Public Buildings Impact Fee – Inventory

DRAFT
Tindale Oliver Palm Beach County September 2015 D-1 Impact Fee Update Study
Table D-1 Palm Beach County Public Buildings Inventory
Dept(1) Building(1) Address(1) Office SF(1) Industrial SF(1)Industrial
Support SF(1) Court SF(1) Jail SF(1) Jail Beds(1)Parking
Spaces(1) Total SF(1)
Agriculture Mounts 531 N. Military Trail, West Palm Beach 6,800 6,800
Agriculture Hutcheson 559 N. Military Trail, West Palm Beach 19,121 19,121
Agriculture Ag Ext Office 2916 State Road 15, Belle Glade 2,028 2,028
Courthouse Main 205 N. Dixie Hwy, West Palm Beach 698,561 698,561
Courthouse SA/PD 401 N. Dixie Hwy, West Palm Beach 165,000 165,000
Courthouse Judicial Center Parking 505 Banyan Blvd, West Palm Beach 524,782 1,811 524,782
Courthouse North 3188 PGA Blvd, Palm Beach Gardens 68,524 68,524
Courthouse South 200 W. Atlantic Ave, Delray Beach 150,000 150,000
Courthouse West County 2950 State Road 15, Belle Glade 36,626 36,626
Clerk Park Place 429 Park Place, West Palm Beach 796 10,680 11,476
Clerk Courthouse - 7th Flr 205 N. Dixie Hwy, West Palm Beach 8,000 8,000
Community Services Jupiter Health 6401 W. Indiantown Road, Jupiter 3,300 3,300
Community Services West Jupiter Comm 6401 W. Indiantown Road, Jupiter 4,600 4,600
Community Services North County Senior Ctr 5217 Northlake Blvd, Palm Beach Gardens 14,500 14,500
Community Services Mid-County Senior Ctr 3680 Lake Worth Road, Lake Worth 26,000 26,000
Community Services Mayme Fredrick 1440 Dr. Martin Luther King Jr Blvd, Riviera Beach 19,000 19,000
Community Services 810 Datura 810 Datura Street, West Palm Beach 29,650 29,650
Community Services Westgate Community 3691 Oswego Ave, West Palm Beach 5,405 5,405
Community Services CAC - 1699 Wingfield 1699 Wingfield Street, Lake Worth 4,654 4,654
Community Services West County Senior 2916 State Road 15, Belle Glade 6,700 6,700
Community Services Central HRC/Lewis Ctr(2) 1000 45th Street, West Palm Beach 34,631 34,631
Engineering Vista - 2300 Building 2300 N. Jog Road, West Palm Beach 56,400 56,400
Engineering Vista - OSC 2633 Vista Parkway, West Palm Beach 106,800 121,800 228,600
Engineering R&B - Cross State 550 N. Benoist Farm Road, West Palm Beach 300 300
Engineering R&B - West County 580 N. State Market Road, Pahokee 7,900 7,900
ERM Vista - 2300 Building 2300 N. Jog Road, West Palm Beach 34,700 34,700
ERM Vista - OSC 2633 Vista Parkway, West Palm Beach 1,100 1,100
ERM Mosquito Control 9011 W. Lantana Road, Lake Worth 30,149 30,149
FDO Vista - OSC 2633 Vista Parkway, West Palm Beach 46,200 12,800 59,000
FDO Vista - OSC Fleet 2633 Vista Parkway, West Palm Beach 93,400 391,400 484,800
FDO Gov't Center Parking 215 N. Olive Avenue, West Palm Beach 14,490 11,435 25,925
FDO Fleet - West & Fuel 580 N. State Market Road, Pahokee 4,174 4,174
FDO North County Fuel 8130 N Jog Road, West Palm Beach N/A
FDO Jupiter Fuel 14185 Military Trail, Jupiter N/A
FDO FMD Storage 3611 State Road 715, Pahokee 4,274 4,274
FDO FMD South 345 S. Congress Ave, Delray Beach 3,762 3,000 6,762
FDO FMD West 2916 State Road 15, Belle Glade 2,500 2,500
FDO FMD North 8130 Jog Road, West Palm Beach 5,000 5,000
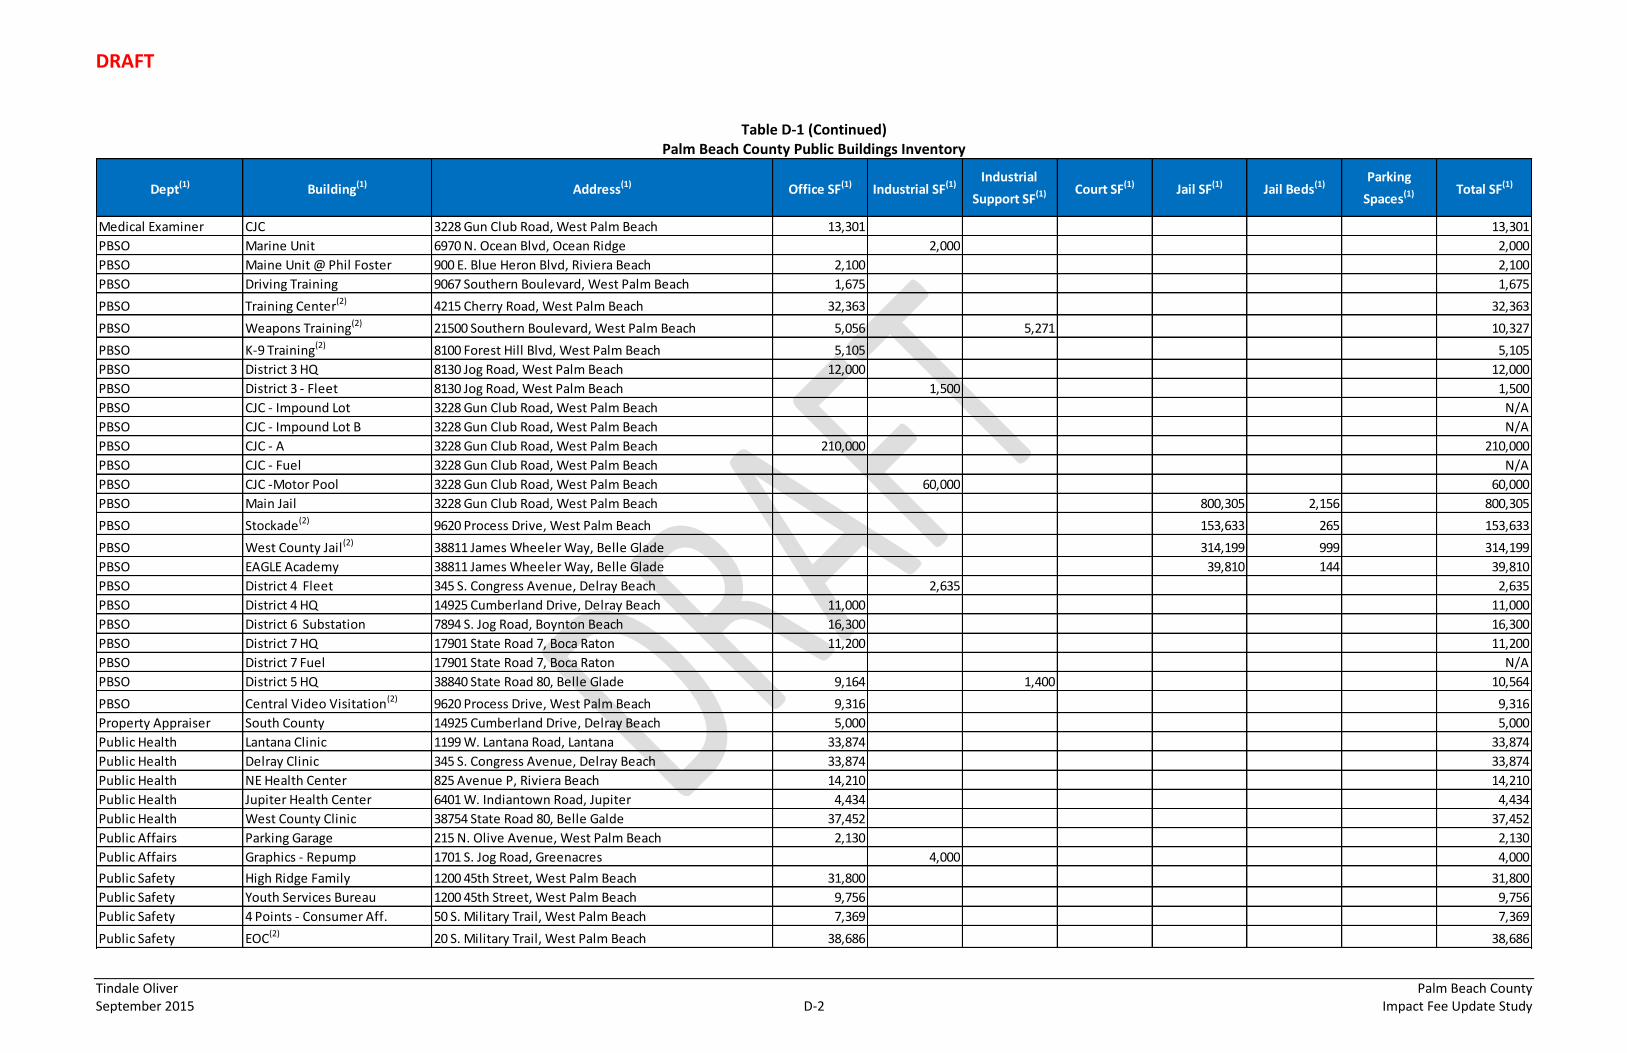
DRAFT
Tindale Oliver Palm Beach County September 2015 D-2 Impact Fee Update Study
Table D-1 (Continued) Palm Beach County Public Buildings Inventory
Dept(1) Building(1) Address(1) Office SF(1) Industrial SF(1)Industrial
Support SF(1) Court SF(1) Jail SF(1) Jail Beds(1)Parking
Spaces(1) Total SF(1)
Medical Examiner CJC 3228 Gun Club Road, West Palm Beach 13,301 13,301
PBSO Marine Unit 6970 N. Ocean Blvd, Ocean Ridge 2,000 2,000
PBSO Maine Unit @ Phil Foster 900 E. Blue Heron Blvd, Riviera Beach 2,100 2,100
PBSO Driving Training 9067 Southern Boulevard, West Palm Beach 1,675 1,675
PBSO Training Center(2) 4215 Cherry Road, West Palm Beach 32,363 32,363
PBSO Weapons Training(2) 21500 Southern Boulevard, West Palm Beach 5,056 5,271 10,327
PBSO K-9 Training(2) 8100 Forest Hill Blvd, West Palm Beach 5,105 5,105
PBSO District 3 HQ 8130 Jog Road, West Palm Beach 12,000 12,000
PBSO District 3 - Fleet 8130 Jog Road, West Palm Beach 1,500 1,500
PBSO CJC - Impound Lot 3228 Gun Club Road, West Palm Beach N/A
PBSO CJC - Impound Lot B 3228 Gun Club Road, West Palm Beach N/A
PBSO CJC - A 3228 Gun Club Road, West Palm Beach 210,000 210,000
PBSO CJC - Fuel 3228 Gun Club Road, West Palm Beach N/A
PBSO CJC -Motor Pool 3228 Gun Club Road, West Palm Beach 60,000 60,000
PBSO Main Jail 3228 Gun Club Road, West Palm Beach 800,305 2,156 800,305
PBSO Stockade(2) 9620 Process Drive, West Palm Beach 153,633 265 153,633
PBSO West County Jail(2) 38811 James Wheeler Way, Belle Glade 314,199 999 314,199
PBSO EAGLE Academy 38811 James Wheeler Way, Belle Glade 39,810 144 39,810
PBSO District 4 Fleet 345 S. Congress Avenue, Delray Beach 2,635 2,635
PBSO District 4 HQ 14925 Cumberland Drive, Delray Beach 11,000 11,000
PBSO District 6 Substation 7894 S. Jog Road, Boynton Beach 16,300 16,300
PBSO District 7 HQ 17901 State Road 7, Boca Raton 11,200 11,200
PBSO District 7 Fuel 17901 State Road 7, Boca Raton N/A
PBSO District 5 HQ 38840 State Road 80, Belle Glade 9,164 1,400 10,564
PBSO Central Video Visitation(2) 9620 Process Drive, West Palm Beach 9,316 9,316
Property Appraiser South County 14925 Cumberland Drive, Delray Beach 5,000 5,000
Public Health Lantana Clinic 1199 W. Lantana Road, Lantana 33,874 33,874
Public Health Delray Clinic 345 S. Congress Avenue, Delray Beach 33,874 33,874
Public Health NE Health Center 825 Avenue P, Riviera Beach 14,210 14,210
Public Health Jupiter Health Center 6401 W. Indiantown Road, Jupiter 4,434 4,434
Public Health West County Clinic 38754 State Road 80, Belle Galde 37,452 37,452
Public Affairs Parking Garage 215 N. Olive Avenue, West Palm Beach 2,130 2,130
Public Affairs Graphics - Repump 1701 S. Jog Road, Greenacres 4,000 4,000
Public Safety High Ridge Family 1200 45th Street, West Palm Beach 31,800 31,800
Public Safety Youth Services Bureau 1200 45th Street, West Palm Beach 9,756 9,756
Public Safety 4 Points - Consumer Aff. 50 S. Military Trail, West Palm Beach 7,369 7,369
Public Safety EOC(2) 20 S. Military Trail, West Palm Beach 38,686 38,686

DRAFT
Tindale Oliver Palm Beach County September 2015 D-3 Impact Fee Update Study
Table D-1 (Continued) Palm Beach County Public Buildings Inventory
Dept(1) Building(1) Address(1) Office SF(1) Industrial SF(1)Industrial
Support SF(1) Court SF(1) Jail SF(1) Jail Beds(1)Parking
Spaces(1) Total SF(1)
Public Safety South County Youth 345 S. Congress Avenue, Delray Beach 6,290 6,290
Public Safety West Animal Care&Control 3615 State Road 715, Pahokee 3,000 3,000
Public Safety Animal Care & Control(2) 7100 Belvedere Road, West Palm Beach 25,869 18,815 44,684
PZB Vista - 2300 Building 2300 N. Jog Road, West Palm Beach 106,000 106,000
PZB South County 451 S. Congress Avenue, Delray Beach 2,600 2,600
Purchasing 4 Points 50 S. Military Trail, West Palm Beach 12,128 12,128
Purchasing Warehouse 2633 Vista Parkway, West Palm Beach 91,000 91,000
Small Business Asst. 4 Points 50 S. Military Trail, West Palm Beach 2,987 2,987
Supervisor of Elections 20 S Military(2) 240 S. Military Trail, West Palm Beach 39,003 39,003
Tax Collector Lake Worth 3551 S. Military Trail, Lake Worth 6,220 6,220
Tax Collector South County 501 S. Congress Ave, Delray Beach 12,343 12,343
Multiple Use Building 509 3323 Belvedere Road, West Palm Beach 7,500 7,500
Multiple Use Bill Bailey Community Ctr. 1101 Dr. Martin Luther King Jr. Blvd W, Belle Glade 23,613 23,613
Multiple Use Cabana Colony 12180 Alt A1A, Palm Beach Gardens 2,000 2,000
Multiple Use 4 Points Common 50 S. Military Trail, West Palm Beach 1,144 1,144
Multiple Use Government Center 301 N. Olive Ave, West Palm Beach 301,851 301,851
Multiple Use Gov't Ctr Parking Garage(2) 215 N. Olive Avenue, West Palm Beach 236,104 651 236,104
Multiple Use Hepburn St 600 N. Hepburn Ave., Jupiter 4,086 4,086
Multiple Use Midwestern 200 Civic Center Way, Royal Palm Beach 19,968 19,968
Multiple Use North County Gov't Ctr 3188 PGA Blvd, Palm Beach Gardens 35,113 35,113
Multiple Use South County Gov't Ctr 345 S. Congress Avenue, Delray Beach 50,000 50,000
Multiple Use South Cty Parking Garage(2) 11 SW 2nd Ave, Delray Beach 140,819 369 140,819
Multiple Use Vista - 2300 Common 2300 N. Jog Road, West Palm Beach 38,400 38,400
Multiple Use Vista - 2300 Garage 2300 N. Jog Road, West Palm Beach 289,528 756 289,528
Multiple Use West County Gov't Ctr 2916 State Road 15, Belle Glade 23,100 23,100
Multiple Use 1916 Courthouse(2) 301 N. Olive Ave, West Palm Beach 30,933 30,933
Multiple Use Airport Center - Bldg. 1 100 Australian Ave, West Palm Beach 62,000 62,000
Multiple Use Airport Center - Bldg. 2 100 Australian Ave, West Palm Beach 62,000 62,000
Multiple Use 20 Mile Bend Tower 20 County Road 880, West Palm Beach N/A
Multiple Use Belle Glade Tower 1052 Duda Road, Belle Glade N/A
Multiple Use Pahokee Tower 640 N State Market Road, Pahokee N/A
Multiple Use Jupiter Tower 8021 W Indiantown Road, Jupiter N/A
Multiple Use Connemara Tower 5420 N Ocean Drive, Riviera Beach N/A
Multiple Use North EMS Tower 1130 45th Street, Riviera Beach N/A
Multiple Use EOC Tower 20 S Military Trail, West Palm Beach N/A
Multiple Use Forest Hill Tower 7950 Forest Hill Blvd, West Palm Beach N/A
Multiple Use Boynton Beach Tower 515 NW 14th Court, Boynton Beach N/A

DRAFT
Tindale Oliver Palm Beach County September 2015 D-4 Impact Fee Update Study
Table D-1 (Continued) Palm Beach County Public Buildings Inventory
(1) Source: Palm Beach County (2) Source: Palm Beach County, 2014 Statement of Values Report (insurance values)
Dept(1) Building(1) Address(1) Office SF(1) Industrial SF(1)Industrial
Support SF(1) Court SF(1) Jail SF(1) Jail Beds(1)Parking
Spaces(1) Total SF(1)
Multiple Use South EMS Tower 345 S Congress Ave, Delray Beach N/A
Multiple Use Boca Raton Tower 7941 Glades Road, Boca Raton N/A
1,959,113 436,284 1,730,219 953,711 1,307,947 3,564 3,587 6,387,274Building Totals

DRAFT
Tindale Oliver Palm Beach County September 2015 D-5 Impact Fee Update Study
Table D-2 Palm Beach County Public Buildings - Land Inventory
Deptartment(1) Building(1) Address(1) Total SF(1)Total SF on
Site(1) Acreage(1)Allocated
Acreage(4)
Public Safety West Animal Care&Control 3615 State Road 715, Pahokee 3,000 3,000 2.00 2.00
FDO FMD Storage 3611 State Road 715, Pahokee 4,274 4,274 2.57 2.57
PBSO West County Jail(2) 314,199 76.81
PBSO EAGLE Academy 39,810 9.73
PBSO District 5 HQ 38840 State Road 80, Belle Glade 10,564 2.58
Agriculture Ag Ext Office 2,028 0.50
Community Services West County Senior 6,700 1.64
FDO FMD West 2,500 0.61
Multiple Use West County Gov't Ctr 23,100 5.65
Public Health West County Clinic 38754 State Road 80, Belle Glade 37,452 9.16
Courthouse West County 2950 State Road 15, Belle Glade 36,626 8.95
Multiple Use Belle Glade Tower 1052 Duda Road, Belle Glade N/A N/A 638.58 -
PBSO Weapons Training(2) 21500 Southern Boulevard, West Palm Beach 10,327 10,327 63.53 63.53
Multiple Use 20 Mile Bend Tower 20 County Road 880, West Palm Beach N/A N/A 1.26 -
PBSO District 7 HQ 11,200 6.86
PBSO District 7 Fuel N/A -
Community Services North County Senior Ctr 5217 Northlake Blvd, Palm Beach Gardens 14,500 14,500 5.00 5.00
Engineering Vista - OSC 228,600 12.23
ERM Vista - OSC 1,100 0.06
FDO Vista - OSC 59,000 3.16
FDO Vista - OSC Fleet 484,800 25.93
Purchasing Warehouse 91,000 4.87
Engineering Vista - 2300 Building 56,400 1.30
ERM Vista - 2300 Building 34,700 0.80
PZB Vista - 2300 Building 106,000 2.45
Multiple Use Vista - 2300 Common 38,400 0.89
Multiple Use Vista - 2300 Garage 289,528 6.70
PBSO Training Center(2) 4215 Cherry Road, West Palm Beach 32,363 N/A 19.63 8.82
Public Safety Animal Care & Control(2) 7100 Belvedere Road, West Palm Beach 44,684 44,684 14.05 14.05
Engineering R&B - Cross State 550 N. Benoist Farm Road, West Palm Beach 300 300 5.25 5.25
PBSO Driving Training(3) 9067 Southern Boulevard, West Palm Beach 1,675 291,170 98.60 0.57
ERM Mosquito Control 9011 W. Lantana Road, Lake Worth 30,149 30,149 6.43 6.43
PBSO Stockade(2) 123,633 23.00
PBSO Stockade Kitchen(2) 30,000 1.21
PBSO Central Video Visitation(2)9,316 5.49
Agriculture Hutcheson 559 N. Military Trail, West Palm Beach 19,121 19,121 10.28 10.28
Agriculture Mounts 531 N. Military Trail, West Palm Beach 6,800 6,800 5.35 5.35
Public Safety 4 Points - Consumer Aff.(3) 7,369 0.88
Purchasing 4 Points(3) 12,128 1.45
Small Business Asst. 4 Points(3) 2,987 0.36
Multiple Use 4 Points Common(3)1,144 0.14
Supervisor of Elections 20 S Military(2)240 S. Military Trail, West Palm Beach 39,003 39,003 4.83 4.83
Public Safety EOC(2) 38,686 4.51
Multiple Use EOC Tower N/A -
Tax Collector Lake Worth 3551 S. Military Trail, Lake Worth 6,220 6,220 0.65 0.65
PBSO District 6 Substation 7894 S. Jog Road, Boynton Beach 16,300 16,300 3.62 3.62
PBSO District 4 HQ 11,000 2.07
Property Appraiser South County 5,000 0.94
Multiple Use Cabana Colony(3) 12180 Alt A1A, Palm Beach Gardens 2,000 4,874 0.47 0.19
Multiple Use Building 509(3) 3323 Belvedere Road, West Palm Beach 7,500 176,421 12.21 0.52
Community Services Westgate Community(3)3691 Oswego Ave, West Palm Beach 5,405 21,272 9.38 2.38
Multiple Use Airport Center - Bldg. 1 62,000 8.30
Multiple Use Airport Center - Bldg. 2 62,000 8.30
Medical Examiner CJC 13,301 0.82
PBSO CJC - Impound Lot N/A 4.50
PBSO CJC - Impound Lot B N/A 0.06
PBSO CJC - A 210,000 12.93
PBSO CJC - Fuel N/A -
PBSO CJC -Motor Pool 60,000 3.69
PBSO CJC-Motor Pool Land N/A 10.00
PBSO Main Jail 800,305 49.27
Community Services Mid-County Senior Ctr 3680 Lake Worth Road, Lake Worth 26,000 N/A 12.15 7.22
Courthouse South 200 W. Atlantic Ave, Delray Beach 150,000 150,000 6.46 6.46
Multiple Use South Cty Parking Garage(2)11 SW 2nd Ave, Delray Beach 140,819 140,819 2.90 2.90
FDO FMD South 6,762 0.91
PBSO District 4 Fleet 2,635 0.36
Public Health Delray Clinic 33,874 4.56
Public Safety South County Youth 6,290 0.85
Multiple Use South County Gov't Ctr 50,000 6.74
PZB South County(3) 451 S. Congress Avenue, Delray Beach 2,600 6,602 1.48 0.58
Tax Collector South County 501 S. Congress Ave, Delray Beach 12,343 12,343 4.60 4.60
Public Affairs Graphics - Repump 1701 S. Jog Road, Greenacres 4,000 4,000 1.65 1.65
Multiple Use Hepburn St 600 N. Hepburn Ave., Jupiter 4,086 4,086 0.30 0.30
Community Services Jupiter Health(3) 3,300 1.17
Public Health Jupiter Health Center(3) 4,434 1.57
Community Services West Jupiter Comm(3)4,600 1.63
Community Services CAC - 1699 Wingfield(3) 1699 Wingfield Street, Lake Worth 4,654 N/A 67.56 6.48
PBSO Marine Unit(3)6970 N. Ocean Blvd, Ocean Ridge 2,000 3,305 5.69 3.44
Engineering R&B - West County 7,900 1.70
FDO Fleet - West & Fuel 4,174 0.90
Courthouse North 68,524 6.46
Multiple Use North County Gov't Ctr 35,113 3.31
38811 James Wheeler Way, Belle Glade
472,979 115.622916 State Road 15, Belle Glade
17901 State Road 7, Boca Raton 11,200 6.86
2633 Vista Parkway, West Palm Beach 864,500 46.24
2300 N. Jog Road, West Palm Beach 525,028 12.15
9620 Process Drive, West Palm Beach N/A 38.72
20 S. Military Trail, West Palm Beach 38,686 4.51
50 S. Military Trail, West Palm Beach 54,554 6.54
3228 Gun Club Road, West Palm Beach 1,083,606 81.27
14925 Cumberland Drive, Delray Beach 16,000 3.01
100 Australian Ave, West Palm Beach N/A 35.81
580 N. State Market Road, Pahokee 12,074 2.60
345 S. Congress Ave, Delray Beach 99,561 13.41
6401 W. Indiantown Road, Jupiter 24,274 8.62
3188 PGA Blvd, Palm Beach Gardens 103,637 9.77

DRAFT
Tindale Oliver Palm Beach County September 2015 D-6 Impact Fee Update Study
Table D-2 (Continued) Palm Beach County Public Buildings Inventory
(1) Source: Palm Beach County (2) Source: Palm Beach County, 2014 Statement of Values (3) Source: Palm Beach County Property Appraiser for total square feet on site (4) Provided by Palm Beach County or calculated as the ratio of total square feet to total square feet on site multiplied by acreage (5) Acreage is excluded as facility is located at Okeeheelee Park South
Deptartment(1) Building(1) Address(1) Total SF(1)Total SF on
Site(1) Acreage(1)Allocated
Acreage(4)
PBSO Maine Unit @ Phil Foster(3) 900 E. Blue Heron Blvd, Riviera Beach 2,100 8,144 7.07 1.82
Public Health NE Health Center(3) 825 Avenue P, Riviera Beach 14,210 18,498 3.89 2.99
Community Services Mayme Fredrick 1440 Dr. Martin Luther King Jr Blvd, Riviera Beach 19,000 19,000 4.34 4.34
Multiple Use Bill Bailey Community Ctr.(3) 1101 Dr. Martin Luther King Jr. Blvd W, Belle Glade 23,613 23,613 0.20 0.20
Multiple Use Midwestern 200 Civic Center Way, Royal Palm Beach 19,968 19,968 3.50 3.50
FDO North County Fuel N/A -
FDO FMD North 5,000 1.62
PBSO District 3 HQ 12,000 3.89
PBSO District 3 - Fleet 1,500 0.49
Community Services Central HRC/Lewis Ctr(2)1000 45th Street, West Palm Beach 34,631 34,631 3.97 3.97
Public Safety High Ridge Family 31,800 25.03
Public Safety Youth Services Bureau 9,756 7.68
Community Services 810 Datura 810 Datura Street, West Palm Beach 29,650 29,650 0.87 0.87
Courthouse Judicial Center Parking Garage 505 Banyan Blvd, West Palm Beach 524,782 524,782 6.08 6.08
Courthouse Main 698,561 4.91
Clerk Courthouse - 7th Flr 8,000 0.06
FDO Gov't Center Parking 25,925 0.17
Public Affairs Parking Garage 2,130 0.01
Multiple Use Gov't Ctr Parking Garage(2)236,104 1.55
Courthouse SA/PD 401 N. Dixie Hwy, West Palm Beach 165,000 165,000 2.68 2.68
Multiple Use Government Center 301,851 2.92
Multiple Use 1916 Courthouse(2)30,933 0.30
Clerk Park Place 429 Park Place, West Palm Beach 11,476 11,476 0.83 0.83
Public Health Lantana Clinic(3) 1199 W. Lantana Road, Lantana 33,874 N/A 144.11 7.25
PBSO K-9 Training(5)8100 Forest Hill Blvd, West Palm Beach 5,105 5,105 N/A N/A
6,387,274 1,679.14 601.79Building Totals
215 N. Olive Avenue, West Palm Beach 264,159 1.74
301 N. Olive Ave, West Palm Beach 332,784 3.22
1200 45th Street, West Palm Beach 41,556 32.71
205 N. Dixie Hwy, West Palm Beach 706,561 4.96
8130 N Jog Road, West Palm Beach 18,500 6.00

DRAFT
APPENDIX E Transportation Impact Fee – Demand
Component Calculations

DRAFT
Tindale Oliver Palm Beach County September 2015 E-1 Impact Fee Update Study
Transportation Impact Fee: Demand Component
This appendix presents the detailed calculations for the demand component of the
transportation impact fee update.
Interstate & Toll Facility Discount Factor
Table E-1 presents the interstate and toll facility discount factor used in the calculation of the
transportation impact fee. This variable is based on data from the Southeast Regional
Planning Model, specifically the 2035 projected vehicle miles of travel, accounting for
roadway improvements included in the 2035 Long Range Transportation Plan. It should be
noted that discount factor excludes all external-to-external trips, which represent traffic that
goes through Palm Beach County, but does not necessarily stop in the county. This traffic is
excluded from the analysis since it does not come from development within the county. The
I/T discount factor is used to reduce the VMT that the impact fee charges for each land use.
Table E-1 Interstate/Toll Facility Discount Factor
Source: Southeast Regional Planning Model v6.5
Single Family Residential Trip Generation Rate Tiering
As part of this study, the single family residential trip generation rate tiering was updated to
reflect a three-tier analysis to ensure equity by the size of a home. To facilitate this, an
analysis was completed on the comparative relationship between housing size and household
travel behavior. This analysis utilized data from the 2009 National Household Travel Survey
(NHTS) and the 2013 American Housing Survey (AHS) to examine overall trip-making
characteristics of households in the United States.
Table E-2 presents the existing trip characteristics being utilized in the current adopted
impact fee schedule for the single family (detached) land use. The 2009 NHTS database was
RoadwayVMT
(2035)% VMT
I-95 & FL Turnpike (SR 19) 12,427,646 32.5%
Other Roads 25,835,753 67.5%
Total (All Roads) 38,263,399 100.0%
Total (Interstate/Toll Roads) 12,427,646 32.5%

DRAFT
Tindale Oliver Palm Beach County September 2015 E-2 Impact Fee Update Study
used to assess average annual household vehicle miles of travel (VMT) for various annual
household income levels. In addition, the 2013 AHS database was used to compare median
annual family/household incomes with housing unit size. It is important to recognize that the
use of the income variable in each of these databases is completed simply to provide a
convenient linking mechanism between household VMT from the NHTS and housing unit size
from the AHS.
Table E-2 Calculated Single Family Trip Characteristics
Source: FL Studies for LUC 210, shown later in this appendix
The results of the NHTS and AHS analyses are included in Tables E-3 and E-4. First, the data
shown in Table E-3 indicates that the average income in the U.S. for families/households living
in housing units smaller than 1,500 square feet in size ($44,243) is lower than the overall
average income for the U.S. ($56,993). In Table E-4, annual average household VMT was
calculated from the NHTS database for a number of different income levels and ranges
related to the resulting AHS income data in Table E-3.
Table E-3 Calculated Single Family Trip Characteristics
Source: 2013 American Household Survey
Calculated Values
Excluding TieringTrip Rate
Assessable
Trip LengthDaily VMT
Ratio to
Mean
Single Family (Detached) 7.81 6.62 51.70 1.00
2013 AHS Average Income
Data by Housing Size
Annual
Income(1)
Less than 1,500 sf $44,243
1,500 to 2,499 sf $66,398
2,500 sf or more $80,449
Average of All Houses $56,993
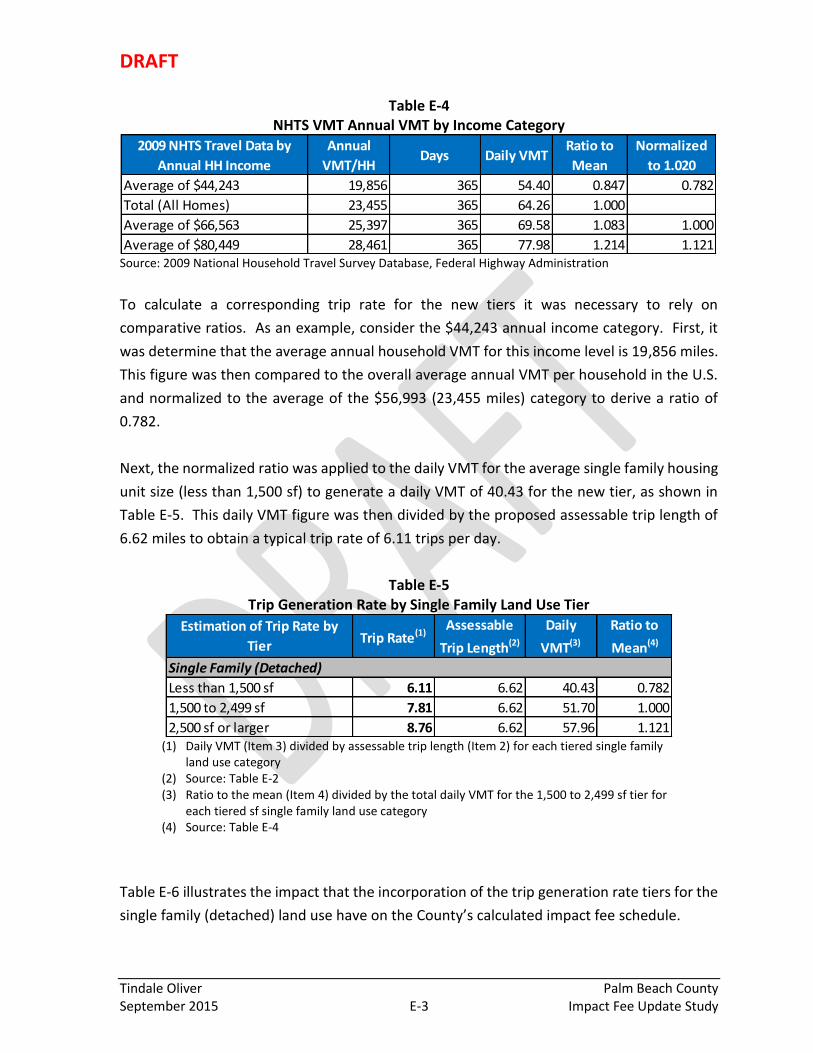
DRAFT
Tindale Oliver Palm Beach County September 2015 E-3 Impact Fee Update Study
Table E-4 NHTS VMT Annual VMT by Income Category
Source: 2009 National Household Travel Survey Database, Federal Highway Administration
To calculate a corresponding trip rate for the new tiers it was necessary to rely on
comparative ratios. As an example, consider the $44,243 annual income category. First, it
was determine that the average annual household VMT for this income level is 19,856 miles.
This figure was then compared to the overall average annual VMT per household in the U.S.
and normalized to the average of the $56,993 (23,455 miles) category to derive a ratio of
0.782.
Next, the normalized ratio was applied to the daily VMT for the average single family housing
unit size (less than 1,500 sf) to generate a daily VMT of 40.43 for the new tier, as shown in
Table E-5. This daily VMT figure was then divided by the proposed assessable trip length of
6.62 miles to obtain a typical trip rate of 6.11 trips per day.
Table E-5 Trip Generation Rate by Single Family Land Use Tier
(1) Daily VMT (Item 3) divided by assessable trip length (Item 2) for each tiered single family
land use category (2) Source: Table E-2 (3) Ratio to the mean (Item 4) divided by the total daily VMT for the 1,500 to 2,499 sf tier for
each tiered sf single family land use category (4) Source: Table E-4
Table E-6 illustrates the impact that the incorporation of the trip generation rate tiers for the
single family (detached) land use have on the County’s calculated impact fee schedule.
2009 NHTS Travel Data by
Annual HH Income
Annual
VMT/HHDays Daily VMT
Ratio to
Mean
Normalized
to 1.020
Average of $44,243 19,856 365 54.40 0.847 0.782
Total (All Homes) 23,455 365 64.26 1.000
Average of $66,563 25,397 365 69.58 1.083 1.000
Average of $80,449 28,461 365 77.98 1.214 1.121
Estimation of Trip Rate by
TierTrip Rate(1)
Assessable
Trip Length(2)
Daily
VMT(3)
Ratio to
Mean(4)
Single Family (Detached)
Less than 1,500 sf 6.11 6.62 40.43 0.782
1,500 to 2,499 sf 7.81 6.62 51.70 1.000
2,500 sf or larger 8.76 6.62 57.96 1.121

DRAFT
Tindale Oliver Palm Beach County September 2015 E-4 Impact Fee Update Study
Table E-6 Net Impact Fee by Single Family Land Use Tier
(1) Source: Table E-5, Item 1 (2) Source: Appendix H, Table H-1
Trip Length Adjustment Factor Analysis
This variable is used to adjust the average trip length obtained from the Florida Studies
Database when the trip lengths in a jurisdiction appear significantly different than the average
trip length observed in other jurisdiction.
Using the Central Florida Regional Planning Model, the average trip lengths for Palm Beach
County were compared to other jurisdictions throughout Florida and it was determined that
Palm Beach County trip lengths for residential and non-residential land uses are in-line with
the statewide averages. Additionally, fuel tax consumption per person for Palm Beach County
was compared to other Florida counties of similar population. Again, Palm Beach County is
in-line with the average for the counties in Florida with large populations, indicating an
average level of fuel consumption per capita, which suggests an average level of travel.
Based on this analysis, no trip length adjustment factors were applied to the land uses in the
Palm Beach County transportation impact fee schedule.
Florida Studies Trip Characteristics Database
The Florida Studies Trip Characteristics Database includes over 200 studies on 40 different
residential and non-residential land uses collected over the last 20 years. Data from these
studies include trip generation, trip length, and percent new trips for each land use. This
information has been used in the development of impact fees and the creation of land use
plan category trip characteristics for communities throughout Florida and the U.S.
Tindale Oliver estimates trip generation rates for all land uses in a transportation impact fee
schedule using data from studies in the Florida Studies Database and the Institute of
Transportation Engineers’ (ITE) Trip Generation reference report (9th edition). In instances,
Impact of Tiering on Fee
Schedule Trip Rate(1) Assessable
Trip LengthDaily VMT Net Fee(2)
Single Family (Detached)
Less than 1,500 sf 6.11 6.62 40.43 $3,671
1,500 to 2,499 sf 7.81 6.62 51.70 $4,697
2,500 sf or larger 8.76 6.62 57.96 $5,264

DRAFT
Tindale Oliver Palm Beach County September 2015 E-5 Impact Fee Update Study
when both ITE Trip Generation reference report (9th edition) and Florida Studies trip
generation rate (TGR) data are available for a particular land use, the data is typically blended
together to increase the sample size and provide a more valid estimate of the average
number of trips generated per unit of development. If no Florida Studies data is available,
TGR data from the ITE reference report is used in the fee calculation.
The trip generation rate for each respective land use is calculated using machine counts that
record daily traffic into and out of the site studied. The traffic count hoses are set at
entrances to residential subdivisions for the residential land uses and at all access points for
non-residential land uses.
The trip length information is obtained through origin-destination surveys that ask
respondents where they came from prior to arriving at the site and where they intended to
go after leaving the site. The results of these surveys were used to estimate average trip
length by land use.
The percent new trip variable is based on assigning each trip collected through the origin-
destination survey process a trip type (primary, secondary, diverted, and captured). The
percent new trip variable is then calculated as 1 minus the percentage of trips that are
captured. Tindale Oliver has published an article entitled, Measuring Travel Characteristics
for Transportation Impact Fees, ITE Journal, April 1991 on the data collecting methodology
for trip characteristics studies.
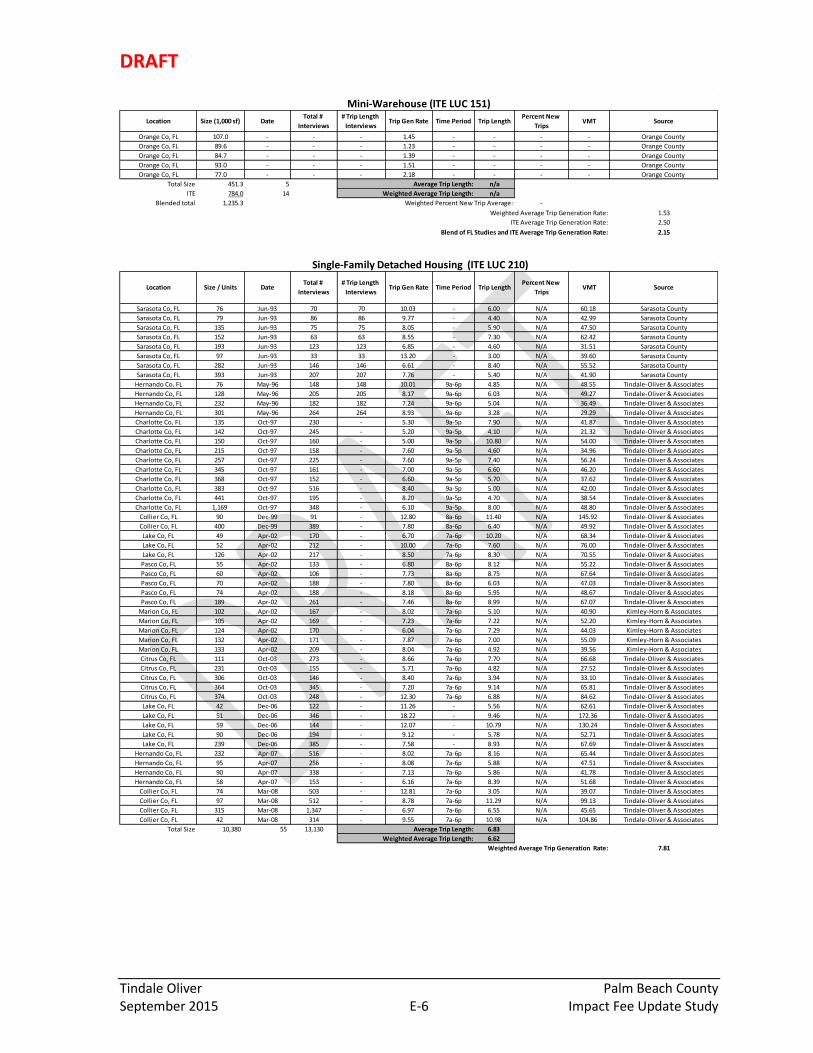
DRAFT
Tindale Oliver Palm Beach County September 2015 E-6 Impact Fee Update Study
Mini-Warehouse (ITE LUC 151)
Orange Co, FL 107.0 - - - 1.45 - - - - Orange County
Orange Co, FL 89.6 - - - 1.23 - - - - Orange County
Orange Co, FL 84.7 - - - 1.39 - - - - Orange County
Orange Co, FL 93.0 - - - 1.51 - - - - Orange County
Orange Co, FL 77.0 - - - 2.18 - - - - Orange County
Total Size 451.3 5 Average Trip Length: n/a
ITE 784.0 14 Weighted Average Trip Length: n/a
Blended total 1,235.3 Weighted Percent New Trip Average: -
Weighted Average Trip Generation Rate: 1.53
ITE Average Trip Generation Rate: 2.50
Blend of FL Studies and ITE Average Trip Generation Rate: 2.15
Trip LengthPercent New
TripsVMT SourceTrip Gen Rate Time PeriodLocation Size (1,000 sf) Date
Total #
Interviews
# Trip Length
Interviews
Single-Family Detached Housing (ITE LUC 210)
Sarasota Co, FL 76 Jun-93 70 70 10.03 - 6.00 N/A 60.18 Sarasota County
Sarasota Co, FL 79 Jun-93 86 86 9.77 - 4.40 N/A 42.99 Sarasota County
Sarasota Co, FL 135 Jun-93 75 75 8.05 - 5.90 N/A 47.50 Sarasota County
Sarasota Co, FL 152 Jun-93 63 63 8.55 - 7.30 N/A 62.42 Sarasota County
Sarasota Co, FL 193 Jun-93 123 123 6.85 - 4.60 N/A 31.51 Sarasota County
Sarasota Co, FL 97 Jun-93 33 33 13.20 - 3.00 N/A 39.60 Sarasota County
Sarasota Co, FL 282 Jun-93 146 146 6.61 - 8.40 N/A 55.52 Sarasota County
Sarasota Co, FL 393 Jun-93 207 207 7.76 - 5.40 N/A 41.90 Sarasota County
Hernando Co, FL 76 May-96 148 148 10.01 9a-6p 4.85 N/A 48.55 Tindale-Oliver & Associates
Hernando Co, FL 128 May-96 205 205 8.17 9a-6p 6.03 N/A 49.27 Tindale-Oliver & Associates
Hernando Co, FL 232 May-96 182 182 7.24 9a-6p 5.04 N/A 36.49 Tindale-Oliver & Associates
Hernando Co, FL 301 May-96 264 264 8.93 9a-6p 3.28 N/A 29.29 Tindale-Oliver & Associates
Charlotte Co, FL 135 Oct-97 230 - 5.30 9a-5p 7.90 N/A 41.87 Tindale-Oliver & Associates
Charlotte Co, FL 142 Oct-97 245 - 5.20 9a-5p 4.10 N/A 21.32 Tindale-Oliver & Associates
Charlotte Co, FL 150 Oct-97 160 - 5.00 9a-5p 10.80 N/A 54.00 Tindale-Oliver & Associates
Charlotte Co, FL 215 Oct-97 158 - 7.60 9a-5p 4.60 N/A 34.96 Tindale-Oliver & Associates
Charlotte Co, FL 257 Oct-97 225 - 7.60 9a-5p 7.40 N/A 56.24 Tindale-Oliver & Associates
Charlotte Co, FL 345 Oct-97 161 - 7.00 9a-5p 6.60 N/A 46.20 Tindale-Oliver & Associates
Charlotte Co, FL 368 Oct-97 152 - 6.60 9a-5p 5.70 N/A 37.62 Tindale-Oliver & Associates
Charlotte Co, FL 383 Oct-97 516 - 8.40 9a-5p 5.00 N/A 42.00 Tindale-Oliver & Associates
Charlotte Co, FL 441 Oct-97 195 - 8.20 9a-5p 4.70 N/A 38.54 Tindale-Oliver & Associates
Charlotte Co, FL 1,169 Oct-97 348 - 6.10 9a-5p 8.00 N/A 48.80 Tindale-Oliver & Associates
Collier Co, FL 90 Dec-99 91 - 12.80 8a-6p 11.40 N/A 145.92 Tindale-Oliver & Associates
Collier Co, FL 400 Dec-99 389 - 7.80 8a-6p 6.40 N/A 49.92 Tindale-Oliver & Associates
Lake Co, FL 49 Apr-02 170 - 6.70 7a-6p 10.20 N/A 68.34 Tindale-Oliver & Associates
Lake Co, FL 52 Apr-02 212 - 10.00 7a-6p 7.60 N/A 76.00 Tindale-Oliver & Associates
Lake Co, FL 126 Apr-02 217 - 8.50 7a-6p 8.30 N/A 70.55 Tindale-Oliver & Associates
Pasco Co, FL 55 Apr-02 133 - 6.80 8a-6p 8.12 N/A 55.22 Tindale-Oliver & Associates
Pasco Co, FL 60 Apr-02 106 - 7.73 8a-6p 8.75 N/A 67.64 Tindale-Oliver & Associates
Pasco Co, FL 70 Apr-02 188 - 7.80 8a-6p 6.03 N/A 47.03 Tindale-Oliver & Associates
Pasco Co, FL 74 Apr-02 188 - 8.18 8a-6p 5.95 N/A 48.67 Tindale-Oliver & Associates
Pasco Co, FL 189 Apr-02 261 - 7.46 8a-6p 8.99 N/A 67.07 Tindale-Oliver & Associates
Marion Co, FL 102 Apr-02 167 - 8.02 7a-6p 5.10 N/A 40.90 Kimley-Horn & Associates
Marion Co, FL 105 Apr-02 169 - 7.23 7a-6p 7.22 N/A 52.20 Kimley-Horn & Associates
Marion Co, FL 124 Apr-02 170 - 6.04 7a-6p 7.29 N/A 44.03 Kimley-Horn & Associates
Marion Co, FL 132 Apr-02 171 - 7.87 7a-6p 7.00 N/A 55.09 Kimley-Horn & Associates
Marion Co, FL 133 Apr-02 209 - 8.04 7a-6p 4.92 N/A 39.56 Kimley-Horn & Associates
Citrus Co, FL 111 Oct-03 273 - 8.66 7a-6p 7.70 N/A 66.68 Tindale-Oliver & Associates
Citrus Co, FL 231 Oct-03 155 - 5.71 7a-6p 4.82 N/A 27.52 Tindale-Oliver & Associates
Citrus Co, FL 306 Oct-03 146 - 8.40 7a-6p 3.94 N/A 33.10 Tindale-Oliver & Associates
Citrus Co, FL 364 Oct-03 345 - 7.20 7a-6p 9.14 N/A 65.81 Tindale-Oliver & Associates
Citrus Co, FL 374 Oct-03 248 - 12.30 7a-6p 6.88 N/A 84.62 Tindale-Oliver & Associates
Lake Co, FL 42 Dec-06 122 - 11.26 - 5.56 N/A 62.61 Tindale-Oliver & Associates
Lake Co, FL 51 Dec-06 346 - 18.22 - 9.46 N/A 172.36 Tindale-Oliver & Associates
Lake Co, FL 59 Dec-06 144 - 12.07 - 10.79 N/A 130.24 Tindale-Oliver & Associates
Lake Co, FL 90 Dec-06 194 - 9.12 - 5.78 N/A 52.71 Tindale-Oliver & Associates
Lake Co, FL 239 Dec-06 385 - 7.58 - 8.93 N/A 67.69 Tindale-Oliver & Associates
Hernando Co, FL 232 Apr-07 516 - 8.02 7a-6p 8.16 N/A 65.44 Tindale-Oliver & Associates
Hernando Co, FL 95 Apr-07 256 - 8.08 7a-6p 5.88 N/A 47.51 Tindale-Oliver & Associates
Hernando Co, FL 90 Apr-07 338 - 7.13 7a-6p 5.86 N/A 41.78 Tindale-Oliver & Associates
Hernando Co, FL 58 Apr-07 153 - 6.16 7a-6p 8.39 N/A 51.68 Tindale-Oliver & Associates
Collier Co, FL 74 Mar-08 503 - 12.81 7a-6p 3.05 N/A 39.07 Tindale-Oliver & Associates
Collier Co, FL 97 Mar-08 512 - 8.78 7a-6p 11.29 N/A 99.13 Tindale-Oliver & Associates
Collier Co, FL 315 Mar-08 1,347 - 6.97 7a-6p 6.55 N/A 45.65 Tindale-Oliver & Associates
Collier Co, FL 42 Mar-08 314 - 9.55 7a-6p 10.98 N/A 104.86 Tindale-Oliver & Associates
Total Size 10,380 55 13,130 Average Trip Length: 6.83
Weighted Average Trip Length: 6.62
Weighted Average Trip Generation Rate: 7.81
VMT SourceLocation Size / UnitsPercent New
TripsDate
Total #
Interviews
# Trip Length
InterviewsTrip Gen Rate Time Period Trip Length
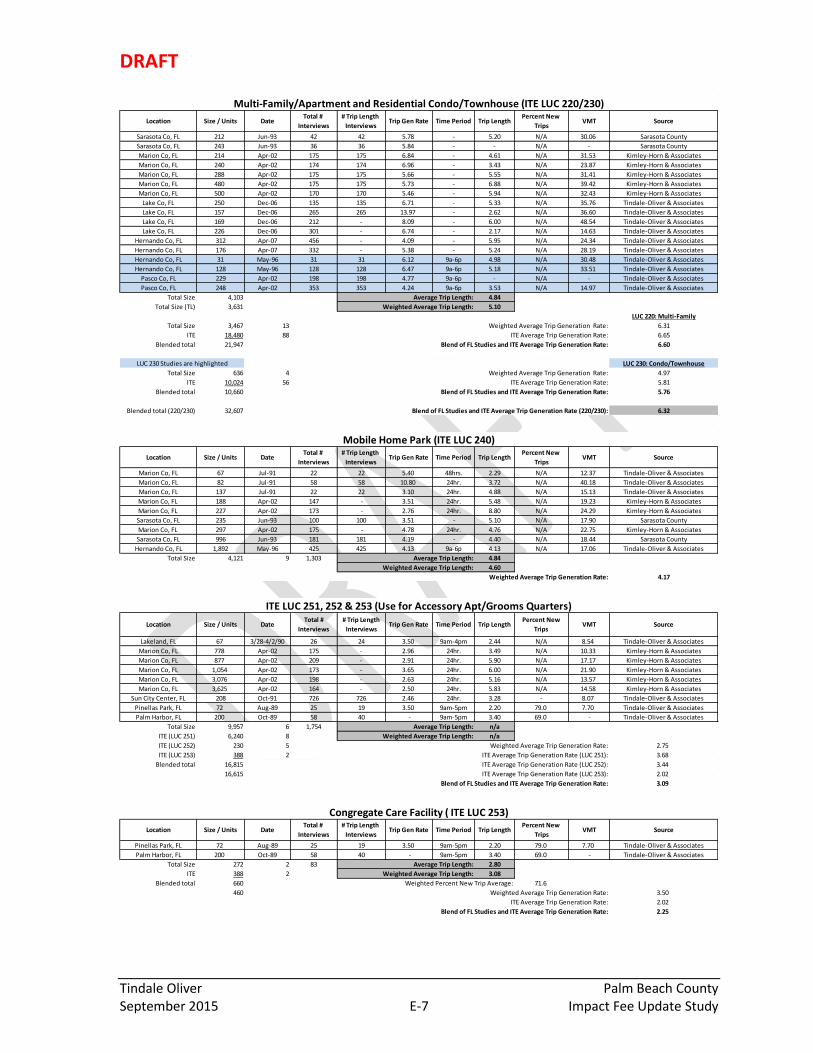
DRAFT
Tindale Oliver Palm Beach County September 2015 E-7 Impact Fee Update Study
Multi-Family/Apartment and Residential Condo/Townhouse (ITE LUC 220/230)
Sarasota Co, FL 212 Jun-93 42 42 5.78 - 5.20 N/A 30.06 Sarasota County
Sarasota Co, FL 243 Jun-93 36 36 5.84 - - N/A - Sarasota County
Marion Co, FL 214 Apr-02 175 175 6.84 - 4.61 N/A 31.53 Kimley-Horn & Associates
Marion Co, FL 240 Apr-02 174 174 6.96 - 3.43 N/A 23.87 Kimley-Horn & Associates
Marion Co, FL 288 Apr-02 175 175 5.66 - 5.55 N/A 31.41 Kimley-Horn & Associates
Marion Co, FL 480 Apr-02 175 175 5.73 - 6.88 N/A 39.42 Kimley-Horn & Associates
Marion Co, FL 500 Apr-02 170 170 5.46 - 5.94 N/A 32.43 Kimley-Horn & Associates
Lake Co, FL 250 Dec-06 135 135 6.71 - 5.33 N/A 35.76 Tindale-Oliver & Associates
Lake Co, FL 157 Dec-06 265 265 13.97 - 2.62 N/A 36.60 Tindale-Oliver & Associates
Lake Co, FL 169 Dec-06 212 - 8.09 - 6.00 N/A 48.54 Tindale-Oliver & Associates
Lake Co, FL 226 Dec-06 301 - 6.74 - 2.17 N/A 14.63 Tindale-Oliver & Associates
Hernando Co, FL 312 Apr-07 456 - 4.09 - 5.95 N/A 24.34 Tindale-Oliver & Associates
Hernando Co, FL 176 Apr-07 332 - 5.38 - 5.24 N/A 28.19 Tindale-Oliver & Associates
Hernando Co, FL 31 May-96 31 31 6.12 9a-6p 4.98 N/A 30.48 Tindale-Oliver & Associates
Hernando Co, FL 128 May-96 128 128 6.47 9a-6p 5.18 N/A 33.51 Tindale-Oliver & Associates
Pasco Co, FL 229 Apr-02 198 198 4.77 9a-6p - N/A - Tindale-Oliver & Associates
Pasco Co, FL 248 Apr-02 353 353 4.24 9a-6p 3.53 N/A 14.97 Tindale-Oliver & Associates
Total Size 4,103 Average Trip Length: 4.84
Total Size (TL) 3,631 Weighted Average Trip Length: 5.10
LUC 220: Multi-Family
Total Size 3,467 13 Weighted Average Trip Generation Rate: 6.31
ITE 18,480 88 ITE Average Trip Generation Rate: 6.65
Blended total 21,947 Blend of FL Studies and ITE Average Trip Generation Rate: 6.60
LUC 230: Condo/Townhouse
Total Size 636 4 Weighted Average Trip Generation Rate: 4.97
ITE 10,024 56 ITE Average Trip Generation Rate: 5.81
Blended total 10,660 Blend of FL Studies and ITE Average Trip Generation Rate: 5.76
Blended total (220/230) 32,607 Blend of FL Studies and ITE Average Trip Generation Rate (220/230): 6.32
Trip Gen Rate Time Period Trip LengthPercent New
TripsLocation Size / Units Date
Total #
Interviews
LUC 230 Studies are highlighted
Source# Trip Length
InterviewsVMT
Mobile Home Park (ITE LUC 240)
Marion Co, FL 67 Jul-91 22 22 5.40 48hrs. 2.29 N/A 12.37 Tindale-Oliver & Associates
Marion Co, FL 82 Jul-91 58 58 10.80 24hr. 3.72 N/A 40.18 Tindale-Oliver & Associates
Marion Co, FL 137 Jul-91 22 22 3.10 24hr. 4.88 N/A 15.13 Tindale-Oliver & Associates
Marion Co, FL 188 Apr-02 147 - 3.51 24hr. 5.48 N/A 19.23 Kimley-Horn & Associates
Marion Co, FL 227 Apr-02 173 - 2.76 24hr. 8.80 N/A 24.29 Kimley-Horn & Associates
Sarasota Co, FL 235 Jun-93 100 100 3.51 - 5.10 N/A 17.90 Sarasota County
Marion Co, FL 297 Apr-02 175 - 4.78 24hr. 4.76 N/A 22.75 Kimley-Horn & Associates
Sarasota Co, FL 996 Jun-93 181 181 4.19 - 4.40 N/A 18.44 Sarasota County
Hernando Co, FL 1,892 May-96 425 425 4.13 9a-6p 4.13 N/A 17.06 Tindale-Oliver & Associates
Total Size 4,121 9 1,303 Average Trip Length: 4.84
Weighted Average Trip Length: 4.60
Weighted Average Trip Generation Rate: 4.17
Total #
Interviews
# Trip Length
InterviewsTrip Gen Rate VMT SourceTime Period Trip Length
Percent New
TripsLocation Size / Units Date
ITE LUC 251, 252 & 253 (Use for Accessory Apt/Grooms Quarters)
Lakeland, FL 67 3/28-4/2/90 26 24 3.50 9am-4pm 2.44 N/A 8.54 Tindale-Oliver & Associates
Marion Co, FL 778 Apr-02 175 - 2.96 24hr. 3.49 N/A 10.33 Kimley-Horn & Associates
Marion Co, FL 877 Apr-02 209 - 2.91 24hr. 5.90 N/A 17.17 Kimley-Horn & Associates
Marion Co, FL 1,054 Apr-02 173 - 3.65 24hr. 6.00 N/A 21.90 Kimley-Horn & Associates
Marion Co, FL 3,076 Apr-02 198 - 2.63 24hr. 5.16 N/A 13.57 Kimley-Horn & Associates
Marion Co, FL 3,625 Apr-02 164 - 2.50 24hr. 5.83 N/A 14.58 Kimley-Horn & Associates
Sun City Center, FL 208 Oct-91 726 726 2.46 24hr. 3.28 - 8.07 Tindale-Oliver & Associates
Pinellas Park, FL 72 Aug-89 25 19 3.50 9am-5pm 2.20 79.0 7.70 Tindale-Oliver & Associates
Palm Harbor, FL 200 Oct-89 58 40 - 9am-5pm 3.40 69.0 - Tindale-Oliver & Associates
Total Size 9,957 6 1,754 Average Trip Length: n/a
ITE (LUC 251) 6,240 8 Weighted Average Trip Length: n/a
ITE (LUC 252) 230 5 Weighted Average Trip Generation Rate: 2.75
ITE (LUC 253) 388 2 ITE Average Trip Generation Rate (LUC 251): 3.68
Blended total 16,815 ITE Average Trip Generation Rate (LUC 252): 3.44
16,615 ITE Average Trip Generation Rate (LUC 253): 2.02
Blend of FL Studies and ITE Average Trip Generation Rate: 3.09
Percent New
TripsLocation Size / Units Date
Total #
Interviews
# Trip Length
InterviewsTrip Gen Rate Time Period Trip Length VMT Source
Congregate Care Facility ( ITE LUC 253)
Pinellas Park, FL 72 Aug-89 25 19 3.50 9am-5pm 2.20 79.0 7.70 Tindale-Oliver & Associates
Palm Harbor, FL 200 Oct-89 58 40 - 9am-5pm 3.40 69.0 - Tindale-Oliver & Associates
Total Size 272 2 83 Average Trip Length: 2.80
ITE 388 2 Weighted Average Trip Length: 3.08
Blended total 660 Weighted Percent New Trip Average: 71.6
460 Weighted Average Trip Generation Rate: 3.50
ITE Average Trip Generation Rate: 2.02
Blend of FL Studies and ITE Average Trip Generation Rate: 2.25
Time Period Trip LengthPercent New
TripsVMT Source
Total #
Interviews
# Trip Length
InterviewsTrip Gen RateLocation Size / Units Date
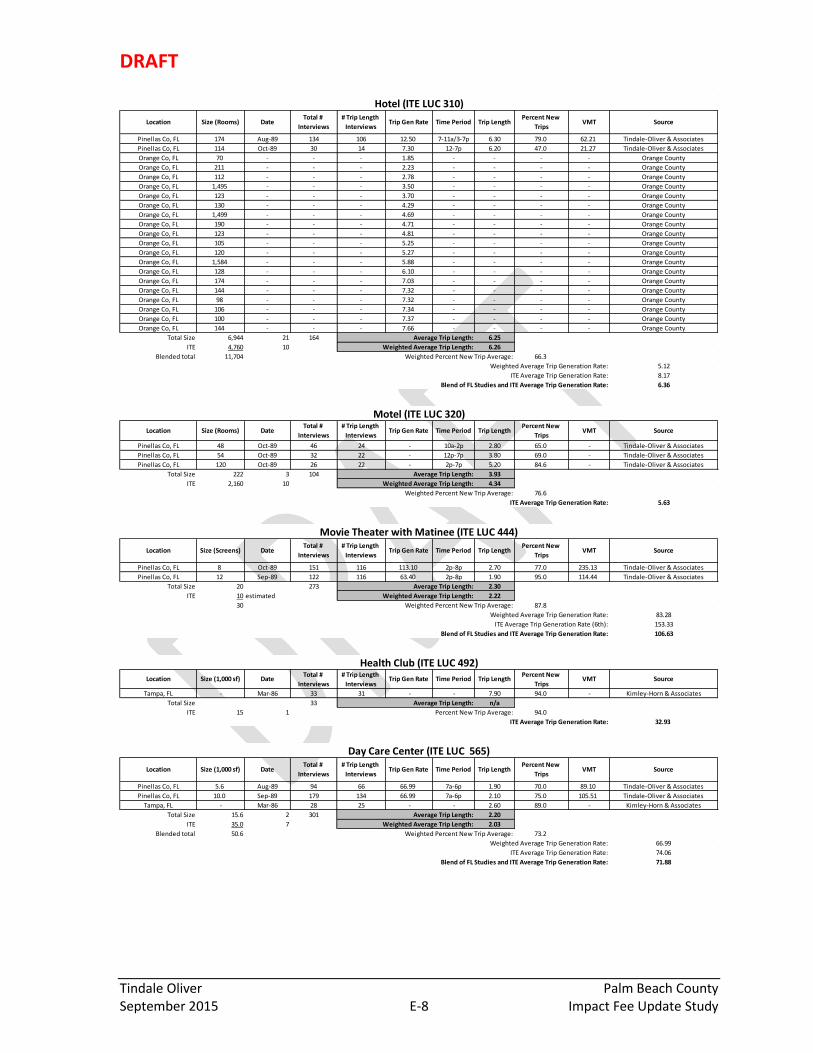
DRAFT
Tindale Oliver Palm Beach County September 2015 E-8 Impact Fee Update Study
Hotel (ITE LUC 310)
Pinellas Co, FL 174 Aug-89 134 106 12.50 7-11a/3-7p 6.30 79.0 62.21 Tindale-Oliver & Associates
Pinellas Co, FL 114 Oct-89 30 14 7.30 12-7p 6.20 47.0 21.27 Tindale-Oliver & Associates
Orange Co, FL 70 - - - 1.85 - - - - Orange County
Orange Co, FL 211 - - - 2.23 - - - - Orange County
Orange Co, FL 112 - - - 2.78 - - - - Orange County
Orange Co, FL 1,495 - - - 3.50 - - - - Orange County
Orange Co, FL 123 - - - 3.70 - - - - Orange County
Orange Co, FL 130 - - - 4.29 - - - - Orange County
Orange Co, FL 1,499 - - - 4.69 - - - - Orange County
Orange Co, FL 190 - - - 4.71 - - - - Orange County
Orange Co, FL 123 - - - 4.81 - - - - Orange County
Orange Co, FL 105 - - - 5.25 - - - - Orange County
Orange Co, FL 120 - - - 5.27 - - - - Orange County
Orange Co, FL 1,584 - - - 5.88 - - - - Orange County
Orange Co, FL 128 - - - 6.10 - - - - Orange County
Orange Co, FL 174 - - - 7.03 - - - - Orange County
Orange Co, FL 144 - - - 7.32 - - - - Orange County
Orange Co, FL 98 - - - 7.32 - - - - Orange County
Orange Co, FL 106 - - - 7.34 - - - - Orange County
Orange Co, FL 100 - - - 7.37 - - - - Orange County
Orange Co, FL 144 - - - 7.66 - - - - Orange County
Total Size 6,944 21 164 Average Trip Length: 6.25
ITE 4,760 10 Weighted Average Trip Length: 6.26
Blended total 11,704 Weighted Percent New Trip Average: 66.3
Weighted Average Trip Generation Rate: 5.12
ITE Average Trip Generation Rate: 8.17
Blend of FL Studies and ITE Average Trip Generation Rate: 6.36
Location Size (Rooms) Date Time PeriodTotal #
Interviews
# Trip Length
InterviewsTrip Gen Rate Trip Length
Percent New
TripsVMT Source
Motel (ITE LUC 320)
Pinellas Co, FL 48 Oct-89 46 24 - 10a-2p 2.80 65.0 - Tindale-Oliver & Associates
Pinellas Co, FL 54 Oct-89 32 22 - 12p-7p 3.80 69.0 - Tindale-Oliver & Associates
Pinellas Co, FL 120 Oct-89 26 22 - 2p-7p 5.20 84.6 - Tindale-Oliver & Associates
Total Size 222 3 104 Average Trip Length: 3.93
ITE 2,160 10 Weighted Average Trip Length: 4.34
Weighted Percent New Trip Average: 76.6
ITE Average Trip Generation Rate: 5.63
Total #
Interviews
# Trip Length
InterviewsTrip Gen Rate Time Period Trip Length
Percent New
TripsLocation Size (Rooms) Date VMT Source
Movie Theater with Matinee (ITE LUC 444)
Pinellas Co, FL 8 Oct-89 151 116 113.10 2p-8p 2.70 77.0 235.13 Tindale-Oliver & Associates
Pinellas Co, FL 12 Sep-89 122 116 63.40 2p-8p 1.90 95.0 114.44 Tindale-Oliver & Associates
Total Size 20 273 Average Trip Length: 2.30
ITE 10 estimated Weighted Average Trip Length: 2.22
30 Weighted Percent New Trip Average: 87.8
Weighted Average Trip Generation Rate: 83.28
ITE Average Trip Generation Rate (6th): 153.33
Blend of FL Studies and ITE Average Trip Generation Rate: 106.63
VMT SourceTrip LengthPercent New
TripsLocation Size (Screens) Date
Total #
Interviews
# Trip Length
InterviewsTrip Gen Rate Time Period
Health Club (ITE LUC 492)
Tampa, FL - Mar-86 33 31 - - 7.90 94.0 - Kimley-Horn & Associates
Total Size 33 Average Trip Length: n/a
ITE 15 1 Percent New Trip Average: 94.0
ITE Average Trip Generation Rate: 32.93
Location Size (1,000 sf) Date Time PeriodTotal #
Interviews
# Trip Length
InterviewsTrip Gen Rate Trip Length
Percent New
TripsVMT Source
Day Care Center (ITE LUC 565)
Pinellas Co, FL 5.6 Aug-89 94 66 66.99 7a-6p 1.90 70.0 89.10 Tindale-Oliver & Associates
Pinellas Co, FL 10.0 Sep-89 179 134 66.99 7a-6p 2.10 75.0 105.51 Tindale-Oliver & Associates
Tampa, FL - Mar-86 28 25 - - 2.60 89.0 - Kimley-Horn & Associates
Total Size 15.6 2 301 Average Trip Length: 2.20
ITE 35.0 7 Weighted Average Trip Length: 2.03
Blended total 50.6 Weighted Percent New Trip Average: 73.2
Weighted Average Trip Generation Rate: 66.99
ITE Average Trip Generation Rate: 74.06
Blend of FL Studies and ITE Average Trip Generation Rate: 71.88
Total #
Interviews
# Trip Length
InterviewsTrip Gen Rate Time Period Trip Length
Percent New
TripsLocation Size (1,000 sf) Date VMT Source

DRAFT
Tindale Oliver Palm Beach County September 2015 E-9 Impact Fee Update Study
Nursing Home (ITE LUC 620)
Lakeland, FL 120 Mar-90 74 66 2.86 11a-4p 2.59 89.0 6.59 Tindale-Oliver & Associates
Total Size 120 1 74 Average Trip Length: 2.59
ITE 714 6 Weighted Average Trip Length: 2.59
Blended total 834 Weighted Percent New Trip Average: 89.0
Weighted Average Trip Generation Rate: 2.86
ITE Average Trip Generation Rate: 2.74
Blend of FL Studies and ITE Average Trip Generation Rate: 2.76
VMT SourceTrip LengthPercent New
TripsLocation Size (Beds) Date
Total #
Interviews
# Trip Length
InterviewsTrip Gen Rate Time Period
General Office Building (ITE LUC 710)
Sarasota Co, FL 14.3 Jun-93 14 14 46.85 - 11.30 - 529.41 Sarasota County
Gwinnett Co, GA 98.0 Dec-92 - - 4.30 - 5.40 - - Street Smarts
Gwinnett Co, GA 180.0 Dec-92 - - 3.60 - 5.90 - - Street Smarts
Pinellas Co, FL 187.0 Oct-89 431 388 18.49 7a-5p 6.30 90.0 104.84 Tindale-Oliver & Associates
St. Petersburg, FL 262.8 Sep-89 291 274 - 7a-5p 3.40 94.0 - Tindale-Oliver & Associates
Total Size 742.1 5 736 Average Trip Length: 6.46
ITE 15,522.0 78 Weighted Average Trip Length: 5.15
Weighted Percent New Trip Average: 92.3
Total #
Interviews
# Trip Length
InterviewsTrip Gen Rate Time Period Trip Length
Percent New
TripsLocation Size (1,000 sf) Date VMT Source
IN OUT IN OUT IN OUT IN OUT IN OUT IN OUT TOTAL
Collier Co, FL - Site 1 2.100 35 35 22 22 13 13 70 70 23.33 23.33 11.11 11.11 22.22
Collier Co, FL - Site 2 3.000 40 40 52 52 53 53 145 145 48.33 48.33 16.11 16.11 32.22
Collier Co, FL - Site 3 2.000 28 28 19 21 24 26 71 75 23.67 25.00 11.84 12.50 24.34
Collier Co, FL - Site 4 1.000 30 30 52 52 57 57 139 139 46.33 46.33 46.33 46.33 92.66
Collier Co, FL - Site 5 3.024 31 32 43 43 24 24 98 99 32.67 33.00 10.80 10.91 21.71
Collier Co, FL - Site 6 1.860 22 24 19 17 11 11 52 52 17.33 17.33 9.32 9.32 18.64
Average 17.59 17.71 35.30
Average (excluding Site 4) 11.84 11.99 23.83
AVERAGE AVERAGE (per 1,000 sf)
Medical-Dental Office Building (ITE LUC 720): 10,000 sf or Less
SiteSize
(1,000 sf)
Tues., Jan 11 Wedn., Jan 12 Thur., Jan 13 TOTAL
Medical-Dental Office Building (ITE LUC 720)
Tampa, FL - Mar-86 33 26 - - 6.00 79.0 - Kimley-Horn & Associates
Palm Harbor, FL 14.6 Oct-89 104 76 33.98 9a-5p 6.30 73.0 156.27 Tindale-Oliver & Associates
St. Petersburg, FL - Nov-89 34 30 57.20 9a-4p 1.20 88.0 - Tindale-Oliver & Associates
Hernando Co, FL 58.4 May-96 390 349 28.52 9a-6p 6.47 89.5 165.09 Tindale-Oliver & Associates
Hernando Co, FL 28.0 May-96 202 189 49.75 9a-6p 6.06 93.8 282.64 Tindale-Oliver & Associates
Charlotte Co, FL 11.0 Oct-97 - 186 49.50 9a-5p 4.60 92.1 209.67 Tindale-Oliver & Associates
Charlotte Co, FL 28.0 Oct-97 - 186 31.00 9a-5p 3.60 81.6 91.04 Tindale-Oliver & Associates
Charlotte Co, FL 30.4 Oct-97 - 324 39.80 9a-5p 3.30 83.5 109.68 Tindale-Oliver & Associates
Citrus Co, FL 38.9 Oct-03 - 168 32.26 8-6p 6.80 97.1 213.03 Tindale-Oliver & Associates
Citrus Co, FL 10.0 Nov-03 - 340 40.56 8-630p 6.20 92.4 232.33 Tindale-Oliver & Associates
Citrus Co, FL 5.3 Dec-03 - 20 29.36 8-5p 5.25 95.2 146.78 Tindale-Oliver & Associates
Orange Co, FL 50.6 - - - 26.72 - - - - Orange County
Orange Co, FL 23.5 - - - 16.58 - - - - Orange County
Total Size 298.6 11 763 Average Trip Length: 5.07
ITE 450.0 10 Weighted Average Trip Length: 5.55
Blended total 748.6 Weighted Percent New Trip Average: 88.9
Average Trip Generation Rate: 32.59
ITE Average Trip Generation Rate: 36.13
Blend of FL Studies and ITE Average Trip Generation Rate: 34.72
Total #
Interviews
# Trip Length
InterviewsTrip Gen Rate Time Period VMT SourceTrip Length
Percent New
TripsLocation Size (1,000 sf) Date

DRAFT
Tindale Oliver Palm Beach County September 2015 E-10 Impact Fee Update Study
Figure A-1 Shopping Center (LUC 820) – Florida Curve Trip Length Regression
Source: Regression analysis based on FL Studies data for LUC 820
Shopping Center (ITE LUC 820)
Tampa, FL - Mar-86 527 348 - - - 66.0 - Kimley-Horn & Associates
Tampa, FL - Mar-86 170 - - - 1.70 - - Kimley-Horn & Associates
Tampa, FL - Mar-86 354 269 - - - 76.0 - Kimley-Horn & Associates
Tampa, FL - Mar-86 144 - - - 2.50 - - Kimley-Horn & Associates
St. Petersburg, FL 1,192.0 Aug-89 384 298 - 11a-7p 3.60 78.0 - Tindale-Oliver & Associates
St. Petersburg, FL 132.3 Sep-89 400 368 77.00 10a-7p 1.80 92.0 127.51 Tindale-Oliver & Associates
Largo, FL 425.0 Aug-89 160 120 26.73 10a-6p 2.30 75.0 46.11 Tindale-Oliver & Associates
Dunedin, FL 80.5 Sep-89 276 210 81.48 9a-5p 1.40 76.0 86.69 Tindale-Oliver & Associates
Pinellas Park, FL 696.0 Sep-89 485 388 - 9a-6p 3.20 80.0 - Tindale-Oliver & Associates
Seminole, FL 425.0 Oct-89 674 586 - - - 87.0 - Tindale-Oliver & Associates
Hillsborough Co, FL 134.0 Jul-91 - - - - 1.30 74.0 - Tindale-Oliver & Associates
Hillsborough Co, FL 151.0 Jul-91 - - - - 1.30 73.0 - Tindale-Oliver & Associates
Collier Co, FL - Aug-91 68 64 - - 3.33 94.1 - Tindale-Oliver & Associates
Collier Co, FL - Aug-91 208 154 - - 2.64 74.0 - Tindale-Oliver & Associates
Sarasota/Bradenton, FL 109.0 Sep-92 300 185 - 12a-6p - 61.6 - King Engineering Associates, Inc.
Ocala, FL 133.4 Sep-92 300 192 - 12a-6p - 64.0 - King Engineering Associates, Inc.
Gwinnett Co, GA 99.1 Dec-92 - - 46.00 - 3.20 70.0 103.04 Street Smarts
Gwinnett Co, GA 314.7 Dec-92 - - 27.00 - 8.50 84.0 192.78 Street Smarts
Sarasota Co, FL 110.0 Jun-93 58 58 122.14 - 3.20 - - Sarasota County
Sarasota Co, FL 146.1 Jun-93 65 65 51.53 - 2.80 - - Sarasota County
Sarasota Co, FL 157.5 Jun-93 57 57 79.79 - 3.40 - - Sarasota County
Sarasota Co, FL 191.0 Jun-93 62 62 66.79 - 5.90 - - Sarasota County
Hernando Co, FL 107.8 May-96 608 331 77.60 9a-6p 4.68 54.5 197.85 Tindale-Oliver & Associates
Charlotte Co, FL 88.0 Oct-97 - - 73.50 9a-5p 1.80 57.1 75.56 Tindale-Oliver & Associates
Charlotte Co, FL 191.9 Oct-97 - - 72.00 9a-5p 2.40 50.9 87.97 Tindale-Oliver & Associates
Charlotte Co, FL 51.3 Oct-97 - - 43.00 9a-5p 2.70 51.8 60.08 Tindale-Oliver & Associates
Lake Co, FL 67.8 Apr-01 246 177 102.60 - 3.40 71.2 248.37 Tindale-Oliver & Associates
Lake Co, FL 72.3 Apr-01 444 376 65.30 - 4.50 59.0 173.37 Tindale-Oliver & Associates
Pasco Co, FL 65.6 Apr-02 222 - 145.64 9a-5p 1.46 46.9 99.62 Tindale-Oliver & Associates
Pasco Co, FL 75.8 Apr-02 134 - 38.23 9a-5p 2.36 58.2 52.52 Tindale-Oliver & Associates
Citrus Co, FL 185.0 Oct-03 - 784 55.84 8a-6p 2.40 88.1 118.05 Tindale-Oliver & Associates
Citrus Co, FL 91.3 Nov-03 - 390 54.50 8a-6p 1.60 88.0 76.77 Tindale-Oliver & Associates
Bozeman, MT 104.3 Dec-06 359 359 46.96 - 3.35 49.0 77.08 Tindale-Oliver & Associates
Bozeman, MT 159.9 Dec-06 502 502 56.49 - 1.56 54.0 47.59 Tindale-Oliver & Associates
Bozeman, MT 35.9 Dec-06 329 329 69.30 - 1.39 74.0 71.28 Tindale-Oliver & Associates
Total Size 5,757.5 7,536 Average Trip Length: n/a
Weighted Average Trip Length: n/a
VMTTotal #
Interviews
# Trip Length
InterviewsTrip Gen Rate Time Period Trip Length
Percent New
TripsSourceLocation Size (1,000 sf) Date
0.00
0.50
1.00
1.50
2.00
2.50
3.00
3.50
4.00
0 200 400 600 800 1000 1200 1400 1600
Trip
Le
ngt
h (
Mile
s)
Square Footage

DRAFT
Tindale Oliver Palm Beach County September 2015 E-11 Impact Fee Update Study
Figure A-2 Shopping Center (LUC 820) – Florida Curve Percent New Trips Regression
Source: Regression analysis based on FL Studies data for LUC 820
0%
10%
20%
30%
40%
50%
60%
70%
80%
90%
0 200 400 600 800 1000 1200 1400 1600
Pe
rce
nt
Ne
w T
rip
s
Square Footage
New Car Sales (ITE LUC 841)
St.Petersburg, FL 43.0 Oct-89 152 120 - 9a-5p 4.70 79.0 - Tindale-Oliver & Associates
Clearwater, FL 43.0 Oct-89 136 106 29.40 9a-5p 4.50 78.0 103.19 Tindale-Oliver & Associates
Orange Co, FL 116.7 - - - 22.18 - - - - Orange County
Orange Co, FL 99.8 - - - 13.45 - - - - Orange County
Orange Co, FL 39.1 - - - 10.48 - - - - Orange County
Orange Co, FL 66.3 - - - 28.50 - - - - Orange County
Orange Co, FL 46.7 - - - 40.34 - - - - Orange County
Orange Co, FL 34.4 - - - 23.45 - - - - Orange County
Orange Co, FL 13.8 - - - 35.75 - - - - Orange County
Total Size 459.7 8 288 Average Trip Length: 4.60
ITE 570.0 15 Weighted Average Trip Length: 4.60
Blended total 1,029.7 Weighted Percent New Trip Average: 78.5
Weighted Average Trip Generation Rate: 23.22
ITE Average Trip Generation Rate: 32.30
Blend of FL Studies and ITE Average Trip Generation Rate: 28.25
Total #
Interviews
# Trip Length
InterviewsTrip Gen Rate Time Period Trip Length
Percent New
TripsLocation Size (1,000 sf) Date VMT Source
Service Station w/Convenience Market (ITE LUC 853)
Tampa, FL - Mar-86 72 - - - 2.00 - - Kimley-Horn & Associates
Marion Co, FL 1.1 Jun-91 77 20 544.80 24hr. 0.89 26.0 126.07 Tindale-Oliver & Associates
Marion Co, FL 2.1 Jun-91 66 24 997.60 24hr. 1.67 36.4 606.42 Tindale-Oliver & Associates
Marion Co, FL 4.4 Jun-91 85 25 486.70 48hrs. 1.06 29.4 151.68 Tindale-Oliver & Associates
Collier Co, FL - Aug-91 96 38 - - 1.19 39.6 - Tindale-Oliver & Associates
Collier Co, FL - Aug-91 78 16 - - 1.06 20.5 - Tindale-Oliver & Associates
Tampa, FL 2.3 10/13-15/92 239 74 - 24hr. 1.06 31.1 - Tindale-Oliver & Associates
Ellenton, FL 3.3 10/20-22/92 124 44 - 24hr. 0.96 35.3 - Tindale-Oliver & Associates
Tampa, FL 3.8 11/10-12/92 142 23 - 24hr. 3.13 16.4 - Tindale-Oliver & Associates
Marion Co, FL 2.5 Apr-02 87 - 719.79 24hr. 1.62 32.8 322.19 Kimley-Horn & Associates
Marion Co, FL 2.5 Apr-02 23 - 610.46 24hr. 1.77 11.7 126.61 Kimley-Horn & Associates
Marion Co, FL 3.0 Apr-02 59 - 606.02 24hr. 0.83 32.6 195.00 Kimley-Horn & Associates
Total Size 25.1 9 1,148 Average Trip Length: 1.44
ITE 30.0 10 Weighted Average Trip Length: 1.51
Blended Total 55.1 Weighted Percent New Trip Average: 27.7
45.6 15.6 Average Trip Generation Rate: 639.68
ITE Average Trip Generation Rate: 845.60
Blend of FL Studies and ITE Average Trip Generation Rate: 775.14
VMT SourceTrip Gen Rate Time Period Trip LengthLocation Size (1,000 sf) DateTotal #
Interviews
# Trip Length
Interviews
Percent New
Trips

DRAFT
Tindale Oliver Palm Beach County September 2015 E-12 Impact Fee Update Study
Pharmacy/Drugstore w/Drive-Thru (ITE LUC 880 & 881)
Pasco Co, FL 11.1 Apr-02 138 38 88.97 - 2.05 27.5 50.23 Tindale-Oliver & Associates
Pasco Co, FL 12.0 Apr-02 212 90 122.16 - 2.04 42.5 105.79 Tindale-Oliver & Associates
Pasco Co, FL 15.1 Apr-02 1192 54 97.96 - 2.13 28.1 58.69 Tindale-Oliver & Associates
Total Size 38.2 3 1,542 Average Trip Length: 2.07
ITE 196.0 16 Weighted Average Trip Length: 2.08
Blended total 234.2 Weighted Percent New Trip Average: 32.5
Average Trip Generation Rate: 103.03
ITE Average Trip Generation Rate (LUC 880 / 881): 90.06 / 96.91
Blend of FL Studies and ITE Average Trip Generation Rate: 95.96
SourceTime Period Trip LengthLocation Size (1,000 sf) DateTotal #
Interviews
# Trip Length
InterviewsTrip Gen Rate
Percent New
TripsVMT
Furniture Store (ITE LUC 890)
Largo, FL 15.0 7/28-30/92 64 34 - - 4.63 52.5 - Tindale-Oliver & Associates
Tampa, FL 16.9 Jul-92 68 39 - - 7.38 55.7 - Tindale-Oliver & Associates
Total Size 31.9 2 132 Average Trip Length: 6.01
ITE 897.0 13 Weighted Average Trip Length: 6.09
Weighted Percent New Trip Average: 54.2
ITE Average Trip Generation Rate: 5.06
Location Size (1,000 sf) Date Trip LengthPercent New
TripsVMT Source
Total #
InterviewsTime Period
# Trip Length
InterviewsTrip Gen Rate
Drive-In Bank (ITE LUC 912)
Tampa, FL - Mar-86 77 - - - 2.40 - - Kimley-Horn & Associates
Tampa, FL - Mar-86 211 - - - - 54.0 - Kimley-Horn & Associates
Clearwater, FL 0.4 Aug-89 113 52 - 9a-6p 5.20 46.0 - Tindale-Oliver & Associates
Largo, FL 2.0 Sep-89 129 94 - - 1.60 73.0 - Tindale-Oliver & Associates
Seminole, FL 4.5 Oct-89 - - - - - - - Tindale-Oliver & Associates
Marion Co, FL 2.3 Jun-91 69 29 - 24hr. 1.33 42.0 - Tindale-Oliver & Associates
Marion Co, FL 3.1 Jun-91 47 32 - 24hr. 1.75 68.1 - Tindale-Oliver & Associates
Marion Co, FL 2.5 Jul-91 57 26 - 48hrs. 2.70 45.6 - Tindale-Oliver & Associates
Collier Co, FL - Aug-91 162 96 - 24hr. 0.88 59.3 - Tindale-Oliver & Associates
Collier Co, FL - Aug-91 116 54 - - 1.58 46.6 - Tindale-Oliver & Associates
Collier Co, FL - Aug-91 142 68 - - 2.08 47.9 - Tindale-Oliver & Associates
Hernando Co, FL 5.4 May-96 164 41 - 9a-6p 2.77 24.7 - Tindale-Oliver & Associates
Marion Co, FL 2.4 Apr-02 70 - - 24hr. 3.55 54.6 - Kimley-Horn & Associates
Marion Co, FL 2.7 May-02 50 - 246.66 24hr. 2.66 40.5 265.44 Kimley-Horn & Associates
Total Size 25.2 9 1,407 Average Trip Length: 2.38
ITE 21.0 7 Weighted Average Trip Length: 2.46
Blended total 46.2 Weighted Percent New Trip Average: 46.2
23.7 Weighted Average Trip Generation Rate: 246.66
ITE Average Trip Generation Rate: 148.15
Blend of FL Studies and ITE Average Trip Generation Rate: 159.34
Total #
Interviews
# Trip Length
InterviewsTrip Gen Rate Time Period Trip Length
Percent New
TripsLocation Size (1,000 sf) Date VMT Source
Quality Restaurant (ITE LUC 931)
Tampa, FL - Mar-86 76 62 - - 2.10 82.0 - Kimley-Horn & Associates
St. Petersburg, FL 7.5 Oct-89 177 154 - 11a-2p/4-8p 3.50 87.0 - Tindale-Oliver & Associates
Clearwater, FL 8.0 Oct-89 60 40 110.63 10a-2p/5-9p 2.80 67.0 207.54 Tindale-Oliver & Associates
Total Size 15.5 2 313 Average Trip Length: 2.80
ITE 135.0 15 Weighted Average Trip Length: 3.14
Blended total 150.5 Weighted Percent New Trip Average: 76.7
143.0 Weighted Average Trip Generation Rate: 110.63
ITE Average Trip Generation Rate: 89.95
Blend of FL Studies and ITE Average Trip Generation Rate: 91.10
Time Period Trip LengthPercent New
TripsVMT Source
Total #
Interviews
# Trip Length
InterviewsTrip Gen RateLocation Size (1,000 sf) Date

DRAFT
Tindale Oliver Palm Beach County September 2015 E-13 Impact Fee Update Study
High-Turnover Restaurant (ITE LUC 932)
Hernando Co, FL 6.2 May-96 242 175 187.51 9a-6p 2.76 72.5 375.00 Tindale-Oliver & Associates
Hernando Co, FL 8.2 May-96 154 93 102.71 9a-6p 4.15 60.2 256.43 Tindale-Oliver & Associates
St. Petersburg, FL 5.0 Oct-89 74 68 132.60 1130-7p 2.00 92.0 243.98 Tindale-Oliver & Associates
Kenneth City, FL 5.2 Oct-89 236 176 127.88 4p-730p 2.30 75.0 220.59 Tindale-Oliver & Associates
Pasco Co, FL 5.2 Apr-02 114 88 82.47 9a-6p 3.72 77.2 236.81 Tindale-Oliver & Associates
Pasco Co, FL 5.8 Apr-02 182 102 116.97 9a-6p 3.49 56.0 228.77 Tindale-Oliver & Associates
Orange Co, FL 8.9 - - - 52.69 - - - - Orange County
Orange Co, FL 11.3 - - - 62.12 - - - - Orange County
Orange Co, FL 6.7 - - - 82.58 - - - - Orange County
Orange Co, FL 11.4 - - - 91.67 - - - - Orange County
Orange Co, FL 11.3 - - - 95.33 - - - - Orange County
Orange Co, FL 7.2 - - - 98.06 - - - - Orange County
Orange Co, FL 5.5 - - - 100.18 - - - - Orange County
Orange Co, FL 9.7 - - - 105.84 - - - - Orange County
Orange Co, FL 4.6 - - - 129.23 - - - - Orange County
Orange Co, FL 7.0 - - - 126.40 - - - - Orange County
Orange Co, FL 9.7 - - - 132.32 - - - - Orange County
Orange Co, FL 5.0 - - - 135.68 - - - - Orange County
Orange Co, FL 5.6 - - - 145.59 - - - - Orange County
Orange Co, FL 7.4 - - - 147.44 - - - - Orange County
Orange Co, FL 5.9 - - - 147.74 - - - - Orange County
Total Size 152.8 21 1,102 Average Trip Length: 3.07
ITE 98.0 14 Weighted Average Trip Length: 3.17
Blended total 250.8 Weighted Percent New Trip Average: 70.8
Weighted Average Trip Generation Rate: 109.84
ITE Average Trip Generation Rate: 127.15
Blend of FL Studies and ITE Average Trip Generation Rate: 116.60
Trip LengthPercent New
TripsVMT SourceDate
Total #
Interviews
# Trip Length
InterviewsTrip Gen Rate Time PeriodLocation Size (1,000 sf)
Fast Food Restaurant w/Drive Thru (ITE LUC 934)
Tampa, FL - Mar-86 61 - - - 2.70 - - Kimley-Horn & Associates
Tampa, FL - Mar-86 306 - - - - 65.0 - Kimley-Horn & Associates
Pinellas Co, FL 2.20 Aug-89 81 48 502.80 11a-2p 1.70 59.0 504.31 Tindale-Oliver & Associates
Pinellas Co, FL 4.30 Oct-89 456 260 660.40 1 day 2.30 57.0 865.78 Tindale-Oliver & Associates
Tarpon Springs, FL - Oct-89 233 114 - 7a-7p 3.60 49.0 - Tindale-Oliver & Associates
Marion Co, FL 1.60 Jun-91 60 32 962.50 48hrs. 0.91 53.3 466.84 Tindale-Oliver & Associates
Marion Co, FL 4.00 Jun-91 75 46 625.00 48hrs. 1.54 61.3 590.01 Tindale-Oliver & Associates
Collier Co, FL - Aug-91 66 44 - - 1.91 66.7 - Tindale-Oliver & Associates
Collier Co, FL - Aug-91 118 40 - - 1.17 33.9 - Tindale-Oliver & Associates
Hernando Co, FL 5.43 May-96 136 82 311.83 9a-6p 1.68 60.2 315.27 Tindale-Oliver & Associates
Hernando Co, FL 3.13 May-96 168 82 547.34 9a-6p 1.59 48.8 425.04 Tindale-Oliver & Associates
Lake Co, FL 2.20 Apr-01 376 252 934.30 - 2.50 74.6 1742.47 Tindale-Oliver & Associates
Lake Co, FL 3.20 Apr-01 171 182 654.90 - 4.10 47.8 - Tindale-Oliver & Associates
Lake Co, FL 3.80 Apr-01 188 137 353.70 - 3.30 70.8 826.38 Tindale-Oliver & Associates
Pasco Co, FL 2.66 Apr-02 100 46 283.12 9a-6p 5.10 46.0 - Tindale-Oliver & Associates
Pasco Co, FL 2.96 Apr-02 486 164 515.32 9a-6p 2.72 33.7 472.92 Tindale-Oliver & Associates
Pasco Co, FL 4.42 Apr-02 168 120 759.24 9a-6p 1.89 71.4 1024.99 Tindale-Oliver & Associates
Orange Co, FL 8.93 - - - 377.00 - - - - Orange County
Total Size 48.8 13 4,463 Average Trip Length: 2.42
ITE 63.0 21 Weighted Average Trip Length: 2.05
Blended total 111.8 Weighted Percent New Trip Average: 57.9
34.0 Weighted Average Trip Generation Rate: 530.19
ITE Average Trip Generation Rate: 496.12
Blend of FL Studies and ITE Average Trip Generation Rate: 511.00
Total #
Interviews
# Trip Length
InterviewsTrip Gen Rate Time Period Trip Length
Percent New
TripsVMT SourceLocation Size (1,000 sf) Date
Automobile Care Center (ITE LUC 942)
Jacksonville, FL 2.3 2/3-4/90 124 94 - 9a-5p 3.07 76.0 - Tindale-Oliver & Associates
Jacksonville, FL 2.3 2/3-4/90 110 74 - 9a-5p 2.96 67.0 - Tindale-Oliver & Associates
Jacksonville, FL 2.4 2/3-4/90 132 87 - 9a-5p 2.32 66.0 - Tindale-Oliver & Associates
Lakeland, FL 5.2 Mar-90 24 14 - 9a-4p 1.36 59.0 - Tindale-Oliver & Associates
Largo, FL 5.5 Sep-89 34 30 37.64 9a-5p 2.40 88.0 79.50 Tindale-Oliver & Associates
Orange Co, FL 25.0 Nov-92 41 39 - 2-6p 4.60 - - LCE, Inc.
Lakeland, FL - Mar-90 54 42 - 9a-4p 2.44 78.0 - Tindale-Oliver & Associates
Total Size 42.6 6 519 Average Trip Length: 2.74
ITE 102.0 6 Weighted Average Trip Length: 3.62
Blended total 144.6 Weighted Percent New Trip Average: 72.2
107.5 Weighted Average Trip Generation Rate: 37.64
ITE Average Trip Generation Rate: 31.10
Blend of FL Studies and ITE Average Trip Generation Rate: 31.43
Time Period Trip LengthPercent New
TripsVMT Source
Total #
Interviews
# Trip Length
InterviewsTrip Gen RateLocation Size (1,000 sf) Date

DRAFT
Tindale Oliver Palm Beach County September 2015 E-14 Impact Fee Update Study
Service Station with and w/o Car Wash (ITE LUC 944 & 946)
Largo, FL 0.6 Nov-89 70 14 - 8am-5pm 1.90 23.0 - Tindale-Oliver & Associates
Collier County, FL - Aug-91 168 40 - - 1.01 23.8 - Tindale-Oliver & Associates
Total Size 0.6 1 238 Average Trip Length: 1.46
ITE LUC 944 (vfp) 48.0 6 Weighted Average Trip Length: 1.90
ITE LUC 946 (vfp) 120.0 10 Weighted Percent New Trip Average: 23.0
ITE Average Trip Generation Rate - per fuel position (LUC 944): 168.56
ITE Average Trip Generation Rate - per fuel position (LUC 946): 152.84
Blended ITE Average Trip Generation Rate - per fuel position: 157.33
Time Period Trip LengthPercent New
TripsVMT SourceLocation Size (1,000 sf) Date
Total #
Interviews
# Trip Length
InterviewsTrip Gen Rate
Self-Service Car Wash (ITE LUC 947)
Largo, FL 10 Nov-89 111 84 - 8am-5pm 2.00 76.0 - Tindale-Oliver & Associates
Clearwater, FL - Nov-89 177 108 - 10am-5pm 1.30 61.0 - Tindale-Oliver & Associates
Collier, FL 11 Dec-09 304 - 30.24 - 2.50 57.0 - Tindale-Oliver & Associates
Collier, FL 8 Jan-09 186 - 22.75 - 1.96 72.0 - Tindale-Oliver & Associates
Total Size 29 3 778 Average Trip Length: 1.94
Total Size (TGR) 19 2 Weighted Average Trip Length: 2.18
ITE 5 1 Weighted Percent New Trip Average: 67.7
Blended total 24 Weighted Average Trip Generation Rate: 27.09
ITE Average Trip Generation Rate: 108.00
Blend of FL Studies and ITE Average Trip Generation Rate: 43.94
Location Size (Bays) VMT SourceTime Period Trip LengthPercent New
TripsDate
Total #
Interviews
# Trip Length
InterviewsTrip Gen Rate
DRAFT
APPENDIX F Transportation Impact Fee – Cost Component
Calculations

DRAFT
Tindale Oliver Palm Beach County September 2015 F-1 Impact Fee Update Study
Transportation Impact Fee: Cost Component
This appendix presents the detailed calculations for the cost component of the transportation
impact fee update. Backup data and assumptions are provided for all cost variables (for
county and state roads), including:
Design
Right-of-Way
Construction
Construction Engineering/Inspection
Roadway Capacity
Urban Design vs. Rural Design
Due to a lack of roadway construction data for rural-design roadways, the cost per lane mile
for these types of roads was calculated using an adjustment factor. This factor was based on
the rural-to-urban design cost ratio from the most recent District 7 Long Range Estimates
(LRE) provided by FDOT because this information was not readily available for FDOT District
4. Based on the LRE, the cost for rural-design roadway capacity expansion (new road
construction or lane addition) is approximately 81 percent of the cost of urban-design
roadway improvements. For all subsequent tables (for county and state roadways), costs are
presented for urban-design roadways, with the rural-design roadway costs being calculated
using the cost ratio from Table F-1.
Table F-1 Urban / Rural Design Cost Factor
Source: FDOT District 7 Long Range Estimates, 2014; this data was not readily available for FDOT District 4
Rural Design Urban Design Ratio
0-2 Lanes $2,534,872 $3,660,722 69%
0-4 Lanes $2,060,744 $2,583,635 80%
0-6 Lanes $1,750,755 $2,105,746 83%
2-4 Lanes $2,946,063 $3,386,132 87%
4-6 Lanes $3,300,893 $3,782,969 87%
Average $2,518,665 $3,103,841 81%
ImprovementCost per Lane Mile

DRAFT
Tindale Oliver Palm Beach County September 2015 F-2 Impact Fee Update Study
Design
County Roadways
The design cost factor for county roads was estimated as a percentage of the construction
cost per lane mile. This factor was determined through a review of the design-to-construction
cost ratios from recently completed and bid improvements in Palm Beach County and from
previously completed impact fee studies throughout Florida. For local improvements, the
design-to-construction ratios ranged from 4 percent to 33 percent with a weighted average
of 13 percent. For county roadways from throughout Florida, the design factors ranged from
6 percent to 14 percent, with a weighted average of 10 percent. For purposes of this update
study, the design cost for county roads was calculated at 13 percent of the construction cost
per lane mile based on the local and statewide data (see Tables F-10 and F-11 for additional
information).
Table F-2 Design Cost Adjustment – County Roads
(1) Design cost is estimated at 13% of construction cost based on recent local projects
(Table F-10) and recent TIF studies (Table F-11, Item a); construction cost is shown in Table F-6
(2) Source: Appendix F, Table F-18 (Items c and d) (3) Design cost per lane mile (Item 1) multiplied by the associated section design weight
(Item 2) for each design type and added together All figures rounded to nearest $1,000
State Roadways
The design cost factor for state roads was estimated as a percentage of the construction cost
per lane mile. This factor was determined through a review of the design-to-construction
cost ratios for state road unit costs in previously completed impact fee studies throughout
Florida. For state roadways, the design factors ranged from 10 percent to 14 percent, with a
weighted average of 11 percent. For purposes of this update study, the design cost for state
roads was calculated at 11 percent of the construction cost per lane mile. See Table F-11 for
additional information.
Road TypeDesign Cost per
Lane Mile(1)
Section Design
Distribution(2)
Weighted
Design Cost per
Lane Mile(3)
Urban Design $234,000 88% $206,000
Rural Design $190,000 12% $23,000
Weighted Average Design Cost per Lane Mile $229,000
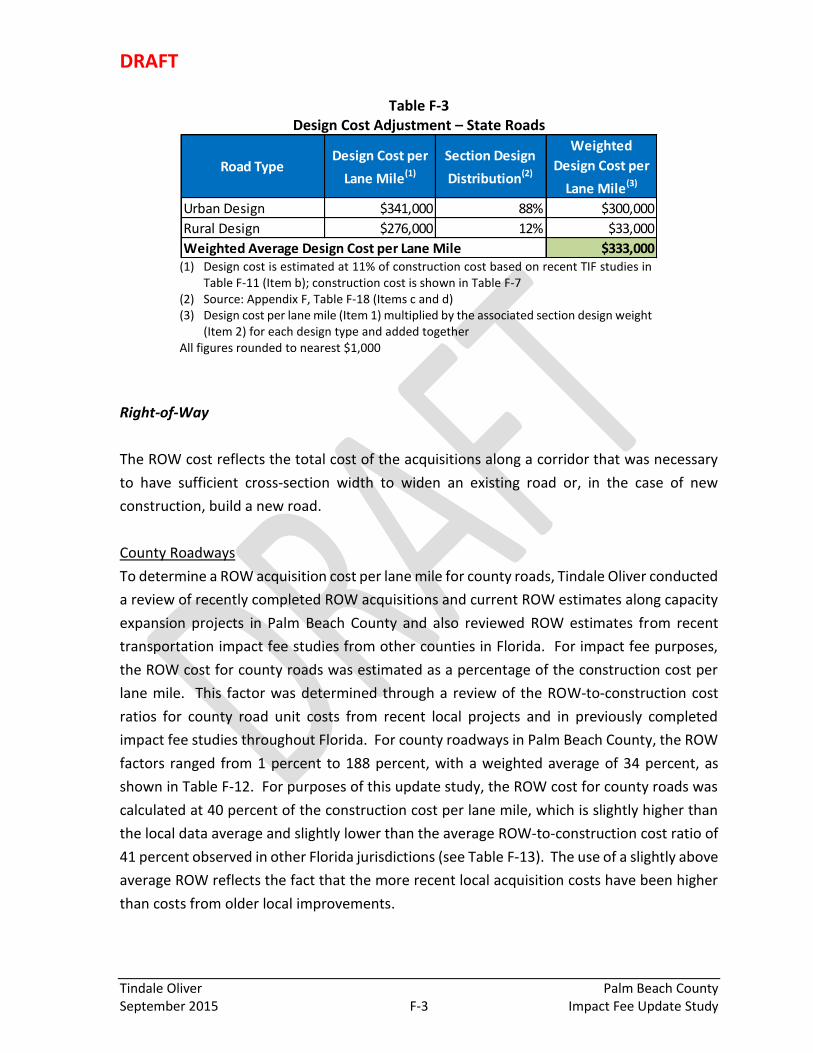
DRAFT
Tindale Oliver Palm Beach County September 2015 F-3 Impact Fee Update Study
Table F-3 Design Cost Adjustment – State Roads
(1) Design cost is estimated at 11% of construction cost based on recent TIF studies in
Table F-11 (Item b); construction cost is shown in Table F-7 (2) Source: Appendix F, Table F-18 (Items c and d) (3) Design cost per lane mile (Item 1) multiplied by the associated section design weight
(Item 2) for each design type and added together All figures rounded to nearest $1,000
Right-of-Way
The ROW cost reflects the total cost of the acquisitions along a corridor that was necessary
to have sufficient cross-section width to widen an existing road or, in the case of new
construction, build a new road.
County Roadways
To determine a ROW acquisition cost per lane mile for county roads, Tindale Oliver conducted
a review of recently completed ROW acquisitions and current ROW estimates along capacity
expansion projects in Palm Beach County and also reviewed ROW estimates from recent
transportation impact fee studies from other counties in Florida. For impact fee purposes,
the ROW cost for county roads was estimated as a percentage of the construction cost per
lane mile. This factor was determined through a review of the ROW-to-construction cost
ratios for county road unit costs from recent local projects and in previously completed
impact fee studies throughout Florida. For county roadways in Palm Beach County, the ROW
factors ranged from 1 percent to 188 percent, with a weighted average of 34 percent, as
shown in Table F-12. For purposes of this update study, the ROW cost for county roads was
calculated at 40 percent of the construction cost per lane mile, which is slightly higher than
the local data average and slightly lower than the average ROW-to-construction cost ratio of
41 percent observed in other Florida jurisdictions (see Table F-13). The use of a slightly above
average ROW reflects the fact that the more recent local acquisition costs have been higher
than costs from older local improvements.
Road TypeDesign Cost per
Lane Mile(1)
Section Design
Distribution(2)
Weighted
Design Cost per
Lane Mile(3)
Urban Design $341,000 88% $300,000
Rural Design $276,000 12% $33,000
Weighted Average Design Cost per Lane Mile $333,000

DRAFT
Tindale Oliver Palm Beach County September 2015 F-4 Impact Fee Update Study
Table F-4 Right-of-Way Cost Adjustment – County Roads
(1) ROW cost is estimated at 40% of construction cost based on recent Palm Beach
County improvements in Table F-12 and recent TIF studies in Table F-13 (Item a); construction cost is shown in Table F-6
(2) Source: Appendix F, Table F-18 (Items c and d) (3) ROW cost per lane mile (Item 1) multiplied by the associated section design weight
(Item 2) for each design type and added together All figures rounded to nearest $1,000
State Roadways
Similar to county roads, the ROW cost for state roads was estimated as a percentage of the
construction cost per lane mile. Given the limited data on ROW costs for state roads in Palm
Beach County and based on experience in other jurisdictions, the ROW cost ratio calculated
for county roads was also applied to state roads. Using this ROW-to-construction ratio of 44
percent, the weighted average ROW cost for state roadways is approximately $1.33 million
per lane mile.
Table F-5 Right-of-Way Cost Adjustment – State Roads
(1) ROW cost is estimated at 44% of construction cost based on recent TIF studies in
Table F-13 (Item b); construction cost is shown in Table F-7 (2) Source: Appendix F, Table F-18 (Items c and d) (3) ROW cost per lane mile (Item 1) multiplied by the associated section design weight
(Item 2) for each design type and added together. All figures rounded to nearest $1,000
Road TypeROW Cost per
Lane Mile(1)
Section Design
Distribution(2)
Weighted ROW
Cost per Lane
Mile(3)
Urban Design $720,000 88% $634,000
Rural Design $583,000 12% $70,000
Weighted Average ROW Cost per Lane Mile $704,000
Road TypeROW Cost per
Lane Mile(1)
Section Design
Distribution(2)
Weighted ROW
Cost per Lane
Mile(3)
Urban Design $1,364,000 88% $1,200,000
Rural Design $1,105,000 12% $133,000
Weighted Average ROW Cost per Lane Mile $1,333,000

DRAFT
Tindale Oliver Palm Beach County September 2015 F-5 Impact Fee Update Study
Construction
County Roadways
A review of construction cost data for recent local county roadway capacity expansion
projects identified 18 recent improvements in Palm Beach County. These improvements had
a weighted average construction cost of approximately $1.81 million per lane mile, as shown
in Table F-14:
Hypoluxo Rd from W. of Lyons Rd to W. of Hagen Ranch Rd
Okeechobee Blvd from Royal Palm Beach High School to E. of FL Turnpike
Haverhill Rd from 45th St to N. of EPB-10 Canal
Jog Rd from Yamato Rd to Clint Moore Rd
Jog Rd/Donald Ross Rd from Hood Rd to 64th Drive N
Alt. A1A from S. of Frederick Small Rd to Center St
Lyons Rd from Glades Rd to Yamato Rd
Hypoluxo Rd from Jog Rd to Military Trail
Lawrence Rd from S. of C. Stanley Weaver Canal to N. of C. Stanley Weaver Canal
45th St from Jog Rd to E. of Haverhill Rd
Jog Rd from S. of 45th St to N. of 45th St
Congress Ave from Lantana Rd to Melaluca Ln
Seminole Pratt Whitney Rd from SR 80 to Sycamore Dr
Seminole Pratt Whitney Rd from S. of M Canal to S. of Orange Blvd
Lyons Rd from N. of West Atlantic Ave to S. of Boynton Beach Blvd
Jog Rd from N. of SR 710 to N. of FL Turnpike
West Atlantic Ave from W. of Lyons Rd to Starkey Rd
60th St N & SR 7 Ext. from E. of Royal Palm Beach Blvd to SR 7
In addition to local data, a review of recently bid projects throughout the state of Florida was
conducted. As shown in Table F-14, a total of 66 additional projects from 16 different
counties provided a weighted average cost per lane mile of $2.17 million per lane mile. When
compared to the statewide bids, the local improvements returned a lower average cost per
lane mile. When the subset of District 4 improvements (including Palm Beach County) was
reviewed separately, the weighted average cost per lane was $1.82 million. Based on this
review and discussions with staff, a county roadway construction cost of $1.80 million per
lane mile was used in the transportation impact fee calculation for county roads with urban
design characteristics. Table F-6 presents the urban and rural design cost estimates, as well

DRAFT
Tindale Oliver Palm Beach County September 2015 F-6 Impact Fee Update Study
as the weighted average construction cost per lane mile for county roads in Palm Beach
County.
Table F-6 Construction Cost Adjustment – County Roads
(1) Source: Table F-14. Rural design is estimated at 81% of urban design costs (see Table
F-1) (2) Source: Appendix F, Table F-18 (Items c and d) (3) Construction cost per lane mile (Item 1) multiplied by the associated section design
weight (Item 2) for each design type and added together. All figures rounded to nearest $1,000
State Roadways
A review of construction cost data for recent local state roadway capacity expansion projects
identified one (1) recent improvement in Palm Beach County. This improvement had a
weighted average construction cost of approximately $7.26 million per lane mile, as shown
in Table F-15:
SR 710/Beeline Highway from W. of Congress Avenue to W. of Australian Ave
In addition to local data, a review of recently bid projects throughout the state of Florida was
conducted. As shown in Table F-15, a total of 59 projects from 30 different counties
estimated a weighted average cost per lane mile of $2.78 million per lane mile (all
improvements are urban section design). Unlike the county road cost data, the local data for
state roads indicated a higher per lane mile cost for Palm Beach County when compared to
the statewide data. The subset of District 4 improvements (including Palm Beach County)
was also reviewed and resulted in an average cost of $3.10 million per lane mile.
Based on this review and discussions with staff, a state roadway construction cost of $3.10
million per lane mile was used in the transportation impact fee calculation for state roads
with urban design characteristics. This reflects the higher local cost and the typical costs from
District 4, but also accounts for the large sample size of improvements throughout the state
to provide a conservative estimate for impact fee planning purposes. Table F-7 presents the
Road Type
Construction
Cost per Lane
Mile(1)
Section Design
Distribution(2)
Weighted
Constr. Cost per
Lane Mile(3)
Urban Design $1,800,000 88% $1,584,000
Rural Design $1,458,000 12% $175,000
Weighted Average Construction Cost per Lane Mile $1,759,000

DRAFT
Tindale Oliver Palm Beach County September 2015 F-7 Impact Fee Update Study
urban and rural design cost estimates, as well as the weighted average construction cost per
lane mile for state roads in Palm Beach County.
Table F-7 Construction Cost Adjustment – State Roads
(1) Source: Table F-15. Rural design is estimated at 81% of urban design costs (2) Source: Appendix F, Table F-18 (Items c and d) (3) Construction cost per lane mile (Item 1) multiplied by the associated section design
weight (Item 2) for each design type and added together. All figures rounded to nearest $1,000
Construction Engineering/Inspection
County Roadways
The CEI cost factor for county roads was estimated as a percentage of the construction cost
per lane mile. Based on a review of recent improvements (as shown in Table F-16) and a
discussion with County Staff, a CEI-to-construction cost factor of 6 percent was used for
purposes of this impact fee update study. This figure is lower than factors observed in other
Florida jurisdictions, but is representative of local cost factors based on input from County
staff. As shown in Table F-8, this resulted is a weighted average CEI cost of approximately
$105,000 per lane mile for county roadways.
Table F-8 CEI Cost Adjustment – County Roads
(1) Source: Table F-16. CEI cost is estimated at 6% of construction cost based on local
data and discussions with County Staff; construction cost is shown in Table F-6 (2) Source: Appendix F, Table F-18 (Items c and d) (3) CEI cost per lane mile (Item 1) multiplied by the associated section design weight
(Item 2) for each design type and added together. All figures rounded to nearest $1,000
Road Type
Construction
Cost per Lane
Mile(1)
Section Design
Distribution(2)
Weighted
Constr. Cost per
Lane Mile(3)
Urban Design $3,100,000 88% $2,728,000
Rural Design $2,511,000 12% $301,000
Weighted Average Construction Cost per Lane Mile $3,029,000
Road TypeCEI Cost per Lane
Mile(1)
Section Design
Distribution(2)
Weighted CEI
Cost per Lane
Mile(3)
Urban Design $108,000 88% $95,000
Rural Design $87,000 12% $10,000
Weighted Average CEI Cost per Lane Mile $105,000

DRAFT
Tindale Oliver Palm Beach County September 2015 F-8 Impact Fee Update Study
State Roadways
The CEI cost factor for state roads was estimated as a percentage of the construction cost per
lane mile. This factor was determined through a review of the CEI-to-construction cost ratios
for state road unit costs in previously completed impact fee studies throughout Florida. For
state roadways, the CEI factors ranged from 8 percent to 17 percent, with a weighted average
of 11 percent. For purposes of this update study, the CEI cost for state roads was calculated
at 11 percent of the construction cost per lane mile (see Table F-17 for additional
information).
Table F-9 CEI Cost Adjustment – State Roads
(1) CEI cost is estimated at 11% of construction cost based on recent TIF studies in Table
F-17 (Item b); construction cost is shown in Table F-7 (2) Source: Appendix F, Table F-18 (Items c and d) (3) CEI cost per lane mile (Item 1) multiplied by the associated section design weight
(Item 2) for each design type and added together. All figures rounded to nearest $1,000
Road TypeCEI Cost per Lane
Mile(1)
Section Design
Distribution(2)
Weighted CEI
Cost per Lane
Mile(3)
Urban Design $341,000 88% $300,000
Rural Design $276,000 12% $33,000
Weighted Average CEI Cost per Lane Mile $333,000

DRAFT
Tindale Oliver Palm Beach County September 2015 F-9 Impact Fee Update Study
Table F-10 Design Cost Factor – Palm Beach County Improvements
Source: Palm Beach County Financial Management & Budget Department
Palm Beach Hypoluxo Rd W. of Lyons Rd W. of Hagen Ranch Rd 2008 Completed 2 to 4 $1,177,581 $15,294,751 7.7%
Palm Beach Okeechobee Blvd Royal Palm Beach High School Entr. E. of Florida's Turnpike 2008 Completed 6 to 8 $2,057,733 $30,529,591 6.7%
Palm Beach Haverhill Rd 45th St N. of NPBWCD EPB-10 Canal 2008 Completed 2 to 5 $377,908 $2,050,830 18.4%
Palm Beach Jog Rd Yamato Rd Clint Moore Rd 2008 Completed 4 to 6 $295,150 $2,396,040 12.3%
Palm Beach Jog Rd/Donald Ross Rd Hood Rd 64th Dr. N. 2008 Completed 2 to 4 $993,400 $4,630,327 21.5%
Palm Beach Alt. A-1-A S. of Frederick Small Rd Center St 2009 Completed 4 to 6 $736,729 $6,364,139 11.6%
Palm Beach Lyons Rd Glades Rd Yamato Rd 2009 Completed 4 to 6 $475,634 $5,967,464 8.0%
Palm Beach Hypoluxo Rd Jog Rd Military Tr 2009 Completed 4 to 6 $502,010 $4,054,386 12.4%
Palm Beach Lawrence Rd S. of C. Stanley Weaver Canal N. of C. Stanley Weaver Canal 2009 Completed 2 to 4 $263,452 $1,051,680 25.1%
Palm Beach 45th St Jog Rd E. of Haverhill Rd 2010 Completed 2 to 4 $1,354,363 $12,423,103 10.9%
Palm Beach Congress Ave Lantana Rd Melaleuca Ln 2010 Completed 4 to 6 $1,725,182 $6,130,698 28.1%
Palm Beach Australian Ave N. of I-95 S. of Okeechobee Blvd 2010 Completed 4 to 6 $95,458 $552,180 17.3%
Palm Beach Seminole Pratt Whitney Rd SR 80 Sycamore Dr 2010 Bid 2 to 4 $1,737,926 $9,930,460 17.5%
Palm Beach Lyons Rd N. of West Atlantic Ave S. of Boynton Beach Blvd 2011 Completed 0 to 2 $1,370,166 $5,329,359 25.7%
Palm Beach Okeechobee Blvd Australian Ave Tamarind/Parker Ave 2011 Completed 6 to 8 $179,676 $4,252,764 4.2%
Palm Beach Jog Rd N. of SR 710 N. of Florida's Turnpike Entr. 2012 Bid 0 to 4 $1,129,589 $3,413,874 33.1%
Total $14,471,956 $114,371,645 13%
Design /
ConstructionDesign Cost
Construction
CostsBid Year Status FeatureCounty Description From To

DRAFT
Tindale Oliver Palm Beach County September 2015 F-10 Impact Fee Update Study
Table F-11 Design Cost Factor for County & State Roads – Recent Impact Fee Studies
Source: Recent impact fee studies constructed throughout Florida Note: Letter references (i.e., “a”) are used to assist with footnotes and sourcing
Design Constr. Design Ratio Design Constr. Design Ratio
2006 Collier $323,639 $2,558,546 13% $349,643 $3,385,978 10%
2006 Citrus $361,774 $2,584,099 14% $400,432 $2,860,227 14%
2006 Highlands $235,030 $1,678,785 14% $347,326 $2,480,900 14%
2006 Marion $185,333 $1,941,244 10% $154,643 $1,430,919 11%
2007 Pasco $246,324 $3,079,051 8% $427,112 $3,050,799 14%
2007 Lake $232,882 $2,911,021 8% $318,412 $3,184,125 10%
2007 Flagler $174,000 $1,740,000 10% - - n/a
2007 Volusia $291,696 $2,651,778 11% $309,526 $3,095,258 10%
2008 Leon $212,800 $2,660,000 8% $372,130 $3,383,000 11%
2008 Sumter $178,960 $2,237,000 8% $238,000 $2,380,000 10%
2009 Collier $217,000 $3,100,000 7% $320,000 $3,200,000 10%
2009 Polk $95,400 $1,590,000 6% $217,000 $2,170,000 10%
2009 Hillsborough/Tampa $308,000 $2,800,000 11% $420,000 $3,500,000 12%
2010 Collier $119,560 $1,708,000 7% $241,800 $2,418,000 10%
2011 Sarasota/North Port $240,000 $2,400,000 10% $200,000 $2,000,000 10%
2012 Osceola $371,196 $2,651,400 14% $313,258 $2,847,800 11%
2012 Orange $264,000 $2,400,000 11% - - n/a
2012 City of Orlando $288,000 $2,400,000 12% $319,000 $2,900,000 11%
2012 City of Sarasota $240,000 $2,400,000 10% $286,000 $2,600,000 11%
2013 Hernando $198,000 $1,980,000 10% $222,640 $2,024,000 11%
2013 Charlotte $220,000 $2,200,000 10% $240,000 $2,400,000 10%
2014 Indian River $159,000 $1,598,000 10% $196,000 $1,776,000 11%
$234,663 $2,330,406 10% $309,268 $2,767,938 11%
(a) (b)
Year CountyCounty Roadways (Cost per Lane Mile) State Roadways (Cost per Lane Mile)
Average

DRAFT
Tindale Oliver Palm Beach County September 2015 F-11 Impact Fee Update Study
Table F-12 Right-of-Way Factor – Recent County Road Improvements in Palm Beach County
Source: Palm Beach County Financial Management & Budget Department, FY 2004-2014 expense summary
568 Northlake Reliever Military Tr Garden Rd $3,921,633 $3,221,312 121.7%
667 Lyons Rd Glades Rd Yamato Rd $6,126,447 $5,967,464 102.7%
699/725 Seminole Pratt Whitney Rd SR 80 Sycamore Dr $10,269,283 $9,930,460 103.4%
727 Seminole Pratt Whitney Rd S. of M Canal S. of Orange Blvd
727 Seminole Pratt Whitney Rd Sycamore Dr N. of Sycamore Dr
951 Congress Ave Lantana Rd Melaleuca Ln $561,910 $6,130,698 9.2%
762 Congress Ave Hypoluxo Rd Lantana Rd $195,628 $1,291,352 15.1%
763 Congress Ave Melaluca Ln Lake Worth Rd $369,462 $3,178,523 11.6%
730 Okeechobee Blvd Royal Palm Beach High School Entr. E. of Florida's Turnpike $396,043 $30,529,591 1.3%
450 Haverhill Rd 45th St N. of NPBWCD EPB-10 Canal $51,800 $2,050,830 2.5%
1153 Lyons Rd N. of West Atlantic Ave S. of Boynton Beach Blvd $1,272,795 $5,329,359 23.9%
967 45th St Jog Rd E. of Haverhill Rd $4,654,351 $12,423,103 37.5%
929 Woolbright Rd Hagen Ranch Rd Jog Rd $1,007,825 $2,513,156 40.1%
963 Lyons Rd N. of Forest Hill Blvd S. of SR 80 $1,582,122 $1,641,592 96.4%
1117 Acreage Access Road Persimmon Blvd 60th St $717,564 $5,733,646 12.5%
590 Lantana Rd SR 7 Grand Lacuna $4,775 $265,052 1.8%
610 Linton Blvd Military Tr Congress Ave $68,320 $2,525,692 2.7%
639 Persimmon Blvd East End Connect Okeechobee Blvd $302,435 $3,639,649 8.3%
642 Hagen Ranch Rd West Atlantic Ave Boynton Beach Blvd $76,989 $1,396,309 5.5%
962 Melaleuca Ln Jog Rd Haverhill Rd $475,418 $5,361,240 8.9%
1111 Forest Hill Blvd Wellington Trace SR 80 $82,494 $2,114,906 3.9%
1113 Belvedere Rd E. of Jog Rd Military Tr $17,600 $284,469 6.2%
1145 Yamato Rd W. of Cain Blvd W. of SR 7 $15,000 $1,151,285 1.3%
620 Seminole Pratt Whitney Rd Northlake Blvd SR 710/Beeline Hwy $2,196,124 $1,168,119 188.0%
- Lawrence Rd S. of C. Stanley Weaver Canal N. of C. Stanley Weaver Canal $151,318 $1,051,680 14.4%
- West Atlantic Ave W. of Lyons Rd Starkey Rd $3,699,828 $8,818,727 42.0%
- 60th St. N. E. of Royal Palm Beach Blvd SR 7
- SR 7 Extension Persimmon Blvd SR 7
Total $42,118,911 $124,360,510 34%
$480,740 $3,821,404 12.6%
Right-of-Way
Cost
Construction
Costs
Right-of-Way /
Construction
$3,421,007 $2,820,892 121.3%
Unit Description From To

DRAFT
Tindale Oliver Palm Beach County September 2015 F-12 Impact Fee Update Study
Table F-13 Right-of-Way Factor for County & State Roads – Recent Impact Fee Studies
Source: Recent impact fee studies constructed throughout Florida Note: Letter references (i.e., “a”) are used to assist with footnotes and sourcing
ROW Constr. Design Ratio ROW Constr. Design Ratio
2006 Collier $1,751,790 $2,558,546 68% $1,751,790 $3,385,978 52%
2006 Citrus $784,599 $2,584,099 30% $949,979 $2,860,227 33%
2006 Highlands $468,853 $1,678,785 28% $507,500 $2,480,900 20%
2006 Marion $1,005,123 $1,941,244 52% $868,908 $1,430,919 61%
2007 Pasco $814,517 $3,079,051 26% $1,560,714 $3,050,799 51%
2007 Lake $599,185 $2,911,021 21% $1,462,133 $3,184,125 46%
2007 Flagler $460,000 $1,740,000 26% - - n/a
2007 Volusia $858,109 $2,651,778 32% $954,543 $3,095,258 31%
2008 Leon $1,120,000 $2,660,000 42% $1,363,000 $3,383,000 40%
2008 Sumter $802,000 $2,237,000 36% $1,400,000 $2,380,000 59%
2009 Collier $1,300,000 $3,100,000 42% $1,300,000 $3,200,000 41%
2009 Polk $1,491,000 $1,590,000 94% $550,000 $2,170,000 25%
2009 Hillsborough/Tampa $1,500,000 $2,800,000 54% $2,500,000 $3,500,000 71%
2010 Collier $901,000 $1,708,000 53% $901,000 $2,418,000 37%
2011 Sarasota/North Port $620,000 $2,400,000 26% $800,000 $2,000,000 40%
2012 Osceola $1,087,074 $2,651,400 41% $1,167,598 $2,847,800 41%
2012 Orange $1,080,000 $2,400,000 45% - - n/a
2012 City of Orlando $1,080,000 $2,400,000 45% $1,305,000 $2,900,000 45%
2012 City of Sarasota $620,000 $2,400,000 26% $1,144,000 $2,600,000 44%
2013 Hernando $811,800 $1,980,000 41% $890,560 $2,024,000 44%
2013 Charlotte $1,034,000 $2,200,000 47% $1,128,000 $2,400,000 47%
2014 Indian River $656,000 $1,598,000 41% $781,000 $1,776,000 44%
$947,502 $2,330,406 41% $1,164,286 $2,654,350 44%
(a) (b)
Year CountyCounty Roadways (Cost per Lane Mile) State Roadways (Cost per Lane Mile)
Average

DRAFT
Tindale Oliver Palm Beach County September 2015 F-13 Impact Fee Update Study
Table F-14 Construction Cost – County Road Improvements from Palm Beach County Other Jurisdictions throughout Florida
Collier 1 Santa Barbara Blvd Extension Rattlesnake Hammock Rd Davis Blvd 2008 Bid 0 to 6 Urban 2.00 6 12.00 $12,035,894 $1,002,991
Polk 1 Silver Connector Rd E.F. Griffin Rd US 98 2008 Bid 0 to 2 Urban 0.33 2 0.66 $1,560,483 $2,364,368
Polk 1 County Line Rd Ph. I and II SR 60 W. Pipkin Rd 2008 Bid 2 to 4 Urban 3.02 2 6.04 $10,827,839 $1,792,689
Polk 1 Berkley Rd Ph. II and III Old Dixie Hwy Pace Rd 2008 Bid 2 to 4 Urban 4.80 2 9.60 $13,951,130 $1,453,243
Polk 1 Ernie Caldwell Blvd Ph. I and IIA FDC Grove Rd Pine Tree Trail 2008 Bid 0 to 4 Urban 3.66 4 14.64 $25,910,148 $1,769,819
Volusia 5 Debary Ave Deltona Blvd Providence Blvd 2008 Bid 2 to 4 Urban 1.84 2 3.68 $7,405,914 $2,012,477
Volusia 5 S. Will iamson Blvd Ph. II S. of Sabal Creek Blvd N. of Moody Bridge 2008 Bid 2 to 4 Urban 1.91 2 3.82 $11,109,225 $2,908,174
Lake 5 CR 466 (Segment A) US 301 CR 319 2008 Bid 2 to 4 Urban 1.00 2 2.00 $4,062,660 $2,031,330
Hillsborough 7 40th St River Pines Apts Humphrey St 2008 Bid 2 to 4 Urban 0.95 2 1.90 $5,154,862 $2,713,085
Hillsborough 7 Race Track Rd Ph. I Douglas Rd Linebaugh Ave 2008 Bid 2 to 6 Urban 1.01 4 4.04 $10,099,911 $2,499,978
Osceola 5 John Young Pkwy Carroll Orange Co. Line 2008 Bid 4 to 6 Urban 0.85 2 1.70 $3,230,000 $1,900,000
Orange 5 CR 535 (Segments C and E) Ficquette Rd Butler Ridge Dr 2008 Bid 2 to 4 Urban 1.10 2 2.20 $3,693,616 $1,678,916
Orange 5 Clarcona-Ocoee Rd Ocoee Apopka Rd SR 417 2008 Bid 2 to 4 Urban 0.40 2 0.80 $2,803,484 $3,504,355
Orange 5 Destination Pkwy International Dr Tradeshow Blvd 2008 Bid 2 to 4 Urban 0.71 2 1.42 $3,017,443 $2,124,960
Lee 1 Gladiolus Dr Ph. I A&W Bulb Rd Winkler Rd 2008 Bid 2 to 4/6 Urban 1.94 2/4 5.44 $13,971,509 $2,568,292
Lee 1 Gladiolus Dr Ph. II Pine Ridge Rd A&W Bulb Rd 2008 Bid 2 to 4 Urban 1.02 2 2.04 $6,748,642 $3,308,158
Charlotte 1 Toledo-Blade Corridor North Port US 41 2008 Bid 2 to 4 Sub-Urb 1.20 2 2.40 $3,174,852 $1,322,855
Indian River 4 17th Lane SW 27th Ave 20th Ave 2008 Bid 2 to 3 Urban 0.52 1 0.52 $525,000 $1,009,615
Indian River 4 20th Ave SW 25th St SW 17th Lane SW 2008 Bid 0/1 to 2 Urban 0.52 2 1.04 $1,886,715 $1,814,149
Palm Beach 4 Hypoluxo Rd W. of Lyons Rd W. of Hagen Ranch Rd 2008 Bid 2 to 4 Urban 3.00 2 6.00 $15,294,751 $2,549,125
Palm Beach 4 Okeechobee Blvd Royal Palm Beach High School Entr. E. of Florida's Turnpike 2008 Bid 6 to 8 Urban 4.70 2 9.40 $30,529,591 $3,247,829
Palm Beach 4 Haverhill Rd 45th St N. of NPBWCD EPB-10 Canal 2008 Bid 2 to 5 Urban 0.50 3 1.50 $2,050,830 $1,367,220
Palm Beach 4 Jog Rd Yamato Rd Clint Moore Rd 2008 Bid 4 to 6 Urban 1.00 2 2.00 $2,396,040 $1,198,020
Palm Beach 4 Jog Rd/Donald Ross Rd Hood Rd 64th Dr N 2008 Bid 2 to 4 Urban 1.80 2 3.60 $4,630,327 $1,286,202
Orange 5 Clarcona-Ocoee Rd Hiawassee Rd Clark 2009 Bid 2 to 4 Urban 2.50 2 5.00 $10,182,738 $2,036,548
Orange 5 Woodbury Rd S. of SR 50 Challenger Pkwy 2009 Bid 2 to 4 Urban 0.65 2 1.30 $4,088,942 $3,145,340
Orange 5 Sand Lake Rd President's Dr FL Mall 2009 Bid 2 to 4 Urban 1.00 2 2.00 $6,020,755 $3,010,378
Orange 5 Taft-Vineland Road Extension Central Florida Pkwy John Young Pkwy 2009 Bid 2 to 4 Urban 0.70 2 1.40 $4,462,535 $3,187,525
Osceola 5 Narcoossee Rd US 192 Orange Co. Line 2009 Bid 2 to 4 Urban 7.40 2 14.80 $47,360,000 $3,200,000
Osceola 5 Osceola Pkwy (Ph. I) FL Turnpike Buenaventura Blvd 2009 Bid 4 to 6 Urban 1.57 2 3.14 $5,966,000 $1,900,000
Osceola 5 Poinciana Blvd (Ph. II) Crescent Lakes US 17/92 2009 Bid 2 to 4 Urban 2.50 2 5.00 $16,000,000 $3,200,000
Osceola 5 Old Lake Wilson Rd (Ph. I) Livingston Rd Sinclair Rd 2009 Bid 2 to 4 Urban 2.30 2 4.60 $14,720,000 $3,200,000
Hillsborough 7 Bruce B. Downs Palm Springs Blvd Pebble Beach Blvd 2009 Bid 4 to 8 Urban 7.20 4 28.80 $40,575,305 $1,408,865
Hillsborough 7 Race Track Rd (Ph. IV) Douglas Rd Hillsborough Ave 2009 Bid 2 to 6 Urban 0.56 4 2.24 $4,397,412 $1,963,130
Sarasota 1 Fruitvil le Rd (Ph. I) Tatum Rd Debrecen Rd 2009 Bid 2 to 4 Urban 0.72 2 1.44 $4,355,796 $3,024,858
Sarasota 1 Fruitvil le Rd (Ph. II) Coburn Rd Tatum Rd 2009 Bid 2 to 4 Urban 1.26 2 2.52 $8,557,904 $3,395,994
Lee 1 Colonial Blvd (CR 884) I-75 SR 82 2009 Bid 4 to 6 Urban 2.70 2 5.40 $14,576,393 $2,699,332
Indian River 4 College Lane Rd Extension IRSC 66th Ave 2009 Bid 0 to 2 Urban 0.50 2 1.00 $1,700,000 $1,700,000
Indian River 4 16th St 66th Ave 74th Ave 2009 Bid 0 to 2 Urban 1.27 2 2.54 $3,109,321 $1,224,142
Polk 1 Pine Tree Trail Ernie Caldwell Blvd CR 54/Reagan Pkwy 2009 Bid 0 to 2 Urban 1.40 2 2.80 $3,442,332 $1,229,404
Polk 1 Lakeland Highlands Rd Polk Pkwy CR 540A 2009 Bid 2 to 4 Urban 3.01 2 6.02 $13,603,672 $2,259,746
Palm Beach 4 Alt. A1A S. of Frederick Small Rd Center St 2009 Bid 4 to 6 Urban 4.40 2 8.80 $6,364,139 $723,198
Palm Beach 4 Lyons Rd Glades Rd Yamato Rd 2009 Bid 4 to 6 Urban 1.80 2 3.60 $5,967,464 $1,657,629
Palm Beach 4 Hypoluxo Rd Jog Rd Military Tr 2009 Bid 4 to 6 Urban 2.00 2 4.00 $4,054,386 $1,013,597
Palm Beach 4 Lawrence Rd S. of C. Stanley Weaver Canal N. of C. Stanley Weaver Canal 2009 Bid 2 to 4 Urban 0.20 2 0.40 $1,051,680 $2,629,200
Orange 5 Alafaya Tr Avalon Park Blvd Mark Twain Blvd 2010 Bid 2 to 4 Urban 3.83 2 7.66 $18,918,599 $2,469,791
Hillsborough 7 Boyette Rd (Ph. III) McMullen Rd Bell Shoals Rd 2010 Bid 2 to 4 Urban 2.60 2 5.20 $23,184,354 $4,458,530
Construction CostConstruction Cost
per Lane MileStatus Feature Design Length
Lanes
Added
Lane Miles
AddedCounty District Description From To Year
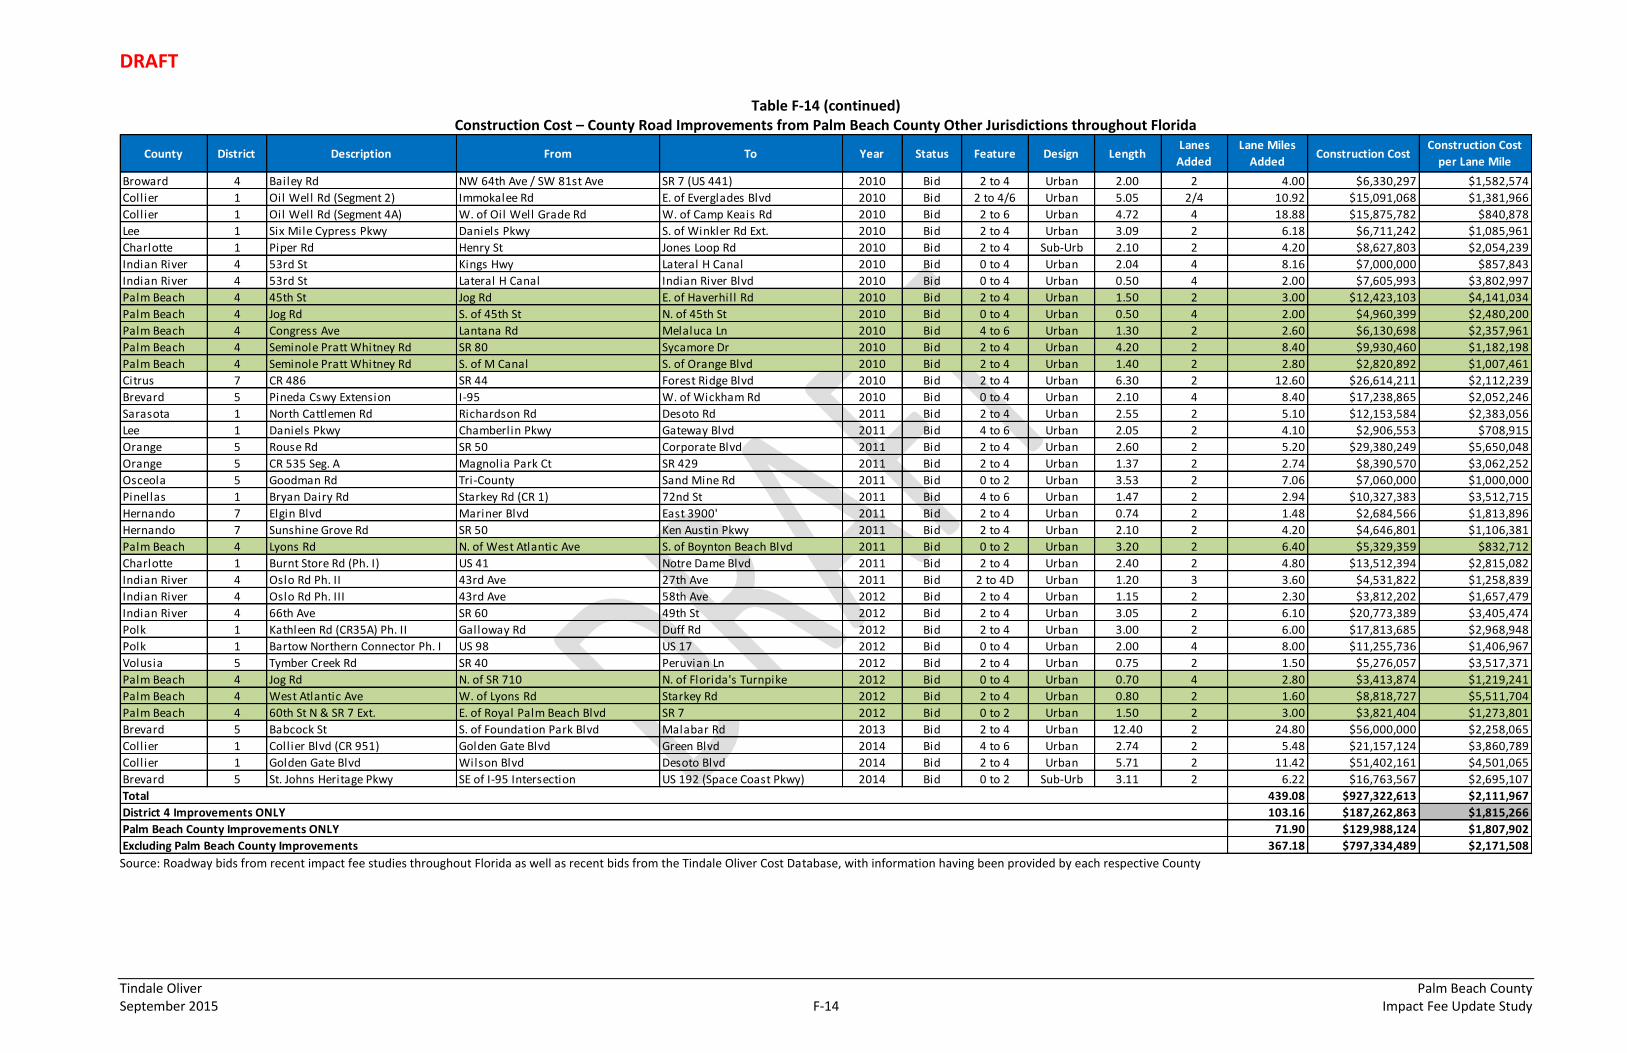
DRAFT
Tindale Oliver Palm Beach County September 2015 F-14 Impact Fee Update Study
Table F-14 (continued) Construction Cost – County Road Improvements from Palm Beach County Other Jurisdictions throughout Florida
Source: Roadway bids from recent impact fee studies throughout Florida as well as recent bids from the Tindale Oliver Cost Database, with information having been provided by each respective County
Broward 4 Bailey Rd NW 64th Ave / SW 81st Ave SR 7 (US 441) 2010 Bid 2 to 4 Urban 2.00 2 4.00 $6,330,297 $1,582,574
Collier 1 Oil Well Rd (Segment 2) Immokalee Rd E. of Everglades Blvd 2010 Bid 2 to 4/6 Urban 5.05 2/4 10.92 $15,091,068 $1,381,966
Collier 1 Oil Well Rd (Segment 4A) W. of Oil Well Grade Rd W. of Camp Keais Rd 2010 Bid 2 to 6 Urban 4.72 4 18.88 $15,875,782 $840,878
Lee 1 Six Mile Cypress Pkwy Daniels Pkwy S. of Winkler Rd Ext. 2010 Bid 2 to 4 Urban 3.09 2 6.18 $6,711,242 $1,085,961
Charlotte 1 Piper Rd Henry St Jones Loop Rd 2010 Bid 2 to 4 Sub-Urb 2.10 2 4.20 $8,627,803 $2,054,239
Indian River 4 53rd St Kings Hwy Lateral H Canal 2010 Bid 0 to 4 Urban 2.04 4 8.16 $7,000,000 $857,843
Indian River 4 53rd St Lateral H Canal Indian River Blvd 2010 Bid 0 to 4 Urban 0.50 4 2.00 $7,605,993 $3,802,997
Palm Beach 4 45th St Jog Rd E. of Haverhill Rd 2010 Bid 2 to 4 Urban 1.50 2 3.00 $12,423,103 $4,141,034
Palm Beach 4 Jog Rd S. of 45th St N. of 45th St 2010 Bid 0 to 4 Urban 0.50 4 2.00 $4,960,399 $2,480,200
Palm Beach 4 Congress Ave Lantana Rd Melaluca Ln 2010 Bid 4 to 6 Urban 1.30 2 2.60 $6,130,698 $2,357,961
Palm Beach 4 Seminole Pratt Whitney Rd SR 80 Sycamore Dr 2010 Bid 2 to 4 Urban 4.20 2 8.40 $9,930,460 $1,182,198
Palm Beach 4 Seminole Pratt Whitney Rd S. of M Canal S. of Orange Blvd 2010 Bid 2 to 4 Urban 1.40 2 2.80 $2,820,892 $1,007,461
Citrus 7 CR 486 SR 44 Forest Ridge Blvd 2010 Bid 2 to 4 Urban 6.30 2 12.60 $26,614,211 $2,112,239
Brevard 5 Pineda Cswy Extension I-95 W. of Wickham Rd 2010 Bid 0 to 4 Urban 2.10 4 8.40 $17,238,865 $2,052,246
Sarasota 1 North Cattlemen Rd Richardson Rd Desoto Rd 2011 Bid 2 to 4 Urban 2.55 2 5.10 $12,153,584 $2,383,056
Lee 1 Daniels Pkwy Chamberlin Pkwy Gateway Blvd 2011 Bid 4 to 6 Urban 2.05 2 4.10 $2,906,553 $708,915
Orange 5 Rouse Rd SR 50 Corporate Blvd 2011 Bid 2 to 4 Urban 2.60 2 5.20 $29,380,249 $5,650,048
Orange 5 CR 535 Seg. A Magnolia Park Ct SR 429 2011 Bid 2 to 4 Urban 1.37 2 2.74 $8,390,570 $3,062,252
Osceola 5 Goodman Rd Tri-County Sand Mine Rd 2011 Bid 0 to 2 Urban 3.53 2 7.06 $7,060,000 $1,000,000
Pinellas 1 Bryan Dairy Rd Starkey Rd (CR 1) 72nd St 2011 Bid 4 to 6 Urban 1.47 2 2.94 $10,327,383 $3,512,715
Hernando 7 Elgin Blvd Mariner Blvd East 3900' 2011 Bid 2 to 4 Urban 0.74 2 1.48 $2,684,566 $1,813,896
Hernando 7 Sunshine Grove Rd SR 50 Ken Austin Pkwy 2011 Bid 2 to 4 Urban 2.10 2 4.20 $4,646,801 $1,106,381
Palm Beach 4 Lyons Rd N. of West Atlantic Ave S. of Boynton Beach Blvd 2011 Bid 0 to 2 Urban 3.20 2 6.40 $5,329,359 $832,712
Charlotte 1 Burnt Store Rd (Ph. I) US 41 Notre Dame Blvd 2011 Bid 2 to 4 Urban 2.40 2 4.80 $13,512,394 $2,815,082
Indian River 4 Oslo Rd Ph. II 43rd Ave 27th Ave 2011 Bid 2 to 4D Urban 1.20 3 3.60 $4,531,822 $1,258,839
Indian River 4 Oslo Rd Ph. III 43rd Ave 58th Ave 2012 Bid 2 to 4 Urban 1.15 2 2.30 $3,812,202 $1,657,479
Indian River 4 66th Ave SR 60 49th St 2012 Bid 2 to 4 Urban 3.05 2 6.10 $20,773,389 $3,405,474
Polk 1 Kathleen Rd (CR35A) Ph. II Galloway Rd Duff Rd 2012 Bid 2 to 4 Urban 3.00 2 6.00 $17,813,685 $2,968,948
Polk 1 Bartow Northern Connector Ph. I US 98 US 17 2012 Bid 0 to 4 Urban 2.00 4 8.00 $11,255,736 $1,406,967
Volusia 5 Tymber Creek Rd SR 40 Peruvian Ln 2012 Bid 2 to 4 Urban 0.75 2 1.50 $5,276,057 $3,517,371
Palm Beach 4 Jog Rd N. of SR 710 N. of Florida's Turnpike 2012 Bid 0 to 4 Urban 0.70 4 2.80 $3,413,874 $1,219,241
Palm Beach 4 West Atlantic Ave W. of Lyons Rd Starkey Rd 2012 Bid 2 to 4 Urban 0.80 2 1.60 $8,818,727 $5,511,704
Palm Beach 4 60th St N & SR 7 Ext. E. of Royal Palm Beach Blvd SR 7 2012 Bid 0 to 2 Urban 1.50 2 3.00 $3,821,404 $1,273,801
Brevard 5 Babcock St S. of Foundation Park Blvd Malabar Rd 2013 Bid 2 to 4 Urban 12.40 2 24.80 $56,000,000 $2,258,065
Collier 1 Collier Blvd (CR 951) Golden Gate Blvd Green Blvd 2014 Bid 4 to 6 Urban 2.74 2 5.48 $21,157,124 $3,860,789
Collier 1 Golden Gate Blvd Wilson Blvd Desoto Blvd 2014 Bid 2 to 4 Urban 5.71 2 11.42 $51,402,161 $4,501,065
Brevard 5 St. Johns Heritage Pkwy SE of I-95 Intersection US 192 (Space Coast Pkwy) 2014 Bid 0 to 2 Sub-Urb 3.11 2 6.22 $16,763,567 $2,695,107
439.08 $927,322,613 $2,111,967
103.16 $187,262,863 $1,815,266
71.90 $129,988,124 $1,807,902
367.18 $797,334,489 $2,171,508
Construction CostConstruction Cost
per Lane MileStatus Feature Design Length
Lanes
Added
Lane Miles
Added
Excluding Palm Beach County Improvements
District 4 Improvements ONLY
Palm Beach County Improvements ONLY
Total
County District Description From To Year

DRAFT
Tindale Oliver Palm Beach County September 2015 F-15 Impact Fee Update Study
Table F-15 Construction Cost – State Road Improvements from Palm Beach County and Other Jurisdictions throughout Florida
Walton 3 SR 83 (US 331) SR 30 (US 98) S. end of Choctaw Bridge 2008 Bid 2 to 4 Urban 2.08 2 4.16 $11,649,363 $2,800,328
Hillsborough 7 US 301 (SR 43) S. of Balm Rd N. of Gibsonton Rd 2008 Bid 2 to 6 Urban 6.03 4 24.12 $55,702,777 $2,309,402
Indian River 4 SR 5 (US 1) S. of Oslo Rd S. of Indian River Bend 2008 Bid 4 to 6 Urban 1.70 2 3.40 $14,953,562 $4,398,106
Indian River 4 SR 60/Osceola Blvd W. of 82 Ave 66th Ave/CR 505 2008 Bid 4 to 6 Urban 2.15 2 4.30 $18,496,793 $4,301,580
Orange 5 SR 50 Good Homes Rd Pine Hills Rd 2008 Bid 4 to 6 Urban 3.63 2 7.26 $35,929,914 $4,949,024
Leon 3 SR 10 (Mahan Drive) Dempsey Mayo Rd Walden Rd 2009 Bid 2 to 4 Urban 3.10 2 6.20 $18,083,510 $2,916,695
Indian River 4 SR 60 (Osceola Blvd) W. of I-95 W. of 82nd Ave/CR 609 2009 Bid 4 to 6 Urban 3.07 2 6.14 $7,366,557 $1,199,765
Sarasota 1 US 301 Wood St Myrtle Ave 2009 Bid 4 to 6 Urban 2.60 2 5.20 $18,372,050 $3,533,087
Sarasota 1 US 301 Myrtle Ave Desoto Rd 2009 Bid 4 to 6 Urban 1.00 2 2.00 $8,293,271 $4,146,636
Pasco 7 US 41 (SR 45) Tower Rd Ridge Rd 2009 Bid 2 to 4 Urban 2.84 2 5.68 $12,685,027 $2,233,279
Lee 1 SR 739 US 41 (S. of Alico) Six Mile Cypress Pkwy 2009 Bid 0 to 6 Urban 2.77 6 16.62 $20,663,929 $1,243,317
Manatee 1 US 301 Erie Rd CR 675 2009 Bid 4 to 6 Urban 4.10 2 8.20 $21,040,000 $2,565,854
Marion 5 SR 35 (US 301) Sumter County Line 529' S. of CR 42 2009 Bid 2 to 4 Urban 1.40 2 2.80 $3,596,000 $1,284,286
Miami-Dade 6 Perimeter Rd NW 72 Avenue NW 57 Avenue 2009 Bid 2 to 4 Urban 1.50 2 3.00 $6,383,286 $2,127,762
Polk 1 US 27 N. of CR 546 S. of SR 544 2009 Bid 2 to 4 Urban 1.56 2 3.12 $4,100,069 $1,314,125
Santa Rosa 3 SR 281 (Avalon Blvd) N. of CSX R/R Bridge S. of Commerce Rd 2009 Bid 2 to 4 Urban 0.98 2 1.96 $5,621,006 $2,867,860
Santa Rosa 3 SR 281 (Avalon Blvd) Gulf Rd SR 10 (US 90) 2009 Bid 2 to 4 Urban 1.78 2 3.56 $9,150,583 $2,570,388
St. Lucie 4 SR 70 MP 5.860 MP 10.216 2009 Bid 2 to 4 Urban 4.36 2 8.72 $12,426,020 $1,425,002
Washington 3 SR 79 N. Environmental Rd Strickland Rd 2009 Bid 2 to 4 Urban 1.72 2 3.44 $8,877,323 $2,580,617
Lake 5 SR 50 E. of Grand Hwy W. of Hancock Rd 2010 Bid 4 to 6 Urban 1.30 2 2.60 $4,689,633 $1,803,705
Polk 1 SR 559 Extension SR 655 (Recker Hwy) Derby Ave 2010 Bid 0 to 2 Urban 0.69 2 1.38 $2,751,592 $1,993,907
Santa Rosa 3 SR 281 (Avalon Blvd) SR 8 (I-10) S. of Moor's Lodge 2010 Bid 2 to 4 Urban 0.85 2 1.70 $5,378,226 $3,163,662
Santa Rosa 3 SR 281 (Avalon Blvd) S. of Moor's Lodge N. of CSX R/R Bridge 2010 Bid 2 to 4 Urban 1.48 2 2.96 $7,145,212 $2,413,923
Lee 1 US 41 Corkscrew Rd San Carlos Blvd 2010 Bid 4 to 6 Urban 4.48 2 8.96 $12,822,677 $1,431,102
Polk 1 US 98 S. of Manor Dr N. of CR 540A 2010 Bid 4 to 6 Urban 3.32 2 6.64 $11,092,909 $1,670,619
St. Lucie 4 SR 70 Okeechobee County Line MP 5.871 2010 Bid 2 to 4 Urban 5.87 2 11.74 $18,782,630 $1,599,883
Polk 1 US 98 (Bartow Hwy) Brooks St Edgewood Dr 2011 Bid 4 to 6 Urban 0.72 2 1.44 $4,341,917 $3,015,220
Hillsborough 7 CR 39/Alexander St N. of I-4 N. of Knights Griffin 2011 Bid 0 to 4 Urban 3.19 4 12.76 $14,782,862 $1,158,532
Pinellas 7 SR 688 (Ulmerton Rd) E. of 119th St W. of Seminole Bypass 2011 Bid 4 to 6 Urban 1.50 2 3.00 $16,908,929 $5,636,310
Polk 1 SR 60 (Van Fleet) W. of US 98/Broadway W. of US 17 (SR 555) 2011 Bid 2 to 4 Urban 0.86 2 1.72 $9,540,473 $5,546,787
Lake 5 SR 500 (US 441) Martin Luther King Jr. Blvd Lake Ella Rd 2011 Bid 4 to 6 Urban 3.25 2 6.50 $16,278,889 $2,504,444
Hillsborough 7 SR 574 (MLK Blvd) W. of Highview Rd E. of Parsons Ave 2011 Bid 3 to 5 Urban 0.91 2 1.82 $7,147,510 $3,927,203
Collier 1 SR 84 (Davis Blvd) E. of Santa Barbara Blvd W. of Radio Rd 2012 Bid 2 to 6 Urban 1.77 4 7.08 $10,956,198 $1,547,486
Volusia 5 SR 415 Seminole Co. Line Reed Ell is Rd 2012 Bid 2 to 4 Urban 2.26 2 4.53 $18,718,637 $4,132,149
Volusia 5 SR 415 Reed Ell is Rd 0.3 miles N. of Acorn Lake 2012 Bid 2 to 4 Urban 5.07 2 10.13 $18,388,845 $1,815,286
Pinellas 7 US 19 (SR 55) N. of CR 576/Sunset Pnt S. of Countryside Blvd 2012 Bid 6 to 10 Urban 1.76 4 7.04 $17,196,050 $2,442,621
Miami-Dade 6 SR 823/NW 57th Ave W. 23rd St W. 46th St 2012 Bid 4 to 6 Urban 1.48 2 2.96 $14,081,161 $4,757,149
Hernando 7 SR 50 (Cortez Blvd) US 19 (SR 55) W. of CR 587/Mariner Blvd 2012 Bid 4 to 6 Urban 6.02 2 12.04 $39,444,222 $3,276,098
Orange 5 SR 50 E. of West Oaks Mall W. of Good Homes Rd 2012 Bid 4 to 6 Urban 0.45 2 0.90 $8,694,472 $9,660,524
Clay 2 SR 23 Oakleaf Plantation Pkwy Old Jennings 2012 Bid 0 to 2 Urban 3.14 2 6.28 $13,231,111 $2,106,865
Hendry 1 SR 80 Birchwood Pkwy Dalton Lane 2012 Bid 2 to 4 Urban 5.00 2 10.00 $12,855,092 $1,285,509
Hendry 1 SR 80 CR 833 US 27 2012 Bid 2 to 4 Urban 2.90 2 5.80 $8,117,039 $1,399,489
Lee 1 SR 739 Winkler Ave Hanson St 2012 Bid 0 to 6 Urban 1.34 6 8.04 $14,025,932 $1,744,519
Seminole 5 SR 434 I-4 Rangeline Rd 2012 Bid 4 to 6 Urban 1.80 2 3.60 $10,111,333 $2,808,704
Palm Beach 4 SR 710/Beeline Hwy W. of Congress Ave W. of Australian Ave 2012 Bid 2 to 4 Urban 0.84 2 1.68 $12,189,533 $7,255,674
Polk 1 US 27 N. of Ritchie Rd S. of Barry Rd 2012 Bid 4 to 6 Urban 3.20 2 6.40 $14,242,918 $2,225,456
Polk 1 US 98 (SR 35/SR 700) N. of CR 540A SR 540 2012 Bid 4 to 6 Urban 3.45 2 6.90 $18,004,051 $2,609,283
Construction CostConstruction Cost
per Lane MileCounty District Description From To Year Status Feature Design Length
Lanes
Added
Lane Miles
Added

DRAFT
Tindale Oliver Palm Beach County September 2015 F-16 Impact Fee Update Study
Table F-15 (continued) Construction Cost – State Road Improvements from Palm Beach County and Other Jurisdictions throughout Florida
Source: FDOT recently-bid projects by transportation district, available at www.dot.state.fl.us/
Table F-16 CEI Cost Factor – Palm Beach County Improvements
Source: Palm Beach County Financial Management & Budget Department
Brevard 5 SR 5 (US 1) N. of Pine St N. of Cidco Rd 2012 Bid 4 to 6 Urban 3.84 2 7.68 $29,360,536 $3,822,986
Broward 4 Andrews Ave Ext. NW 18th St Copans Rd 2013 Bid 2 to 4 Urban 0.50 2 1.00 $6,592,014 $6,592,014
Brevard 5 SR 507 (Babcock St) Melbourne Ave Fee Ave 2013 Bid 2 to 4 Urban 0.55 2 1.10 $5,167,891 $4,698,083
Hillsborough 7 SR 41 (US 301) S. of Tampa Bypass Canal N. of Fowler Ave 2013 Bid 2 to 4 Sub-Urb 1.81 2 3.61 $15,758,965 $4,365,364
Lee 1 US 41 Business Littleton Rd SR 739 2013 Bid 2 to 4 Urban 1.23 2 2.46 $8,488,393 $3,450,566
Brevard 5 Apollo Blvd Sarno Rd Eau Gallie Blvd 2013 Bid 2 to 4 Urban 0.87 2 1.74 $10,318,613 $5,930,237
Orange 5 SR 50 (Colonial Dr) E. of CR 425 (Dean Rd) E. of Old Cheney Hwy 2013 Bid 4 to 6 Urban 4.91 2 9.82 $66,201,688 $6,741,516
Okeechobee 1 SR 70 NE 34th Ave NE 80th Ave 2014 Bid 2 to 4 Urban 3.60 2 7.20 $23,707,065 $3,292,648
Martin 4 CR 714/Indian St Turnpike/Martin Downs Blvd W. of Mapp Rd 2014 Bid 2 to 4 Urban 1.87 2 3.74 $14,935,957 $3,993,571
Broward 4 SR 7 N. of Hallendale Bch N. of Fil lmore St. 2014 Bid 4 to 6 Urban 1.79 2 3.57 $30,674,813 $8,592,385
Broward 4 Andrews Ave Ext. Pompano Park Place S. of Atlantic Blvd 2014 Bid 2 to 4 Urban 0.36 2 0.72 $3,177,530 $4,413,236
Charlotte 1 US 41 (SR 45) Enterprise Dr Sarasota County Line 2014 Bid 4 to 6 Urban 3.62 2 7.24 $31,131,016 $4,299,864
Desoto 1 US 17 CR 760A (Nocatee) Heard St 2014 Bid 2 to 4 Urban 4.40 2 8.80 $29,584,798 $3,361,909
335.16 $930,410,371 $2,776,019
45.01 $139,595,409 $3,101,431
1.68 $12,189,533 $7,255,674
333.48 $918,220,838 $2,753,451
Total
District 4 Improvements ONLY
Palm Beach County Improvements ONLY
Construction Cost
Excluding Palm Beach County Improvements
Construction Cost
per Lane MileCounty District Description From To Year Status Feature Design Length
Lanes
Added
Lane Miles
Added
Palm Beach Okeechobee Blvd Australian Ave Tamarind/Parker Ave 2011 Completed 6 to 8 $247,753 $4,252,764 5.8%
Palm Beach West Atlantic Ave W. of Lyons Rd Starkey Rd 2012 Bid 2 to 4 $545,397 $8,818,727 6.2%
Total $793,150 $13,071,491 6%
CEI CostConstruction
Cost
CEI /
ConstructionStatus FeatureBid YearCounty Description From To

DRAFT
Tindale Oliver Palm Beach County September 2015 F-17 Impact Fee Update Study
Table F-17 Construction Engineering/Inspection Factor – County & State Roads
Source: Recent impact fee studies constructed throughout Florida Note: Letter references (i.e., “a”) are used to assist with footnotes and sourcing
CEI Constr. CEI Ratio CEI Constr. CEI Ratio
2006 Collier $294,054 $2,558,546 11% $354,442 $3,385,978 10%
2006 Citrus $180,887 $2,584,099 7% $474,464 $2,860,227 17%
2007 Pasco $215,534 $3,079,051 7% $442,849 $3,050,799 15%
2007 Lake $116,441 $2,911,021 4% $318,412 $3,184,125 10%
2007 Flagler $174,000 $1,740,000 10% - - n/a
2007 Volusia $238,660 $2,651,778 9% $309,526 $3,095,258 10%
2008 Leon $372,400 $2,660,000 14% $270,640 $3,383,000 8%
2008 Sumter $223,700 $2,237,000 10% $238,000 $2,380,000 10%
2009 Collier $186,000 $3,100,000 6% $320,000 $3,200,000 10%
2009 Polk $111,300 $1,590,000 7% $217,000 $2,170,000 10%
2009 Hillsborough/Tampa $308,000 $2,800,000 11% $315,000 $3,500,000 9%
2010 Collier $119,560 $1,708,000 7% $241,800 $2,418,000 10%
2011 Sarasota/North Port $216,000 $2,400,000 9% $180,000 $2,000,000 9%
2012 Osceola $265,140 $2,651,400 10% $313,258 $2,847,800 11%
2012 City of Orlando - $2,400,000 n/a - $2,900,000 n/a
2012 City of Sarasota $240,000 $2,400,000 10% $286,000 $2,600,000 11%
2013 Hernando $198,000 $1,980,000 10% $222,640 $2,024,000 11%
2013 Charlotte $220,000 $2,200,000 10% $240,000 $2,400,000 10%
2014 Indian River $159,000 $1,598,000 10% $196,000 $1,776,000 11%
$213,260 $2,380,494 9% $4,940,031 $46,275,187 11%
(a) (b)
Average
Year CountyCounty Roadways (Cost per Lane Mile) State Roadways (Cost per Lane Mile)

DRAFT
Tindale Oliver Palm Beach County September 2015 F-18 Impact Fee Update Study
Roadway Capacity
As shown in Table F-18, the average capacity per lane mile was based on the planned
improvements projects in the 2040 Long Range Transportation Plan’s Cost Feasible Plan. This
listing of projects reflects the mix of improvements that will yield the vehicle miles of capacity
(VMC) that will be built in Palm Beach County.
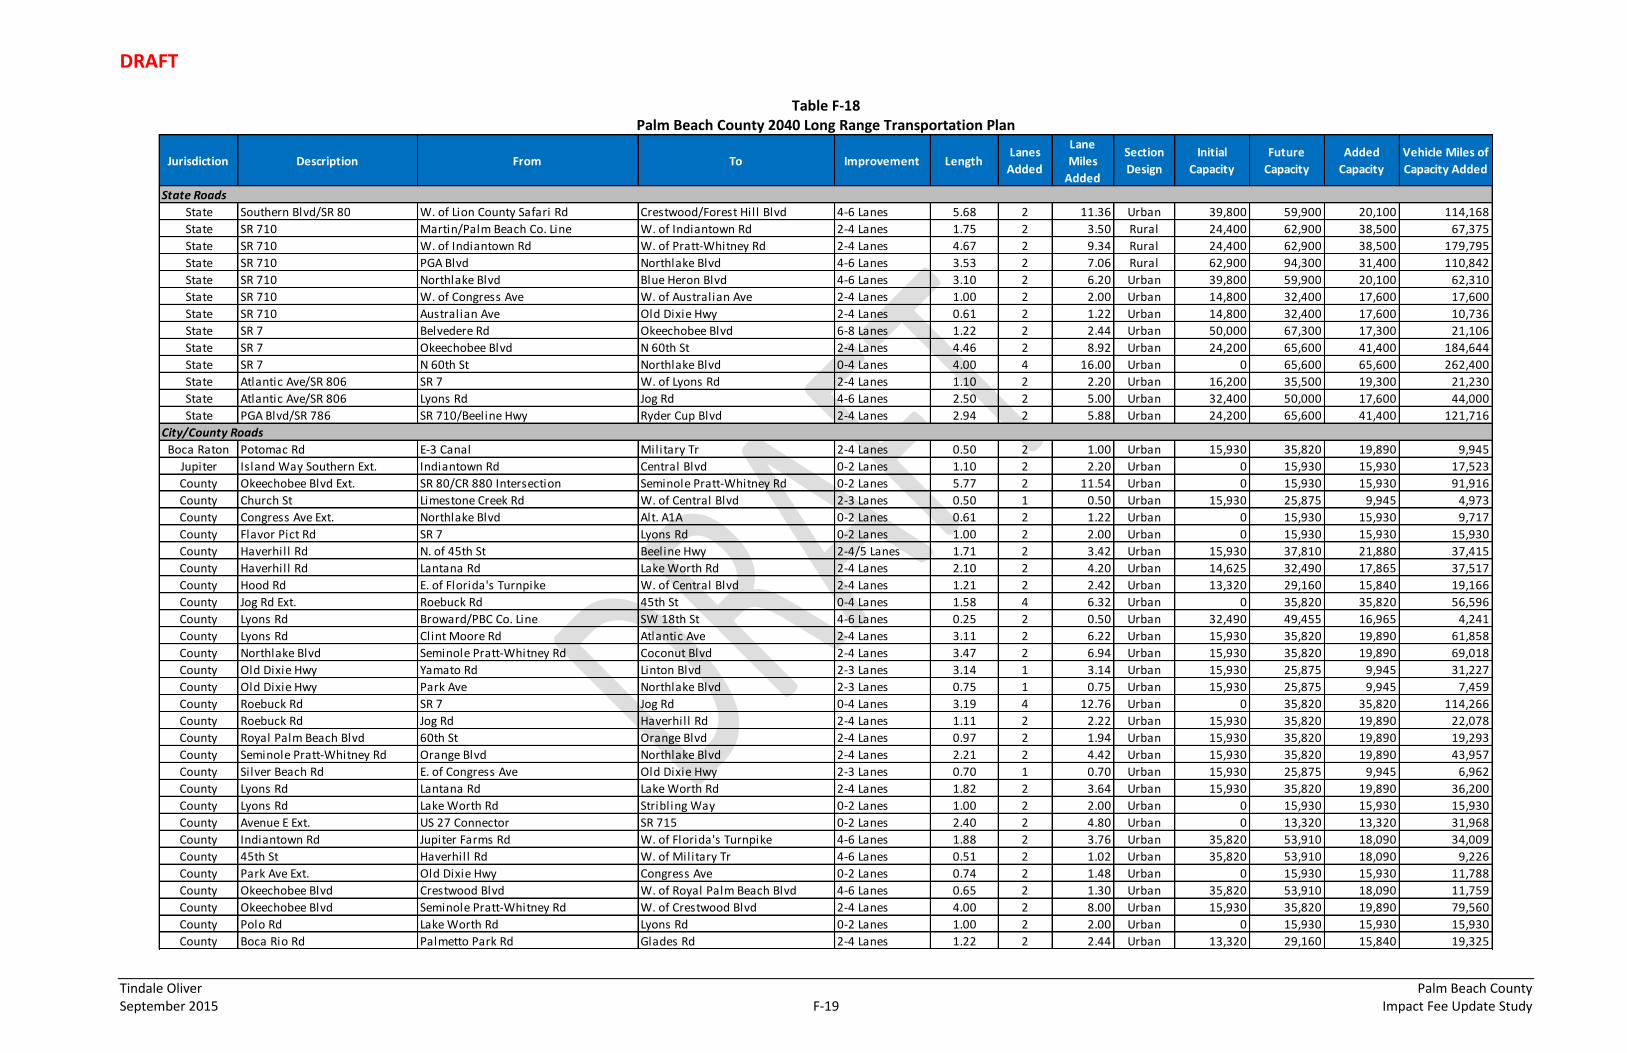
DRAFT
Tindale Oliver Palm Beach County September 2015 F-19 Impact Fee Update Study
Table F-18 Palm Beach County 2040 Long Range Transportation Plan
Jurisdiction Description From To Improvement LengthLanes
Added
Lane
Miles
Added
Section
Design
Initial
Capacity
Future
Capacity
Added
Capacity
Vehicle Miles of
Capacity Added
State Roads
State Southern Blvd/SR 80 W. of Lion County Safari Rd Crestwood/Forest Hill Blvd 4-6 Lanes 5.68 2 11.36 Urban 39,800 59,900 20,100 114,168
State SR 710 Martin/Palm Beach Co. Line W. of Indiantown Rd 2-4 Lanes 1.75 2 3.50 Rural 24,400 62,900 38,500 67,375
State SR 710 W. of Indiantown Rd W. of Pratt-Whitney Rd 2-4 Lanes 4.67 2 9.34 Rural 24,400 62,900 38,500 179,795
State SR 710 PGA Blvd Northlake Blvd 4-6 Lanes 3.53 2 7.06 Rural 62,900 94,300 31,400 110,842
State SR 710 Northlake Blvd Blue Heron Blvd 4-6 Lanes 3.10 2 6.20 Urban 39,800 59,900 20,100 62,310
State SR 710 W. of Congress Ave W. of Australian Ave 2-4 Lanes 1.00 2 2.00 Urban 14,800 32,400 17,600 17,600
State SR 710 Australian Ave Old Dixie Hwy 2-4 Lanes 0.61 2 1.22 Urban 14,800 32,400 17,600 10,736
State SR 7 Belvedere Rd Okeechobee Blvd 6-8 Lanes 1.22 2 2.44 Urban 50,000 67,300 17,300 21,106
State SR 7 Okeechobee Blvd N 60th St 2-4 Lanes 4.46 2 8.92 Urban 24,200 65,600 41,400 184,644
State SR 7 N 60th St Northlake Blvd 0-4 Lanes 4.00 4 16.00 Urban 0 65,600 65,600 262,400
State Atlantic Ave/SR 806 SR 7 W. of Lyons Rd 2-4 Lanes 1.10 2 2.20 Urban 16,200 35,500 19,300 21,230
State Atlantic Ave/SR 806 Lyons Rd Jog Rd 4-6 Lanes 2.50 2 5.00 Urban 32,400 50,000 17,600 44,000
State PGA Blvd/SR 786 SR 710/Beeline Hwy Ryder Cup Blvd 2-4 Lanes 2.94 2 5.88 Urban 24,200 65,600 41,400 121,716
City/County Roads
Boca Raton Potomac Rd E-3 Canal Military Tr 2-4 Lanes 0.50 2 1.00 Urban 15,930 35,820 19,890 9,945
Jupiter Island Way Southern Ext. Indiantown Rd Central Blvd 0-2 Lanes 1.10 2 2.20 Urban 0 15,930 15,930 17,523
County Okeechobee Blvd Ext. SR 80/CR 880 Intersection Seminole Pratt-Whitney Rd 0-2 Lanes 5.77 2 11.54 Urban 0 15,930 15,930 91,916
County Church St Limestone Creek Rd W. of Central Blvd 2-3 Lanes 0.50 1 0.50 Urban 15,930 25,875 9,945 4,973
County Congress Ave Ext. Northlake Blvd Alt. A1A 0-2 Lanes 0.61 2 1.22 Urban 0 15,930 15,930 9,717
County Flavor Pict Rd SR 7 Lyons Rd 0-2 Lanes 1.00 2 2.00 Urban 0 15,930 15,930 15,930
County Haverhill Rd N. of 45th St Beeline Hwy 2-4/5 Lanes 1.71 2 3.42 Urban 15,930 37,810 21,880 37,415
County Haverhill Rd Lantana Rd Lake Worth Rd 2-4 Lanes 2.10 2 4.20 Urban 14,625 32,490 17,865 37,517
County Hood Rd E. of Florida's Turnpike W. of Central Blvd 2-4 Lanes 1.21 2 2.42 Urban 13,320 29,160 15,840 19,166
County Jog Rd Ext. Roebuck Rd 45th St 0-4 Lanes 1.58 4 6.32 Urban 0 35,820 35,820 56,596
County Lyons Rd Broward/PBC Co. Line SW 18th St 4-6 Lanes 0.25 2 0.50 Urban 32,490 49,455 16,965 4,241
County Lyons Rd Clint Moore Rd Atlantic Ave 2-4 Lanes 3.11 2 6.22 Urban 15,930 35,820 19,890 61,858
County Northlake Blvd Seminole Pratt-Whitney Rd Coconut Blvd 2-4 Lanes 3.47 2 6.94 Urban 15,930 35,820 19,890 69,018
County Old Dixie Hwy Yamato Rd Linton Blvd 2-3 Lanes 3.14 1 3.14 Urban 15,930 25,875 9,945 31,227
County Old Dixie Hwy Park Ave Northlake Blvd 2-3 Lanes 0.75 1 0.75 Urban 15,930 25,875 9,945 7,459
County Roebuck Rd SR 7 Jog Rd 0-4 Lanes 3.19 4 12.76 Urban 0 35,820 35,820 114,266
County Roebuck Rd Jog Rd Haverhill Rd 2-4 Lanes 1.11 2 2.22 Urban 15,930 35,820 19,890 22,078
County Royal Palm Beach Blvd 60th St Orange Blvd 2-4 Lanes 0.97 2 1.94 Urban 15,930 35,820 19,890 19,293
County Seminole Pratt-Whitney Rd Orange Blvd Northlake Blvd 2-4 Lanes 2.21 2 4.42 Urban 15,930 35,820 19,890 43,957
County Silver Beach Rd E. of Congress Ave Old Dixie Hwy 2-3 Lanes 0.70 1 0.70 Urban 15,930 25,875 9,945 6,962
County Lyons Rd Lantana Rd Lake Worth Rd 2-4 Lanes 1.82 2 3.64 Urban 15,930 35,820 19,890 36,200
County Lyons Rd Lake Worth Rd Stribling Way 0-2 Lanes 1.00 2 2.00 Urban 0 15,930 15,930 15,930
County Avenue E Ext. US 27 Connector SR 715 0-2 Lanes 2.40 2 4.80 Urban 0 13,320 13,320 31,968
County Indiantown Rd Jupiter Farms Rd W. of Florida's Turnpike 4-6 Lanes 1.88 2 3.76 Urban 35,820 53,910 18,090 34,009
County 45th St Haverhill Rd W. of Military Tr 4-6 Lanes 0.51 2 1.02 Urban 35,820 53,910 18,090 9,226
County Park Ave Ext. Old Dixie Hwy Congress Ave 0-2 Lanes 0.74 2 1.48 Urban 0 15,930 15,930 11,788
County Okeechobee Blvd Crestwood Blvd W. of Royal Palm Beach Blvd 4-6 Lanes 0.65 2 1.30 Urban 35,820 53,910 18,090 11,759
County Okeechobee Blvd Seminole Pratt-Whitney Rd W. of Crestwood Blvd 2-4 Lanes 4.00 2 8.00 Urban 15,930 35,820 19,890 79,560
County Polo Rd Lake Worth Rd Lyons Rd 0-2 Lanes 1.00 2 2.00 Urban 0 15,930 15,930 15,930
County Boca Rio Rd Palmetto Park Rd Glades Rd 2-4 Lanes 1.22 2 2.44 Urban 13,320 29,160 15,840 19,325

DRAFT
Tindale Oliver Palm Beach County September 2015 F-20 Impact Fee Update Study
Table F-18 (continued) Palm Beach County 2040 Long Range Transportation Plan
Source: Palm Beach County 2040 Long Range Transportation Plan; Plan includes adjustments based on discussions with County Staff
Note: Letter references (i.e., “a”) are used to assist with footnotes and sourcing
Jurisdiction Description From To Improvement LengthLanes
Added
Lane
Miles
Added
Section
Design
Initial
Capacity
Future
Capacity
Added
Capacity
Vehicle Miles of
Capacity Added
City/County Roads
County 60th St Seminole Pratt-Whitney Rd 140th Ave N 0-2 Lanes 2.75 2 5.50 Urban 0 15,930 15,930 43,808
County Flavor Pict Rd Lyons Rd Hagen Ranch Rd 0-2 Lanes 1.52 2 3.04 Urban 0 15,930 15,930 24,214
County Seminole Pratt-Whitney Rd Persimmon Blvd 60th St 2-4 Lanes 0.85 2 1.70 Urban 15,930 35,820 19,890 16,907
County Silver Beach Rd Old Dixie Hwy US 1 2-3 Lanes 1.00 1 1.00 Urban 15,930 25,875 9,945 9,945
County Seminole Pratt-Whitney Rd N. of Northlake Blvd SR 710 0-2 Lanes 6.21 2 12.42 Urban 0 21,960 21,960 136,372
County 45th St I-95 Congress Ave 6-8 Lanes 0.24 2 0.48 Urban 45,000 60,570 15,570 3,737
County Lantana Rd Lyons Rd Hagen Ranch Rd 4-6 Lanes 1.90 2 3.80 Urban 35,820 53,910 18,090 34,371
County Indiantown Rd Pratt-Whitney Rd 131st Trail N 2-4 Lanes 2.85 2 5.70 Rural 21,960 56,610 34,650 98,753
Total (All Roads): 219.61 2,532,781
City/County Roads: 138.49 63% 1,314,859
State Roads: 81.12 37% 1,217,922
Urban Section Design: 194.01 88% 2,076,016
Rural Section Design: 25.60 12% 456,765

DRAFT
APPENDIX G Transportation Impact Fee –Credit Component
Calculations

DRAFT
Tindale Oliver Palm Beach County September 2015 G-1 Impact Fee Update Study
Transportation Impact Fee: Credit Component
This appendix presents the detailed calculations for the credit component. Currently, in
addition to the capital support that ultimately results from State fuel tax revenues, Palm
Beach County also receives financial benefit from several other funding sources. Of these,
County fuel taxes that are collected in Palm Beach County are listed below, along with a few
pertinent characteristics of each.
1. Constitutional Fuel Tax (2¢/gallon)
Tax applies to every net gallon of motor and diesel fuel sold within a county. Collected
in accordance with Article XII, Section 9 (c) of the Florida Constitution
The State allocated 80 percent of this tax to Counties after first withholding amounts
pledged for debt service on bonds issued pursuant to provisions of the State
Constitution for road and bridge purposes
The 20 percent surplus can be used to support the road construction program within
the county
Counties are not required to share the proceeds of this tax with their municipalities
2. County Fuel Tax (1¢/gallon)
Tax applies to every net gallon of motor and diesel fuel sold within a county
Primary purpose of these funds is to help reduce a County’s reliance on ad valorem
taxes
Proceeds are to be used for transportation-related expenses, including the reduction
of bond indebtedness incurred for transportation purposes. Authorized uses include
acquisition of rights-of-way; the construction, reconstruction, operation,
maintenance, and repair of transportation facilities, roads, bridges, bicycle paths, and
pedestrian pathways; or the reduction of bond indebtedness incurred for
transportation purposes
Counties are not required to share the proceeds of this tax with their municipalities.
3. Ninth-Cent Fuel Tax (1¢/gallon)
Tax on every net gallon of motor fuel sold within a county
Proceeds may be used to fund transportation expenditures
To accommodate statewide equalization, this tax is automatically levied on diesel fuel
in every county, regardless of whether a county is levying the tax on motor fuel at all
Counties are not required to share the proceeds of this tax with their municipalities

DRAFT
Tindale Oliver Palm Beach County September 2015 G-2 Impact Fee Update Study
3. 1st Local Option Tax (up to 6¢/gallon)
Tax applies to every net gallon of motor and diesel fuel sold within a county
Proceeds may be used to fund transportation expenditures
To accommodate statewide equalization, all six cents are automatically levied on
diesel fuel in every county, regardless of whether a county is levying the tax on motor
fuel at all or at the maximum rate
Proceeds are distributed to a county and its municipalities according to a mutually
agreed upon distribution ratio, or by using a formula contained in the Florida Statutes
4. 2nd Local Option Tax (up to 5¢/gallon)
Tax applies to every net gallon of motor and diesel fuel sold within a county
Proceeds may be used to fund transportation expenditures needed to meet
requirements of the capital improvements element of an adopted Local Government
Comprehensive Plan
Proceeds are distributed to a county and its municipalities according to a mutually
agreed upon distribution scheme, or by using a formula contained in the Florida
Statutes
Each year, the Florida Legislature’s Office of Economic and Demographic Research (EDR)
produces the Local Government Financial Information Handbook, which details the estimated
local government revenues for the upcoming fiscal year. Included in this document are the
estimated distributions of various fuel tax revenues for each county in the state. The 2014-
15 data represent projected fuel tax distributions to Palm Beach County for the current fiscal
year. In the table, the fuel tax revenue data are used to calculate the value per penny (per
gallon of fuel) that should be used to estimate the “equivalent pennies” of other revenue
sources. Table G-1 shows the distribution per penny for each of the fuel levies, and then the
calculation of the weighted average for the value of a penny of fuel tax. The weighting
procedure takes into account the differing amount of revenues generated for the various
types of gas tax revenues. The weighted average figure of approximately $5.32 million
estimates the annual revenue that one penny of gas tax generates in Palm Beach County.

DRAFT
Tindale Oliver Palm Beach County September 2015 G-3 Impact Fee Update Study
Table G-1 Estimated Fuel Tax Distribution Allocated to Capital Programs for
Palm Beach County & Municipalities, FY 2014-15(1)
(1) Source: Florida Legislature’s Office of Economic and Demographic Research,
http://edr.state.fl.us/content/local-government/reports/ (2) The weighted average distribution per penny is calculated by taking the sum of the total
distribution and dividing that value by the sum of the total levies per gallon (multiplied by 100).
Gas Tax Credit
A revenue credit for the annual gas tax equivalent expenditures on roadway capacity
expansion projects in Palm Beach County is presented below. The two components of the
credit are as follows:
County gas tax equivalent pennies
State gas tax expenditures
County Gas Tax Equivalent Pennies
A review of the County’s historical roadway financing program and the Capital Improvement
Program (CIP) for FY 2015-2019 indicates that a combination of transportation impact fees,
fuel tax bonds, and fuel tax revenues are used to fund roadway capacity expansion projects.
As shown in Table G-2, Palm Beach County receives a credit of 2.0 pennies for the portion of
non-impact fee revenues dedicated to capacity expansion projects such as new road
construction, lane additions, and intersection improvements.
TaxAmount of Levy
per Gallon
Total
Distribution
Distribution
Per Penny
Constitutional Fuel Tax $0.02 $11,386,553 $5,693,277
County Fuel Tax $0.01 $5,018,743 $5,018,743
9th Cent Fuel Tax $0.01 $5,866,198 $5,866,198
1st Local Option (1-6 cents) $0.06 $33,007,582 $5,501,264
2nd Local Option (1-5 cents) $0.05 $24,586,127 $4,917,225
Total $0.15 $79,865,203
$5,324,347Weighted Average per Penny(2)

DRAFT
Tindale Oliver Palm Beach County September 2015 G-4 Impact Fee Update Study
Table G-2 County Gas Tax Equivalent Pennies
(1) Source: Table G-4 (2) Source: Table G-4 (3) Source: Table G-1 (4) Cost of projects divided by number of years divided by revenue from 1 penny (Item 3) divided by 100
State Gas Tax Expenditures
In the calculation of the equivalent pennies of gas tax from the State funded capacity
expansion, projects for the 16-year period (from FY 2004 to FY 2019) were reviewed. For
calculation purposes, the 16-year period was broken into three increments; two historical (FY
2004-2009 and FY 2010-2014) and one future (FY 2015-2019). Information on historical
projects’ funding and the future year estimates was obtained from the FDOT Work Programs
and the County’s Transportation Improvement Program (TIP). The use of a 16-year period,
for purposes of developing a State credit for roadway capacity expansion projects, results in
a stable credit, as it accounts for the volatility in FDOT spending in the county over short
periods of time.
The total cost of the capacity expansion projects for the 11-year “historical” period and
projected in the five-year “future” time period are as follows:
FY 2004-2009 work plan equates to 6.5 pennies
FY 2010-2014 work plan equates to 5.9 pennies
FY 2015-2019 work plan equates to 7.4 pennies
The combined weighted average over the 16-year period of state expenditure for capacity-
adding roadway projects results in a total of 6.6. Table G-3 documents this calculation. The
specific projects that were used in the equivalent penny calculations are summarized in Table
G-5.
Source Cost of ProjectsNumber of
Years
Revenue
from 1
Penny(3)
Equivalent
Pennies(4)
Projected CIP Expenditures (FY 2015-2019) (1) $93,349,000 5 $5,324,347 $0.035
Historical County Expenditures (FY 2008-2014) (2) $36,774,000 7 $5,324,347 $0.010
Total $130,123,000 12 $5,324,347 $0.020
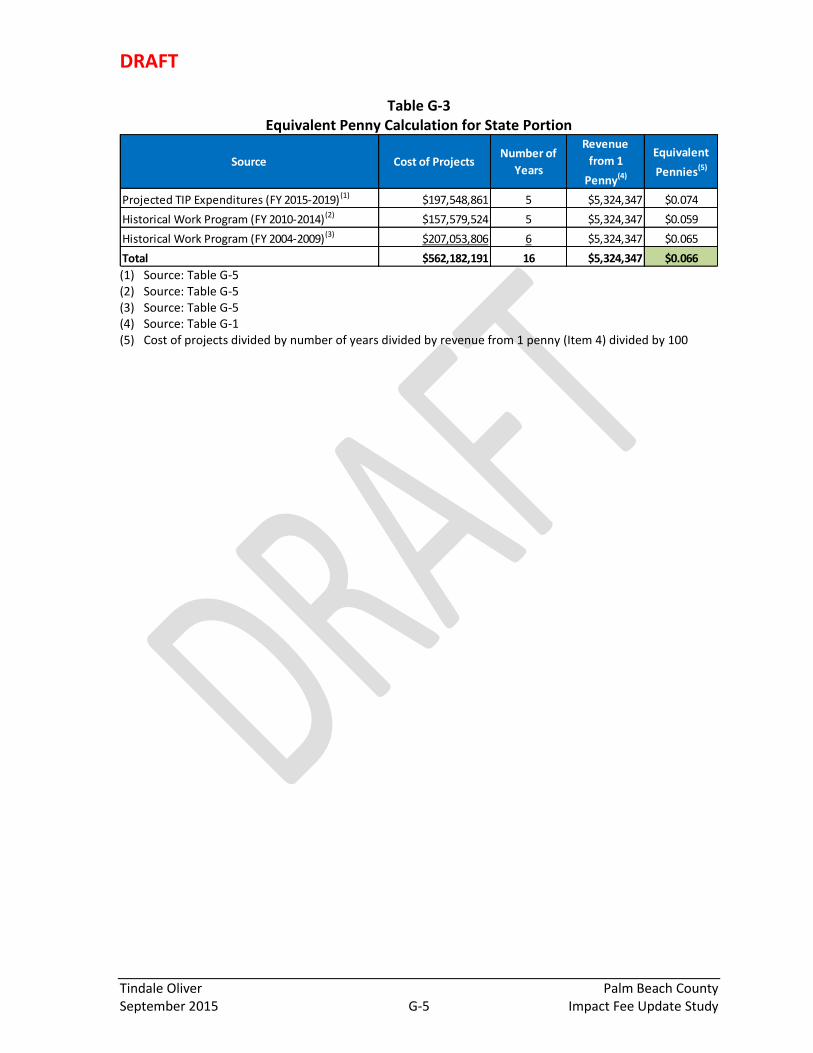
DRAFT
Tindale Oliver Palm Beach County September 2015 G-5 Impact Fee Update Study
Table G-3 Equivalent Penny Calculation for State Portion
(1) Source: Table G-5 (2) Source: Table G-5 (3) Source: Table G-5 (4) Source: Table G-1 (5) Cost of projects divided by number of years divided by revenue from 1 penny (Item 4) divided by 100
Source Cost of ProjectsNumber of
Years
Revenue
from 1
Penny(4)
Equivalent
Pennies(5)
Projected TIP Expenditures (FY 2015-2019) (1) $197,548,861 5 $5,324,347 $0.074
Historical Work Program (FY 2010-2014)(2) $157,579,524 5 $5,324,347 $0.059
Historical Work Program (FY 2004-2009)(3) $207,053,806 6 $5,324,347 $0.065
Total $562,182,191 16 $5,324,347 $0.066

DRAFT
Tindale Oliver Palm Beach County September 2015 G-6 Impact Fee Update Study
Table G-4 Historical and Future Capital Improvement Expenditures for Palm Beach County, FY 2008 to FY 2019
Source: Palm Beach County Financial Management & Budget Department and the Palm Beach County FY 2015-2019 Capital Improvement Program
Table G-5
Historical and Future FDOT Capital Improvement Expenditures for Palm Beach County, FY 2004 to FY 2019
Unit # Description Project Title FY 2008-14 FY 2015 FY 2016 FY 2017 FY 2018 FY 2019 Total
- Expansion Improvements Countywide $36,774,000 $0 $0 $0 $0 $0 $36,774,000
1369 New Road Construction (0 to 2 Lanes) Congress Ave from N. of Northlake Blvd to Alternate A1A - $0 $1,360,000 $0 $2,500,000 $0 $3,860,000
- Intersection Improvements Countywide - $870,000 $723,000 $1,223,000 $1,223,000 $0 $4,039,000
0670 Lane Addition Jog Rd from Roebuck Rd to S. of 45th St - $0 $0 $0 $30,000,000 $0 $30,000,000
1348 Intersection Improvements Northlake Blvd and Military Trail - $0 $0 $350,000 $0 $0 $350,000
0924 Recording Fees - Countywide Funding for the expenses incurred in ROW acquistions - $20,000 $20,000 $20,000 $20,000 $20,000 $100,000
- Reserve for Plans and Alignment Funding for design, study, and mitigation costs for projects in the program - $200,000 $200,000 $200,000 $200,000 $200,000 $1,000,000
- Reserves for Right-of-Way Funding for ROW acquisition costs for projects included in the program - $200,000 $200,000 $200,000 $200,000 $200,000 $1,000,000
1157 Lane Addition Roebuck Rd from SR 7 to Jog Rd - $0 $0 $0 $50,000,000 $0 $50,000,000
- Traffic Signals Countywide - $600,000 $600,000 $600,000 $600,000 $600,000 $3,000,000
Total $36,774,000 $1,890,000 $3,103,000 $2,593,000 $84,743,000 $1,020,000 $130,123,000
Item # Project Description Improvement FY 2004 FY 2005 FY 2006 FY 2007 FY 2008 FY 2009 FY 2010 FY 2011 FY 2012 FY 2013 FY 2014 FY 2015 FY 2016 FY 2017 FY 2018 FY 2019 Total
228987-1 SR-80/Southern Blvd from W. of Congress Ave to W. of SR-9/I-95 Add Lanes & Reconstruct $2,426,342 $1,039,847 $106,906 $307,792 $0 $0 $0 $0 $0 $0 $0 $0 $0 $0 $0 $0 $3,880,887
229092-1 SR-7/US-441 from N. of SR-808/Glades to W. Atlantic/SR-806 Add Lanes & Reconstruct $214,283 $657 $45,002 $0 $0 $0 $0 $0 $0 $0 $0 $0 $0 $0 $0 $0 $259,942
229183-1 SR-7/US-441 from SR-806/W Atlantic Ave to N. of SR-804/Boynton Add Lanes & Reconstruct $4,330 $0 $0 $0 $0 $12,125 $0 $0 $0 $0 $0 $0 $0 $0 $0 $0 $16,455
229184-1 SR-7/US-441 from N. of SR-804/Boynton to SR-802/Lake Worth Rd Add Lanes & Reconstruct $30,167 $0 $0 $0 $0 $0 $0 $0 $0 $0 $0 $0 $0 $0 $0 $0 $30,167
229253-1 Palm Beach County Computer Signal Operations Traffic Control Devices/System $300,001 $300,000 $0 $0 $0 $0 $0 $0 $0 $0 $0 $0 $0 $0 $0 $0 $600,001
229253-2 Palm Beach County Computer Signal Operations Traffic Control Devices/System $0 $0 $399,999 $400,000 $400,000 $345,014 $282,490 $0 $0 $0 $0 $0 $0 $0 $0 $0 $1,827,503
229253-3 Palm Beach County Computer Signal Operations Traffic Control Devices/System $0 $0 $0 $0 $0 $0 $0 $500,000 $500,000 $500,000 $500,000 $500,000 $0 $0 $0 $0 $2,500,000
229497-1 SR-80/Southern Blvd from E. of Forest Hill Blvd to W. of SR-7 Add Lanes & Reconstruct $853,444 $3,497,741 $1,007,993 $39,099 $229,080 $1,484 $192 $0 $0 $0 $0 $0 $0 $0 $0 $0 $5,629,033
229498-1 SR-80/Southern Blvd from W. of SR-7 to W. of Turnpike Add Lanes & Reconstruct $35,896,447 $2,970,354 $2,053,508 $4,345,942 $3,179,622 $1,664,097 $1,184,739 $2,081 $0 $0 $0 $0 $0 $0 $0 $0 $51,296,790
229499-1 SR-80/Southern Blvd from W. of Turnpike to W. of Haverhill Add Lanes & Reconstruct $901,221 $1,588,036 $2,430,019 $991,728 $71,753 $0 $0 $0 $0 $0 $0 $0 $0 $0 $0 $0 $5,982,757
229567-2 SR-806/Atlantic Ave from W. of Turnpike to E. of Jog Rd Add Lanes & Reconstruct $0 $0 $0 $0 $1,309 $2,112 $183 $322,594 $2,498 $0 $0 $0 $0 $0 $0 $0 $328,696
229587-1 SR-809/Military Tr from S. of 45th St to S. of 708/Blue Heron Add Lanes & Reconstruct $1,395,580 $1,097,479 $71,321 $1,032 $10,106 $0 $0 $0 $0 $0 $0 $0 $0 $0 $0 $0 $2,575,518
229587-2 SR-809/Military Tr from SR-704/Okeechobee Blvd to S. of 45th St Add Lanes & Reconstruct $2,978,982 $151,567 $1,071,424 $326,977 $1,030,821 $114,264 $300,760 $0 $0 $0 $0 $0 $0 $0 $0 $0 $5,974,795
229587-9 SR-809/Military Tr Sound Wall Replacement Add Lanes & Reconstruct $0 $0 $0 $0 $0 $65,282 $42,510 $0 $0 $0 $0 $0 $0 $0 $0 $0 $107,792
229648-1 SR-708/Blue Heron from W of Military Trail to W. of I-95 Add Lanes & Reconstruct $7,094,621 $372,354 $145,802 $51,589 $0 $0 $0 $0 $0 $0 $0 $0 $0 $0 $0 $0 $7,664,366
229658-1 SR-806/Atlantic Ave from SR-7 to E. of Turnpike PD&E/Emo Study $39,320 $9,991 $5,598 $0 $0 $0 $0 $0 $0 $0 $0 $0 $0 $0 $0 $0 $54,909
229658-2 SR-806/Atlantic Ave from E. of Starkey Rd to Turnpike Entrance Add Lanes & Reconstruct $0 $6,749 $2,004,560 $1,484,916 $1,615,696 $90,873 $0 $0 $0 $0 $0 $0 $0 $0 $0 $0 $5,202,794
229658-3 SR-806/Atlantic Ave from W. of Lyons Rd to Starkey Rd Traffic Control Devices/System $0 $0 $9,831 $2,515 $3,707,257 $3,010 $2,448 $5,030 $30,756 $20,397 $148,335 $70,571 $0 $0 $0 $0 $4,000,150
229664-2 SR-7 from SR-704/Okeechobee Blvd to Northlake Blvd New Road Construction $0 $1,817,046 $49,339 $48,949 $48,364 $43,562 $1,738,842 $2,870,746 $354,226 $125,008 $255,830 $0 $0 $0 $0 $0 $7,351,912
229664-3 SR-7 from 60th St to Northlake Blvd New Road Construction $0 $0 $0 $0 $0 $0 $0 $0 $0 $0 $399,433 $502,668 $52,578,050 $183,199 $0 $0 $53,663,350
229664-4 SR-7 from SR-704/Okeechobee Blvd to 60th St New Road Construction $0 $0 $0 $0 $0 $0 $0 $0 $0 $0 $332,998 $0 $0 $26,432,327 $0 $0 $26,765,325
229713-1 SR-80/Southern Blvd Interchange/Stage 2 @ SR-807/Congress Ave Interchange (Major) $2,862,016 $1,264,404 $147 $0 $0 $0 $0 $0 $0 $0 $0 $0 $0 $0 $0 $0 $4,126,567
229731-1 Palm Beach County Signal Sys/Group 4 Signal Pkg Traffic Control Devices/System $19,121 $0 $0 $0 $0 $0 $0 $0 $0 $0 $0 $0 $0 $0 $0 $0 $19,121
229755-1 SR-704/Okeechobee Blvd from W. of Clearlake Bridge to Australian Ave/Tamarind Add Turn Lane(s) $2,045 $933,359 $0 $91,780 $1,183,255 $1,539,405 $2,078,867 $0 $1,949 $119,385 $2,867 $0 $0 $0 $0 $0 $5,952,912
229765-1 Palm Beach County/JPA Install Traffic Devices w/Palm Beach County Traffic Control Devices/System $307,651 $88,388 $10,467 $10,969 $900 $0 $0 $0 $0 $0 $0 $0 $0 $0 $0 $0 $418,375
229765-2 Palm Beach County/JPA Install Traffic Devices Traffic Control Devices/System $0 $0 $0 $0 $510,571 $376,270 $77,972 $9,510 $13,294 $6,661 $3,000 $0 $0 $0 $0 $0 $997,278
229769-1 SR-808/Glades Rd @ Dixie Hwy Intersection (Minor) $554,970 $11,413 $0 $0 $0 $0 $0 $0 $0 $0 $0 $0 $0 $0 $0 $0 $566,383
229771-1 SR-786/PGA Blvd @ SR-811 /FEC RR W. of I-95 to Fairchild Interchange (New) $866,477 $816,593 $402,939 $800,881 $737,711 $141,749 $192,380 $2,056 $524 $77,272 $2,264,936 $0 $0 $0 $0 $0 $6,303,518
229797-1 SR-80/Southern Blvd from W. of Haverhill to W. of Congress Ave Add Lanes & Reconstruct $1,553,694 $2,112,744 $1,101,614 $2,295,928 $784,237 $900,994 $10,202 $405,393 $0 $0 $0 $0 $0 $0 $0 $0 $9,164,806
229826-1 Palm Beach Countywide Minor Projects Design/Traffic Ops Preliminary Engineering $64,136 $0 $0 $0 $0 $0 $0 $0 $0 $0 $0 $0 $0 $0 $0 $0 $64,136
229827-1 Palm Beach Countywide Minor Projects Design/Traffic Ops Preliminary Engineering $229,433 $72,748 $0 $0 $0 $0 $0 $0 $0 $0 $0 $0 $0 $0 $0 $0 $302,181
229841-1 Western Brow/PBC X from Broward/Palm Beach Co Line to Glades Rd PD&E/Emo Study $5,513 $6,734 $3,780 $97,560 $503 $0 $0 $0 $0 $0 $0 $0 $0 $0 $0 $0 $114,090
229842-1 Boca Signal System Enhance Traffic System & Operations Traffic Control Devices/System $159,000 $77,000 $81,000 $85,000 $88,950 $0 $0 $0 $0 $0 $0 $0 $0 $0 $0 $0 $490,950
229842-2 Boca Signal System Enhance Traffic System & Operations Traffic Control Devices/System $0 $0 $0 $0 $0 $94,000 $98,000 $103,000 $0 $0 $0 $0 $0 $0 $0 $0 $295,000
229842-3 Boca Signal System Traffic Signal Equipment Upgrades Traffic Control Devices/System $0 $0 $0 $0 $0 $0 $0 $0 $150,076 $150,015 $0 $0 $0 $0 $0 $0 $300,091
229892-1 SR-807/Congress Ave from Lantana Rd to 6 Ave S Add Lanes & Reconstruct $25,558 $33,173 $18,545 $6,344 $1,524 $0 $0 $0 $0 $0 $0 $0 $0 $0 $0 $0 $85,144
229892-2 CR-807/Congress Ave from Lantana Rd to S. of Malaleuca Lane Add Lanes & Reconstruct $0 $0 $0 $0 $0 $208 $5,465,709 $2,222 $689 $0 $0 $0 $0 $0 $0 $0 $5,468,828
229895-1 SR-710/Beeline Hwy from Dixie Hwy to SR-5/US-1/Riviera Beach New Road Construction $87,155 $645 $0 $0 $0 $0 $0 $0 $81 $0 $0 $0 $0 $0 $0 $0 $87,881
229895-2 SR-710 (Port of PBC) Connection to SR-5/US-1 PD&E/Emo Study $0 $0 $0 $0 $819,974 $26,888 $26,396 $32,907 $42,703 $0 $0 $0 $0 $0 $0 $0 $948,868
229896-1 SR-710/Beeline Hwy from W. of Australian Ave to Old Dixie Hwy Add Lanes & Reconstruct $37,537 $6,706,433 $7,212,663 $1,728,532 $2,872,037 $1,917,058 $543,781 $440,288 $3,956,882 $8,410,608 $7,265,014 $2,600,000 $25,255,785 $982,441 $0 $0 $69,929,059
229897-1 SR-710/Beeline Hwy from Military Trail to W. of Congress Ave Add Lanes & Reconstruct $27,565 $711,439 $138,348 $24,165,428 $374,439 $465,932 $167,091 $0 $0 $0 $15,400 $0 $0 $0 $0 $0 $26,065,642
229897-2 SR-710/Beeline Hwy from W. of Cnogress Ave to W. of Australian Ave Add Lanes & Reconstruct $0 $697,035 $57,240 $4,363,635 $4,324,005 $988,901 $2,055,494 $7,631,169 $15,860,555 $869,688 $780,225 $0 $0 $0 $0 $0 $37,627,947
230337-2 R/W Revenue from Leases Palm Beach Right-of-Way Activities $0 $0 $0 $0 $0 $4 $0 $0 $0 $0 $202 $0 $0 $0 $0 $0 $206
231276-1 SR-811/Dixie Hwy from Brow/PBC Co Line to SW 18 St/Boca Add Lanes & Reconstruct $17,154 $6,656 $12,845 $71,758 $808,576 $9,136 $2,529,407 $86,330 $14,532 $22,107 $0 $0 $0 $0 $0 $0 $3,578,501
233166-2 SR-808/Glades Rd from SR-7 to SR-5 PD&E/Emo Study $0 $0 $0 $0 $0 $0 $0 $2,704,529 $37,418 $19,747 $13,114 $4,255,000 $0 $0 $2,088,526 $0 $9,118,334

DRAFT
Tindale Oliver Palm Beach County September 2015 G-7 Impact Fee Update Study
Table G-5 (continued) Historical and Future FDOT Capital Improvement Expenditures for Palm Beach County, FY 2004 to FY 2019
Source: FDOT Work Program Reports for Palm Beach County and the Palm Beach County FY 2015-2019 Transportation Improvement Program
Item # Project Description Improvement FY 2004 FY 2005 FY 2006 FY 2007 FY 2008 FY 2009 FY 2010 FY 2011 FY 2012 FY 2013 FY 2014 FY 2015 FY 2016 FY 2017 FY 2018 FY 2019 Total
403605-2 SR-804/Boynton Beach @ Old Boynton Rd Traffic Signals $0 $0 $0 $0 $179,741 $0 $0 $0 $0 $0 $0 $0 $0 $0 $0 $0 $179,741
404739-1 Palm Beach JPA Signal Maintenance & Operations on SHS Traffic Signals $498,745 $673,947 $695,746 $734,718 $770,392 $780,937 $806,246 $0 $0 $0 $0 $0 $0 $0 $0 $0 $4,960,731
404838-1 Palm Beach County Regional ATIS Project (Dade/Broward/Palm Beach) Traffic Control Devices/System $0 $0 $175,000 $175,000 $175,000 $47,563 $0 $0 $0 $0 $0 $0 $0 $0 $0 $0 $572,563
405786-1 SR-5/West Palm Beach Core Area Traffic Calming Downtown Preliminary Engineering $0 $66,753 $1,500,000 $0 $0 $0 $0 $0 $0 $0 $0 $0 $0 $0 $0 $0 $1,566,753
408198-1 Boca Raton ATMS Master Plan Traffic Control Devices/System $250,000 $0 $0 $0 $0 $0 $0 $0 $0 $0 $0 $0 $0 $0 $0 $0 $250,000
408198-1 Boca Raton ATMS Master Plan Traffic Control Devices/System $0 $250,000 $250,000 $1,127,756 $0 $0 $0 $0 $0 $0 $0 $0 $0 $0 $0 $0 $1,627,756
408198-3 Boca Raton ATMS Electronic Counter Traffic Control Devices/System $0 $0 $0 $0 $0 $0 $0 $0 $312,084 $0 $0 $0 $0 $0 $0 $0 $312,084
409820-1 US-1 Corridor from Lake Worth Rd to PGA Blvd Urban Corridor Improvements $0 $0 $0 $0 $910,190 $0 $0 $0 $0 $0 $0 $0 $0 $0 $0 $0 $910,190
410540-1 Airport Rd @ SR-808/Glades Rd Intersection (Minor) $503,800 $0 $0 $0 $0 $0 $0 $0 $0 $0 $0 $0 $0 $0 $0 $0 $503,800
410655-1 SR-5/US-1/Lantana from S. of Lantana C/L to SR-805 Traffic Signals $132,738 $0 $0 $0 $0 $0 $0 $0 $0 $0 $0 $0 $0 $0 $0 $0 $132,738
411073-1 SR-80/Mobility 2000 from E. of Forest Hill Blvd to W. of Congress Ave Prelim Eng for Future Capacity $300,000 $253,763 $206,912 $0 $0 $0 $0 $0 $0 $0 $0 $0 $0 $0 $0 $0 $760,675
412489-4 ITS Equipment for Traffic Mangement System Opticom System Traffic Control Devices/System $0 $0 $0 $0 $0 $0 $0 $0 $0 $79,288 $336 $0 $0 $0 $0 $0 $79,624
412489-5 ITS Equipment for Traffic Mangement System Opticom System Traffic Control Devices/System $0 $0 $0 $0 $0 $0 $0 $0 $0 $0 $12,000 $0 $0 $0 $0 $0 $12,000
413265-1 SR-5/US-1 from S. Glades Rd to N. of Yamato Rd (Boca) PD&E/Emo Study $0 $0 $50 $2,550 $91 $6,890 $1,102,336 $20,780 $48,911 $3,779 $1,978 $0 $0 $0 $0 $0 $1,187,365
413841-1 SR-806/Atlantic Ave from Via Flora to E. of Congress Ave Add Turn Lane(s) $821 $1,088,811 $12,314 $81,284 $732,888 $84,135 $115,212 $139,959 $88 $0 $0 $0 $0 $0 $0 $0 $2,255,512
415493-1 SR-786/PGA Blvd from Kew Gardens Dr to SR-5/US-1 Traffic Signals $1,850 $205,306 $3,217 $44,703 $0 $0 $0 $0 $0 $0 $0 $0 $0 $0 $0 $0 $255,076
416525-1 Palm Beach County ATMS/DG #3 Cameras & 11 DMS Signs Traffic Control Devices/System $0 $0 $638,083 $0 $0 $0 $0 $0 $0 $0 $0 $0 $0 $0 $0 $0 $638,083
416525-2 Palm Beach County ATMS Design Group 3 Traffic Control Devices/System $0 $0 $0 $0 $0 $0 $0 $2,953,650 $49,329 $6,107 $10,533 $0 $0 $0 $0 $0 $3,019,619
416589-1 SR-5/US-1 @ Tropic Blvd in Delray Traffic Signals $0 $300,000 $0 $0 $0 $0 $0 $0 $0 $0 $0 $0 $0 $0 $0 $0 $300,000
417062-1 SR-708/Blue Heron Blvd @ Congress Ave Add Turn Lane(s) $0 $350,000 $0 $0 $0 $0 $0 $0 $0 $0 $0 $0 $0 $0 $0 $0 $350,000
417062-2 SR-708/Blue Heron Blvd @ Congress Ave Ph. II Add Turn Lane(s) $0 $0 $0 $0 $495,888 $307,909 $2,653,669 $129,620 $219,684 $614,638 $93,708 $0 $0 $0 $0 $0 $4,515,116
417737-1 Palm Beach ITS Facil ity Operations Traffic Management Center $0 $0 $0 $0 $0 $29,415 $67,296 $57,183 $39,250 $55,014 $50,000 $0 $0 $0 $0 $0 $298,158
417737-1 Palm Beach TMC Staffing ITS Communication System $0 $0 $0 $0 $0 $0 $0 $557,277 $1,053,262 $1,053,262 $0 $0 $0 $0 $0 $0 $2,663,801
419251-1 SR-710/Beeline Hwy from Northlake Blvd to Blue Heron Blvd Add Lanes & Reconstruct $0 $0 $0 $0 $0 $0 $0 $0 $0 $0 $0 $4,800,000 $0 $0 $0 $0 $4,800,000
419345-1 SR-80 from CR-880 to Forest Hill Blvd PD&E/Emo Study $0 $0 $0 $0 $0 $33,495 $1,259,164 $63,076 $33,165 $53 $4,947 $0 $0 $0 $0 $0 $1,393,900
419345-2 SR-80 from W. of Lion Co Safari Rd to Forest Hill/Crestwood Blvd Add Lanes & Rehabilitate Pvmnt $0 $0 $0 $0 $0 $0 $0 $0 $2,359,559 $32,337 $906,209 $1,370,999 $1,474,468 $1,076,303 $39,362,058 $0 $46,581,933
419348-1 SR-710 from PBC/Martin Co Line to Congress Ave PD&E/Emo Study $0 $0 $7,716,973 $32,985 $41,969 $37,342 $22,624 $81,479 $925 $15,566 $7,526 $0 $154,994 $0 $0 $0 $8,112,383
420356-1 Congress Ave @ Intermodal Center Delray Intersection (New) $0 $0 $0 $0 $45,188 $3,862 $476,183 $167 $0 $0 $0 $0 $0 $0 $0 $0 $525,400
421785-1 SR-807/Congress Ave @ SR 882 Forest Hill Blvd Intersection Improvement Add Turn Lane(s) $0 $0 $0 $37,158 $0 $0 $0 $0 $0 $0 $0 $0 $0 $0 $0 $0 $37,158
421786-1 Lyons Rd from SR-804/Boynton Beach Blvd to SR-806/Atlantic Ave New Road Construction $0 $0 $0 $2,850,000 $0 $0 $3,780,002 $0 $0 $0 $0 $0 $0 $0 $0 $0 $6,630,002
422769-2 Jog Rd @ 45th St New Road Construction $0 $0 $0 $0 $2,220,015 $0 $0 $0 $0 $0 $0 $0 $0 $0 $0 $0 $2,220,015
422837-1 SR-15/FEC Corridor Demolition of a Structure in Canal Point Right-of-Way Activities $0 $0 $0 $0 $7,188 $0 $0 $0 $0 $0 $0 $0 $0 $0 $0 $0 $7,188
423983-1 Hypoluxo Rd from Jog Rd to Military Trail Add Lanes & Reconstruct $0 $0 $0 $0 $1,875,370 $0 $0 $0 $0 $0 $0 $0 $0 $0 $0 $0 $1,875,370
424764-2 SR-9/I-95 from Broward/Palm Beach Co Line to SR-706 PD&E/Emo Study $0 $0 $0 $0 $0 $705 $873,558 $12,809 $590 $0 $0 $0 $0 $0 $0 $0 $887,662
425960-1 Palm Beach County Push Button-Contract for Signalization Traffic Control Devices/System $0 $0 $0 $0 $0 $0 $0 $122,412 $42,660 $11,391 $0 $0 $0 $0 $0 $0 $176,463
425960-2 Palm Beach County Push Button-Contract for Signalization Traffic Control Devices/System $0 $0 $0 $0 $0 $0 $0 $0 $10,000 $618,021 $60,982 $0 $0 $0 $0 $0 $689,003
425960-3 Palm Beach County Push Button-Contract for Signalization Traffic Control Devices/System $0 $0 $0 $0 $0 $0 $0 $0 $0 $0 $0 $1,051,319 $0 $0 $0 $0 $1,051,319
425960-4 Palm Beach County Push Button-Contract for Signalization Traffic Control Devices/System $0 $0 $0 $0 $0 $0 $0 $0 $0 $0 $0 $0 $0 $1,113,500 $0 $0 $1,113,500
425960-5 Palm Beach County Push Button-Contract for Signalization Traffic Control Devices/System $0 $0 $0 $0 $0 $0 $0 $0 $0 $0 $0 $0 $0 $0 $0 $1,065,443 $1,065,443
427802-1 Palm Beach County JPA Signal Maintenance & Ops on SHS Traffic Signals $0 $0 $0 $0 $0 $0 $0 $766,173 $793,417 $822,085 $849,955 $894,534 $0 $0 $0 $0 $4,126,164
427802-2 Palm Beach County JPA Signal Maintenance & Ops on SHS Traffic Signals $0 $0 $0 $0 $0 $0 $0 $76,247 $78,545 $80,901 $81,882 $89,441 $0 $0 $0 $0 $407,016
427802-3 Palm Beach County Signal Maintenance & Ops on SHS Traffic Signals $0 $0 $0 $0 $0 $0 $0 $0 $0 $0 $0 $0 $901,800 $928,900 $956,800 $985,504 $3,773,004
427802-4 City of Boca Raton Signal Maintenance & Ops on SHS Traffic Signals $0 $0 $0 $0 $0 $0 $0 $0 $0 $0 $0 $0 $88,500 $92,000 $95,000 $97,850 $373,350
427938-1 SR-7/US-441 from Broward/Palm Beach Co Line to SR-808/Glades Rd PD&E/Emo Study $0 $0 $0 $0 $0 $0 $0 $2,077,371 $28,869 $21,173 $12,174 $1,400,000 $0 $0 $0 $9,368,876 $12,908,463
428451-1 SR-25/US-27 from Brow/PBC Co Line to N. of South Bay ITS Communication System $0 $0 $0 $0 $0 $0 $146,660 $4,551 $3,154,144 $956 $18,481 $0 $0 $0 $0 $0 $3,324,792
428468-2 Palm Beach County Master Dewatering Permit w/SFWMD Preliminary Engineering $0 $0 $0 $0 $0 $0 $4,000 $0 $0 $0 $0 $0 $0 $0 $0 $0 $4,000
429738-1 SR-805/Dixie Hwy @ 12th Ave S Safety Project Intersection Improvement $0 $0 $0 $0 $0 $0 $0 $0 $153,538 $48,228 $7,133 $787,146 $0 $0 $0 $0 $996,045
431645-1 SR-809/Military Trail at Northlake Blvd Add Turn Lane(s) $0 $0 $0 $0 $0 $0 $0 $0 $0 $100,000 $0 $0 $0 $0 $0 $0 $100,000
431645-2 SR-809/Military Trail at Northlake Blvd Add Turn Lane(s) $0 $0 $0 $0 $0 $0 $0 $0 $0 $0 $63,738 $86,360 $0 $0 $0 $0 $150,098
431803-1 Palm Beach County Install Pivotal Hangers on Traffic Signals Traffic Signals $0 $0 $0 $0 $0 $0 $0 $0 $0 $1,502,023 $27,390 $0 $0 $0 $0 $0 $1,529,413
432704-1 SR-710/Beeline Hwy from W. of Indiantown Rd to W. of Pratt Whitney Add Lanes & Reconstruct $0 $0 $0 $0 $0 $0 $0 $0 $0 $71,085 $34,693,456 $0 $0 $0 $0 $0 $34,764,541
432706-1 SR-710/Beeline Hwy from PBC/Martin Co Line to W. of Indiantown Rd Add Lanes & Reconstruct $0 $0 $0 $0 $0 $0 $0 $0 $0 $0 $11,507,069 $0 $0 $0 $0 $0 $11,507,069
432883-1 Palm Beach County Adaptive Traffic Control System - Northlake ATMS - Arterial Traffic Mgmt $0 $0 $0 $0 $0 $0 $0 $0 $0 $94,113 $735,038 $0 $0 $0 $0 $0 $829,151
432883-2 Palm Beach County Adaptive Traffic Control System - SR-786/PGA Blvd ATMS - Arterial Traffic Mgmt $0 $0 $0 $0 $0 $0 $0 $0 $0 $0 $0 $0 $175,000 $0 $1,656,098 $0 $1,831,098
433064-1 Congress Ave Ext from Northlake Blvd to Alternate A1A New Road Construction $0 $0 $0 $0 $0 $0 $0 $0 $0 $0 $250,000 $0 $1,365,909 $0 $2,500,000 $0 $4,115,909
433947-1 SR-704/Okeechobee Blvd from Tamarind Ave to Flagler Dr ATMS - Arterial Traffic Mgmt $0 $0 $0 $0 $0 $0 $0 $0 $0 $31,631 $645,355 $0 $0 $0 $0 $0 $676,986
435122-1 SR-882/Forest Hill Blvd at Kirk Rd Add Turn Lane(s) $0 $0 $0 $0 $0 $0 $0 $0 $0 $0 $0 $167,321 $1,502,755 $0 $0 $0 $1,670,076
435144-1 SR-708/Blue Heron from 200ft W. of Avenue S to 200ft E. of Avenue S Intersection Improvement $0 $0 $0 $0 $0 $0 $0 $0 $0 $0 $225,000 $226,491 $0 $533,557 $0 $0 $985,048
435158-1 SR-80/Southern Blvd as Sansbury Way/Lyons Rd Intersection Improvement $0 $0 $0 $0 $0 $0 $0 $0 $0 $0 $0 $725,000 $0 $0 $3,488,690 $0 $4,213,690
435386-1 US-27/SR-25 Intersection with SR-80 Add Lanes & Reconstruct $0 $0 $0 $0 $0 $0 $0 $0 $0 $0 $121,516 $62,714 $1,454,964 $0 $0 $0 $1,639,194
Total $60,641,717 $29,579,165 $29,639,185 $46,804,508 $30,254,610 $10,134,621 $28,104,413 $22,180,609 $29,344,203 $15,582,539 $62,367,760 $19,589,564 $84,952,225 $31,342,227 $50,147,172 $11,517,673 $562,182,191

DRAFT
Tindale Oliver Palm Beach County September 2015 G-8 Impact Fee Update Study
Table G-6 Average Motor Vehicle Fuel Efficiency – Excluding Interstate Travel
Source: See Table G-7
21.6 6.4 @ 21.6 mpg @ 6.4 mpg
Other Arterial Rural 307,851,000,000 46,140,000,000 353,991,000,000 87% 13%
Other Rural 313,445,000,000 30,367,000,000 343,812,000,000 91% 9%
Other Urban 1,436,559,000,000 86,263,000,000 1,522,822,000,000 94% 6%
Total 2,057,855,000,000 162,770,000,000 2,220,625,000,000 93% 7%
Gallons @ 21.6 mpg Gallons @ 6.4 mpg 2,220,625 miles (millions)
Other Arterial Rural 14,252,361,111 7,209,375,000 21,461,736,111 120,704 gallons (millions)
Other Rural 14,511,342,593 4,744,843,750 19,256,186,343 18.40 mpg
Other Urban 66,507,361,111 13,478,593,750 79,985,954,861
Total 95,271,064,815 25,432,812,500 120,703,877,315
Source: U.S. Department of Transportation, Federal Highway Administration, Highway Statistics 2013 , Section V, Table VM-1
Annual Vehicle Distance Traveled in Miles and Related Data - 2013 by Highway Category and Vehicle Type
http://www.fhwa.dot.gov/policyinformation/statistics.cfm
Fuel Consumed Total Mileage and Fuel
Travel
Vehicle Miles of Travel (VMT) @ Percent VMT

DRAFT
Tindale Oliver Palm Beach County September 2015 G-9 Impact Fee Update Study
Table G-7 Annual Vehicle Distance Traveled in Miles and Related Data (2013) - By Highway Category and Vehicle Type (1)
Published January 2015 TABLE VM-1
ALL LIGHT
VEHICLES(2)
SINGLE-UNIT 2-AXLE
6-TIRE OR MORE
AND COMBINATION
TRUCKS
Motor-Vehicle Travel:
(mill ions of vehicle-miles)
2013 Interstate Rural 132,342 1,240 1,513 41,931 9,255 48,022 174,273 57,277 234,303
2013 Other Arterial Rural 222,632 2,692 2,079 85,220 16,673 29,467 307,851 46,140 358,762
2013 Other Rural 222,564 2,960 2,075 90,881 17,217 13,150 313,445 30,367 348,846
2013 All Rural 577,538 6,891 5,667 218,032 43,144 90,640 795,569 133,784 941,912
2013 Interstate Urban 359,386 2,550 2,144 86,257 15,510 39,462 445,643 54,971 505,309
2013 Other Urban 1,137,534 10,925 7,356 299,024 47,929 38,334 1,436,559 86,263 1,541,102
2013 All Urban 1,496,920 13,475 9,500 385,282 63,438 77,796 1,882,202 141,234 2,046,411
2013 Total Rural and Urban(5) 2,074,458 20,366 15,167 603,313 106,582 168,436 2,677,771 275,018 2,988,323
2013 Number of motor vehicles 184,497,490 8,404,687 864,549 51,512,740 8,126,007 2,471,349 236,010,230 10,597,356 255,876,822
registered(2)
2013 Average miles traveled 11,244 2,423 17,543 11,712 13,116 68,155 11,346 25,952 11,679
per vehicle
2013 Person-miles of travel (4) 2,882,221 21,937 321,544 805,997 106,582 168,436 3,688,218 275,018 4,306,717
(mill ions)
2013 Fuel consumed 88,611,046 467,716 2,116,657 35,158,673 14,501,958 28,794,905 123,769,719 43,296,864 169,650,956
(thousand gallons)
2013 Average fuel consumption per 480 56 2,448 683 1,785 11,651 524 4,086 663
vehicle (gallons)
2013 Average miles traveled per 23.4 43.5 7.2 17.2 7.3 5.8 21.6 6.4 17.6
gallon of fuel consumed
(3) Single-Unit - s ingle frame trucks that have 2-Axles and at least 6 ti res or a gross vehicle weight rating exceeding 10,000 lbs .
(4) Vehicle occupancy is estimated by the FHWA from the 2009 National Household Travel Survey (NHTS); For s ingle unit truck and heavy trucks , 1 motor vehicle mi le travel led = 1 person-mi le traveled.
(5) VMT data are based on the latest HPMS data avai lable; i t may not match previous publ ished results .
SINGLE-UNIT
TRUCKS(3)
COMBINATION
TRUCKS
SUBTOTALS
ALL MOTOR
VEHICLES
(1) The FHWA estimates national trends by us ing State reported Highway Performance and Monitoring System (HPMS) data, fuel consumption data (MF-21 and MF-27), vehicle regis tration data (MV-1,
MV-9, and MV-10), other data such as the R.L. Polk vehicle data, and a host of model ing techniques . Starting with the 2009 VM-1, an enhanced methodology was used to provide timely indicators on
both travel and travel behavior changes .
(2) Light Duty Vehicles Short WB - passenger cars , l ight trucks , vans and sport uti l i ty vehicles with a wheelbase (WM) equal to or less than 121 inches . Light Duty Vehicles Long WB - large passenger
cars , vans , pickup trucks , and sport/uti l i ty vehicles with wheelbases (WB) larger than 121 inches . Al l Light Duty Vehicles - passenger cars , l ight trucks , vans and sport uti l i ty vehicles regardless of
YEAR ITEM
LIGHT DUTY
VEHICLES
SHORT WB(2)
MOTOR-
CYCLESBUSES
LIGHT DUTY
VEHICLES
LONG WB(2)

DRAFT
APPENDIX H Calculated Transportation Impact Fee Schedule

DRAFT
Tindale Oliver Palm Beach County September 2015 H-1 Impact Fee Update Study
Transportation Impact Fee Schedule
This appendix presents the detailed impact fee calculations for each land use in Palm Beach
County’s transportation impact fee schedule.

DRAFT
Tindale Oliver Palm Beach County September 2015 H-2 Impact Fee Update Study
Table H-1 Calculated Transportation Impact Fee Schedule
Gasoline Tax Unit Construction Cost: $3,622,000 Interstate/Toll Facility Adjustment Factor: 32.5%
$$ per gallon to capital: $0.086 Capacity per lane mile: 11,533 Cost per VMC: $314.06
Facility life (years): 25 County Revenues: $0.020 Fuel Efficiency: 18.40 mpg
Interest rate: 3.40% State Revenues: $0.066 Effective days per year: 365
ITE LUC Land Use Unit Trip Rate Trip Rate SourceAssessable Trip
Length
Total Trip
LengthTrip Length Source % New Trips % New Trips Source Net VMT(1) Total Impact
Cost
Annual Gas
Tax
Gas Tax
Credit
Net Impact
Fee
Current Impact
Fee
%
Change
RESIDENTIAL:
Single Family (detached) Less than 1,500 sf du 6.11
FL Studies (NHTS,
AHS, Census) 6.62 7.12 FL Studies 100% N/A 13.65 $4,287 $37 $616 $3,671 $7,281 -50%
Single Family (detached) 1,500-2,499 sf du 7.81
FL Studies (NHTS,
AHS, Census) 6.62 7.12 FL Studies 100% N/A 17.45 $5,480 $47 $783 $4,697 $7,281 -36%
Single Family (detached) 2,500 sf or more du 8.76
FL Studies (NHTS,
AHS, Census) 6.62 7.12 FL Studies 100% N/A 19.57 $6,147 $53 $883 $5,264 $7,281 -28%
220/230 Multi-Family (Apartment/Condo/Townhouse) du 6.32
Blend ITE 9th & FL Studies (LUC
220/230) 5.10 5.60
FL Studies
(LUC 220/230) 100% N/A 10.88 $3,416 $30 $500 $2,916 $4,842 -40%
n/a Accessory Apartment/Grooms Quarters du 3.09
Blend ITE 9th & FL Studies (LUC
251/252/253) 5.10 5.60
FL Studies
(LUC 220/230) 100% N/A 5.32 $1,670 $15 $250 $1,420 $2,912 -51%
240 Mobile Home Park du 4.17 FL Studies 4.60 5.10 FL Studies 100% N/A 6.47 $2,033 $18 $300 $1,733 $3,640 -52%
254 Congregate Living Facility bed 2.66 ITE 9th Edition 3.08 3.58
FL Studies
(LUC 253) 72%
FL Studies
(LUC 253) 1.99 $625 $6 $100 $525 $1,471 -64%
TRANSIENT, ASSISTED, GROUP:
310 Hotel room 6.36
Blend ITE 9th &
FL Studies 6.26 6.76 FL Studies 66% FL Studies 8.87 $2,785 $24 $400 $2,385 $1,948 22%
320 Motel room 5.63 ITE 9th Edition 4.34 4.84 FL Studies 77% FL Studies 6.35 $1,994 $18 $300 $1,694 $2,211 -23%
RECREATIONAL:
412 General Recreation/County Park(2) acre 2.28 ITE 9th Edition 5.11 5.61 FL Schedules 90% FL Schedules 3.54 $1,111 $10 $167 $944 $2,080
unit
change
420 Marina berth 2.96 ITE 9th Edition 6.62 7.12 Same as LUC 210 90% FL Schedules 5.95 $1,869 $16 $267 $1,602 n/a n/a
430 Golf Course hole 35.74 ITE 9th Edition 6.62 7.12 Same as LUC 210 90% FL Schedules 71.87 $22,570 $195 $3,249 $19,321 $8,674 123%
444 Movie Theater w/Matinee(3) screen 106.63
Blend ITE 6th &
FL Studies 2.22 2.72 FL Studies 88% FL Studies 70.31 $22,080 $218 $3,632 $18,448 $415
unit
change
491 Racquet/Tennis Club court 38.70 ITE 9th Edition 5.15 5.65 Same as LUC 710 94% Same as LUC 492 63.23 $19,858 $175 $2,916 $16,942 $9,337 82%
492 Health Club 1,000 sf 32.93 ITE 9th Edition 5.15 5.65 Same as LUC 710 94% FL Studies 53.80 $16,897 $149 $2,483 $14,414 n/a n/a
INSTITUTIONS:
520 Elementary School (Private) student 1.29 ITE 9th Edition 4.30 4.80 FL Schedules 80% FL Schedules 1.50 $470 $4 $67 $403 $602 -33%
522 Middle School (Private) student 1.62 ITE 9th Edition 4.30 4.80 FL Schedules 90% FL Schedules 2.12 $665 $6 $100 $565 $602 -6%
530 High School (Private) student 1.71 ITE 9th Edition 4.30 4.80 FL Schedules 90% FL Schedules 2.23 $701 $6 $100 $601 $602 0%
540 University (7,500 or fewer students) (Private) student 2.00 ITE Regression Analysis 6.62 7.12 Same as LUC 210 90% FL Schedules 4.02 $1,263 $11 $183 $1,080 $602 79%
550 University (more than 7,500 students) (Private) student 1.50 ITE Regression Analysis 6.62 7.12 Same as LUC 210 90% FL Schedules 3.02 $947 $8 $133 $814 $602 35%
560 Church/Synagogue 1,000 sf 9.11 ITE 9th Edition 3.90 4.40 FL Schedules 90% FL Schedules 10.79 $3,389 $31 $517 $2,872 $2,100 37%
210

DRAFT
Tindale Oliver Palm Beach County September 2015 H-3 Impact Fee Update Study
Table H-1 (continued) Calculated Transportation Impact Fee Schedule
ITE LUC Land Use Unit Trip Rate Trip Rate SourceAssessable Trip
Length
Total Trip
LengthTrip Length Source % New Trips % New Trips Source Net VMT(1)
Total Impact
Cost
Annual Gas
Tax
Gas Tax
Credit
Net Impact
Fee
Current Impact
Fee
%
Change
INSTITUTIONS:
565 Day Care Center 1,000 sf 71.88
Blend ITE 9th &
FL Studies 2.03 2.53 FL Studies 73% FL Studies 35.95 $11,290 $113 $1,883 $9,407 $9,618 -2%
566 Cemetery acre 4.73 ITE 9th Edition 6.62 7.12 Same as LUC 210 95% Estimated 10.04 $3,153 $27 $450 $2,703 $575 370%
610 Hospital 1,000 sf 13.22 ITE 9th Edition 6.62 7.12 Same as LUC 210 77% FL Schedules 22.74 $7,143 $62 $1,033 $6,110 $3,604 70%
620 Nursing Home bed 2.76
Blend ITE 9th &
FL Studies 2.59 3.09 FL Studies 89% FL Studies 2.15 $674 $6 $100 $574 $518 11%
640 Animal Hospital/Veterinary Clinic 1,000 sf 32.80
FL Studies
(Pinellas County) 1.90 2.40
FL Studies
(Pinellas County) 70%
FL Studies
(Pinellas County) 14.72 $4,624 $47 $783 $3,841 $3,980 -4%
n/a Funeral Home 1,000 sf 12.60
Previous Palm Beach Fee
Study 2.00 2.50
Previous Palm Beach
Fee Study 50%
Previous Palm Beach
Fee Study 4.25 $1,336 $13 $217 $1,119 $2,233 -50%
OFFICE & FINANCIAL:
Office (50,000 sf and less)(4) 1,000 sf 15.50 ITE 9th equation 5.15 5.65 FL Studies 92% FL Studies 24.79 $7,784 $69 $1,150 $6,634 $3,418 94%
Office (50,001 - 100,000 sf)(4) 1,000 sf 13.13 ITE 9th equation 5.15 5.65 FL Studies 92% FL Studies 21.00 $6,594 $58 $966 $5,628 $2,914 93%
Office (100,001 - 200,000 sf)(4) 1,000 sf 11.12 ITE 9th equation 5.15 5.65 FL Studies 92% FL Studies 17.78 $5,584 $49 $816 $4,768 $2,483 92%
Office (200,001 - 400,000 sf)(4) 1,000 sf 9.41 ITE 9th equation 5.15 5.65 FL Studies 92% FL Studies 15.05 $4,726 $42 $700 $4,026 $2,119 90%
Office (greater than 400,000 sf)(4) 1,000 sf 8.54 ITE 9th equation 5.15 5.65 FL Studies 92% FL Studies 13.66 $4,289 $38 $633 $3,656 $1,929 90%
Medical Office (less than 10,000 sf) 1,000 sf 23.83 FL Studies 5.55 6.05 FL Studies 89% FL Studies 39.73 $12,476 $109 $1,816 $10,660 $7,891 35%
Medical Office (10,000 sf and greater) 1,000 sf 34.72
Blend ITE 9th &
FL Studies 5.55 6.05 FL Studies 89% FL Studies 57.88 $18,178 $159 $2,649 $15,529 $7,891 97%
RETAIL:
817 Nursery (Garden Center) acre 108.10 ITE 9th Edition 1.87 2.37
Same as LUC 820
(50k and less tier) 56%
Same as LUC 820
(50k and less tier) 38.21 $11,999 $122 $2,033 $9,966 $1,699 487%
Retail (50,000 sf and less)(4) 1,000 sfgla 86.56 ITE 9th equation 1.87 2.37 FL Curve 56% FL Curve 30.59 $9,608 $98 $1,633 $7,975 $11,176 -29%
Retail (50,001 - 200,000 sf)(4) 1,000 sfgla 53.28 ITE 9th equation 2.40 2.90 FL Curve 67% FL Curve 28.92 $9,081 $88 $1,466 $7,615 $8,546 -11%
Retail (200,001 - 400,000 sf)(4) 1,000 sfgla 41.80 ITE 9th equation 2.64 3.14 FL Curve 73% FL Curve 27.19 $8,539 $82 $1,366 $7,173 $7,359 -3%
Retail (400,001 - 600,000 sf)(4) 1,000 sfgla 36.27 ITE 9th equation 2.87 3.37 FL Curve 76% FL Curve 26.70 $8,385 $79 $1,316 $7,069 $6,718 5%
Retail (600,001 - 800,000 sf)(4) 1,000 sfgla 32.80 ITE 9th equation 3.10 3.60 FL Curve 79% FL Curve 27.11 $8,514 $80 $1,333 $7,181 $6,287 14%
Retail (greater than 800,000 sf)(4) 1,000 sfgla 30.33 ITE 9th equation 3.34 3.84 FL Curve 81% FL Curve 27.69 $8,697 $80 $1,333 $7,364 $6,287 17%
841 New/Used Car Sales 1,000 sf 28.25
Blend ITE 9th &
FL Studies 4.60 5.10 FL Studies 79% FL Studies 34.65 $10,881 $97 $1,616 $9,265 $6,877 35%
848 Tire Store 1,000 sf 24.87 ITE 9th Edition 3.62 4.12 Same as LUC 942 72% Same as LUC 942 21.88 $6,871 $63 $1,050 $5,821 $14,561 -60%
853 Convenience Store w/Gas Pumps 1,000 sf 775.14
Blend ITE 9th &
FL Studies 1.51 2.01 FL Studies 28% FL Studies 110.61 $34,737 $372 $6,198 $28,539 $34,924 -18%
880/881 Pharmacy with and w/o Drive-Thru 1,000 sf 95.96
Blend ITE 9th &
FL Studies 2.08 2.58 FL Studies 32% FL Studies 21.56 $6,770 $68 $1,133 $5,637 $5,349 5%
710
720
820

DRAFT
Tindale Oliver Palm Beach County September 2015 H-4 Impact Fee Update Study
Table H-1 (continued) Calculated Transportation Impact Fee Schedule
(1) Source: Net VMT calculated as ((Trip Generation Rate* Trip Length* % New Trips)*(1-Interstate/Toll Facility Adjustment Factor)/2). This reflects the unit of vehicle miles of capacity consumed per unit of development and is multiplied by the cost per vehicle (2) The current adopted rate for General Recreation/County Park is charged “per 1,000 sf” (3) The current adopted rate for Movie Theater is charged “per seat” (4) The trip generation rate recommended for the office and shopping center uses the end-point regression value
ITE LUC Land Use Unit Trip Rate Trip Rate SourceAssessable Trip
Length
Total Trip
LengthTrip Length Source % New Trips % New Trips Source Net VMT(1) Total Impact
Cost
Annual Gas
Tax
Gas Tax
Credit
Net Impact
Fee
Current Impact
Fee
%
Change
RETAIL:
890 Furniture Store 1,000 sf 5.06 ITE 9th Edition 6.09 6.59 FL Studies 54% FL Studies 5.62 $1,764 $15 $250 $1,514 $963 57%
912 Bank/Savings w/Drive-In 1,000 sf 159.34
Blend ITE 9th &
FL Studies 2.46 2.96 FL Studies 46% FL Studies 60.85 $19,112 $185 $3,082 $16,030 $19,056 -16%
931 Quality Restaurant 1,000 sf 91.10
Blend ITE 9th &
FL Studies 3.14 3.64 FL Studies 77% FL Studies 74.34 $23,346 $218 $3,632 $19,714 $12,225 61%
932 High-Turnover Restaurant 1,000 sf 116.60
Blend ITE 9th &
FL Studies 3.17 3.67 FL Studies 71% FL Studies 88.57 $27,816 $259 $4,315 $23,501 $17,589 34%
934 Fast Food Rest. w/Drive-Thru 1,000 sf 511.00
Blend ITE 9th &
FL Studies 2.05 2.55 FL Studies 58% FL Studies 205.06 $64,400 $645 $10,747 $53,653 $30,702 75%
941 Quick Lube bay 40.00 ITE 9th Edition 3.62 4.12 Same as LUC 942 72% Same as LUC 942 35.19 $11,050 $101 $1,683 $9,367 $4,854 93%
942 Automobile Care Center 1,000 sf 31.43
Blend ITE 9th &
FL Studies 3.62 4.12 FL Studies 72% FL Studies 27.65 $8,683 $80 $1,333 $7,350 n/a n/a
944/946 Gas Station with and w/o Car Wash fuel pos. 157.33
Blend ITE 9th &
FL Studies 1.90 2.40 FL Studies 23% FL Studies 23.20 $7,287 $74 $1,233 $6,054 $10,227 -41%
947 Car Wash bay 43.94
Blend ITE 9th &
FL Studies 2.18 2.68 FL Studies 68% FL Studies 21.98 $6,904 $68 $1,133 $5,771 $20,143 -71%
INDUSTRIAL:
110 General Light Industrial 1,000 sf 6.97 ITE 9th Edition 5.15 5.65 Same as LUC 710 92% Same as LUC 710 11.15 $3,500 $31 $517 $2,983 $1,522 96%
150 Warehousing 1,000 sf 3.56 ITE 9th Edition 5.15 5.65 Same as LUC 710 92% Same as LUC 710 5.69 $1,788 $16 $267 $1,521 $778 96%
151 Mini-Warehouse 1,000 sf 2.15
Blend ITE 9th &
FL Studies 3.10 3.60 FL Schedules 92% Same as LUC 710 2.07 $650 $6 $100 $550 $546 1%