Pallapa Ruangrong - Feed-In Tariff Experiences in Thailand
17
Feed-in Tariff Experiences in Thailand - - 1 Pallapa Ruangrong ,Ph.D. Thailand Energy Regulatory Commissioner June 20, 2011 [email protected] / [email protected] ASEAN Energy Regulat ors' Network Meeting (22 June) 20 Jun 2011 - 22 Jun 2011.
-
Upload
asia-clean-energy-forum -
Category
Documents
-
view
227 -
download
0
Transcript of Pallapa Ruangrong - Feed-In Tariff Experiences in Thailand

8/6/2019 Pallapa Ruangrong - Feed-In Tariff Experiences in Thailand
http://slidepdf.com/reader/full/pallapa-ruangrong-feed-in-tariff-experiences-in-thailand 1/17
Feed-in Tariff Experiences in Thailand
- -
1
Pallapa Ruangrong ,Ph.D.
Thailand Energy Regulatory Commissioner June 20, 2011
[email protected] / [email protected]
ASEAN Energy Regulators' Network Meeting (22 June)20 Jun 2011 - 22 Jun 2011.
8/6/2019 Pallapa Ruangrong - Feed-In Tariff Experiences in Thailand
http://slidepdf.com/reader/full/pallapa-ruangrong-feed-in-tariff-experiences-in-thailand 2/17
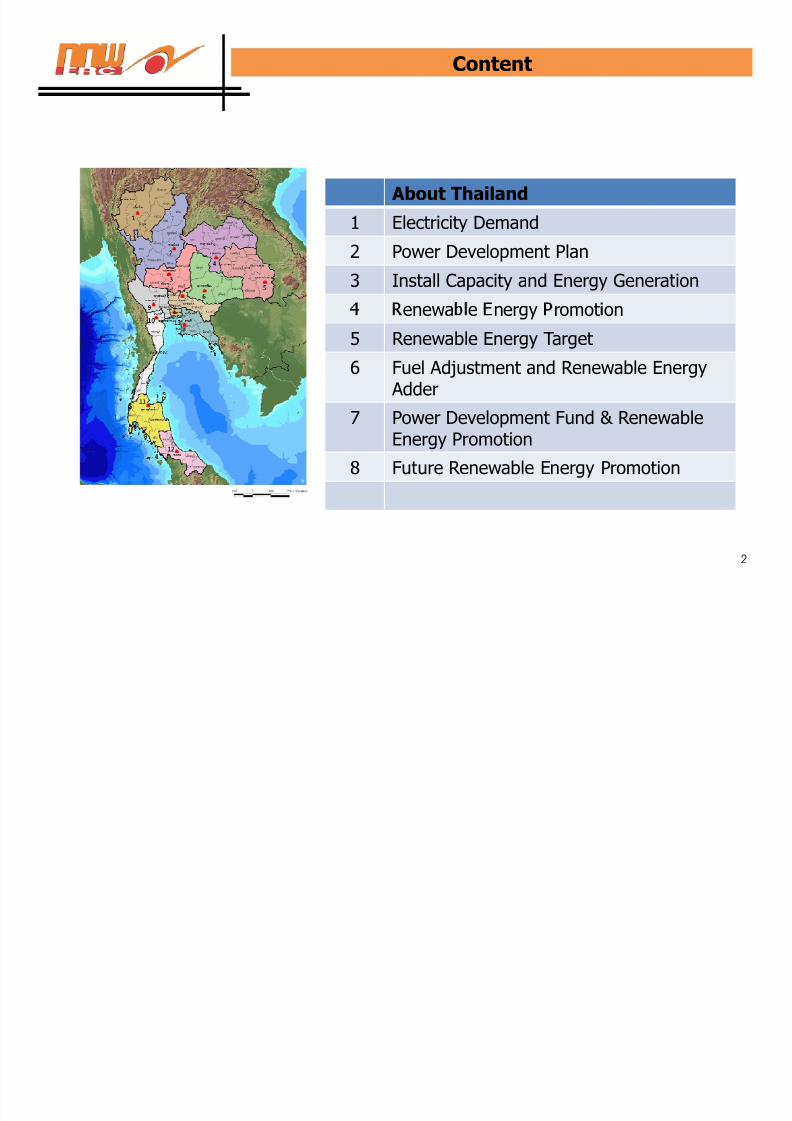
About Thailand
1 Electricity Demand
2 Power Development Plan
3 Install Capacity and Energy Generation
Content
2
enewa e nergy romot on
5 Renewable Energy Target
6 Fuel Adjustment and Renewable Energy Adder
7 Power Development Fund & RenewableEnergy Promotion
8 Future Renewable Energy Promotion

8/6/2019 Pallapa Ruangrong - Feed-In Tariff Experiences in Thailand
http://slidepdf.com/reader/full/pallapa-ruangrong-feed-in-tariff-experiences-in-thailand 3/17
About Thailand
Population
Customers
67 Million
18 Million
3
Transmission
Rural Electrification
,
Commercial /Industrial 1.6 Million 114,069 GwhFree of Charge - 2,033 Gwh
149,319 Gwh
Transmission Network 19,190 Kilometer
99%

8/6/2019 Pallapa Ruangrong - Feed-In Tariff Experiences in Thailand
http://slidepdf.com/reader/full/pallapa-ruangrong-feed-in-tariff-experiences-in-thailand 4/17
Electricity Demand (Net Peak)
22,000
23,000
24,000
25,000MW Year 2007-2010
+0.12% +10.65%
2010
+5.39%
+9.32%
+8.40%+15.28%
+11.48%
+11.51%
2010 : 24,009.90 MW (May10th , 2 pm)
+2.99%
+6.00%
+3.59%
+2.25%
4% = % Growth (MoM)
17,000
18,000
19,000
20,000
21,000
Jan Feb Mar Apr May Jun Jul Aug Sep Oct Nov Dec
-7.96%
+2.86%
2008
2007
-11.90%
-1.18%
-1.13% -0.16%2009
-2.49%
+0.82%
+2.05% +4.22% +16.91%+12.72%
2009 : 22,044.90 MW (April 24, 2 pm)
2008 : 22,018.00 MW (April 21, 2.30 pm)2007 : 22,009.20 MW (April 24, 2.30 pm)

8/6/2019 Pallapa Ruangrong - Feed-In Tariff Experiences in Thailand
http://slidepdf.com/reader/full/pallapa-ruangrong-feed-in-tariff-experiences-in-thailand 5/17
Share of Power Generation by Fuel Type in 2010
Lignite, 11.0%
Imported
Coal, 7.2%
Fuel Oil, 0.3%
Diesel, 0.03%
Large Hydro, 3.3% Imported, 4.4%
Renewable Energy,
1.7%
Natural Gas
Lignite
Imported Coal
Fuel Oil
Most of themare Biomass
117,941
17,988
11,776
558
Gwh
5
Installed Capacity: 30,920 MW
Energy Generation: 163,668 GWh
Natural Gas, 72.1%
Diesel
Large Hydro
Imported
Renewable Energy
42
5,347
7,254
2,763

8/6/2019 Pallapa Ruangrong - Feed-In Tariff Experiences in Thailand
http://slidepdf.com/reader/full/pallapa-ruangrong-feed-in-tariff-experiences-in-thailand 6/17
Imported power(Hydro), 17.2%
Imported Coal,11.9%
RenewableEnergy, 6.2%
Malaysia, 0.4%
Nuclear, 3.2%Imported power (Hydro)
Natural Gas & LNG
Fuel oil
Diesel
Imported power(Hydro), 20.34%
RenewableEnergy, 5.70%
Malaysia, 0.27%
Nuclear, 10.98%
Imported power (Hydro)
Natural Gas & LNG
Fuel oil
Diesel
Total Energy Generation By Fuel Type
Yr 2020
Power Development Plan (PDP 2010) in 2020-2030Share of Power Generation by Fuel Type
Yr 2030
Natural Gas &LNG, 53.8%
Fuel oil, 0.0%
Diesel, 0.01%
Lignite, 7.3% gn e
Imported Coal
Renewable Energy
Malaysia
Nuclear
Natural Gas &LNG, 39.16%
Fuel oil, 0.00%
Diesel, 0.01%
Lignite, 2.45%
,21.09%
Imported Coal
Renewable Energy
Malaysia
Nuclear
Lao PDR 6.5%
6
Installed Capacity: 65,547 MW
Energy Generation: 347,948 GWh
Installed Capacity: 44,842 MW
Energy Generation: 236,956 GWh
6RE: 14,000 Gwh RE: 20,000 Gwh

8/6/2019 Pallapa Ruangrong - Feed-In Tariff Experiences in Thailand
http://slidepdf.com/reader/full/pallapa-ruangrong-feed-in-tariff-experiences-in-thailand 7/17
Renewable Energy Promotion Plan 2008 – 2022 (15 Yrs):(Ministry of Energy)
Target(minimum requirements)
Biomass
Biogas
Types
2008 - 2011 2012 - 2016 2017 - 2022
2,800
60
3,220
90
3,700
120
Hydro(Mini/Micro)
Wind
Solar
Waste
Total
166
115
55
78
282
375
95
130
324
800
500
160
3,273 4,191 5,604
7

8/6/2019 Pallapa Ruangrong - Feed-In Tariff Experiences in Thailand
http://slidepdf.com/reader/full/pallapa-ruangrong-feed-in-tariff-experiences-in-thailand 8/17
he current structure of electricity tariff
he current structure of electricity tariff
Power Plant
PowerDevelopment
Plan
Transmissionline
TransmissionDevelopment
Plan
Distribution& Retail
DistributionDevelopmentPlan
EGATGen
EGATTrans
MEA PEA
* Service fee not
included
Fuel Cost
Base Tariff
(2.2462 Baht/kwh)
(7.46 UScent/kwh)
Fuel Adjustment Charge (Ft)
(0.9581 Baht/kwh)
(3.18 UScent/kwh)
VAT 7%
(0.2243 Baht/kwh)
(0.745 UScent/kwh)
Gas Pipeline
Gas Pipeline
Development Plan
PTT
1
AdderPower
DevelopmentFund
3 4
IPPs SPPs
Power purchasing Cost
VSPP
2
Int
(27%) (72%) (1%)
3 TOTAL*
(3.4286 Baht/kwh)
(11.39 UScent/kwh)
8
1 USD: 30 baht

8/6/2019 Pallapa Ruangrong - Feed-In Tariff Experiences in Thailand
http://slidepdf.com/reader/full/pallapa-ruangrong-feed-in-tariff-experiences-in-thailand 9/17

8/6/2019 Pallapa Ruangrong - Feed-In Tariff Experiences in Thailand
http://slidepdf.com/reader/full/pallapa-ruangrong-feed-in-tariff-experiences-in-thailand 10/17
NEPC’s resolution on June 28, 2010
• Suspend applications for solar generation
• Approved 6.5 Baht/kWh for the solar projects that have
not been accepted by the power Utilities by June 28,
2010
The current statusThe current status
• Resolved to develop Feed in-Tariff instead of the Adderas the incentive program
• Appointed a committee to collaborate, to monitor the
adder program and to review the FiT incentive programfor every types of RE
10
FiT under study byMinistry of Energy
8/6/2019 Pallapa Ruangrong - Feed-In Tariff Experiences in Thailand
http://slidepdf.com/reader/full/pallapa-ruangrong-feed-in-tariff-experiences-in-thailand 11/17
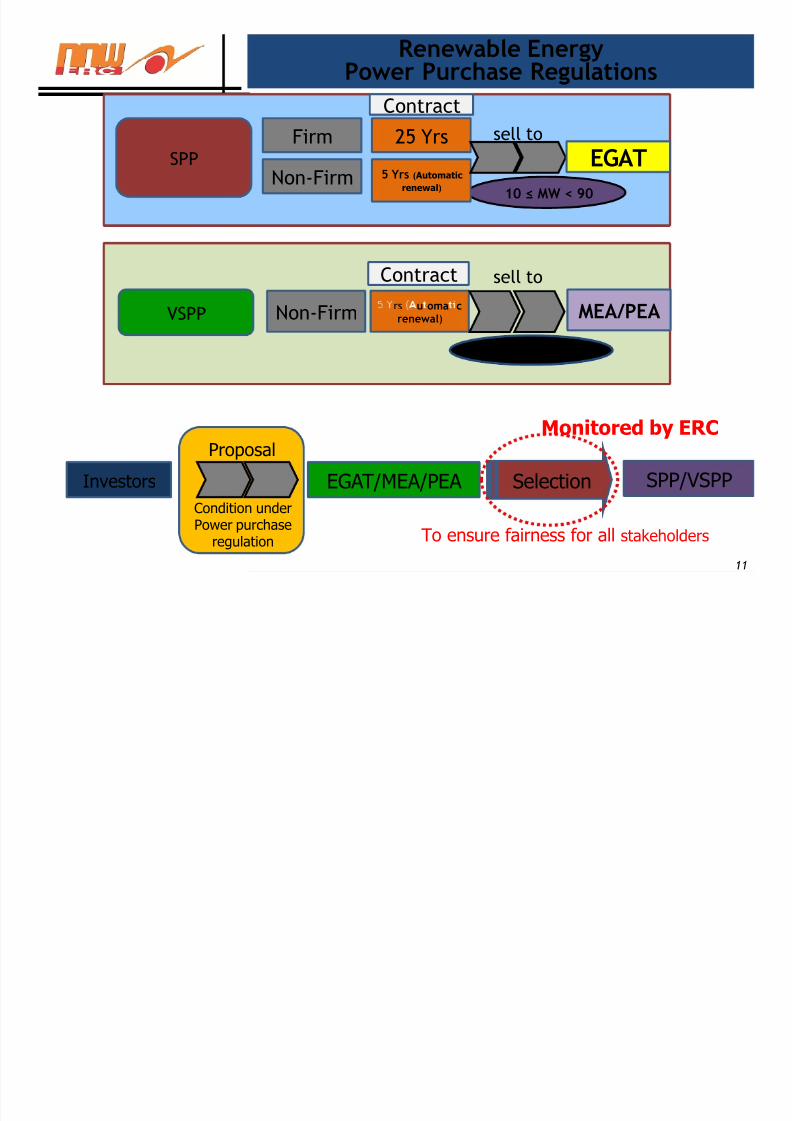
Renewable EnergyPower Purchase Regulations
SPP
Firm
10 ≤ MW < 90Non-Firm
25 Yrs
5 Yrs ( Automatic
renewal)
EGAT
Contractsell to
Contract sell to
11
VSPPMW < 10
rs u oma c
renewal)Non-Firm MEA/PEA
Investors
Proposal
EGAT/MEA/PEA Selection SPP/VSPP
Monitored by ERC
To ensure fairness for all stakeholders
Condition underPower purchase
regulation

8/6/2019 Pallapa Ruangrong - Feed-In Tariff Experiences in Thailand
http://slidepdf.com/reader/full/pallapa-ruangrong-feed-in-tariff-experiences-in-thailand 12/17
Target of RE generation & Effect on Tariff (i)Target of RE generation & Effect on Tariff (i)
Type Adder
(Baht/kWh)
Capacitysupplied
to the
Grid(MW)
Year 2008-2011 Year 2012-2016 Year 2017-2022
Target
(MW)
Effect on
Tariff (Baht/kWh)
Target
(MW)
Effect on
Tariff (Baht/kWh)
Target
(MW)
Effect on
Tariff (Baht/kWh)
Biomass 563.64 2,800 0.0482 3,220 0.0411 3,700 0.0359
<= 1 MW 0.50 1,400 0.0301 1,610 0.0257 1,850 0.0224
>1 MW 0.30 1,400 0.0181 1,610 0.0154 1,850 0.0135
Biogas 0.30 19.48 60 0.0008 90 0.0009 120 0.0009Waste 3.45 78 0.0101 130 0.0125 160 0.0117
Landfill 2.50 39 0.0042 65 0.0052 80 0.0049
ThermalProcess
3.50 39 0.0059 65 0.0073 80 0.0068
12
Hydro 0.06 166 0.0041 282 0.0052 324 0.0045
50-200 kW 0.80 83 0.0014 141 0.0018 162 0.0016
< 50 kW 1.50 83 0.0027 141 0.0034 162 0.0029
Wind 0.08 115 0.0034 375 0.0112 800 0.0239
<= 50 kW 4.50 23 0.0008 75 0.0020 160 0.0033
> 50 kW 3.50 92 0.0026 300 0.0063 640 0.0102
Solar 6.5 1.78 55 0.0032 95 0.0042 500 0.0166
Total - 3,273 0.0696 4,191 0.0721 5,604 0.08300.08305,604
> 7,400 MWTotal proposal

8/6/2019 Pallapa Ruangrong - Feed-In Tariff Experiences in Thailand
http://slidepdf.com/reader/full/pallapa-ruangrong-feed-in-tariff-experiences-in-thailand 13/17

8/6/2019 Pallapa Ruangrong - Feed-In Tariff Experiences in Thailand
http://slidepdf.com/reader/full/pallapa-ruangrong-feed-in-tariff-experiences-in-thailand 14/17
SPP & VSPP: BIOMASS
Type of Biomass Number of projects
Installedcapacity (MW)
Contractedselling capacity
(MW)
Rice husk 12 71.3250 59.4000
COD
14
Bagasse 30 533.3000 168.8000
Palm waste 1 12.0000 8.5000
Corncob 1 0.1600 0.1350
Etc. 12 123.8560 70.0360
Total 56 740.6410 306.8710
As of Mar 2011

8/6/2019 Pallapa Ruangrong - Feed-In Tariff Experiences in Thailand
http://slidepdf.com/reader/full/pallapa-ruangrong-feed-in-tariff-experiences-in-thailand 15/17

8/6/2019 Pallapa Ruangrong - Feed-In Tariff Experiences in Thailand
http://slidepdf.com/reader/full/pallapa-ruangrong-feed-in-tariff-experiences-in-thailand 16/17
Purchasing Price from SPP/VSPP
SPP
Cogeneration Renewable energy
VSPP
Firm Contract Firm Contract
Conventional Non Firm Contract
Cogen Renewableenergy
16
Non FirmContract
CP + EP + FS
EP
Non Firm Contract(Non-conventional/
Cogeneration)
CP + EP + FS + REP+ Adder
Ws + Ft + Adder
CP=Capacity Payment
EP=Energy Payment
FS=Fuel Saving; Max. 0.36 Baht/kWh up to %Primary Energy Saving (PES)REP=Renewable Energy Promotion; 0.39 Baht/kWh
; EP = WS (whole sale price) +Ft (Fuel Adjustment charge)
EPWs + Ft+Adder
FS=0.36 X %PES/10

8/6/2019 Pallapa Ruangrong - Feed-In Tariff Experiences in Thailand
http://slidepdf.com/reader/full/pallapa-ruangrong-feed-in-tariff-experiences-in-thailand 17/17
17
Energy Regulatory Commission
19th
Fl. Chamchuri Sq. Bldg.319 Phayathai Rd., Pathumwan
Bangkok, Thailand 10330
www.erc.or.th