Paleomagnetism of igneous rocks from the Shatsky Rise...
27
147 The Geological Society of America Special Paper 511 2015 Paleomagnetism of igneous rocks from the Shatsky Rise: Implications for paleolatitude and oceanic plateau volcanism William W. Sager* Department of Oceanography, Texas A&M University, College Station, Texas 77843, USA Margaret Pueringer † Department of Geology & Geophysics, Texas A&M University, College Station, Texas 77843, USA Claire Carvallo † Institut de Minéralogie, de Physique des Matériaux et de Cosmochimie (IMPMC), Sorbonne Universités–Université Pierre-et-Marie-Curie (UPMC, Université Paris 06), Unités Mixtes de Recherche Centre National de la Recherche Scientifique (UMR CNRS) 7590, Muséum National d’Histoire Naturelle, Institut de Recherche (IRD) UMR 206, 4 Place Jussieu, F-75005 Paris, France Masahiro Ooga † Department of Environmental System Science, Doshisha University, 1-3 Tatara Miyakodani, Kyo-Tanabe City, Kyoto 610-0321, Japan Bernard Housen † Geology Department, Western Washington University, Bellingham, Washington 98225, USA Masako Tominaga † Department of Geological Sciences, Michigan State University, East Lansing, Michigan 48824, USA ABSTRACT The eruptive history of the Shatsky Rise, a large oceanic plateau in the north- western Pacific Ocean, is poorly understood. Although it has been concluded that the Shatsky Rise volcanic edifices erupted rapidly, there are few solid chronological data to support this conclusion. Similarly, the Shatsky Rise is thought to have formed near the equator, but paleolatitude data from the plateau are few, making it difficult to assess its plate tectonic drift with time. To understand the formation history of this oceanic plateau, paleomagnetic measurements were conducted on a total of 362 basaltic lava samples cored from the Shatsky Rise at 4 sites (U1346, U1347, U1349, and U1350) during Integrated Ocean Drilling Program Expedition 324. Examining *Now at Department of Earth and Atmospheric Sciences, University of Houston, Houston, Texas 77204, USA; [email protected]. † [email protected]; [email protected]; [email protected] (Ooga); [email protected]; [email protected] Sager, W.W., Pueringer, M., Carvallo, C., Ooga, M., Housen, B., and Tominaga, M., 2015, Paleomagnetism of igneous rocks from the Shatsky Rise: Implications for paleolatitude and oceanic plateau volcanism, in Neal, C.R., Sager, W.W., Sano, T., and Erba, E., eds., The Origin, Evolution, and Environmental Impact of Oceanic Large Igneous Provinces: Geological Society of America Special Paper 511, p. 147–171, doi:10.1130/2015.2511(08). For permission to copy, contact [email protected]. © 2015 The Geological Society of America. All rights reserved. on April 20, 2015 specialpapers.gsapubs.org Downloaded from
Transcript of Paleomagnetism of igneous rocks from the Shatsky Rise...

147
The Geological Society of AmericaSpecial Paper 511
2015
Paleomagnetism of igneous rocks from the Shatsky Rise: Implications for paleolatitude and oceanic plateau volcanism
William W. Sager*Department of Oceanography, Texas A&M University, College Station, Texas 77843, USA
Margaret Pueringer†
Department of Geology & Geophysics, Texas A&M University, College Station, Texas 77843, USA
Claire Carvallo†
Institut de Minéralogie, de Physique des Matériaux et de Cosmochimie (IMPMC), Sorbonne Universités–Université Pierre-et-Marie-Curie (UPMC, Université Paris 06),
Unités Mixtes de Recherche Centre National de la Recherche Scientifi que (UMR CNRS) 7590, Muséum National d’Histoire Naturelle, Institut de Recherche (IRD) UMR 206, 4 Place Jussieu, F-75005 Paris, France
Masahiro Ooga†
Department of Environmental System Science, Doshisha University, 1-3 Tatara Miyakodani, Kyo-Tanabe City, Kyoto 610-0321, Japan
Bernard Housen†
Geology Department, Western Washington University, Bellingham, Washington 98225, USA
Masako Tominaga†
Department of Geological Sciences, Michigan State University, East Lansing, Michigan 48824, USA
ABSTRACT
The eruptive history of the Shatsky Rise, a large oceanic plateau in the north-western Pacifi c Ocean, is poorly understood. Although it has been concluded that the Shatsky Rise volcanic edifi ces erupted rapidly, there are few solid chronological data to support this conclusion. Similarly, the Shatsky Rise is thought to have formed near the equator, but paleolatitude data from the plateau are few, making it diffi cult to assess its plate tectonic drift with time. To understand the formation history of this oceanic plateau, paleomagnetic measurements were conducted on a total of 362 basaltic lava samples cored from the Shatsky Rise at 4 sites (U1346, U1347, U1349, and U1350) during Integrated Ocean Drilling Program Expedition 324. Examining
*Now at Department of Earth and Atmospheric Sciences, University of Houston, Houston, Texas 77204, USA; [email protected].†[email protected]; [email protected]; [email protected] (Ooga); [email protected]; [email protected]
Sager, W.W., Pueringer, M., Carvallo, C., Ooga, M., Housen, B., and Tominaga, M., 2015, Paleomagnetism of igneous rocks from the Shatsky Rise: Implications for paleolatitude and oceanic plateau volcanism, in Neal, C.R., Sager, W.W., Sano, T., and Erba, E., eds., The Origin, Evolution, and Environmental Impact of Oceanic Large Igneous Provinces: Geological Society of America Special Paper 511, p. 147–171, doi:10.1130/2015.2511(08). For permission to copy, contact [email protected]. © 2015 The Geological Society of America. All rights reserved.
on April 20, 2015specialpapers.gsapubs.orgDownloaded from

148 Sager et al.
INTRODUCTION
Oceanic plateaus are massive volcanic edifi ces that represent extraordinary fl ux of magma from mantle sources (Duncan and Richards, 1991; Coffi n and Eldholm, 1994). These large igneous provinces give insight into mantle dynamics and secular changes. The formation and evolution of oceanic plateaus are not well known because many are in remote areas beneath the sea, and their geologic evolution has been diffi cult to determine. Many oceanic plateaus were formed during the Cretaceous Normal Superchron, making it diffi cult to relate their formation to the tectonics of nearby active spreading ridges (Heller et al., 1996). The Shatsky Rise is unique among the largest plateaus because it formed during a time of magnetic reversals, thus potentially allowing the evolution of seafl oor spreading to be inferred from magnetic lineations.
The Shatsky Rise, located in the northwest Pacifi c Ocean, is one of the largest oceanic plateaus, with an area of 4.8 × 10⁵ km2 and a total volume of ~4.3 × 10⁶ km3 (Sager et al., 1999). Mag-netic lineations around the Shatsky Rise (Fig. 1) indicate that it formed during the Late Jurassic to Early Cretaceous near a triple junction (Sager et al., 1988, 1999; Nakanishi et al., 1999). It is composed of three large mountains, the Tamu, Ori, and Shirshov massifs, and a low ridge, Papanin ridge, extending to the north. Shatsky Rise edifi ces decrease in both volume and age from southwest to northeast along the plateau (Sager et al., 1999). Plateau formation began with the eruption of the Tamu massif, the southernmost of the three, and the largest and oldest volcano (Sager et al., 2013). From an analysis of the positive magnetic anomaly over the Tamu massif, it was argued (Sager and Han, 1993) that this large mountain formed rapidly during a single reversed polarity epoch. The other massifs and ridge formed sub-sequently along the path of the triple junction (Sager et al., 1999; Nakanishi et al., 1999; Sager, 2005).
The Shatsky Rise has characteristics that fi t two compet-ing hypotheses for oceanic plateau formation. One, the plume head hypothesis, posits that oceanic plateaus form from mas-
changes in paleomagnetic inclinations, we gain a better understanding of eruptive rates by comparison of observed shifts in inclination with expected paleosecular variation. At three sites (U1346, U1347, and U1349) little change in paleomagnetic directions was observed, implying that the cored sections were mostly erupted rapidly over peri-ods of <~100–200 yr. Only Site U1350 displayed directional changes consistent with signifi cant paleosecular variation, implying emplacement over a period of ~1000 yr. The paleomagnetic data are consistent with the idea that the Shatsky Rise igneous sections were mostly emplaced rapidly, but there were some time gaps and some fl ank locations built up more slowly. Because paleosecular variation was inadequately sam-pled at all the Shatsky Rise sites, paleolatitudes have large uncertainties, and because of the equatorial location, magnetic polarity is also uncertain. All sites yield low paleo-latitudes and indicate that the Shatsky Rise stayed near the equator during its forma-tion. Given that the locus of magmatism moved northward relative to the Pacifi c plate while staying near the equator, the Pacifi c plate must have drifted southward relative to the spin axis during the emplacement of the plateau.
U1346
U1350U1349
U1348
U1347M20
M19
M17
M14
M16
M17
M18
M16
M16M
16
M17
M15
M18
M18
M17
M16
M15
M15
M21M21
M10
M12M11
M13
M11
M11
M13
M11M11
M15
M14
Tamu Massif
Ori Massif
Shirshov Massif
N
E
100 km40°
35°
30°155° 160° 165°
12131213
5
5
5
43
4
4
4
sive eruptions above the head of a nascent mantle plume, a ther-mal diapir that has risen from deep in the mantle to the base of the lithosphere (Coffi n and Eldholm, 1994). This model pre-dicts a massive initial eruption, as may have occurred with the Tamu massif, and a waning of volcanism with time, as implied by the smaller edifi ce sizes in the northeast part of the plateau (Sager, 2005). An alternative hypothesis is that plateau vol-canism can occur in regions of plate extension, such as mid-ocean ridges, caused by decompression melting of fertile upper
Figure 1. Map showing the location of Integrated Ocean Drilling Pro-gram Expedition 324 sites (U1346-U1350) and Ocean Drilling Pro-gram Site 1213. Bathymetry contours on the Shatsky Rise (shaded gray) are shown at 500 m intervals. Gray lines show magnetic linea-tions and fracture zones from Nakanishi et al. (1999). Filled circles show the sites analyzed in this study.
on April 20, 2015specialpapers.gsapubs.orgDownloaded from

Paleomagnetism of igneous rocks from the Shatsky Rise 149
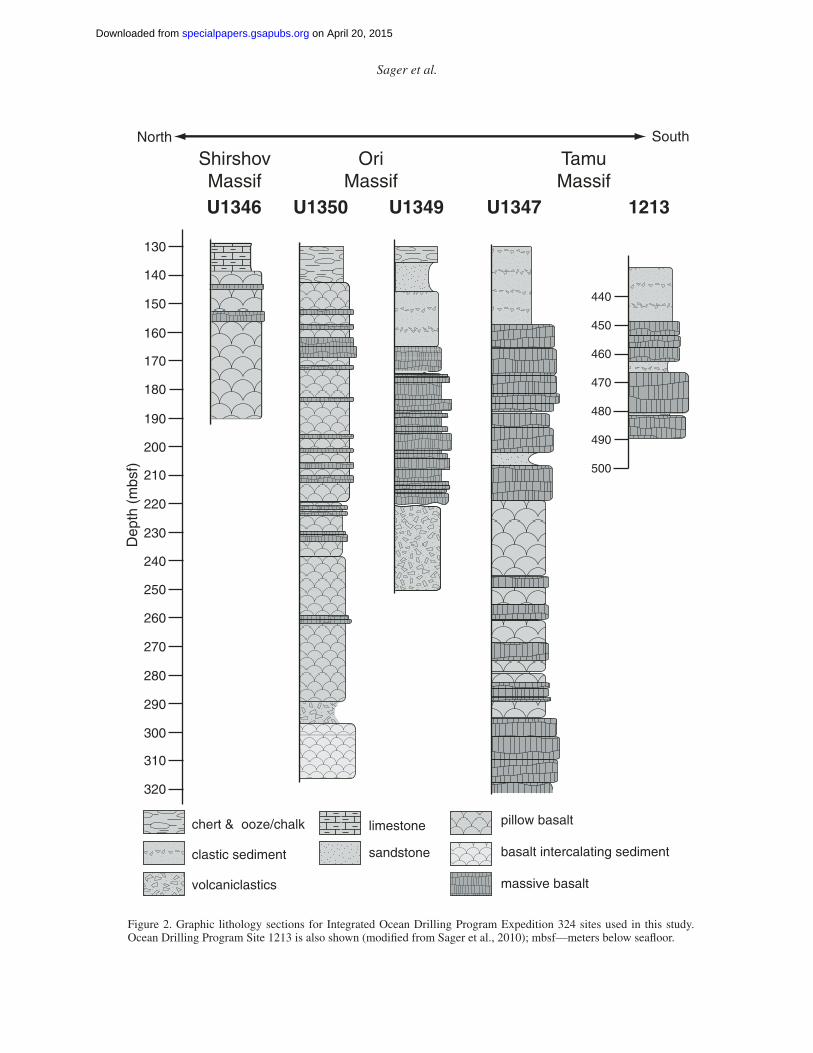
mantle (Foulger, 2007). This explanation also could apply to the Shatsky Rise, since it formed along the track of a triple junc-tion (Sager, 2005). To gain a better understanding of the volca-nism and formation mechanism of the Shatsky Rise, Integrated Ocean Drilling Program (IODP) Expedition 324 cored at fi ve sites on the plateau to obtain volcanic material. Site U1346 was cored on the Shirshov massif, Sites U1347 and U1348 on the Tamu massif, and Sites U1349 and U1350 on the Ori massif (Figs. 1 and 2; Sager et al., 2010). Prior coring reached volca-nic basement at only one location, Site 1213 on the south fl ank of the Tamu massif, where a 47 m igneous section was cored (Shipboard Scientifi c Party, 2002).
Basaltic fl ows were recovered at all sites except Site U1348, where only volcaniclastics were recovered (Sager et al., 2010, 2011a, 2011b). The igneous rocks are vesicular aphyric and phyric basalts with mid-oceanic ridge basalt–like chemistry and isotopic signatures (Sager et al., 2010). These rocks are classi-fi ed as pillow basalts and massive fl ow basalts, the latter as much as ~23 m thick. At Site 1213, three massive fl ows were cored (Fig. 2) (Koppers et al., 2010). An average age of 144.6 ± 0.6 Ma was calculated using 40Ar/39Ar radiometric dates from the lower two fl ows (Mahoney et al., 2005). Preliminary 40Ar/39Ar dates from Expedition 324 research indicate a similar age for the lower Site U1347 section (143–145 Ma below ~240 mbsf [meters below seafl oor]), but there may be a gap of several million years between the lower and upper (<220 mbsf) massive fl ows (Heaton and Koppers, 2014; Geldmacher et al., 2014). Preliminary dating also indicates an age that is ~10 m.y. younger for Site U1350 (ca. 133 Ma) (Heaton and Koppers, 2014) on the Ori massif, consistent with the expected age progression from surrounding magnetic lineations.
Pillow lavas and massive fl ows both occur at most sites, but appear to show a transition from southwest to northeast on the Shatsky Rise. Thick massive fl ows are found only at sites on the Tamu massif, where they make up a large proportion of the core. At Site 1213, the entire cored section consists of 3 massive fl ows, and at Site U1347, the massive fl ows make up ~67% of the cored section (Sager et al., 2010). At Site U1347 the massive fl ows are concentrated in 2 sections where they make up ~100% of the rock (Fig. 2) (Sager et al., 2011b). Massive fl ows were found at some of the other sites, but they are fewer and thinner (Sager et al., 2010).
Paleomagnetic studies indicate that the Shatsky Rise formed near the equator (e.g., Tominaga et al., 2005; Sager et al., 2005; Sager, 2006), but Pacifi c paleomagnetic data are sparse and the Pacifi c apparent polar wander path is poorly defi ned, especially for the Late Jurassic and Early Cretaceous (Sager, 2006). Here we examine the paleomagnetism of samples from lava fl ows cored from the Shatsky Rise to gain an appreciation of the timing of the eruptions and the paleolatitude for the Shatsky Rise at the time it formed. The basic premise of the eruption timing study is that changes in magnetization incli nation of cored samples ver-sus depth provide a record of the changes in the magnetic fi eld caused by paleosecular variation (PSV). PSV occurs at relatively
well-known rates for the past ~5 m.y. (Johnson et al., 2008; Kent et al., 2010), with changes of ~20°–30° in magnetic inclination over periods of hundreds to thousands of years. Thus, changes in magnetization direction can be interpreted to refl ect the tim-ing of lava fl ows. The timing of individual lava fl ows is poorly known because the most precise radiometric dates in basalts of Mesozoic age have an uncertainty of ~0.5 m.y., so it is diffi -cult to distinguish the age variation of successive ancient fl ows drilled at a single site. Because of the relatively rapid changes in magnetic inclination caused by PSV, paleomagnetic measure-ments can be used to infer the relative timing of the individual lava fl ows. The Shatsky Rise is an anomalously large volcanic construct with massive lava fl ows, thus our working hypothesis is that the cored igneous sections were emplaced rapidly. If that is true, measured paleoinclinations should show limited varia-tion caused by PSV. Our motivation for examining the paleo-latitude is that the Late Jurassic to Early Cretaceous location of the Pacifi c plate at the time the Shatsky Rise formed is poorly known (Sager, 2006) and thus new data are important for under-standing Pacifi c tectonic history.
Prior Paleomagnetic Studies of the Shatsky Rise
A number of paleomagnetic studies have been conducted on samples of Cenozoic and Late Cretaceous sediments from the Shatsky Rise sediment cap (e.g., Bleil, 1985; Sager et al., 1993; Evans et al., 2005). Because these studies are not helpful for understanding the formation of the igneous pedestal of the Shatsky Rise, we do not discuss them here. Two studies from Site 1213 are informative for our study; in one, 52 samples from the 3 massive fl ows were measured using alternating fi eld (AF) demagnetization and thermal (TH) demagnetization to isolate the primary magnetization (Tominaga et al., 2005). The study showed that many samples from the Site 1213 massive fl ows pro-duced a data set of paleoinclinations with relatively high scatter. Tominaga et al. (2005) surmised that the coarse-grained massive fl ows contain multidomain (MD) magnetic grains that are sus-ceptible to acquiring spurious secondary magnetizations, such as a drill-string overprint (Audunsson and Levi, 1989). No statisti-cal difference was detected between the mean inclinations of the three igneous units, suggesting that the emplacement occurred within a short time period. The mean inclination for the site is −9.3° +27.5°/–41.8° (Here and elsewhere, we report 95% con-fi dence limits, which are asymmetric for azimuthally unoriented samples; see Cox and Gordon, 1984) and this was interpreted as recording eruption 4.7° north of the equator during a reversed polarity period, possibly chron M19 on the geomagnetic polar-ity time scale (Tominaga et al., 2005). Paleomagnetic data were also measured from Early Cretaceous sedimentary rocks depos-ited directly on the igneous basement at Site 1213 (Sager et al., 2005). Data from 22 samples gave a mean inclination of 9.1° +13.6°/–14.2°, which was also interpreted as a reversed magne-tization, but acquired in the Southern Hemisphere. In addition, paleomagnetic samples were measured from an ~100 m section
on April 20, 2015specialpapers.gsapubs.orgDownloaded from
150 Sager et al.
130
140
150
160
170
180
190
200
210
220
230
240
250
260
270
280
290
300
310
320
North
500
490
480
470
460
450
440
SouthD
epth
(m
bsf)
sandstone
massive basalt
chert & ooze/chalk
clastic sediment
volcaniclastics
limestone pillow basalt
basalt intercalating sediment
U1346 U1350 U1349 U1347 1213
ShirshovMassif
OriMassif
TamuMassif
Figure 2. Graphic lithology sections for Integrated Ocean Drilling Program Expedition 324 sites used in this study. Ocean Drilling Program Site 1213 is also shown (modifi ed from Sager et al., 2010); mbsf—meters below seafl oor.
on April 20, 2015specialpapers.gsapubs.orgDownloaded from

Paleomagnetism of igneous rocks from the Shatsky Rise 151
of basalt fl ows cored from abyssal seafl oor at Site 1179, located slightly north of the Shatsky Rise (Sager and Horner-Johnson, 2004). The 122 measured samples describe 13 independent mag-netic units that indicate a paleolatitude of 1.9°N ± 6.8°. Among the important fi ndings of these studies is the fact that the Shatsky Rise formed near the equator.
A downhole geomagnetic study was reported from wire-line logging data collected during Expedition 324 within the Site U1347 borehole (Tominaga et al., 2012). A change in the sign of the vertical component of the magnetic fi eld in the lower part of the section was interpreted as a shift of paleoinclina-tion in surrounding lava fl ows from negative to positive in the upcore direction. This change was interpreted as the result of the Tamu massif moving from the Southern Hemisphere (nega-tive inclination) to the Northern Hemisphere (positive inclina-tion) (Tominaga et al., 2012).
Several allied paleomagnetic studies have been conducted using Expedition 324 samples. Three reports give magnetic prop-erties data from Expedition 324 sites (Carvallo and Camps, 2013; Pueringer et al., 2013; Carvallo, 2014); another describes mag-netic properties as background for a study of paleofi eld intensity (Carvallo et al., 2013). These studies provide important back-ground data to help us understand the magnetic recording process of Expedition 324 samples. A brief outline of the methods used is given in the next section and cogent results are presented in the section that follows.
METHODS
Because of the international team of paleomagnetic sci-entists working on Expedition 324, samples were measured in several different laboratories. Although measurements were made from all Expedition 324 sites, this division led to slight differences in equipment, handling, and types of measurements. Although the data are therefore not as homogeneous as would be expected from a single laboratory, suffi cient data exist to under-stand the magnetic properties of the Shatsky Rise basalt samples.
Expedition 324 Shipboard Measurements
During Expedition 324, samples from every site were mea-sured for paleomagnetic vector data, using both AF and TH demagnetization (Sager et al., 2010). To monitor changes in mag-netic mineralogy, bulk susceptibility measurements were made between steps using a Kappa Bridge KLY 4S (Geofyzika Brno). AF demagnetization was performed with a D-Tech demagnetizer in 2–5 mT steps up to 30 mT and 10–20 mT steps from 30 to 120 mT. TH demagnetization was performed with a Schoenstedt thermal demagnetizer (model TSD-1) in steps of 25–50 °C up to 500–600 °C. After each step for both AF and TH demagnetized samples, the natural remanent magnetization (NRM) was mea-sured with a Molspin Minispin magnetometer or on a 2G cryo-genic magnetometer (Sager et al., 2010). The results from Sites U1346, U1347, and U1350 were reported in the IODP proceed-
ings (Sager et al., 2010) and are combined here with our shore-based results (Tables 1–4).
Onshore Measurements
Site U1349Samples from Site U1349 were measured at Doshisha Uni-
versity in Japan. Cubic 8 cm3 samples were cut into multiple specimens and demagnetized using both AF and TH demagne-tization, so data from the two different methods are available for most samples. The AF samples were demagnetized with a 2G Enterprise 755R magnetometer in steps of 5 mT from 5 to 50 mT and steps of 20 mT up to 100 mT. Thermally demagnetized sam-ples were demagnetized with a TDS-1 (Natsuhara Giken) oven in steps of 25–30 °C up to 700 °C. The resulting inclinations from each sample set were usually similar, so in our analysis, each of these 62 paleocolatitudes is the average of the primary mag-netizations determined from both AF and TH demagnetization of subsamples (Table 3). Of the remaining three samples treated using only a single demagnetization type, two were demagne-tized using AF and the other was TH demagnetized.
Sites U1346, U1347, and U1350Measurements of samples from Sites U1346, U1347, and
U1350 were made in a Lodestar Magnetics shielded room at the Pacifi c Northwest Paleomagnetism Laboratory at Western Washington University (WWU; Pueringer et al., 2013). The sam-ples were measured for magnetic susceptibility on an AGICO KLY3-S magnetic susceptibility bridge and then the NRM was measured on an AGICO JR6 dual speed spinner magnetometer. Half of the samples were demagnetized using TH demagnetiza-tion and the other half using AF demagnetization. This division was maintained because it was unclear after the shipboard study which method produced better results. For samples being TH demagnetized, pilot batches were heated and cooled in an argon atmosphere (so that oxidation of the samples would be mini-mized) and a regular atmosphere, using an ASC model TD48 or an ASC model TD48-SC thermal demagnetizing oven. No sig-nifi cant difference in the results from these two techniques were detected, so the rest of the samples were TH demagnetized in air at steps of 40 °C from 80° to 500 °C and steps of 20–25 °C above 500 °C. The AF demagnetized samples were demagnetized with a D-Tech D2000 AF demagnetizer at steps of 5 mT from 5 mT to 60–120 mT. Hysteresis loops from 4 samples from each site were conducted with a vibrating sample magnetometer (Princ-eton Measurements Corporation MicroMag model 3900).
Because there was concern that high scatter in shipboard measurements of Site U1347 massive fl ows resulted from MD magnetic grain behavior, all samples from the massive fl ows measured at WWU were subjected to a low-temperature (77 K) treatment. In a magnetically shielded room the samples were immersed in liquid nitrogen for 20 min then warmed to air tem-perature and measured. This low-temperature procedure was per-formed before the samples were demagnetized, and the process
on April 20, 2015specialpapers.gsapubs.orgDownloaded from

152 Sager et al.
of immersion, warming, and measuring was repeated until there was little change in magnetic intensity after exposure to the liquid nitrogen. The rationale of this treatment is that low- temperature treatment helps remove the magnetic remanence of MD mag-netic minerals (Dunlop and Özdemir, 2007).
Magnetic Properties MeasurementsMeasurements were made on samples from Sites U1346,
U1347, and U1350 using the facilities at the Université Pierre et Marie Curie and Université de Montpellier II to understand the magnetic properties of Expedition 324 igneous samples (Car-vallo and Camps, 2013; Carvallo et al., 2013; Carvallo, 2014). The objective of most measurements was to fi nd the best samples for paleofi eld intensity determinations (Carvallo et al., 2013). The measurements included magnetic hysteresis, fi rst-order reversal curve (FORC) diagrams, low-temperature magnetiza-tion, susceptibility versus temperature curves, and scanning elec-tron microscope (SEM) photographs. Hysteresis and FORC mea-surements were made with an alternating gradient magnetometer
(as reported in Carvallo and Camps, 2013; Carvallo et al., 2013), and with a vibrating sample magnetometer (Carvallo, 2014). Low-temperature measurements were made with a Quantum Design Magnetic Properties measurement system. Susceptibility versus temperature measurements were made by cooling or heat-ing samples in a CS-L cryostat and CS-3 furnace in argon atmo-sphere and measuring with a KLY-3 Kappabridge instrument. SEM photographs were made with a SEM/FRG Zeiss Ultra 55, observing rock powders mounted on carbon stubs.
Principle Component AnalysisAll characteristic magnetization directions were calculated
from demagnetization data using principle component analysis (PCA) (Kirschvink, 1980). For each sample, a series of high-temperature or high AF fi eld measurements that displayed uni-vectorial decay toward the origin of an orthogonal vector plot (Zijderveld plot) was assumed to represent the primary magneti-zation and used for the PCA determination. Because some sam-ples displayed short sections of partial self-reversal at medium
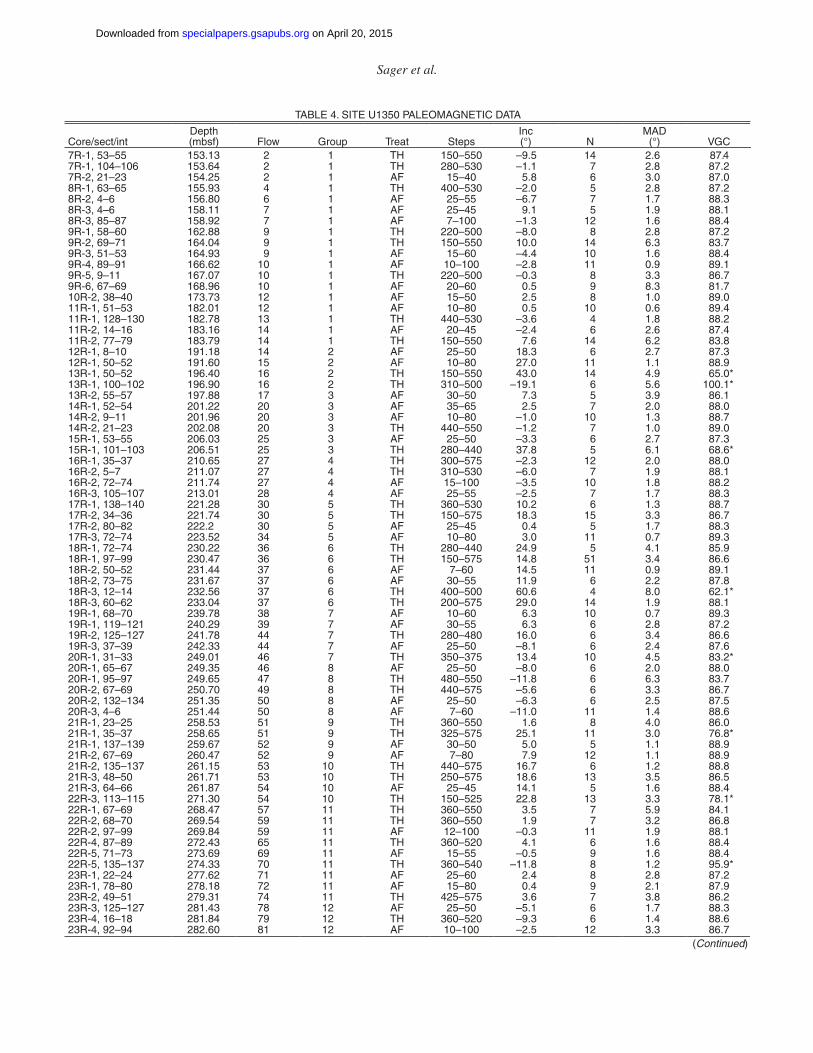
TABLE 1. SITE U1346 PALEOMAGNETIC DATA
Core/sect/int Depth (mbsf) Flow
Group
Treat
Steps
Inc (°) N
MAD (°) VGC
6R-1, 83–85 139.73 19 1 AF 25–60 −24.0 8 2.8 102.6 6R-1, 111–113 140.01 20 1 TH 300–475 −26.4 6 1.7 103.9 7R-1, 53.5–55.5 142.24 22 1 TH 300–475 −20.5 6 2.4 100.6 7R-1, 92–94 142.62 23 1 TH 300–425 −9.8 4 2.3 94.9 7R-2, 39–41 143.50 23 1 AF 10–60 −19.0 8 0.8 99.8 7R-3, 49–51 145.10 24 1 TH 310–450 −18.9 4 2.4 99.7 7R-4, 12–14 145.59 26 1 TH 300–425 −25.7 4 1.5 103.5 7R-4, 53–55 146.00 26 1 AF 20–50 27.6 7 1.2 75.4* 8R-1, 136–138 149.96 31 1 TH 280–450 −24.0 5 2.5 102.6 8R-2, 11–13 150.13 31 1 TH 200–525 −18.9 9 3.0 99.7 9R-1, 104.5–106.5 155.88 32 1 TH 220–450 −21.9 6 6.1 101.4 9R-2, 95–97 155.78 32 1 TH 300–450 −13.4 5 3.3 96.8 10R-1, 21.5–23.5 158.42 34 1 AF 10–100 −20.8 11 3.6 100.8 10R-1, 40–42 158.60 34 1 AF 10–50 −26.9 9 1.0 104.0 10R-2, 75–77 158.74 35 1 TH 310–440 −26.5 4 6.4 103.8 11R-1, 35–37 163.35 36 1 TH 300–450 −17.7 6 6.2 99.1 11R-1, 97–99 163.97 37 1 AF 15–55 −16.1 9 1.8 98.2 13R-1, 5–7 172.55 37 1 AF 25–50 −5.9 6 1.7 93.0* 13R-1, 76–78 173.26 38 1 TH 300–500 −21.5 8 3.0 101.1 13R-2, 38–40 174.15 39 1 AF 10–100 −15.7 11 1.6 98.0 13R-2, 59–61 174.36 40 1 AF 20–55 −29.1 10 1.3 105.6* 14R-1, 14–16 177.54 40 2 TH 300–500 −22.3 7 1.6 101.6 14R-1, 136–138 178.76 45 2 TH 400–540 −26.2 7 4.3 104.0 14R-2, 32–34 179.16 46 2 TH 100–525 −24.1 11 1.7 102.6 14R-2, 121–123 180.05 47 2 TH 100–475 −24.3 9 2.2 102.7 15R-1, 6–8 182.26 50 2 AF 10–80 −17.2 10 0.7 98.8 16R-1, 78–80 187.78 52 2 AF 25–55 −23.1 7 1.7 102.0 16R-2, 35–37 188.31 54 2 TH 310–450 −20.5 4 0.9 100.6 16R-2, 89–91 188.85 56 2 TH 300–525 −31.8 9 3.4 107.2 Note: U1346—Integrated Ocean Drilling Program Expedition 324 site. Core/sect/int—core number, section, and interval in section (full sample designation is 324-U1346-core-section-interval); mbsf—meters below seafloor; Flow—flow number described by shipboard scientists (Sager et al., 2010); Group—statistically distinct inclination group (see Table 5); Treat—demagnetization treatment: AF—alternating field demagnetization (mT); TH—thermal demagnetization (°C); Steps—demagnetization steps used for principle component calculation; Inc—inclination of primary magnetization; N—number of demagnetization steps used to calculate mean; MAD—maximum angular deviation; VGC—virtual geomagnetic colatitude (calculated assuming normal polarity). *Indicates sample rejected for average paleocolatitude calculations.
on April 20, 2015specialpapers.gsapubs.orgDownloaded from

Paleomagnetism of igneous rocks from the Shatsky Rise 153
TABLE 2. SITE U1347 PALEOMAGNETIC DATA
Core/sect/intDepth(mbsf) Flow Group Treat Steps
Inc(°) N
MAD(°) VGC
12R-1, 20.5–22.5 159.90 4 1 AF 12–100 −2.3 10 4.9 91.212R-1, 69–71 160.29 4 1 AF 12–100 −14.2 10 1.2 97.212R-1, 78–80 160.38 4 1 AF 25–100 −1.4 7 3.7 90.712R-1, 104–106 160.64 4 1 AF 25–60 4.4 7 2.9 87.812R-2, 2–4 160.96 4 1 AF 20–65 3.8 10 2.9 88.112R-2, 9–11 161.03 4 1 AF 10–100 7.9 11 3.3 86.012R-2, 42–44 161.36 4 1 TH 400–600 34.0 10 4.7 71.4*12R-2, 81–83 161.75 4 1 TH 480–550 4.6 6 4.9 87.713R-1, 7–9 167.07 4 2 TH 310–520 46.6 7 7.5 62.1*13R-1, 24–26 167.24 4 2 TH 500–600 26.1 5 5.8 76.213R-2, 14–16 168.63 4 2 AF 20–60 15.5 8 3.5 82.113R-3, 23–25 170.05 4 2 TH 360–520 18.5 6 6.8 80.513R-4, 2–4 170.96 4 2 AF 15–120 23.0 11 2.5 78.013R-6, 13–15 172.95 4 2 TH 500–600 37.5 5 8.8 69.0*13R-6, 132–136 174.14 4 2 AF 40–110 17.5 9 3.2 81.014R-1 51–53 177.11 5 2 AF 30–65 14.0 8 5.1 82.914R-1, 145–146 178.05 5 2 TH 350–600 23.6 4 0.5 77.714R-2, 110–112 179.17 5 2 TH 310–520 13.8 7 1.4 83.0*15R-1, 13–15 186.33 5 2 TH 500–600 26.7 5 5.5 75.915R-2, 15–17 187.62 7 2 AF 20–80 23.6 10 1.2 77.616R-1, 21–23 195.01 9 2 TH 360–520 35.4 6 4.2 70.4*16R-1, 89–91 195.69 9 2 TH 500–600 39.1 5 7.3 67.9*16R-2, 14–16 196.44 9 2 AF 30–70 18.3 7 4.2 80.616R-5, 107–109 200.65 9 2 AF 20–100 19.3 8 1.4 80.016R-5, 116–118 200.74 9 2 AF 25–60 13.1 7 3.3 83.417R-2, 54–56 206.37 11 3 TH 425–600 15.6 8 4.5 82.117R-2 94–96 206.77 11 3 TH 310–520 15.4 7 3.4 82.217R-3, 86–88 208.15 11 3 AF 20–70 18.1 9 1.4 80.717R-3, 107–109 208.36 11 3 TH 500–600 16.0 5 4.7 81.818R-1, 44–46 214.44 11 3 AF 10–100 10.2 11 4.3 84.918R-3, 75–77 217.34 11 3 AF 10–100 12.9 11 1.1 83.518R-3, 143–145 218.01 13 3 TH 280–450 37.3 5 4.6 69.1*18R-4, 54–56 218.58 14 3 AF 35–120 −2.1 11 1.4 91.118R-5, 66–68 220.12 17 3 TH 280–450 10.9 5 2.3 84.518R-6, 34–36 221.24 19 3 AF 30–100 12.6 10 2.2 83.619R-1, 32–34 223.92 20 3 AF 15–80 20.8 8 9.0 79.219R-1, 117–119 224.77 22 3 TH 280–450 10.9 6 4.1 84.519R-2, 100–102 225.88 26 3 AF 25–120 4.3 13 1.8 87.819R-3, 14–16 226.44 26 3 TH 280–450 11.8 5 3.0 84.019R-4, 8–10 227.70 29 3 TH 375–600 22.3 10 8.3 78.419R-4, 20–22 227.82 29 3 AF 35–100 1.2 9 1.3 89.420R-1, 22–24 233.42 30 3 AF 25–100 8.8 11 2.7 85.620R-2, 44–46 235.08 33 3 TH 280–450 25.9 5 2.1 76.420R-3, 5–7 235.90 33 3 AF 25–100 5.8 11 3.0 87.120R-3, 46–48 236.31 34 3 AF 25–100 3.8 7 3.9 88.1*20R-3, 118–120 237.03 34 3 TH 200–600 46.3 14 6.1 62.4*21R-3, 72–74 245.21 37 4 TH 300–500 5.9 9 5.9 87.021R-3, 14–16 247.39 37 4 AF 10–100 24.8 11 0.8 76.921R-4, 12–14 246.11 37 4 TH 310–450 33.2 4 2.6 71.9*21R-4, 121–123 253.61 40 4 AF 12–60 24.3 8 1.2 77.321R-5, 65–67 247.90 41 4 AF 30–50 15.3 5 9.2 82.222R-1, 51–53 252.91 41 4 TH 280–450 37.1 5 4.5 69.3*22R-2, 74–76 254.60 42 4 AF 15–45 14.8 7 1.0 82.522R-4, 12–14 256.84 42 4 TH 150–600 43.8 10 5.6 64.422R-4, 135–137 258.06 42 4 AF 10–80 24.2 10 0.9 77.322R-5, 9–11 258.19 42 4 AF 25–60 23.8 8 6.7 77.622R-5, 61–63 258.71 44 4 TH 500–550 12.6 5 9.5 83.622R-5, 86–88 258.96 46 4 TH 200–600 9.7 13 6.2 85.123R-2, 76–78 262.98 48 4 TH 425–600 15.9 8 7.0 81.923R-2, 134–136 263.56 48 4 TH 220–450 15.9 5 2.8 81.923R-3, 9–11 263.72 49 4 TH 200–600 29.3 13 3.0 74.323R-3, 34–36 265.38 49 4 AF 20–120 13.0 9 3.5 83.423R-3, 62–64 264.26 50 4 AF 30–80 3.9 11 1.7 88.123R-4, 103–105 266.07 53 4 TH 280–450 13.2 5 5.1 83.323R-6, 96–98 267.79 53 4 TH 450–600 18.7 7 5.7 80.424R-3, 61–63 274.70 53 4 AF 10–100 8.0 11 1.6 86.024R-3, 136–138 275.45 56 5 AF 40–75 0.7 8 3.0 89.624R-5, 41–43 277.38 57 5 AF 20–140 16.4 9 2.5 81.624R-5, 49–51 277.46 57 5 TH 280–450 20.6 5 6.8 79.424R-6, 30–32 278.45 60 5 AF 15–100 13.6 9 1.7 83.1
(Continued)
on April 20, 2015specialpapers.gsapubs.orgDownloaded from

154 Sager et al.
temperature levels (250–350 °C) during TH demagnetization, only the measurements at higher temperatures were used for the PCA calculations. For most samples, we obtained >4 high demagnetization measurements that could be used to defi ne the PCA solution (Pueringer et al., 2013; Tables 1–4).
PCA directions can be determined either constraining the vector to pass through the origin of the orthogonal vector plot (anchored) or with the solution unconstrained by the origin (unanchored). Preference between these two methods is not uni-versal, but the two analyses give nearly identical results for well-behaved samples. For consistency with prior results, we retained the anchored PCA solutions determined onboard the ship. How-ever, for measurements made at WWU and Doshisha University, PCA fi ts were calculated in the unanchored mode. Although the results are similar for most samples, we preferred solutions for unanchored results with the new data because one less assump-tion is made. No signifi cant difference was observed between data produced by the two variations of PCA calculation, justify-ing the mixing of results.
An indication of measurement repeatability is given by the maximum angular deviation (MAD), an angle calculated from PCA solution eigenvalues (Kirschvink, 1980). Demagnetization data that produce large MAD values exhibit large directional scatter, so it is suspected that the average may be unreliable. In our analysis, we used MAD = 10° as an arbitrary upper limit and did not use samples with larger values for mean direction calcula-
tions. Of the results from Site U1347, ~24% were rejected by this criterion; ~2% of the samples from Site U1350 were eliminated for the same reason. However, no samples from Site U1346 and U1349 were rejected.
Paleoinclination (Paleocolatitude) AnalysisAzimuthally unoriented samples give a biased mean when
inclinations are averaged (Briden and Ward, 1966), thus requir-ing the use of methodology designed to mitigate this bias. Several similar techniques have been devised (Briden and Ward, 1966; Kono, 1980a, 1980b; Cox and Gordon, 1984; McFadden and Reid, 1982; Arason and Levi, 2010) and they give similar results, especially in samples magnetized near the equator where the bias is small. We used a routine devised by Cox and Gordon (1984) because it is easily applied to the protocol of comparing lava fl ow data used in this study. In addition, this routine has a mechanism to estimate uncertainty of the mean direction in the absence of adequate sampling of PSV. Because this method may be unfamil-iar, a brief description is warranted.
Cox and Gordon (1984) argued that inclination data should be averaged using paleocolatitude (the complement angle to paleolatitude, λ, which is related to inclination, I, by tanI = 2tanλ) because the latter has a more symmetric distribution. Thus, the mean paleocolatitude for a magnetic unit is determined by sim-ple averaging of sample colatitude values. A correction is applied to convert the observed mean paleocolatitude to an estimate of
TABLE 2. SITE U1347 PALEOMAGNETIC DATA (Continued)
Core/sect/intDepth(mbsf) Flow Group Treat Steps
Inc(°) N
MAD(°) VGC
24R-6, 69–71 278.84 60 5 AF 30–55 18.4 6 7.0 80.624R-6, 90–92 279.05 60 5 TH 400–525 26.2 4 4.0 76.224R-7, 45–47 279.81 61 5 TH 450–600 −7.1 7 0.7 93.624R-8, 24–26 280.64 62 5 TH 400–600 30.2 9 5.2 73.8*24R-8, 127–129 281.67 65 5 AF 25–60 7.7 8 3.0 86.125R-1, 44–46 281.64 65 5 AF 15–100 13.9 9 2.9 82.925R-1, 84–86 282.04 65 5 AF 45–80 2.2 8 7.4 88.925R-2, 81–83 283.31 67 5 TH 350–575 43.2 10 8.6 64.8*25R-3, 65–67 284.53 68 5 AF 20–80 6.2 7 4.3 86.925R-4, 102–104 286.40 69 5 TH 450–600 35.3 9 3.9 70.5*25R-4, 125–127 286.63 70 5 AF 25–75 5.2 11 1.3 87.425R-5, 59–61 287.34 71 5 TH 300–600 48.9 13 4.6 60.2*26R-1, 103–105 291.73 79 5 TH 310–450 9.3 4 3.3 85.326R-2 29–31 294.74 81 5 AF 25–65 −2.6 9 3.1 92.027R-2, 23–25 294.74 81 5 AF 20–80 14.1 7 5.1 82.827R-2, 78–80 295.29 81 5 AF 20–65 7.1 10 3.4 86.427R-2 8–10 295.69 81 5 TH 360–450 1.4 3 7.9 89.327R-3, 65–67 296.24 81 5 AF 30–50 −3.2 5 14.2 94.027R-5, 4–6 297.90 81 5 AF 25–65 −1.0 9 3.2 90.527R-6, 123–125 300.38 81 5 TH 150–325 55.6 5 7.2 53.9*28R-2, 28–30 301.92 81 5 AF 20–45 20.9 6 7.7 79.228R-5, 16–18 305.61 81 5 AF 20–50 26.5 5 9.5 76.0*29R-3, 68–70 312.89 81 5 AF 15–40 64.4 6 3.5 42.5*29R-4, 57–59 314.22 81 5 TH 150–325 63.4 5 4.1 45.0*29R-4, 142–144 315.07 82 5 TH 350–600 30.7 11 2.6 73.5*29R-5, 86–88 316.01 82 5 AF 35–55 5.3 5 7.4 87.3
Note: U1347—Integrated Ocean Drilling Program Expedition 324 site. Core/sect/int—core number, section, and interval in section (full sample designation is 324-U1346-core-section-interval); mbsf—meters below seafl oor; Flow—fl ow number described by shipboard scientists (Sager et al., 2010); Group—statistically distinct inclination group (see Table 5); Treat—demagnetization treatment: AF—alternating fi eld demagnetization (mT); TH—thermal demagnetization (°C); Steps—demagnetization steps used for principle component calculation; Inc—inclination of primary magnetization; N—number of demagnetization step inclinations used to calculate mean; MAD—maximum angular deviation; VGC—virtual geomagnetic colatitude (calculated assuming normal polarity).
*Indicates sample rejected for average paleocolatitude calculations.
on April 20, 2015specialpapers.gsapubs.orgDownloaded from

Paleomagnetism of igneous rocks from the Shatsky Rise 155
TABLE 3. SITE U1349 PALEOMAGNETIC DATA
Core/sect/int Depth (mbsf) Flow Group Treat Steps
Inc (°) N
MAD (°) VGC VGC ave
7R-1, 102–104 165.12 4 1 AF 40–80 –7.4 5 1.6 89.6 7R-1, 102–104 165.12 4 1 TH 525–600 7.9 4 5.6 83.1 86.4 7R-2, 86–88 166.33 6 1 AF 50–100 –6.8 4 4.0 90.3 7R-2, 86–88 166.33 6 1 TH 225–600 2.9 16 6.2 87.8 89.1 7R-3, 46–48 167.40 8 1 AF 50–100 –4.6 4 0.7 91.7 7R-3, 46–48 167.40 8 1 TH 500–600 –6.4 5 14.0 93.4 92.6 8R-1, 77–79 169.67 12 1 AF 10–100 –8.6 12 3.3 92.4 8R-1, 77–79 169.67 12 1 TH 375–600 –9.7 10 5.7 94.9 93.7 9R-2, 90–92 175.99 16 1 AF 5–100 –4.7 13 2.1 92.4 9R-2, 90–92 175.99 16 1 TH 450–600 0.1 7 7.0 90.0 91.2 9R-3, 67–69 177.05 16 1 AF 5–100 –3.5 13 0.8 91.8 9R-3, 67–69 177.05 16 1 TH 275–600 2.4 14 2.5 88.8 90.3 10R-1, 113–115 184.43 17 1 AF 5–100 –4.2 13 0.4 92.1 10R-1, 113–115 184.43 17 1 TH 275–600 –0.2 14 3.5 90.1 91.1 10R-3, 36–38 186.23 17 1 AF 5–100 –5.7 13 1.0 92.9 10R-3, 36–38 186.23 17 1 TH 300–600 –9.5 13 3.6 94.8 93.9 10R-4, 111–113 188.49 17 1 AF 10–100 –5.3 12 0.4 92.7 10R-4, 111–113 188.49 17 1 TH 225–600 –5.8 16 2.5 92.9 92.8 10R-5, 80–82 189.55 19 1 AF 10–100 –5.1 12 0.5 92.6 10R-5, 80–82 189.55 19 1 TH 225–700 –4.7 20 2.3 92.4 92.5 11R-1, 67–69 193.57 20 1 AF 10–100 –5.5 12 0.5 92.8 11R-1, 67–69 193.57 20 1 TH 225–700 –7.2 20 2.3 93.6 93.2 11R-2, 132–134 195.71 21 1 AF 5–100 8.2 13 2.0 85.8 11R-2, 132–134 195.71 21 1 TH 375–700 0.8 14 3.5 89.6 87.7 11R-3, 85–87 196.71 22 1 AF 10–100 –5.2 12 0.8 92.6 11R-3, 85–87 196.71 22 1 TH 425–700 –7.5 12 2.0 93.8 93.2 11R-4, 20.5–22.5 197.35 22 1 AF 5–100 –3.4 13 0.4 91.7 11R-4, 20.5–22.5 197.35 22 1 TH 500–700 –7.8 9 1.0 93.9 92.8 11R-5, 66.5–68.5 199.13 22 1 AF 10–100 –0.3 12 1.1 90.2 11R-5, 66.5–68.5 199.13 22 1 TH 225–700 –3.9 20 1.9 92.0 91.1 11R-6, 51.5–53.5 200.43 22 1 AF 10–100 –4.0 12 1.3 92.0 11R-6, 51.5–53.5 200.43 22 1 TH 500–700 1.9 9 2.4 89.0 90.5 12R-1, 81–83 203.31 23 1 AF 10–100 0.6 12 1.4 90.3 12R-1, 81–83 203.31 23 1 TH 500–700 4.2 9 2.3 87.9 89.1 12R-2, 27–29 204.21 24 1 AF 10–100 –28.1 12 1.2 104.9 12R-2, 27–29 204.21 24 1 TH 475–700 –27.4 10 1.6 104.5 104.7* 12R-3, 88–90 206.25 24 1 AF 25–100 –3.5 9 0.9 91.8 12R-3, 88–90 206.25 24 1 TH 400–600 4.0 9 4.7 88.0 89.9 12R-4, 33.5–35.5 206.99 24 1 AF 25–100 –8.3 9 4.5 94.2 94.2 13R-3, 29–31 215.25 28 2 AF 5–100 –16.3 13 1.9 98.3 13R-3, 29–31 215.25 28 2 TH 400–700 –17.8 13 3.0 99.1 98.7 13R-4, 69–71 217.11 30 2 AF 5–100 –7.1 13 2.2 93.6 93.6 13R-4, 117–119 217.59 31 2 AF 5–100 –13.5 13 1.7 96.8 13R-4, 117–119 217.59 31 2 TH 225–700 –15.6 20 2.4 97.9 97.4 14R-2, 17–19 223.24 32 2 AF 5–100 –1.0 13 1.0 90.5 14R-2, 17–19 223.24 32 2 TH 225–600 –1.5 16 3.6 90.8 90.7 14R-3, 75.5–77.5 224.65 32 2 AF 10–100 –12.6 12 2.1 96.4 96.4 14R-4, 4.5–6.5 225.44 32 2 AF 5–100 –35.8 13 1.6 109.8 14R-4, 4.5–6.5 225.44 32 2 TH 300–600 –36.5 13 5.0 110.3 110.1* 14R-4, 115.5–117.5 226.55 32 2 AF 10–100 –12.3 12 2.2 96.2 14R-4, 115.5–117.5 226.55 32 2 TH 225–600 –22.1 16 3.4 101.5 98.9 14R-5, 72.5–74.5 227.46 32 2 AF 10–100 –2.0 12 2.1 91.0 14R-5, 72.5–74.5 227.46 32 2 TH 275–600 –4.6 14 3.9 92.3 91.7 14R-6, 77.5–79.5 228.93 32 2 AF Oct–80 –1.6 11 1.6 90.8 14R-6, 77.5–79.5 228.93 32 2 TH 225–600 –1.0 16 2.5 90.5 90.7 15R-1, 61–63 231.91 32 2 AF Oct–80 –3.5 11 1.4 91.8 15R-1, 61–63 231.91 32 2 TH 225–600 –3.5 16 2.2 91.8 91.8 15R-5, 40.5–42.5 236.86 32 2 AF 5–100 –28.9 13 1.0 105.4 15R-5, 40.5–42.5 236.86 32 2 TH 225–600 –29.4 16 2.4 105.7 105.6 16R-1, 103–105 241.93 32 2 AF May–80 –0.7 12 2.4 90.4 16R-1, 103–105 241.93 32 2 TH 225–600 –7.3 16 3.1 93.7 92.1 16R-3, 21.5–23.5 243.75 32 2 AF 5–100 –37.2 13 2.2 110.8 16R-3, 21.5–23.5 243.75 32 2 TH 225–600 –23.9 16 2.9 102.5 106.7 Note: U1349—Integrated Ocean Drilling Program Expedition 324 site. Core/sect/int—core number, section, and interval in section (full sample designation is 324-U1346-core-section-interval); mbsf—meters below seafloor; Flow—flow number described by shipboard scientists (Sager et al., 2010); Group—statistically distinct inclination group (see Table 5); Treat—demagnetization treatment: AF—alternating field demagnetization (mT), TH—thermal demagnetization (°C); Steps—demagnetization steps used for principle component calculation; Inc—inclination of primary magnetization; N—number of demagnetization step inclinations used to calculate mean; MAD—maximum angular deviation; VGC—virtual geomagnetic colatitude (calculated assuming normal polarity); VGC ave—average of VGC data for a single sample. *Indicates sample rejected for average paleocolatitude calculations.
on April 20, 2015specialpapers.gsapubs.orgDownloaded from
156 Sager et al.
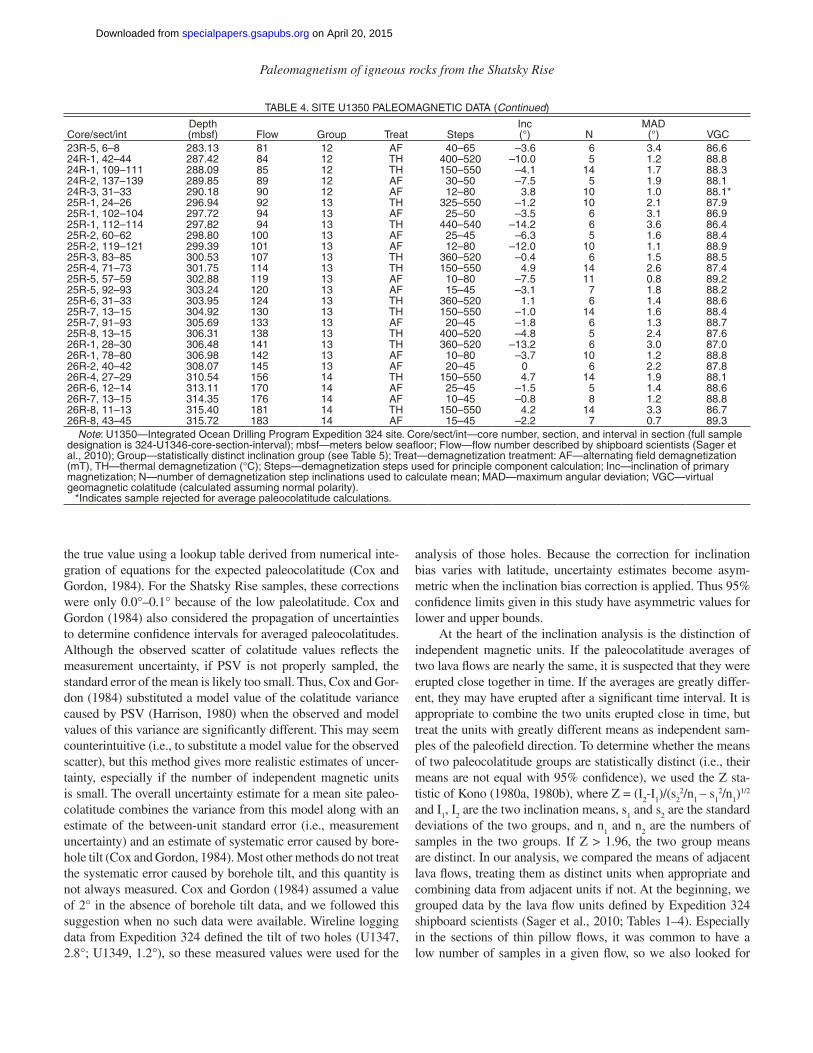
TABLE 4. SITE U1350 PALEOMAGNETIC DATA
Core/sect/intDepth(mbsf) Flow Group Treat Steps
Inc(°) N
MAD(°) VGC
7R-1, 53–55 153.13 2 1 TH 150–550 –9.5 14 2.6 87.47R-1, 104–106 153.64 2 1 TH 280–530 –1.1 7 2.8 87.27R-2, 21–23 154.25 2 1 AF 15–40 5.8 6 3.0 87.08R-1, 63–65 155.93 4 1 TH 400–530 –2.0 5 2.8 87.28R-2, 4–6 156.80 6 1 AF 25–55 –6.7 7 1.7 88.38R-3, 4–6 158.11 7 1 AF 25–45 9.1 5 1.9 88.18R-3, 85–87 158.92 7 1 AF 7–100 –1.3 12 1.6 88.49R-1, 58–60 162.88 9 1 TH 220–500 –8.0 8 2.8 87.29R-2, 69–71 164.04 9 1 TH 150–550 10.0 14 6.3 83.79R-3, 51–53 164.93 9 1 AF 15–60 –4.4 10 1.6 88.49R-4, 89–91 166.62 10 1 AF 10–100 –2.8 11 0.9 89.19R-5, 9–11 167.07 10 1 TH 220–500 –0.3 8 3.3 86.79R-6, 67–69 168.96 10 1 AF 20–60 0.5 9 8.3 81.710R-2, 38–40 173.73 12 1 AF 15–50 2.5 8 1.0 89.011R-1, 51–53 182.01 12 1 AF 10–80 0.5 10 0.6 89.411R-1, 128–130 182.78 13 1 TH 440–530 –3.6 4 1.8 88.211R-2, 14–16 183.16 14 1 AF 20–45 –2.4 6 2.6 87.411R-2, 77–79 183.79 14 1 TH 150–550 7.6 14 6.2 83.812R-1, 8–10 191.18 14 2 AF 25–50 18.3 6 2.7 87.312R-1, 50–52 191.60 15 2 AF 10–80 27.0 11 1.1 88.913R-1, 50–52 196.40 16 2 TH 150–550 43.0 14 4.9 65.0*13R-1, 100–102 196.90 16 2 TH 310–500 –19.1 6 5.6 100.1*13R-2, 55–57 197.88 17 3 AF 30–50 7.3 5 3.9 86.114R-1, 52–54 201.22 20 3 AF 35–65 2.5 7 2.0 88.014R-2, 9–11 201.96 20 3 AF 10–80 –1.0 10 1.3 88.714R-2, 21–23 202.08 20 3 TH 440–550 –1.2 7 1.0 89.015R-1, 53–55 206.03 25 3 AF 25–50 –3.3 6 2.7 87.315R-1, 101–103 206.51 25 3 TH 280–440 37.8 5 6.1 68.6*16R-1, 35–37 210.65 27 4 TH 300–575 –2.3 12 2.0 88.016R-2, 5–7 211.07 27 4 TH 310–530 –6.0 7 1.9 88.116R-2, 72–74 211.74 27 4 AF 15–100 –3.5 10 1.8 88.216R-3, 105–107 213.01 28 4 AF 25–55 –2.5 7 1.7 88.317R-1, 138–140 221.28 30 5 TH 360–530 10.2 6 1.3 88.717R-2, 34–36 221.74 30 5 TH 150–575 18.3 15 3.3 86.717R-2, 80–82 222.2 30 5 AF 25–45 0.4 5 1.7 88.317R-3, 72–74 223.52 34 5 AF 10–80 3.0 11 0.7 89.318R-1, 72–74 230.22 36 6 TH 280–440 24.9 5 4.1 85.918R-1, 97–99 230.47 36 6 TH 150–575 14.8 51 3.4 86.618R-2, 50–52 231.44 37 6 AF 7–60 14.5 11 0.9 89.118R-2, 73–75 231.67 37 6 AF 30–55 11.9 6 2.2 87.818R-3, 12–14 232.56 37 6 TH 400–500 60.6 4 8.0 62.1*18R-3, 60–62 233.04 37 6 TH 200–575 29.0 14 1.9 88.119R-1, 68–70 239.78 38 7 AF 10–60 6.3 10 0.7 89.319R-1, 119–121 240.29 39 7 AF 30–55 6.3 6 2.8 87.219R-2, 125–127 241.78 44 7 TH 280–480 16.0 6 3.4 86.619R-3, 37–39 242.33 44 7 AF 25–50 –8.1 6 2.4 87.620R-1, 31–33 249.01 46 7 TH 350–375 13.4 10 4.5 83.2*20R-1, 65–67 249.35 46 8 AF 25–50 –8.0 6 2.0 88.020R-1, 95–97 249.65 47 8 TH 480–550 –11.8 6 6.3 83.720R-2, 67–69 250.70 49 8 TH 440–575 –5.6 6 3.3 86.720R-2, 132–134 251.35 50 8 AF 25–50 –6.3 6 2.5 87.520R-3, 4–6 251.44 50 8 AF 7–60 –11.0 11 1.4 88.621R-1, 23–25 258.53 51 9 TH 360–550 1.6 8 4.0 86.021R-1, 35–37 258.65 51 9 TH 325–575 25.1 11 3.0 76.8*21R-1, 137–139 259.67 52 9 AF 30–50 5.0 5 1.1 88.921R-2, 67–69 260.47 52 9 AF 7–80 7.9 12 1.1 88.921R-2, 135–137 261.15 53 10 TH 440–575 16.7 6 1.2 88.821R-3, 48–50 261.71 53 10 TH 250–575 18.6 13 3.5 86.521R-3, 64–66 261.87 54 10 AF 25–45 14.1 5 1.6 88.422R-3, 113–115 271.30 54 10 TH 150–525 22.8 13 3.3 78.1*22R-1, 67–69 268.47 57 11 TH 360–550 3.5 7 5.9 84.122R-2, 68–70 269.54 59 11 TH 360–550 1.9 7 3.2 86.822R-2, 97–99 269.84 59 11 AF 12–100 –0.3 11 1.9 88.122R-4, 87–89 272.43 65 11 TH 360–520 4.1 6 1.6 88.422R-5, 71–73 273.69 69 11 AF 15–55 –0.5 9 1.6 88.422R-5, 135–137 274.33 70 11 TH 360–540 –11.8 8 1.2 95.9*23R-1, 22–24 277.62 71 11 AF 25–60 2.4 8 2.8 87.223R-1, 78–80 278.18 72 11 AF 15–80 0.4 9 2.1 87.923R-2, 49–51 279.31 74 11 TH 425–575 3.6 7 3.8 86.223R-3, 125–127 281.43 78 12 AF 25–50 –5.1 6 1.7 88.323R-4, 16–18 281.84 79 12 TH 360–520 –9.3 6 1.4 88.623R-4, 92–94 282.60 81 12 AF 10–100 –2.5 12 3.3 86.7
(Continued)
on April 20, 2015specialpapers.gsapubs.orgDownloaded from
Paleomagnetism of igneous rocks from the Shatsky Rise 157
the true value using a lookup table derived from numerical inte-gration of equations for the expected paleocolatitude (Cox and Gordon, 1984). For the Shatsky Rise samples, these corrections were only 0.0°–0.1° because of the low paleolatitude. Cox and Gordon (1984) also considered the propagation of uncertainties to determine confi dence intervals for averaged paleocolatitudes. Although the observed scatter of colatitude values refl ects the measurement uncertainty, if PSV is not properly sampled, the standard error of the mean is likely too small. Thus, Cox and Gor-don (1984) substituted a model value of the colatitude variance caused by PSV (Harrison, 1980) when the observed and model values of this variance are signifi cantly different. This may seem counterintuitive (i.e., to substitute a model value for the observed scatter), but this method gives more realistic estimates of uncer-tainty, especially if the number of independent magnetic units is small. The overall uncertainty estimate for a mean site paleo-colatitude combines the variance from this model along with an estimate of the between-unit standard error (i.e., measurement uncertainty) and an estimate of systematic error caused by bore-hole tilt (Cox and Gordon, 1984). Most other methods do not treat the systematic error caused by borehole tilt, and this quantity is not always measured. Cox and Gordon (1984) assumed a value of 2° in the absence of borehole tilt data, and we followed this suggestion when no such data were available. Wireline logging data from Expedition 324 defi ned the tilt of two holes (U1347, 2.8°; U1349, 1.2°), so these measured values were used for the
analysis of those holes. Because the correction for inclination bias varies with latitude, uncertainty estimates become asym-metric when the inclination bias correction is applied. Thus 95% confi dence limits given in this study have asymmetric values for lower and upper bounds.
At the heart of the inclination analysis is the distinction of independent magnetic units. If the paleocolatitude averages of two lava fl ows are nearly the same, it is suspected that they were erupted close together in time. If the averages are greatly differ-ent, they may have erupted after a signifi cant time interval. It is appropriate to combine the two units erupted close in time, but treat the units with greatly different means as independent sam-ples of the paleofi eld direction. To determine whether the means of two paleocolatitude groups are statistically distinct (i.e., their means are not equal with 95% confi dence), we used the Z sta-tistic of Kono (1980a, 1980b), where Z = (I
2-I
1)/(s
22/n
1 – s
12/n
1)1/2
and I1, I
2 are the two inclination means, s
1 and s
2 are the standard
deviations of the two groups, and n1 and n
2 are the numbers of
samples in the two groups. If Z > 1.96, the two group means are distinct. In our analysis, we compared the means of adjacent lava fl ows, treating them as distinct units when appropriate and combining data from adjacent units if not. At the beginning, we grouped data by the lava fl ow units defi ned by Expedition 324 shipboard scientists (Sager et al., 2010; Tables 1–4). Especially in the sections of thin pillow fl ows, it was common to have a low number of samples in a given fl ow, so we also looked for
TABLE 4. SITE U1350 PALEOMAGNETIC DATA (Continued)
Core/sect/intDepth(mbsf) Flow Group Treat Steps
Inc(°) N
MAD(°) VGC
23R-5, 6–8 283.13 81 12 AF 40–65 –3.6 6 3.4 86.624R-1, 42–44 287.42 84 12 TH 400–520 –10.0 5 1.2 88.824R-1, 109–111 288.09 85 12 TH 150–550 –4.1 14 1.7 88.324R-2, 137–139 289.85 89 12 AF 30–50 –7.5 5 1.9 88.124R-3, 31–33 290.18 90 12 AF 12–80 3.8 10 1.0 88.1*25R-1, 24–26 296.94 92 13 TH 325–550 –1.2 10 2.1 87.925R-1, 102–104 297.72 94 13 AF 25–50 –3.5 6 3.1 86.925R-1, 112–114 297.82 94 13 TH 440–540 –14.2 6 3.6 86.425R-2, 60–62 298.80 100 13 AF 25–45 –6.3 5 1.6 88.425R-2, 119–121 299.39 101 13 AF 12–80 –12.0 10 1.1 88.925R-3, 83–85 300.53 107 13 TH 360–520 –0.4 6 1.5 88.525R-4, 71–73 301.75 114 13 TH 150–550 4.9 14 2.6 87.425R-5, 57–59 302.88 119 13 AF 10–80 –7.5 11 0.8 89.225R-5, 92–93 303.24 120 13 AF 15–45 –3.1 7 1.8 88.225R-6, 31–33 303.95 124 13 TH 360–520 1.1 6 1.4 88.625R-7, 13–15 304.92 130 13 TH 150–550 –1.0 14 1.6 88.425R-7, 91–93 305.69 133 13 AF 20–45 –1.8 6 1.3 88.725R-8, 13–15 306.31 138 13 TH 400–520 –4.8 5 2.4 87.626R-1, 28–30 306.48 141 13 TH 360–520 –13.2 6 3.0 87.026R-1, 78–80 306.98 142 13 AF 10–80 –3.7
010 1.2 88.8
26R-2, 40–42 308.07 145 13 AF 20–45 6 2.2 87.826R-4, 27–29 310.54 156 14 TH 150–550 4.7 14 1.9 88.126R-6, 12–14 313.11 170 14 AF 25–45 –1.5 5 1.4 88.626R-7, 13–15 314.35 176 14 AF 10–45 –0.8 8 1.2 88.826R-8, 11–13 315.40 181 14 TH 150–550 4.2 14 3.3 86.726R-8, 43–45 315.72 183 14 AF 15–45 –2.2 7 0.7 89.3
Note: U1350—Integrated Ocean Drilling Program Expedition 324 site. Core/sect/int—core number, section, and interval in section (full sample designation is 324-U1346-core-section-interval); mbsf—meters below seafl oor; Flow—fl ow number described by shipboard scientists (Sager et al., 2010); Group—statistically distinct inclination group (see Table 5); Treat—demagnetization treatment: AF—alternating fi eld demagnetization (mT), TH—thermal demagnetization (°C); Steps—demagnetization steps used for principle component calculation; Inc—inclination of primary magnetization; N—number of demagnetization step inclinations used to calculate mean; MAD—maximum angular deviation; VGC—virtual geomagnetic colatitude (calculated assuming normal polarity).
*Indicates sample rejected for average paleocolatitude calculations.
on April 20, 2015specialpapers.gsapubs.orgDownloaded from

158 Sager et al.
groupings of similar paleocolatitudes to indicate where magnetic unit boundaries occur. Often the average of a group of paleoco-latitudes contains data from several adjacent lava fl ows.
Even though two magnetic units are statistically distinct, they may not be independent in the strictest sense. Cox and Gor-don (1984) recommended a conservative approach when deter-mining a site average, combining adjacent magnetic units if the colatitude difference is not ~10°. Often adjacent units may be statistically distinct, but are only separated by a few degrees. Because this approach yields a more conservative estimate of uncertainty, we applied it in this study.
When paleocolatitude data were plotted, it was clear that some values clustered but others appeared to be outliers. We applied several criteria to determine which values are unreliable and did not use these outliers for the calculation of averages. All samples with MAD > 10° were rejected because these samples have low internal consistency in demagnetization steps. We also considered a sample to be an outlier if its colatitude is displaced from the group mean more than two standard deviations. After this fi ltering, it was noted that the distribution of samples around the mean in some groups (all at Site U1347) showed a tail of low colatitude values (corresponding to higher inclinations). Because most samples were affected by a steep, downward overprint (probably from the drill string), it is likely that in these samples the overprint was incompletely removed. In response, we also rejected samples whose magnetization vector did not stop shal-lowing during the demagnetization process. There were a num-ber of samples from Site U1347 in which the differences at high demagnetization steps were small, but the vector was nonetheless shallower at each successive step. Almost all of these samples gave low paleocolatitude values and their removal resulted in a distribution that was more symmetric around the mean value.
RESULTS
Magnetic Properties
Basalt samples from Expedition 324 cores show magnetic properties indicating that they contain a diverse assemblage of mainly titanomagnetite and titanomaghemite grains of varying size and behavior. There were indications from thin sections (Sager et al., 2010) and magnetic properties that some samples from Site U1349 contain hematite. Despite this diversity, most sample properties are consistent with those of seafl oor basalts that reliably record the paleomagnetic fi eld.
Magnetic grains observed by SEM in thin section range from 1 to 2 µm to several tens of microns across, but in samples from Sites U1347 and U1350 the larger grains have been subdi-vided by alteration and breakage into micron-scale grains (Car-vallo and Camps, 2013). Samples from Sites U1347 and U1350 contain skeletal grains typical of alteration, whereas Site U1349 samples contain mostly unbroken and little altered grains. Sam-ples from Sites U1347 and U1350 had iron oxide grains with oxy- exsolution patterns (Carvallo and Camps, 2013), implying
oxides of different compositions. Consistent with this observa-tion, at all sites, electron dispersive spectra measurements made with the electron microscope show a wide variety in titanium content for the magnetic grains.
Low- and high-temperature heating and cooling measure-ments indicate a variety of behaviors, from reversible to highly irreversible. Curie temperatures of magnetic grains range from low (~160 °C) to high (550–575 °C), but the most common values are 400–500 °C. This variability suggests that the samples con-tain a complex mixture of magnetic grains and phases. Changes in magnetization with temperature are consistent with titano-magnetite with varying titanium content and variable oxidation states (Carvallo and Camps, 2013; Carvallo et al., 2013). Suscep-tibility and temperature measurements for Sites U1347, U1349, and U1350 show some samples with two different Curie tem-peratures, indicating two magnetic phases. After heating, often only the higher temperature component survived, implying that the lower Curie temperature component (titanium rich) inverted to a higher Curie temperature (low titanium) mineral (Carvallo and Camps, 2013). Similarly, it was also noted that some basalt fl ow samples showed an increase of magnetic susceptibility at higher TH demagnetization steps (Sager et al., 2010), a behav-ior implying the inversion of titanomagnetite to magnetite dur-ing heating (Özdemir and O’Reilly, 1982). This transformation did not appear to change magnetization direction, so the newly formed magnetite appears to inherit the magnetization direction of the original magnetic minerals or the new magnetite has no net direction (Carvallo et al., 2013; Pueringer et al., 2013).
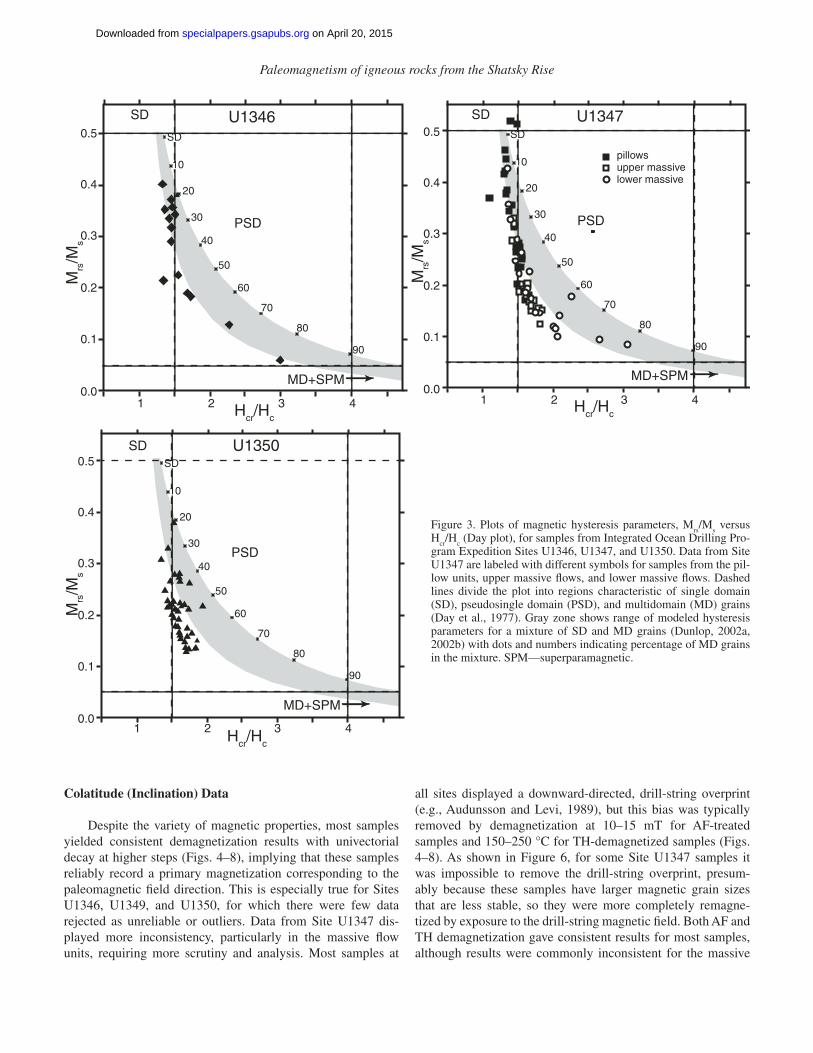
Magnetic grain sizes determined from hysteresis and FORC measurements indicate that most samples have grains that respond as single domain (SD) or pseudosingle domain (PSD) types (Pueringer et al., 2013; Carvallo, 2014), consistent with thin-section observations of small and broken iron oxide grains (Carvallo and Camps, 2013; Carvallo et al., 2013). Hysteresis measurements of samples from Sites U1346, U1347, and U1350 are mostly in the SD-PSD range (Fig. 3), implying grain types that usually record the paleomagnetic fi eld reliably (e.g., Butler, 1992). Most samples from Sites U1346 and U1350 plot along an SD-MD mixing curve (Dunlop, 2002a, 2002b) at values of 20%–60% MD grains (Fig. 3). Site U1347 results show the most variation, plotting along the same mixing curve from 0%–80% MD (Fig. 3). In particular, most of the samples that exhibit more MD behavior are from the massive fl ows, whereas those on the SD end of the distribution are from the fi ne-grained pillow fl ows. Moreover, immersion of samples in liquid nitrogen (a procedure to demagnetize MD grains) showed little effect on samples from Sites U1346 and U1350 and the pillow fl ows of Site U1347. Only some samples from the massive fl ows of Site U1347 displayed signifi cant changes in magnetization with this treatment (Puer-inger et al., 2013). These results are consistent with most Expedi-tion 324 samples having SD-PSD behavior, but the massive fl ow samples of Site U1347 may exhibit MD behavior that can include having an unstable magnetization prone to acquiring an overprint (e.g., Butler, 1992).
on April 20, 2015specialpapers.gsapubs.orgDownloaded from
Paleomagnetism of igneous rocks from the Shatsky Rise 159
Colatitude (Inclination) Data
Despite the variety of magnetic properties, most samples yielded consistent demagnetization results with univectorial decay at higher steps (Figs. 4–8), implying that these samples reliably record a primary magnetization corresponding to the paleomagnetic fi eld direction. This is especially true for Sites U1346, U1349, and U1350, for which there were few data rejected as unreliable or outliers. Data from Site U1347 dis-played more inconsistency, particularly in the massive fl ow units, requiring more scrutiny and analysis. Most samples at
all sites displayed a downward-directed, drill-string overprint (e.g., Audunsson and Levi, 1989), but this bias was typically removed by demagnetization at 10–15 mT for AF-treated samples and 150–250 °C for TH-demagnetized samples (Figs. 4–8). As shown in Figure 6, for some Site U1347 samples it was impossible to remove the drill-string overprint, presum-ably because these samples have larger magnetic grain sizes that are less stable, so they were more completely remagne-tized by exposure to the drill-string magnetic fi eld. Both AF and TH demagnetization gave consistent results for most samples, although results were commonly inconsistent for the massive
Hcr/Hc
Mrs/M
s
1 2 3 40.0
0.1
0.2
0.3
0.4
0.5
MD+SPM
PSD
SD U1346
50
60
70
80
40
20
30
10
90
SD
1 2 3 40.0
0.1
0.2
0.3
0.4
0.5
PSD
SD U1347
pillowsupper massivelower massive
50
60
70
80
40
20
30
10
90
SD
MD+SPM
Hcr/HcM
rs/M
s
50
60
70
80
40
20
30
10
90
SD
1 2 3 40.0
0.1
0.2
0.3
0.4
0.5
PSD
SD U1350
MD+SPM
Hcr/Hc
Mrs/M
s
Figure 3. Plots of magnetic hysteresis parameters, Mrs/M
s versus
Hcr/H
c (Day plot), for samples from Integrated Ocean Drilling Pro-
gram Expedition Sites U1346, U1347, and U1350. Data from Site U1347 are labeled with different symbols for samples from the pil-low units, upper massive fl ows, and lower massive fl ows. Dashed lines divide the plot into regions characteristic of single domain (SD), pseudosingle domain (PSD), and multidomain (MD) grains (Day et al., 1977). Gray zone shows range of modeled hysteresis parameters for a mixture of SD and MD grains (Dunlop, 2002a, 2002b) with dots and numbers indicating percentage of MD grains in the mixture. SPM—superparamagnetic.
on April 20, 2015specialpapers.gsapubs.orgDownloaded from
160 Sager et al.
fl ow samples of Site U1347. The lowermost massive fl ow at Site U1347 was particularly troublesome and many samples gave poor results (Table 2).
AF demagnetized samples often displayed low (<10 mT) median destructive fi eld (MDF) values, although some samples had higher MDF. Despite the low MDF, most AF-demagnetized samples were characterized by univectorial decay once the over-print was removed (Pueringer et al., 2013). Some samples from
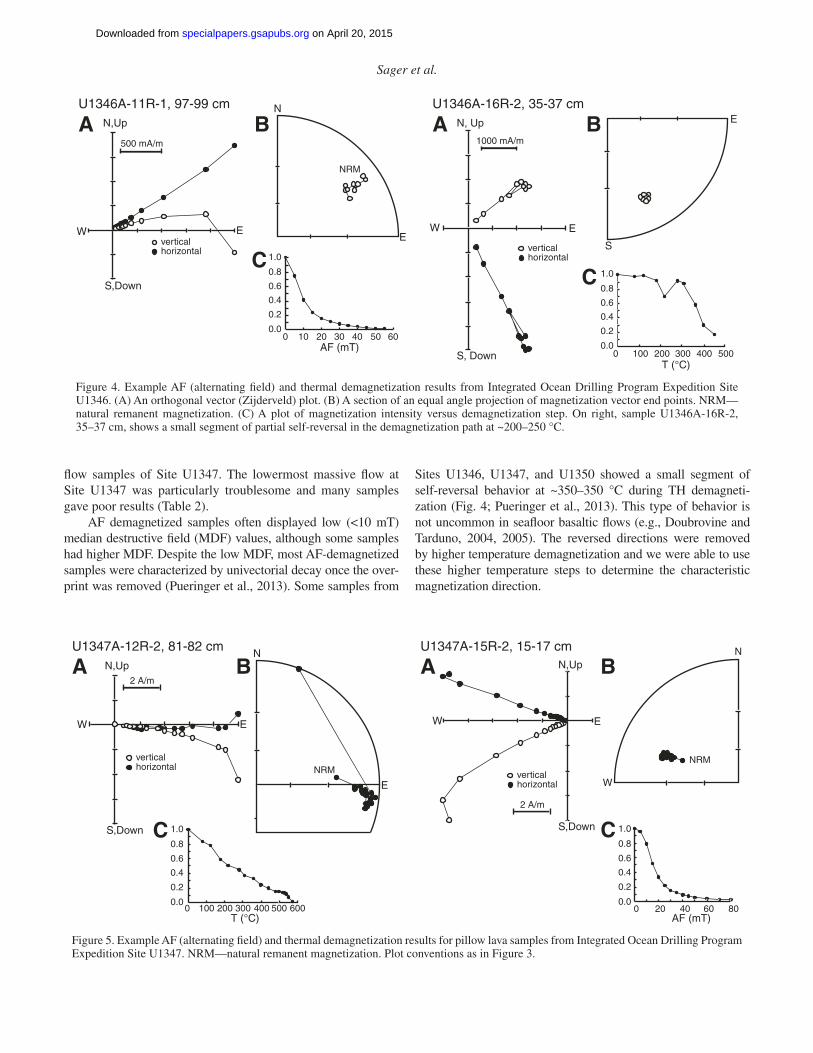
Sites U1346, U1347, and U1350 showed a small segment of self-reversal behavior at ~350–350 °C during TH demagneti-zation (Fig. 4; Pueringer et al., 2013). This type of behavior is not uncommon in seafl oor basaltic fl ows (e.g., Doubrovine and Tarduno, 2004, 2005). The reversed directions were removed by higher temperature demagnetization and we were able to use these higher temperature steps to determine the characteristic magnetization direction.
N, Up
S, Down
E
1000 mA/m
horizontalvertical
0 100 200 300 400 500T (°C)
0.0
0.2
0.4
0.6
0.8
1.0
A B
C
U1346A-16R-2, 35-37 cmE
S
A B
C
NRM
N
E
AF (mT)
0.0
0.2
0.4
0.6
0.8
1.0
0 10 20 30 40 50 60
U1346A-11R-1, 97-99 cm
E
horizontalvertical
500 mA/m
N,Up
S,Down
W W
Figure 4. Example AF (alternating fi eld) and thermal demagnetization results from Integrated Ocean Drilling Program Expedition Site U1346. (A) An orthogonal vector (Zijderveld) plot. (B) A section of an equal angle projection of magnetization vector end points. NRM—natural remanent magnetization. (C) A plot of magnetization intensity versus demagnetization step. On right, sample U1346A-16R-2, 35–37 cm, shows a small segment of partial self-reversal in the demagnetization path at ~200–250 °C.
A BU1347A-15R-2, 15-17 cm
C
AF (mT)
0.0
0.2
0.4
0.6
0.8
1.0
0 20 40 60 80
NRM
N
W
E
horizontalvertical
2 A/m
N,Up
S,Down
W
NRM
N
E
A B
C
U1347A-12R-2, 81-82 cm
T (°C)
0.0
0.2
0.4
0.6
0.8
1.0
0 100 200 300 400 500 600
E
horizontalvertical
2 A/m
N,Up
S,Down
W
Figure 5. Example AF (alternating fi eld) and thermal demagnetization results for pillow lava samples from Integrated Ocean Drilling Program Expedition Site U1347. NRM—natural remanent magnetization. Plot conventions as in Figure 3.
on April 20, 2015specialpapers.gsapubs.orgDownloaded from

Paleomagnetism of igneous rocks from the Shatsky Rise 161
Site 1346Sample measurements from Site U1346 display a narrow
range of small negative inclination values (Table 1). Because we do not initially know the magnetic polarity, we assume that the measured samples record normal magnetic polarity. This results in colatitude values ranging from ~95° to 105° for Site U1346 (Fig. 9). No change in the sign of the paleoinclinations is observed, so all of the samples record the same polarity. Analy-
sis showed that only two groups are statistically distinct and the difference in average colatitude is small, 1.8° (Fig. 9; Table 5). This small difference implies little change in the magnetic fi eld direction between fl ow groups, so it is unlikely that signifi cant time passed between these eruptions. By the rationale described in Cox and Gordon (1984), we combine the two groups for a single average value. The average colatitude for the site is 100.3° with a 95% confi dence of +20.7°/–20.1° (Table 5).
A B
C
U1347A-27R-5, 4-6 cm
AF (mT)
0.0
0.2
0.4
0.6
0.8
1.0
0 10 20 30 40 50 60 70
NRM
N
W
E
horizontalvertical
3 A/mN,Up
S,Down
W
A B
C
U1347A-28R-1, 8-10 cm
T (°C)
0.0
0.2
0.4
0.6
0.8
1.0
0 100 200 300 400 500
NRM
S
W
E
horizontalvertical
2 A/m
N,Up
S,Down
W
Figure 6. Example AF (alternating fi eld) and thermal demagnetization results for massive lava fl ow samples from Integrated Ocean Drilling Program Expedition Site U1347. NRM—natural remanent magnetization. Sample U1347A-27R-5, 4-6 cm pro-duced a principle component analysis vector solution that is interpreted as reliable. Sample U1347A-28R-1, 8-10 cm displays a steep overprint that was not removed by demagnetization, which is common for coarse-grained massive lava fl ow samples. Plot conventions as in Figure 3.
A B
C
U1349A-11R-3, 85-87 cm
NRM
S
E
N
horizontalvertical
200 mA/m
W,Up
E,Down
S
0.0
0.2
0.4
0.6
0.8
1.0
0 100 300 500T (°C)
NRM
S
E
N
horizontalvertical
500 mA/m
W,Up
E,Down
S
0.0
0.2
0.4
0.6
0.8
1.0
0 20 40 60 80 100AF (mT)
A B
C
U1349A-9R-2, 90-92 cm
Figure 7. Example AF (alternating fi eld) and thermal demagnetization results for samples from Integrated Ocean Drilling Program Expe-dition Site U1349. NRM—natural remanent magnetization. Plot conventions as in Figure 3. The small magnetization remaining at high (>575 °C) thermal demagnetization steps implies that the magnetization is partly carried by hematite, but it appears to be a minor compo-nent that does not carry a different direction.
on April 20, 2015specialpapers.gsapubs.orgDownloaded from
162 Sager et al.
Site 1347Sample paleoinclinations from Site U1347 samples are
predominantly positive (Table 2), giving group mean colati-tudes ranging from 79.7° to 89.8° (normal polarity assumed). Individual sample data from Site U1347 show more scatter than the other sites (Fig. 10) and careful analysis was required to distinguish outliers (see Methods discussion). Many outli-ers gave low values of colatitude (high inclination) and were recognized as not having had the steep, drill-string over-print completely removed. Five statistically distinct mag-netic groups were recognized within the cored section (Fig. 10). Differences between successive group mean colatitudes range from 2.7° to 10.1°. The large change between groups 1 and 2 implies that these two groups were erupted after a signifi cant time gap, but the amount of paleocolatitude change is small for groups 2–5 (2.7°–4.9°), implying that the sampled paleofi eld did not undergo signifi cant secular varia-tion between these groups. Indicating otherwise, preliminary radiometric dates (Heaton and Koppers, 2014; Geldmacher et al., 2014) show a likely gap of at least ~3 m.y. between the lower massive fl ows (>260 mbsf) and the upper massive fl ows (<220 mbsf). Thus, despite magnetic directions being similar between groups 3 and 4 (Fig. 10), there is likely a large age discontinuity. This illustrates that signifi cant time can pass between successive lava fl ows with similar paleoinclinations owing to the fact that PSV is quasi-cyclical. For calculating the site mean paleocolatitude, we assume 3 independent magnetic groups: group 1, groups 2 and 3, and groups 4 and 5 (Table 5). These three groups yield an average colatitude of 84.8° with a 95% confi dence of +13.0°/–13.2° (Table 5).
Site 1349Measured paleoinclinations for Site U1349 are mostly small
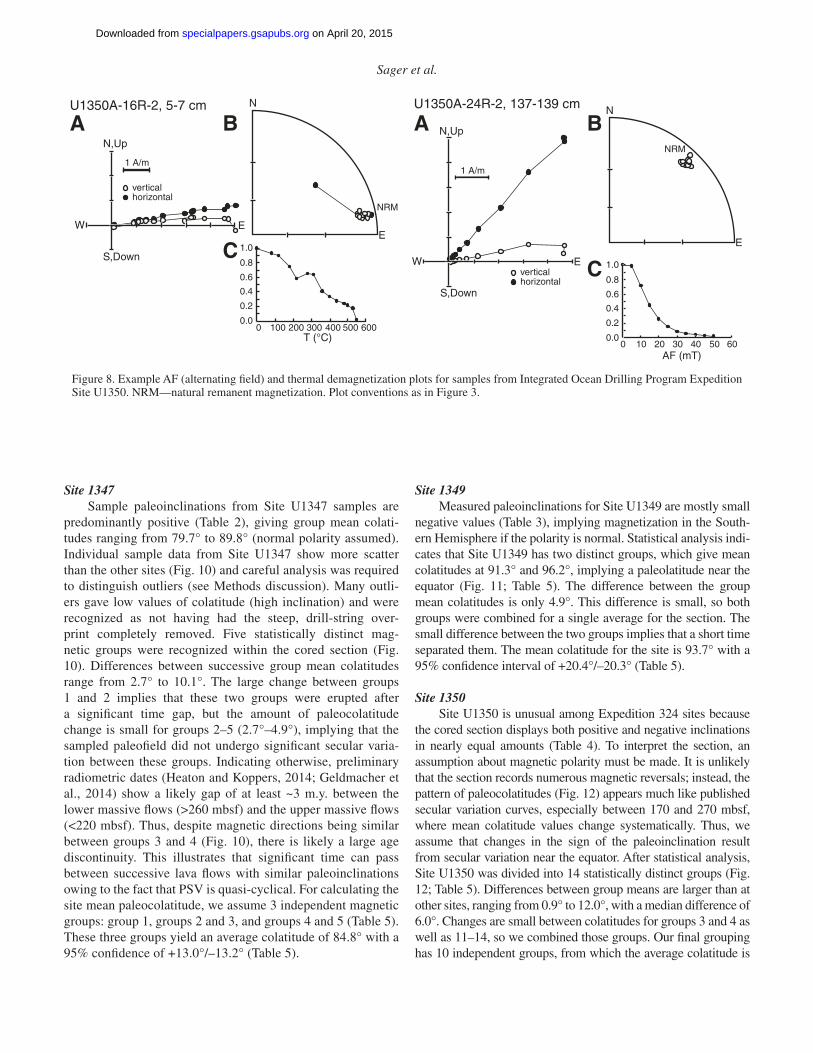
negative values (Table 3), implying magnetization in the South-ern Hemisphere if the polarity is normal. Statistical analysis indi-cates that Site U1349 has two distinct groups, which give mean colatitudes at 91.3° and 96.2°, implying a paleolatitude near the equator (Fig. 11; Table 5). The difference between the group mean colatitudes is only 4.9°. This difference is small, so both groups were combined for a single average for the section. The small difference between the two groups implies that a short time separated them. The mean colatitude for the site is 93.7° with a 95% confi dence interval of +20.4°/–20.3° (Table 5).
Site 1350Site U1350 is unusual among Expedition 324 sites because
the cored section displays both positive and negative inclinations in nearly equal amounts (Table 4). To interpret the section, an assumption about magnetic polarity must be made. It is unlikely that the section records numerous magnetic reversals; instead, the pattern of paleocolatitudes (Fig. 12) appears much like published secular variation curves, especially between 170 and 270 mbsf, where mean colatitude values change systematically. Thus, we assume that changes in the sign of the paleoinclination result from secular variation near the equator. After statistical analysis, Site U1350 was divided into 14 statistically distinct groups (Fig. 12; Table 5). Differences between group means are larger than at other sites, ranging from 0.9° to 12.0°, with a median difference of 6.0°. Changes are small between colatitudes for groups 3 and 4 as well as 11–14, so we combined those groups. Our fi nal grouping has 10 independent groups, from which the average colatitude is
A B
C
U1350A-16R-2, 5-7 cm
NRM
N
EE
horizontalvertical
1 A/m
N,Up
S,Down
W
T (°C)
0.0
0.2
0.4
0.6
0.8
1.0
0 100 200 300 400 500 600
A B
C
NRM
N
E
U1350A-24R-2, 137-139 cm
AF (mT)
0.0
0.2
0.4
0.6
0.8
1.0
0 10 20 30 40 50 60
E
horizontalvertical
1 A/m
N,Up
S,Down
W
Figure 8. Example AF (alternating fi eld) and thermal demagnetization plots for samples from Integrated Ocean Drilling Program Expedition Site U1350. NRM—natural remanent magnetization. Plot conventions as in Figure 3.
on April 20, 2015specialpapers.gsapubs.orgDownloaded from

Paleomagnetism of igneous rocks from the Shatsky Rise 163D
epth
(m
bsf)
Colatitude (°)50 60 70 80 90 100 110 120 130
140
150
180
190
160
170
Colatitude
Mean colatitude
Standard deviation
U1346
1
2
Figure 9. Colatitude versus depth (meters below seafl oor, mbsf) for Integrated Ocean Drilling Program Expedition Site U1346 with statistically distinct fl ow groups labeled in numerical order. Heavy line segments show colatitude group means (Table 5) and the shaded areas show the standard deviation for each mean co-latitude. The dashed gray line represents 90° colatitude (equator).
calculated as 86.7° with a 95% confi dence interval of +7.2/–7.3 (Table 5). In this case, the confi dence limits are much smaller than those of the other sites because of the 10 independent groups.
DISCUSSION
Timing of Lava Flow Emplacement
Geomagnetic fi eld directions are constantly changing with time owing to PSV. If many years have passed between succes-
sive lava fl ow eruptions, it is likely that they will display different paleoinclinations. Jurassic geomagnetic fi eld behavior is poorly known, so in this discussion we must assume that Jurassic PSV was similar to the recent record. As shown by Holocene deep-sea and lake sediment cores (which can produce high-resolution records), recent PSV displays multiple shifts of paleoinclination during the Holocene (e.g., Creer, 1981; Turner and Thompson, 1981; Gogorza et al., 2011), with swings of up to 15°–30° in 1 k.y. (Creer, 1981; Daly and Le Goff, 1996; Lund et al., 2005). Some records suggest that inclination changes can be very rapid, e.g., 6° over a 50 yr span (Gogorza et al., 2011). In the past 5 k.y., sediment records often show 4–6 swings >10° (Creer, 1981). Inclinations in sediment records can remain stable for a time, but it is rare to fi nd periods >500–1000 yr in which the fi eld changes <5° (Lund et al., 2005).
It is diffi cult to estimate the exact timing represented by a particular change in inclination between lava fl ows. In part this is because we do not have a record of Jurassic PSV and do not know the eruption rate of the Shatsky Rise lava fl ows. Estimat-ing the time gap is also diffi cult because the rate of PSV is vari-able, so a given time span may produce a change in paleoin-clination that can be large or small. Moreover, because PSV is quasi-periodic, oscillating around an average for any given site, even a long time period between paleomagnetic samples may not produce a large change in the paleomagnetic direction. To gain an idea of the time span implied by a given change in paleo-inclination, we used a global model of the Holocene magnetic fi eld (Cals10k, covering the past 10 k.y.; Korte et al., 2011) to estimate PSV. A PSV record was generated for an equatorial site (because the Shatsky Rise was near the equator) and a Monte Carlo routine was used to select two paleoinclination values with a given age interval (Fig. 13). With 1000 trials for each assumed age interval (from 25 to 1000 yr), the angles that encompassed 50% and 95% of the estimates were calculated. As expected, larger age intervals are refl ected by larger angular separations on average. The angle encompassing 95% of the estimates climbs rapidly for intervals <~800 yr (Fig. 13). For a 100 yr period, the 95% angle is ~4°, for 200 yr, it is ~7°, and for 300 yr, it is ~10°. This angle becomes slightly smaller at intervals >800 yr, likely because of the limited angular deviation of PSV and the limited time span of the PSV model.
In general, the difference in mean paleoinclination between magnetic groups at the Shatsky Rise sites is small. Of all the Shatsky Rise igneous sites, Site 1213 shows the least variation. Although the individual sample data show considerable scatter, none of the fl ows in this 47 m section is statistically distinct, so they appear to record the same paleoinclination. Sites U1346 and U1349 both have only two distinct groups with colatitude aver-ages 1.8° and 4.9° apart, respectively (inclination averages are 3.2° and 9.3° apart). The PSV model implies that the interval between lava fl ows is likely <100 yr for Site U1346 and <200 yr for Site U1349. Based on changes in paleocolatitude only, we would have divided Site U1347 into two groups (group 1 and groups 2–5), but radiometric age data imply that there is likely
on April 20, 2015specialpapers.gsapubs.orgDownloaded from

164 Sager et al.
a time gap between groups 2–3 and 4–5 (Heaton and Koppers, 2014). Between groups 1 and 2 the colatitude shifts by 10.1° (paleoinclination by 19.5°). The PSV model does not show an inclination change >17° in our 1000 yr analysis (Fig. 13), imply-ing that the interval between these groups is at least this large. Given that radiometric age data show signifi cant time gaps, the age difference between groups 1 and 2 may be larger. Groups 2–5 all have similar averages, with only 2.7°–4.9° of colatitude (5.1°–9.4° of inclination) separating their means. Given the possible age gap between the upper and lower massive fl ows, this unifor-mity may be an artifact of the quasi-periodic nature of PSV. The Holocene PSV model implies that the small changes between groups 2–3 (4.0°) and 4–5 (4.9°) likely represent <200 yr.
Site U1350 is unlike the other sites. Both the top ~40 m and bottom ~50 m of the section show consistent colatitudes, imply-ing rapid lava accumulation, but the middle section, between ~190 and 270 m, shows large systematic variations with the appearance of PSV. Differences between magnetic groups in this middle sec-tion are typically 6°–7° in colatitude (12°–13° inclination) with an overall colatitude range of ~15° (78.2°–94.3°) and inclination range of ~31° (−8.6° to 22.7°). Even with the observed variation, the between-group colatitude standard error is only ~4.9°, which is less than the expected 9.0° from a PSV model (Harrison, 1980; from Cox and Gordon, 1984). These observations imply that the time spanned by these lava fl ows is ~103 yr, but probably not ~104–105 yr, which would average PSV completely and record
the full range of inclination variation. Supporting this interpreta-tion, the progression of paleocolatitudes in groups 2–10 displays serial correlation. Paleocolatitude trends progressively higher in groups 2–4, lower in groups 5–6, higher in groups 7–8, and lower in groups 9–10. Although we cannot say with certainty that there is no jump in time that skips over one or more PSV cycles, the U1350 curve displays no abrupt jump in the colatitude of these groups that would imply a large time gap.
We conclude that the Shatsky Rise lava fl ow sections mostly built rapidly, with sections of ~50–70 m thickness accumulat-ing in periods of ~100–200 yr. This is similar to fi ndings from the Deccan Traps large igneous province, where single eruptive events can be 40–180 m thick with very little change in paleo-inclination (Chenet et al., 2008). Two Shatsky Rise sections indicate greater lapses of time in slightly different situations: periods of accumulation that were slow but relatively continu-ous, and long time gaps at the end of volcano formation. Site U1350 demonstrates the fi rst situation with a section of ~80 m in which several PSV cycles occur sandwiched between two rapidly emplaced sections. Site U1350 thus implies pulses of greater and lesser lava output. Similar observations are made on Hawaiian volcanoes where fl ank eruptions often occur in pulses, some-times with slow accumulation in between (Sharp et al., 1996; Stolper et al., 2009). The second situation occurred at the sum-mit of the Tamu massif, where radiometric dating indicates that the fi nal eruptions were emplaced after a long interval between
TABLE 5. MAGNETIC GROUP AVERAGE COLATITUDES AND SITE AVERAGE COLATITUDES
IODP site Group Depth (mbsf)
Mean colatitude (°)
Colatitude error (°)
Inc. (°) N
Colatitude 95% confidence
U1346 1 139.73–174.36 100.6 2.6 –20.5 18 U1346 2 177.54–188.85 102.4 2.5 –23.7 8 Average 100.3 10.0 1 +20.7°/–20.1°
U1347 1 159.9–161.75 89.8 3.7 0.4 7 U1347 2 167.07–200.74 79.7 2.5 19.9 12 U1347 3 206.37–237.03 83.7 3.8 12.5 18 U1347 4 245.21–274.70 81.0 5.7 17.6 17 U1347 5 275.45–316.01 85.9 4.9 8.2 21 Average 84.8 6.5 10.3 3 +13.0°/–13.2°
U1349 1 165.12–206.99 91.3 2.2 –3.0 19 U1349 2 215.25–243.75 96.2 5.5 –12.3 12 Average 93.7 10.0 –7.4 1 +20.4°/–20.3°
U1350 1 153.13–183.79 90.2 2.8 –0.4 18 U1350 2 191.18–191.6 78.2 3.5 22.7 2 U1350 3 197.88–206.03 89.6 2.1 0.8 5 U1350 4 210.65–213.01 91.8 0.9 –3.6 4 U1350 5 221.28–223.52 85.9 4.1 8.2 4 U1350 6 230.22–233.04 80.2 4.3 19.1 5 U1350 7 239.78–242.33 87.4 5.0 5.2 4 U1350 8 249.35–251.44 94.3 1.4 –8.6 5 U1350 9 258.53–260.47 87.6 1.6 4.8 3 U1350 10 261.15–261.87 81.6 1.2 16.4 3 U1350 11 268.47–279.31 89.1 0.9 1.8 8 U1350 12 281.43–289.85 93.0 1.5 –6.0 7 U1350 13 296.94–308.07 92.1 2.7 –4.2 16 U1350 14 310.54–315.72 89.6 1.7 0.8 5 Average
86.7 3.6 6.6 10 +7.2°/–7.3°
Note: IODP—Integrated Ocean Drilling Program; Group—colatitude group; mbsf—meters below seafloor; Mean colatitude of group assumes normal polarity; Colatitude error—symmetric standard error for mean colatitude; Inc.—inclination corresponding to mean colatitude (assuming normal polarity); N—number of samples used to determine mean.
on April 20, 2015specialpapers.gsapubs.orgDownloaded from

Paleomagnetism of igneous rocks from the Shatsky Rise 165
155
165
175
185
195
205
215
225
235
245
255
265
275
285
295
305
315
325
10 20 30 40 50 60 70 80 90 100
Dep
th (
mbs
f)
Colatitude (°)U1347A
Colatitude
M ean colatitude
Rejected colatitude
Standard deviation
1
2
3
4
5
Figure 10. Colatitude versus depth (meters below seafl oor, mbsf) data for Integrated Ocean Drilling Program Expedition Site U1347. Gray diamonds are colatitudes that were considered outliers (and not used for calculation of the group means; see text for discussion). Plot con-ventions as in Figure 9.
160
170
180
190
200
210
220
230
240
250
60 70 80 90 100 110 120 130 140 150
Dep
th (
mbs
f)
Colatitude (°)U1349A
Colatitude
Rejected colatitude
Mean colatitude
Standard deviation
1
2
Figure 11. Colatitude versus depth (meters below seafl oor, mbsf) data for Integrated Ocean Drilling Program Expedition Site U1349. Plot conventions as in Figures 9 and 10.
on April 20, 2015specialpapers.gsapubs.orgDownloaded from
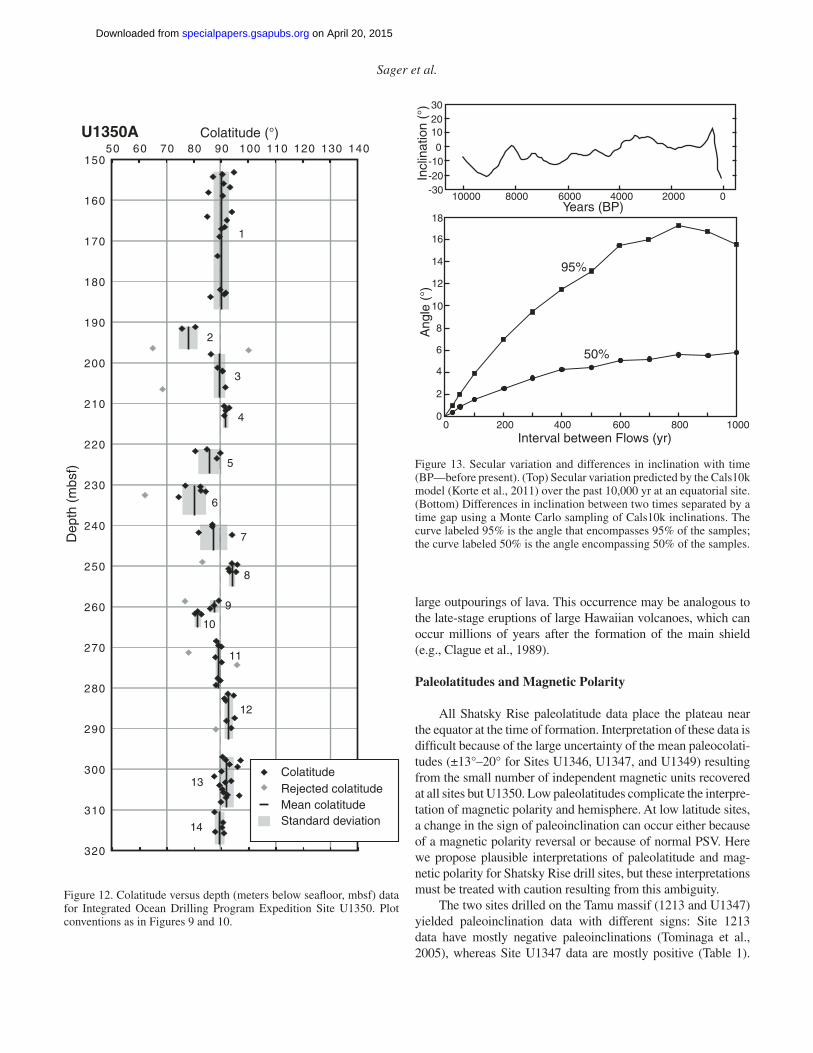
166 Sager et al.
150
160
170
180
190
200
210
220
230
240
250
260
270
280
290
300
310
320
50 60 70 80 90 100 110 120 130 140
Dep
th (
mbs
f)
Colatitude (°)U1350A
Standard deviation
ColatitudeRejected colatitudeMean colatitude
1
2
3
4
5
6
7
8
9
10
11
12
13
14
Figure 12. Colatitude versus depth (meters below seafl oor, mbsf) data for Integrated Ocean Drilling Program Expedition Site U1350. Plot conventions as in Figures 9 and 10.
Figure 13. Secular variation and differences in inclination with time (BP—before present). (Top) Secular variation predicted by the Cals10k model (Korte et al., 2011) over the past 10,000 yr at an equatorial site. (Bottom) Differences in inclination between two times separated by a time gap using a Monte Carlo sampling of Cals10k inclinations. The curve labeled 95% is the angle that encompasses 95% of the samples; the curve labeled 50% is the angle encompassing 50% of the samples.
0
2
4
6
8
10
12
14
16
18
Ang
le (
°)0 600200 400 800 1000
Interval between Flows (yr)
302010
0-10-20-30
0200040006000800010000Years (BP)
95%
50%
Incl
inat
ion
(°)
large outpourings of lava. This occurrence may be analogous to the late-stage eruptions of large Hawaiian volcanoes, which can occur millions of years after the formation of the main shield (e.g., Clague et al., 1989).
Paleolatitudes and Magnetic Polarity
All Shatsky Rise paleolatitude data place the plateau near the equator at the time of formation. Interpretation of these data is diffi cult because of the large uncertainty of the mean paleocolati-tudes (±13°–20° for Sites U1346, U1347, and U1349) resulting from the small number of independent magnetic units recovered at all sites but U1350. Low paleolatitudes complicate the interpre-tation of magnetic polarity and hemisphere. At low latitude sites, a change in the sign of paleoinclination can occur either because of a magnetic polarity reversal or because of normal PSV. Here we propose plausible interpretations of paleolatitude and mag-netic polarity for Shatsky Rise drill sites, but these interpretations must be treated with caution resulting from this ambiguity.
The two sites drilled on the Tamu massif (1213 and U1347) yielded paleoinclination data with different signs: Site 1213 data have mostly negative paleoinclinations (Tominaga et al., 2005), whereas Site U1347 data are mostly positive (Table 1).
on April 20, 2015specialpapers.gsapubs.orgDownloaded from

Paleomagnetism of igneous rocks from the Shatsky Rise 167
One interpretation of this difference is that the two sites display different magnetic polarities. However, an alternative is that the Shatsky Rise drifted across the equator, and one site was emplaced in the Southern Hemisphere (negative inclination for normal polarity) and the other in the Northern Hemisphere (posi-tive inclination for normal polarity). Moreover, another possibil-ity is that the change in paleoinclination sign occurred by PSV. The change of paleoinclination average from −9.3° (Site 1213) to +10.3° (Site U1347) is within the plausible range of PSV if the site were at the equator. Without magnetic declination data or some way to determine magnetic polarity, we cannot be certain which one of these possibilities is correct.
Magnetic wireline logs were interpreted to give both mag-netic polarity and hemisphere of magnetization for Site U1347 in Tominaga et al. (2012), and it was concluded that the lower part of the Site U1347 section (below ~260 mbsf) is normally polar-ized but formed in the Southern Hemisphere and the upper part of the section is also normally polarized but formed in the North-ern Hemisphere after a gap of millions of years, during which
the Tamu massif drifted across the equator. This interpretation is based on an observed change in sign of the vertical component of the anomalous magnetic fi eld at ~260 mbsf. If this interpretation is correct, we should see a change in sign of the paleoinclinations in cores from Site U1347. Samples from the lower massive fl ows were the least reliable and showed the greatest scatter of all Expe-dition 324 samples; nevertheless, Figure 10 shows that there are apparently reliable measurements from these fl ows, and there is no change in sign at the bottom of this section. Moreover, radio-metric ages from the lower part of the section are ca. 144–142 Ma (Heaton and Koppers, 2014), so there is no evidence of a large age gap at ~260 mbsf consistent with drifting across the equator. The interpretation that the upper section is normally polarized in the Northern Hemisphere is plausible and predicts a normal polarity colatitude arc that matches closely to the 145 Ma paleo-magnetic pole (Fig. 14). Although it is possible that the Site 1213 data were magnetized with the same polarity, but have opposite signs from Site U1347 data owing to PSV, the Site 1213 data give a nearly identical paleocolatitude arc to that from Site U1347 if
270°
300°
330°
30°
60°
0°
60°
145
123
11292
80
6861 49
39
30
N
R
U1346
270°
300°
330°
30°
60°
0°
60°
145
123
11292
80
6861 49
39
30
N
R
U1349 270°
300°
330°
30°
60°
0°
60°
145
123
11292
80
6861 49
39
30
N
R
U1350
270°
300°
330°
30°
60°
0°
60°
145
123
11292
80
6861 49
39
30
N
R
U1347
Figure 14. Mean colatitude arcs for Shatsky Rise sites compared to Pacifi c plate paleomagnetic poles. Pacifi c plate paleomagnetic poles (Sager, 2006; Beaman et al., 2007) are shown as small, fi lled circles. Gray ellipses show 95% confi dence regions for the poles. Numbers in italics are mean ages for the poles (in Ma). Thick arcs labeled N and R show the mean colatitude for each Shatsky Rise site assuming normal and reversed polarity, respectively.
on April 20, 2015specialpapers.gsapubs.orgDownloaded from
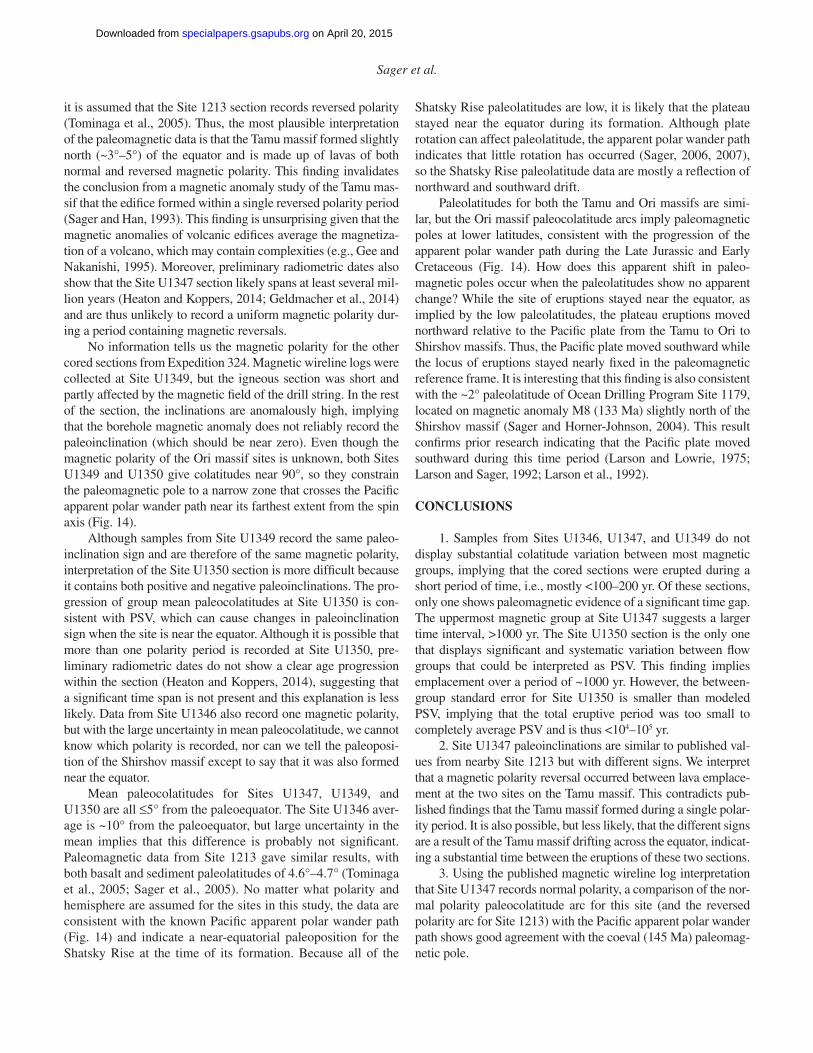
168 Sager et al.
it is assumed that the Site 1213 section records reversed polarity (Tominaga et al., 2005). Thus, the most plausible interpretation of the paleomagnetic data is that the Tamu massif formed slightly north (~3°–5°) of the equator and is made up of lavas of both normal and reversed magnetic polarity. This fi nding invalidates the conclusion from a magnetic anomaly study of the Tamu mas-sif that the edifi ce formed within a single reversed polarity period (Sager and Han, 1993). This fi nding is unsurprising given that the magnetic anomalies of volcanic edifi ces average the magnetiza-tion of a volcano, which may contain complexities (e.g., Gee and Nakanishi, 1995). Moreover, preliminary radiometric dates also show that the Site U1347 section likely spans at least several mil-lion years (Heaton and Koppers, 2014; Geldmacher et al., 2014) and are thus unlikely to record a uniform magnetic polarity dur-ing a period containing magnetic reversals.
No information tells us the magnetic polarity for the other cored sections from Expedition 324. Magnetic wireline logs were collected at Site U1349, but the igneous section was short and partly affected by the magnetic fi eld of the drill string. In the rest of the section, the inclinations are anomalously high, implying that the borehole magnetic anomaly does not reliably record the paleoinclination (which should be near zero). Even though the magnetic polarity of the Ori massif sites is unknown, both Sites U1349 and U1350 give colatitudes near 90°, so they constrain the paleomagnetic pole to a narrow zone that crosses the Pacifi c apparent polar wander path near its farthest extent from the spin axis (Fig. 14).
Although samples from Site U1349 record the same paleo-inclination sign and are therefore of the same magnetic polarity, interpretation of the Site U1350 section is more diffi cult because it contains both positive and negative paleoinclinations. The pro-gression of group mean paleocolatitudes at Site U1350 is con-sistent with PSV, which can cause changes in paleoinclination sign when the site is near the equator. Although it is possible that more than one polarity period is recorded at Site U1350, pre-liminary radiometric dates do not show a clear age progression within the section (Heaton and Koppers, 2014), suggesting that a signifi cant time span is not present and this explanation is less likely. Data from Site U1346 also record one magnetic polarity, but with the large uncertainty in mean paleocolatitude, we cannot know which polarity is recorded, nor can we tell the paleoposi-tion of the Shirshov massif except to say that it was also formed near the equator.
Mean paleocolatitudes for Sites U1347, U1349, and U1350 are all ≤5° from the paleoequator. The Site U1346 aver-age is ~10° from the paleoequator, but large uncertainty in the mean implies that this difference is probably not signifi cant. Paleomagnetic data from Site 1213 gave similar results, with both basalt and sediment paleolatitudes of 4.6°–4.7° (Tominaga et al., 2005; Sager et al., 2005). No matter what polarity and hemisphere are assumed for the sites in this study, the data are consistent with the known Pacifi c apparent polar wander path (Fig. 14) and indicate a near-equatorial paleoposition for the Shatsky Rise at the time of its formation. Because all of the
Shatsky Rise paleolatitudes are low, it is likely that the plateau stayed near the equator during its formation. Although plate rotation can affect paleolatitude, the apparent polar wander path indicates that little rotation has occurred (Sager, 2006, 2007), so the Shatsky Rise paleolatitude data are mostly a refl ection of northward and southward drift.
Paleolatitudes for both the Tamu and Ori massifs are simi-lar, but the Ori massif paleocolatitude arcs imply paleomagnetic poles at lower latitudes, consistent with the progression of the apparent polar wander path during the Late Jurassic and Early Cretaceous (Fig. 14). How does this apparent shift in paleo-magnetic poles occur when the paleolatitudes show no apparent change? While the site of eruptions stayed near the equator, as implied by the low paleolatitudes, the plateau eruptions moved northward relative to the Pacifi c plate from the Tamu to Ori to Shirshov massifs. Thus, the Pacifi c plate moved southward while the locus of eruptions stayed nearly fi xed in the paleomagnetic reference frame. It is interesting that this fi nding is also consistent with the ~2° paleolatitude of Ocean Drilling Program Site 1179, located on magnetic anomaly M8 (133 Ma) slightly north of the Shirshov massif (Sager and Horner-Johnson, 2004). This result confi rms prior research indicating that the Pacifi c plate moved southward during this time period (Larson and Lowrie, 1975; Larson and Sager, 1992; Larson et al., 1992).
CONCLUSIONS
1. Samples from Sites U1346, U1347, and U1349 do not display substantial colatitude variation between most magnetic groups, implying that the cored sections were erupted during a short period of time, i.e., mostly <100–200 yr. Of these sections, only one shows paleomagnetic evidence of a signifi cant time gap. The uppermost magnetic group at Site U1347 suggests a larger time interval, >1000 yr. The Site U1350 section is the only one that displays signifi cant and systematic variation between fl ow groups that could be interpreted as PSV. This fi nding implies emplacement over a period of ~1000 yr. However, the between-group standard error for Site U1350 is smaller than modeled PSV, implying that the total eruptive period was too small to completely average PSV and is thus <104–105 yr.
2. Site U1347 paleoinclinations are similar to published val-ues from nearby Site 1213 but with different signs. We interpret that a magnetic polarity reversal occurred between lava emplace-ment at the two sites on the Tamu massif. This contradicts pub-lished fi ndings that the Tamu massif formed during a single polar-ity period. It is also possible, but less likely, that the different signs are a result of the Tamu massif drifting across the equator, indicat-ing a substantial time between the eruptions of these two sections.
3. Using the published magnetic wireline log interpretation that Site U1347 records normal polarity, a comparison of the nor-mal polarity paleocolatitude arc for this site (and the reversed polarity arc for Site 1213) with the Pacifi c apparent polar wander path shows good agreement with the coeval (145 Ma) paleomag-netic pole.
on April 20, 2015specialpapers.gsapubs.orgDownloaded from

Paleomagnetism of igneous rocks from the Shatsky Rise 169
4. All sites give paleolatitudes near the equator, with values ≤5° for Sites U1347, U1349, and U1350. Together with an ~2° paleolatitude for nearby Site 1179, these data indicate that the Shatsky Rise stayed near the equator during its entire forma-tion. Given that the locus of volcanism moved northward rela-tive to the Pacifi c plate, we conclude that the Pacifi c plate moved southward during Shatsky Rise formation, consistent with plate motion inferred from the apparent polar wander path.
ACKNOWLEDGMENTS
Funding for this study came partly from a grant awarded by the U.S. Science Support Program for Expedition 324 research. Additional support for Sager and Pueringer was provided by the Jane and R. Ken Williams ’45 Chair for Ocean Drilling Science, Education, and Technology at Texas A&M University. This study would not have been possible without the Integrated Ocean Drill-ing Program (IODP), as well as the dedicated technical staff, scientists, and crew on board the D/V JOIDES Resolution. This research used samples and data provided by the IODP, which is sponsored by the U.S. National Science Foundation and partici-pating countries under management by IODP Management Inter-national. The authors thank two anonymous reviewers for many helpful suggestions that improved the manuscript.
REFERENCES CITED
Arason, P., and Levi, S., 2010, Maximum likelihood solution for inclination-only data in paleomagnetism: Geophysical Journal International, v. 182, p. 753–771, doi:10.1111/j.1365-246X.2010.04671.x.
Audunsson, H., and Levi, S., 1989, Drilling-induced remanent magnetization in basalt drill cores: Geophysical Journal International, v. 98, p. 613–622, doi:10.1111/j.1365-246X.1989.tb02294.x.
Beaman, M., Sager, W.W., Acton, G.D., Lanci, L., and Peres, J., 2007, Improved Late Cretaceous and early Cenozoic paleomagnetic apparent polar wan-der path for the Pacifi c plate: Earth and Planetary Science Letters, v. 262, p. 1–20, doi:10.1016/j.epsl.2007.05.036.
Bleil, U., 1985, The magnetostratigraphy of northwest Pacifi c sediments, Deep Sea Drilling Project Leg 86, in Heath, G.R., Burckle, L.H., et al., Ini-tial Reports of the Deep Sea Drilling Project, Volume 86: Washington, D.C., U.S. Government Printing Offi ce, p. 441–458, doi:10.2973/dsdp.proc.86.117.1985.
Briden, J.C., and Ward, M.A., 1966, Analysis of magnetic inclinations in borecores: Pure and Applied Geophysics, v. 63, p. 133–152, doi:10.1007/BF00875164.
Butler, R.F., 1992, Paleomagnetism: Magnetic Domains to Geologic Terranes: Oxford, UK, Blackwell Scientifi c Publications, 399 p.
Carvallo, C., 2014, Data report: Hysteresis measurements on basalts from Holes U1346A, U1347A, and U1350A on Shatsky Rise, in Sager, W.W., Sano, T., Geldmacher, J., et al., Proceedings of the Integrated Ocean Drilling Program, Volume 324: Tokyo, Integrated Ocean Drilling Program Man-agement International, Inc., doi:10.2204/iodp.proc.324.205.2014.
Carvallo, C., and Camps, P., 2013, Data report: Magnetic properties of basalts from Shatsky Rise, in Sager, W.W., Sano, T., Geldmacher, J., et al., Pro-ceedings of the Integrated Ocean Drilling Program, Volume 324: Tokyo, Integrated Ocean Drilling Program Management International, Inc., doi:10.2204/iodp.proc.324.201.2013.
Carvallo, C., Camps, P., Ooga, M., Fanjat, G., and Sager, W.W., 2013, Pal-aeointensity determinations and rock magnetic properties on basalts from Shatsky Rise: New evidence for a Mesozoic dipole low: Geophysical Journal International, v. 192, p. 986–999, doi:10.1093/gji/ggs100.
Chenet, A.L., Fluteau, F., Courtillot, V., Gérard, M., and Subbarao, K.V., 2008, Determination of rapid Deccan eruptions across the Cretaceous-
Tertiary boundary using paleomagnetic secular variation: Results from a 1200-m-thick section in the Mahabaleshwar escarpment: Journal of Geo-physical Research, v. 113, B04101, doi:10.1029/2006JB004635.
Clague, D.A., Dalrymple, G.B., Wright, T.L., Klein, F.W., Koyanagi, R.Y., Decker, R.W., and Thomas, D.M., 1989, The Hawaiian-Emperor Chain, in Winterer, E.L., Hussong, D.M., and Decker, R.W., eds., The Eastern Pacifi c and Hawaii: Boulder, Colorado, Geological Society of America, The Geology of North America, v. N, p. 187–237.
Coffi n, M.F., and Eldholm, O., 1994, Large igneous provinces: Crustal struc-ture, dimensions, and external consequences: Reviews of Geophysics, v. 32, p. 1–36, doi:10.1029/93RG02508.
Cox, A., and Gordon, R.G., 1984, Paleolatitudes determined from paleomag-netic data from vertical cores: Reviews of Geophysics, v. 22, p. 47–72, doi:10.1029/RG022i001p00047.
Creer, K.M., 1981, Long-period geomagnetic secular variations since 12,000 yr B.P: Nature, v. 292, p. 208–212, doi:10.1038/292208a0.
Daly, L., and LeGoff, M., 1996, An updated and homogeneous world secular variation database: I. Smoothing of the archeomagnetic results: Physics of the Earth and Planetary Interiors, v. 93, p. 159–190, doi:10.1016/0031-9201(95)03075-1.
Day, R., Fuller, M., and Schmidt, V.A., 1977, Hysteresis properties of titanomagnetites: Grain-size and compositional dependence: Physics of the Earth and Planetary Interiors, v. 13, p. 260–267, doi:10.1016/0031-9201(77)90108-X.
Doubrovine, P.V., and Tarduno, J.A., 2004, Self-reversed magnetization carried by titanomaghemite in ocean basalts: Earth and Planetary Science Letters, v. 222, p. 959–969, doi:10.1016/j.epsl.2004.04.009.
Doubrovine, P.V., and Tardnuno, J.A., 2005, On the compositional fi eld of self-reversing titanomaghemite: Constraints from Deep Sea Drilling Project Site 307: Journal of Geophysical Research, v. 110, B11104, doi:10.1029/2005JB003865.
Duncan, R.A., and Richards, M.A., 1991, Hotspots, mantle plumes, fl ood basalts and true polar wander: Reviews of Geophysics, v. 29, p. 31–50, doi:10.1029/90RG02372.
Dunlop, D.J., 2002a, Theory and application of the Day plot (Mrs/Mr ver-sus Hcr/Hc) 1. Theoretical curves and tests using titanomagnetite data: Journal of Geophysical Research, v. 107, p. EPM 4-1–EPM 4-22, doi:10.1029/2001JB000486.
Dunlop, D.J., 2002b, Theory and application of the Day plot (Mrs/Mr ver-sus Hcr/Hc) 2. Application to data for rocks, sediments, and soils: Journal of Geophysical Research, v. 107, p. EPM 5-1–EPM 5-15, doi:10.1029/2001JB000487.
Dunlop, D.J., and Özdemir, O., 2007, Magnetizations in rocks and minerals, in Kono, M., ed., Geomagnetism: Treatise on Geophysics, Volume 5: Amsterdam, Elsevier, p. 277–336.
Evans, H.F., Channell, J.E.T., and Sager, W.W., 2005, Late Miocene– Holocene magnetic polarity stratigraphy and astrochronology, ODP Leg 198, Shatsky Rise, in Bralower, T.J., Premoli Silva, I., Malone, M.J., et al., Pro-ceedings of the Ocean Drilling Program, Scientifi c Results, Volume 198: College Station, Texas, Ocean Drilling Program, p. 1–39, doi:10.2973/odp.proc.sr.198.118.2005.
Foulger, G.R., 2007, The “plate” model for the genesis of melting anomalies, in Foulger, G.R., and Jurdy, D.M., eds., Plates, Plumes, and Planetary Processes: Geological Society of America Special Paper 430, p. 1–28, doi:10.1130/2007.2430(01).
Gee, J., and Nakanishi, M., 1995, Magnetic petrology and magnetic properties of western Pacifi c guyots: Implications for seamount paleopoles, in Haggerty, J.A., Premoli Silva, I., Rack, F.R., et al., Proceedings of the Ocean Drilling Program, Scientifi c Results, Volume 144: College Station, Texas, Ocean Drill-ing Program, p. 615–630, doi:10.2973/odp.proc.sr.144.020.1995.
Geldmacher, J., van den Bogaard, P., Heydolph, K., and Hoernle, K., 2014, The age of the Earth’s largest volcano: Tamu Massif on Shatsky Rise (northwest Pacifi c Ocean): International Journal of Earth Sciences, v. 103, p. 2351–2357, doi:10.1007/s00531-014-1078-6.
Gogorza, C.S., Sinito, A.M., Ohlendorf, C., Kastner, S., and Zolitschka, B., 2011, Paleosecular variation and paleointensity records for the last mil-lennium from southern South America (Laguna Potrok Aike, Santa Cruz, Argentina): Physics of the Earth and Planetary Interiors, v. 184, p. 41–50, doi:10.1016/j.pepi.2010.10.011.
Harrison, C.G.A., 1980, Secular variation and excursions of the Earth’s magnetic fi eld: Journal of Geophysical Research, v. 85, p. 3511–3522, doi:10.1029/JB085iB07p03511.
on April 20, 2015specialpapers.gsapubs.orgDownloaded from
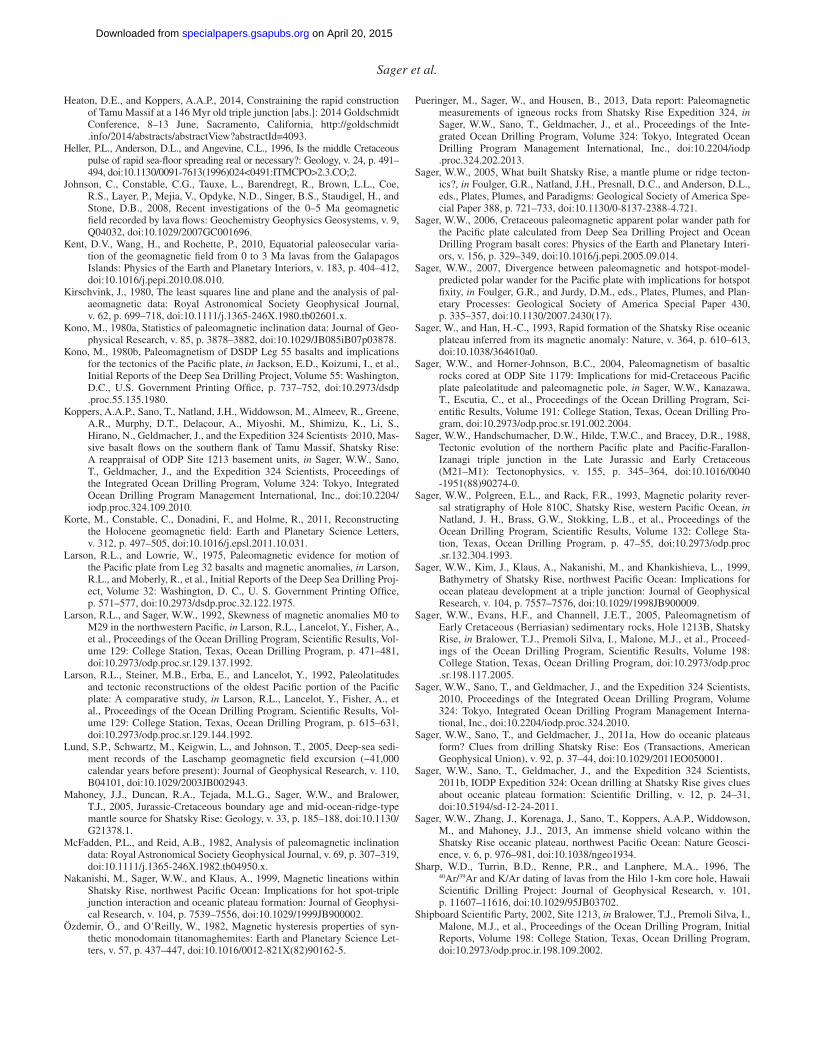
170 Sager et al.
Heaton, D.E., and Koppers, A.A.P., 2014, Constraining the rapid construction of Tamu Massif at a 146 Myr old triple junction [abs.]: 2014 Goldschmidt Conference, 8–13 June, Sacramento, California, http://goldschmidt.info/2014/abstracts/abstractView?abstractId=4093.
Heller, P.L., Anderson, D.L., and Angevine, C.L., 1996, Is the middle Cretaceous pulse of rapid sea-fl oor spreading real or necessary?: Geology, v. 24, p. 491–494, doi:10.1130/0091-7613(1996)024<0491:ITMCPO>2.3.CO;2.
Johnson, C., Constable, C.G., Tauxe, L., Barendregt, R., Brown, L.L., Coe, R.S., Layer, P., Mejia, V., Opdyke, N.D., Singer, B.S., Staudigel, H., and Stone, D.B., 2008, Recent investigations of the 0–5 Ma geomagnetic fi eld recorded by lava fl ows: Geochemistry Geophysics Geosystems, v. 9, Q04032, doi:10.1029/2007GC001696.
Kent, D.V., Wang, H., and Rochette, P., 2010, Equatorial paleosecular varia-tion of the geomagnetic fi eld from 0 to 3 Ma lavas from the Galapagos Islands: Physics of the Earth and Planetary Interiors, v. 183, p. 404–412, doi:10.1016/j.pepi.2010.08.010.
Kirschvink, J., 1980, The least squares line and plane and the analysis of pal-aeomagnetic data: Royal Astronomical Society Geophysical Journal, v. 62, p. 699–718, doi:10.1111/j.1365-246X.1980.tb02601.x.
Kono, M., 1980a, Statistics of paleomagnetic inclination data: Journal of Geo-physical Research, v. 85, p. 3878–3882, doi:10.1029/JB085iB07p03878.
Kono, M., 1980b, Paleomagnetism of DSDP Leg 55 basalts and implications for the tectonics of the Pacifi c plate, in Jackson, E.D., Koizumi, I., et al., Initial Reports of the Deep Sea Drilling Project, Volume 55: Washington, D.C., U.S. Government Printing Offi ce, p. 737–752, doi:10.2973/dsdp.proc.55.135.1980.
Koppers, A.A.P., Sano, T., Natland, J.H., Widdowson, M., Almeev, R., Greene, A.R., Murphy, D.T., Delacour, A., Miyoshi, M., Shimizu, K., Li, S., Hirano, N., Geldmacher, J., and the Expedition 324 Scientists, 2010, Mas-sive basalt fl ows on the southern fl ank of Tamu Massif, Shatsky Rise: A reappraisal of ODP Site 1213 basement units, in Sager, W.W., Sano, T., Geldmacher, J., and the Expedition 324 Scientists, Proceedings of the Integrated Ocean Drilling Program, Volume 324: Tokyo, Integrated Ocean Drilling Program Management International, Inc., doi:10.2204/iodp.proc.324.109.2010.
Korte, M., Constable, C., Donadini, F., and Holme, R., 2011, Reconstructing the Holocene geomagnetic fi eld: Earth and Planetary Science Letters, v. 312, p. 497–505, doi:10.1016/j.epsl.2011.10.031.
Larson, R.L., and Lowrie, W., 1975, Paleomagnetic evidence for motion of the Pacifi c plate from Leg 32 basalts and magnetic anomalies, in Larson, R.L., and Moberly, R., et al., Initial Reports of the Deep Sea Drilling Proj-ect, Volume 32: Washington, D. C., U. S. Government Printing Offi ce, p. 571–577, doi:10.2973/dsdp.proc.32.122.1975.
Larson, R.L., and Sager, W.W., 1992, Skewness of magnetic anomalies M0 to M29 in the northwestern Pacifi c, in Larson, R.L., Lancelot, Y., Fisher, A., et al., Proceedings of the Ocean Drilling Program, Scientifi c Results, Vol-ume 129: College Station, Texas, Ocean Drilling Program, p. 471–481, doi:10.2973/odp.proc.sr.129.137.1992.
Larson, R.L., Steiner, M.B., Erba, E., and Lancelot, Y., 1992, Paleolatitudes and tectonic reconstructions of the oldest Pacifi c portion of the Pacifi c plate: A comparative study, in Larson, R.L., Lancelot, Y., Fisher, A., et al., Proceedings of the Ocean Drilling Program, Scientifi c Results, Vol-ume 129: College Station, Texas, Ocean Drilling Program, p. 615–631, doi:10.2973/odp.proc.sr.129.144.1992.
Lund, S.P., Schwartz, M., Keigwin, L., and Johnson, T., 2005, Deep-sea sedi-ment records of the Laschamp geomagnetic fi eld excursion (~41,000 calendar years before present): Journal of Geophysical Research, v. 110, B04101, doi:10.1029/2003JB002943.
Mahoney, J.J., Duncan, R.A., Tejada, M.L.G., Sager, W.W., and Bralower, T.J., 2005, Jurassic-Cretaceous boundary age and mid-ocean-ridge-type mantle source for Shatsky Rise: Geology, v. 33, p. 185–188, doi:10.1130/G21378.1.
McFadden, P.L., and Reid, A.B., 1982, Analysis of paleomagnetic inclination data: Royal Astronomical Society Geophysical Journal, v. 69, p. 307–319, doi:10.1111/j.1365-246X.1982.tb04950.x.
Nakanishi, M., Sager, W.W., and Klaus, A., 1999, Magnetic lineations within Shatsky Rise, northwest Pacifi c Ocean: Implications for hot spot-triple junction interaction and oceanic plateau formation: Journal of Geophysi-cal Research, v. 104, p. 7539–7556, doi:10.1029/1999JB900002.
Özdemir, Ö., and O’Reilly, W., 1982, Magnetic hysteresis properties of syn-thetic monodomain titanomaghemites: Earth and Planetary Science Let-ters, v. 57, p. 437–447, doi:10.1016/0012-821X(82)90162-5.
Pueringer, M., Sager, W., and Housen, B., 2013, Data report: Paleomagnetic measurements of igneous rocks from Shatsky Rise Expedition 324, in Sager, W.W., Sano, T., Geldmacher, J., et al., Proceedings of the Inte-grated Ocean Drilling Program, Volume 324: Tokyo, Integrated Ocean Drilling Program Management International, Inc., doi:10.2204/iodp.proc.324.202.2013.
Sager, W.W., 2005, What built Shatsky Rise, a mantle plume or ridge tecton-ics?, in Foulger, G.R., Natland, J.H., Presnall, D.C., and Anderson, D.L., eds., Plates, Plumes, and Paradigms: Geological Society of America Spe-cial Paper 388, p. 721–733, doi:10.1130/0-8137-2388-4.721.
Sager, W.W., 2006, Cretaceous paleomagnetic apparent polar wander path for the Pacifi c plate calculated from Deep Sea Drilling Project and Ocean Drilling Program basalt cores: Physics of the Earth and Planetary Interi-ors, v. 156, p. 329–349, doi:10.1016/j.pepi.2005.09.014.
Sager, W.W., 2007, Divergence between paleomagnetic and hotspot-model- predicted polar wander for the Pacifi c plate with implications for hotspot fi xity, in Foulger, G.R., and Jurdy, D.M., eds., Plates, Plumes, and Plan-etary Processes: Geological Society of America Special Paper 430, p. 335–357, doi:10.1130/2007.2430(17).
Sager, W., and Han, H.-C., 1993, Rapid formation of the Shatsky Rise oceanic plateau inferred from its magnetic anomaly: Nature, v. 364, p. 610–613, doi:10.1038/364610a0.
Sager, W.W., and Horner-Johnson, B.C., 2004, Paleomagnetism of basaltic rocks cored at ODP Site 1179: Implications for mid-Cretaceous Pacifi c plate paleolatitude and paleomagnetic pole, in Sager, W.W., Kanazawa, T., Escutia, C., et al., Proceedings of the Ocean Drilling Program, Sci-entifi c Results, Volume 191: College Station, Texas, Ocean Drilling Pro-gram, doi:10.2973/odp.proc.sr.191.002.2004.
Sager, W.W., Handschumacher, D.W., Hilde, T.W.C., and Bracey, D.R., 1988, Tectonic evolution of the northern Pacifi c plate and Pacifi c- Farallon-Izanagi triple junction in the Late Jurassic and Early Cretaceous (M21–M1): Tectonophysics, v. 155, p. 345–364, doi:10.1016/0040-1951(88)90274-0.
Sager, W.W., Polgreen, E.L., and Rack, F.R., 1993, Magnetic polarity rever-sal stratigraphy of Hole 810C, Shatsky Rise, western Pacifi c Ocean, in Natland, J. H., Brass, G.W., Stokking, L.B., et al., Proceedings of the Ocean Drilling Program, Scientifi c Results, Volume 132: College Sta-tion, Texas, Ocean Drilling Program, p. 47–55, doi:10.2973/odp.proc.sr.132.304.1993.
Sager, W.W., Kim, J., Klaus, A., Nakanishi, M., and Khankishieva, L., 1999, Bathymetry of Shatsky Rise, northwest Pacifi c Ocean: Implications for ocean plateau development at a triple junction: Journal of Geophysical Research, v. 104, p. 7557–7576, doi:10.1029/1998JB900009.
Sager, W.W., Evans, H.F., and Channell, J.E.T., 2005, Paleomagnetism of Early Cretaceous (Berriasian) sedimentary rocks, Hole 1213B, Shatsky Rise, in Bralower, T.J., Premoli Silva, I., Malone, M.J., et al., Proceed-ings of the Ocean Drilling Program, Scientifi c Results, Volume 198: College Station, Texas, Ocean Drilling Program, doi:10.2973/odp.proc.sr.198.117.2005.
Sager, W.W., Sano, T., and Geldmacher, J., and the Expedition 324 Scientists, 2010, Proceedings of the Integrated Ocean Drilling Program, Volume 324: Tokyo, Integrated Ocean Drilling Program Management Interna-tional, Inc., doi:10.2204/ iodp.proc.324.2010.
Sager, W.W., Sano, T., and Geldmacher, J., 2011a, How do oceanic plateaus form? Clues from drilling Shatsky Rise: Eos (Transactions, American Geophysical Union), v. 92, p. 37–44, doi:10.1029/2011EO050001.
Sager, W.W., Sano, T., Geldmacher, J., and the Expedition 324 Scientists, 2011b, IODP Expedition 324: Ocean drilling at Shatsky Rise gives clues about oceanic plateau formation: Scientifi c Drilling, v. 12, p. 24–31, doi:10.5194/sd-12-24-2011.
Sager, W.W., Zhang, J., Korenaga, J., Sano, T., Koppers, A.A.P., Widdowson, M., and Mahoney, J.J., 2013, An immense shield volcano within the Shatsky Rise oceanic plateau, northwest Pacifi c Ocean: Nature Geosci-ence, v. 6, p. 976–981, doi:10.1038/ngeo1934.
Sharp, W.D., Turrin, B.D., Renne, P.R., and Lanphere, M.A., 1996, The 40Ar/39Ar and K/Ar dating of lavas from the Hilo 1-km core hole, Hawaii Scientifi c Drilling Project: Journal of Geophysical Research, v. 101, p. 11607–11616, doi:10.1029/95JB03702.
Shipboard Scientifi c Party, 2002, Site 1213, in Bralower, T.J., Premoli Silva, I., Malone, M.J., et al., Proceedings of the Ocean Drilling Program, Initial Reports, Volume 198: College Station, Texas, Ocean Drilling Program, doi:10.2973/odp.proc.ir.198.109.2002.
on April 20, 2015specialpapers.gsapubs.orgDownloaded from

Paleomagnetism of igneous rocks from the Shatsky Rise 171
Stolper, E.M., DePaolo, D.J., and Thomas, D.M., 2009, Deep drilling into a mantle plume volcano: The Hawaii Scientifi c Drilling Project: Scientifi c Drilling, v. 7, p. 4–14, doi:10.5194/sd-7-4-2009.
Tominaga, M., Sager, W.W., and Channell, J.E.T., 2005, Paleomagnetism of the igneous section, Hole 1213B, Shatsky Rise, in Bralower, T.J., Premoli Silva, I., Malone, M.J., et al., Proceedings of the Ocean Drilling Program, Scientifi c Results, Volume 198: College Station, Texas, Ocean Drilling Program, doi:10.2973/odp.proc.sr.198.113.2005.
Tominaga, M., Evans, H.F., and Iturrino, G., 2012, “Equator Crossing” of Shatsky Rise?: New insights on Shatsky Rise tectonic motion from
the downhole magnetic architecture of the uppermost lava sequences at Tamu Massif: Geophysical Research Letters, v. 39, L21301, doi:10.1029/2012GL052967.
Turner, G.M., and Thompson, R., 1981, Lake sediment record of the geomag-netic secular variations in Britain during Holocene times: Royal Astro-nomical Society Geophysical Journal, v. 65, p. 703–725, doi:10.1111/j.1365-246X.1981.tb04879.x.
MANUSCRIPT ACCEPTED BY THE SOCIETY 26 NOVEMBER 2014MANUSCRIPT PUBLISHED ONLINE XX MONTH 2015
Printed in the USA
on April 20, 2015specialpapers.gsapubs.orgDownloaded from

doi:10.1130/2015.2511(08), published online March 24, 2015;Geological Society of America Special Papers
William W. Sager, Margaret Pueringer, Claire Carvallo, et al. paleolatitude and oceanic plateau volcanismPaleomagnetism of igneous rocks from the Shatsky Rise: Implications for
Online FirstGeological Society of America Special Papers
E-mail alerting services
this article
to receive free e-mail alerts when new articles citewww.gsapubs.org/cgi/alertsclick
Subscribe
Special Papers
to subscribe to Geological Society of Americawww.gsapubs.org/subscriptionsclick
Permission request
to contact GSA.www.geosociety.org/pubs/copyrt.htm#gsaclick
viewpoint. Opinions presented in this publication do not reflect official positions of the Society.positions by scientists worldwide, regardless of their race, citizenship, gender, religion, or politicalarticle's full citation. GSA provides this and other forums for the presentation of diverse opinions and articles on their own or their organization's Web site providing the posting includes a reference to thescience. This file may not be posted to any Web site, but authors may post the abstracts only of their unlimited copies of items in GSA's journals for noncommercial use in classrooms to further education andto use a single figure, a single table, and/or a brief paragraph of text in subsequent works and to make
GSA,employment. Individual scientists are hereby granted permission, without fees or further requests to Copyright not claimed on content prepared wholly by U.S. government employees within scope of their
Notes
© Geological Society of America
on April 20, 2015specialpapers.gsapubs.orgDownloaded from