Palaeontologia Electronica -...
14
Palaeontologia Electronica http://palaeo-electronica.org PE Article Number: 13.1.4A Copyright: Society for Vertebrate Paleontology March 2010 Submission: 19 December 2008. Acceptance: 25 January 2010 Raymond, Kristina R. and Prothero, Donald R., 2010. Comparative Variability of Intermembranous and Endochondral Bones in Pleistocene Mammals. Palaeontologia Electronica Vol. 13, Issue 1; 4A: 14p; http://palaeo-electronica.org/2010_1/184/index.html COMPARATIVE VARIABILITY OF INTERMEMBRANOUS AND ENDOCHONDRAL BONES IN PLEISTOCENE MAMMALS Kristina R. Raymond and Donald R. Prothero ABSTRACT Study of the embryology and ossification of modern bones predicts that fossil intermembranous bones (which ossify from connective tissue) will exhibit greater size variability than endochondral bones (which are formed from embryological cartilagi- nous precursors), because intermembranous bones are less tightly constrained by joints and articular surfaces. To evaluate this hypothesis, we measured multiple dimen- sions of 989 intermembranous bones (patellae and other sesamoids) of the saber- toothed cat Smilodon fatalis, the Ice Age lion Panthera atrox, the bison Bison antiquus, the horse Equus occidentalis, the camel Camelops hesternus, the ground sloths Paramylodon (=Glossotherium) harlani and Nothrotheriops shastensis from Rancho La Brea and from the late Pleistocene San Josecito Cave in Nuevo Leon, Mexico. These were compared to measurements of 811 endochondral bones (primarily astragali) of comparable size. Through statistical analyses (coefficients of variation, ANOVA, modi- fied Levene’s test, and t-tests) we found slight evidence of higher variability in many of the intermembranous bones of these taxa (21 out of 27 CVs were higher for intermem- branous bones than endochondral bones), although this trend is not found in all taxa. Using a modified Levene’s test, only Smilodon and some of the dimensions of horse and bison patellae are significantly more variable than the corresponding dimensions of the astragali. Although the results are mixed, at least some data show that inter- membranous bones are not as tightly constrained by growth and by adjacent tissues as are endochondral bones. This evidence of relative variability is important in assess- ing how much variability is typical of a single species, and thus has taxonomic implica- tions. Kristina R. Raymond, Don Sundquist Center for Excellence in Paleontology, Department of Biology, East Tennessee State University, Johnson City, TN 37614 USA. [email protected] Donald R. Prothero, Department of Geology, Occidental College, Los Angeles, CA 90041 USA. [email protected] KEY WORDS: intermembranous bone; endochondral bone; sesamoid bone; variability; Pleistocene
Transcript of Palaeontologia Electronica -...

Palaeontologia Electronica http://palaeo-electronica.org
COMPARATIVE VARIABILITY OF INTERMEMBRANOUS AND ENDOCHONDRAL BONES IN PLEISTOCENE MAMMALS
Kristina R. Raymond and Donald R. Prothero
ABSTRACT
Study of the embryology and ossification of modern bones predicts that fossilintermembranous bones (which ossify from connective tissue) will exhibit greater sizevariability than endochondral bones (which are formed from embryological cartilagi-nous precursors), because intermembranous bones are less tightly constrained byjoints and articular surfaces. To evaluate this hypothesis, we measured multiple dimen-sions of 989 intermembranous bones (patellae and other sesamoids) of the saber-toothed cat Smilodon fatalis, the Ice Age lion Panthera atrox, the bison Bison antiquus,the horse Equus occidentalis, the camel Camelops hesternus, the ground slothsParamylodon (=Glossotherium) harlani and Nothrotheriops shastensis from Rancho LaBrea and from the late Pleistocene San Josecito Cave in Nuevo Leon, Mexico. Thesewere compared to measurements of 811 endochondral bones (primarily astragali) ofcomparable size. Through statistical analyses (coefficients of variation, ANOVA, modi-fied Levene’s test, and t-tests) we found slight evidence of higher variability in many ofthe intermembranous bones of these taxa (21 out of 27 CVs were higher for intermem-branous bones than endochondral bones), although this trend is not found in all taxa.Using a modified Levene’s test, only Smilodon and some of the dimensions of horseand bison patellae are significantly more variable than the corresponding dimensionsof the astragali. Although the results are mixed, at least some data show that inter-membranous bones are not as tightly constrained by growth and by adjacent tissuesas are endochondral bones. This evidence of relative variability is important in assess-ing how much variability is typical of a single species, and thus has taxonomic implica-tions.
Kristina R. Raymond, Don Sundquist Center for Excellence in Paleontology, Department of Biology, East Tennessee State University, Johnson City, TN 37614 USA. [email protected] R. Prothero, Department of Geology, Occidental College, Los Angeles, CA 90041 USA. [email protected]
KEY WORDS: intermembranous bone; endochondral bone; sesamoid bone; variability; Pleistocene
PE Article Number: 13.1.4ACopyright: Society for Vertebrate Paleontology March 2010Submission: 19 December 2008. Acceptance: 25 January 2010
Raymond, Kristina R. and Prothero, Donald R., 2010. Comparative Variability of Intermembranous and Endochondral Bones in Pleistocene Mammals. Palaeontologia Electronica Vol. 13, Issue 1; 4A: 14p; http://palaeo-electronica.org/2010_1/184/index.html
RAYMOND & PROTHERO: VARIABILITY IN MAMMAL BONES
INTRODUCTION
In recent years, developmental biology hasmade enormous strides in understanding thegrowth and modification of bones, and the con-straints on bone growth as well (Hall 2005; Currey2006). Most paleontologists no longer view bonesas static entities, but as dynamic three-dimensionalobjects that can vary in shape not only duringontogeny, but also due to changed biomechanicalforces. Because of both ontogenetic and ecophe-notypic factors, bone shapes and sizes can varyquite widely in a population (Yablokov 1974).Shape and size of fossil bones are important fac-tors in making taxonomic decisions, and assessingthe variability of a single population is critical indeciding how much variability in a fossil samplecan be attributed to a single species, or requiresother explanations.
In particular, variability due to different stylesof growth between endochondral bones (whichossify directly from an embryonic cartilaginous pre-cursor, often constrained by joints and articular sur-faces) and less constrained intermembranousbones, is highly relevant to these issues. The topicof intermembranous and endochondral bonegrowth, size and variability is one that is not com-monly touched upon, except briefly in passing, inpaleontological literature. Generally, intermembra-nous bones are measured and discussed as only aslightly relevant topic in regards to larger studies ofspecies or interspecific variation and sexual sizedimorphism.
Intermembranous bones form directly fromthe connective tissue late in embryological devel-opment and after birth through intramembranousossification. Some intermembranous bones, suchas the kneecap (patella), are almost always ossi-fied in adult mammals (with minor exceptions).Other intermembranous bones, known as sesam-oids, occur only in areas where a tendon passesover a joint, and ossify in irregular and unpredict-able patterns (Vickaryous and Olson 2007). Thenumber and shape of intermembranous bones varygreatly within the Mammalia, and are highly taxon-dependent. Humans have only one sesamoid (thepisiform) in the carpus. In many mammals, suchbones include the patella and large sesamoids inthe manus and pes. In ungulates, on the otherhand, the only large sesamoid element is thepatella. The sesamoids in the manus or pes aresmall nodular ossifications in the digital flexor ten-dons, both at the metapodial-phalangeal joint andthe distal interphalangeal joint; suids have as manyas 13 sesamoids in the manus alone.
Vickaryous and Olson (2007) point out thatalthough sesamoids receive little attention in pale-ontological literature, the majority of tetrapod lin-eages develop at least one sesamoid. “As a group,sesamoids and their ilk represent something of ananatomical enigma, with an enormous degree ofvariability in size, shape, and position both withinand between taxa. Consequently, most skeletaldescriptions relegate these elements to passagesthat summarize… bones and cartilages, predispos-ing them to continued marginalization” (Vickaryousand Olson 2007). This scientific neglect is largelybecause sesamoids are not as commonly pre-served as more massive and larger bones of skele-ton, or sometimes cannot be reliably associatedwith a known species.
Recent anthropological literature has com-mented on patellar variability in humans of bothrecent and Pleistocene age. Trinkaus (2000) con-cludes that all of his samples “exhibit considerablevariability in these patellar proportions.” Trinkausand Rhoads (1999) and Ward et al. (1995) also dis-cussed the variability of fossil hominid patellae, butin the context of functional morphological interpre-tations, rather than comparative variability. The lit-erature cited above suggests that because modernlineages show patellar variability, the Pleistocenefossil record may also provide data to suggest thatsesamoids have been variable throughout the his-tory of life.
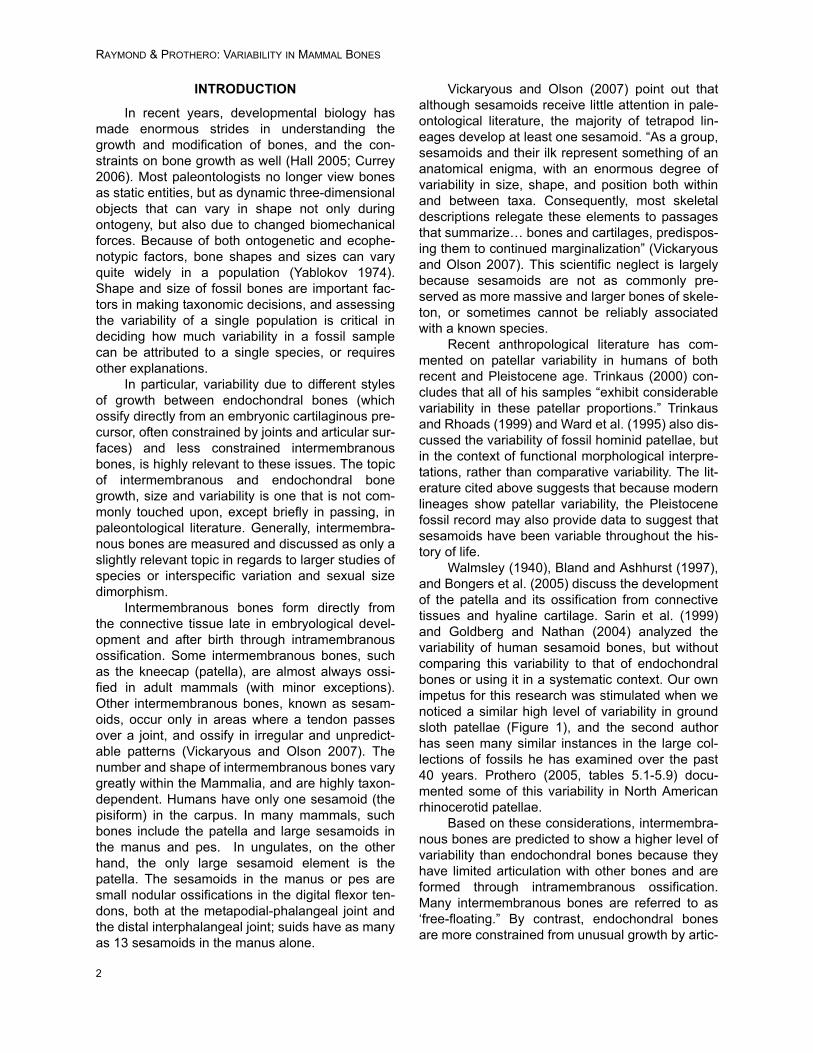
Walmsley (1940), Bland and Ashhurst (1997),and Bongers et al. (2005) discuss the developmentof the patella and its ossification from connectivetissues and hyaline cartilage. Sarin et al. (1999)and Goldberg and Nathan (2004) analyzed thevariability of human sesamoid bones, but withoutcomparing this variability to that of endochondralbones or using it in a systematic context. Our ownimpetus for this research was stimulated when wenoticed a similar high level of variability in groundsloth patellae (Figure 1), and the second authorhas seen many similar instances in the large col-lections of fossils he has examined over the past40 years. Prothero (2005, tables 5.1-5.9) docu-mented some of this variability in North Americanrhinocerotid patellae.
Based on these considerations, intermembra-nous bones are predicted to show a higher level ofvariability than endochondral bones because theyhave limited articulation with other bones and areformed through intramembranous ossification.Many intermembranous bones are referred to as‘free-floating.” By contrast, endochondral bonesare more constrained from unusual growth by artic-
2
PALAEO-ELECTRONICA.ORG
ulations with other bones. Apparent variability mayalso be the result of ossification into the tendonsbecause animals tend to replace minor tissue dam-age with bone at the intersection of bone and ten-don as an inflammatory response. Therefore, olderindividuals or individuals who have suffered tendonor joint injury would display larger or oddly shapedsesamoids (Andrew Clifford, personal communica-tion, 2007).
MATERIALS AND METHODS
One of the best ways to address this questionis to measure a relatively large set of fossilizedintermembranous and endochondral bones from ahomogeneous population. Unfortunately, most fos-sil samples only rarely preserve sesamoid bones,especially the small sesamoids of the manus andpes, or else the taxonomic identity of the sesam-oids cannot be established. Some exceptions tothis rule are the large samples of bones (Figure 2)from late Pleistocene localities such as Rancho La
Brea tar pits (Stock and Harris 1992) and cavedeposits such as San Josecito Cave in NuevoLeon, Mexico (Arroyo-Cabrales et al. 2003)
In this study, we measured samples of inter-membranous and endochondral bones from nearlyall the large mammals for which a sufficiently largesample (wherever possible, more than 100 of eachelement) exists. These include two ground sloths(Paramylodon harlani and Nothrotheriops shasten-sis), the extinct bison Bison antiquus, the extincthorse Equus occidentalis, the lamine camelidCamelops hesternus, the Ice Age lion Pantheraatrox, and the saber-toothed cat Smilodon fatalis.The only common mammal not included in thestudy was the dire wolf (Canis dirus), which is cur-rently under study by F.R. O’Keefe (personal com-mun., 2008).
Sloths not only possess patellae and sesam-oids of the manus, but also a layer of dermal ossi-cles just under the skin, similar to an armadillo’sarmor, which may have been used as protectionagainst predators (Stock 1925). The ossicles of the
FIGURE 1. Patellae (kneecaps) of the ground sloth, Paramylodon harlani, show apparent shape and size variability.Scale bar equals 1 cm.
3

RAYMOND & PROTHERO: VARIABILITY IN MAMMAL BONES
species Paramylodon harlani are the most com-mon fossil found at the La Brea tar pits (S. Cox,personal commun.). Previous literature on giantground sloths have commented on high levels ofvariability and sexual dimorphism amongst thelarger species, Eremotherium eomigrans (De Iuliisand Cartelle 1999). However, our previous studyfound that the Rancho La Brea sloths did notexhibit significant size variability or sexual sizedimorphism. Their bones did show some shapevariability (Prothero and Raymond 2008), which isapparent in intermembranous bones such as thepatella (Figure 1).
None of the specimens from Rancho La Breaand very few of those from San Josecito Cave arearticulated or associated, so there is no way torelate individual bones to individual animals. In thecase of Rancho La Brea bones, the radiocarbondates for the samples we used are tightly clustered(Marcus and Berger 1984) so they appear to sam-ple populations over a small interval of time andare not significantly time averaged. In addition, ourwork on most of the Rancho La Brea mammalsand birds (Prothero and Raymond 2008; Protheroet al. 2009) demonstrates no significant size orshape change over the entire 40,000 years that thebones accumulated, so even if the samplesspanned significant time intervals, they would notshow increased size variation.
All of the bones measured in this study wereunworn and pristine in condition, so there is no evi-dence of taphonomic abrasion or breakage that
might affect the data set. As shown by Protheroand Raymond (2008), most postcranial bonesshow no evidence of sexual size dimorphism, sothere is no way to segregate the bones into the twosexes. We eliminated bones that were poorly ossi-fied or looked like they might belong to juveniles,so the samples we measured should contain onlybones of mature adult individuals.
The La Brea felids, Smilodon fatalis and Pan-thera atrox, have been described in literature (Mer-riam and Stock 1932) quite thoroughly but verylittle research has been conducted specificallyfocusing on the variation of their intermembranousbones. Most research of these creatures involvestheir masticatory apparatus, paleodiet, paleoecol-ogy and systematic description. The osteology ofCamelops was last reviewed by Webb (1965), andthe systematics and osteology of North AmericanPleistocene bison was reviewed by McDonald(1981), but there has not been a lot of recent pub-lished research on the osteology of the La Breahorse (E. Scott, personal commun.)
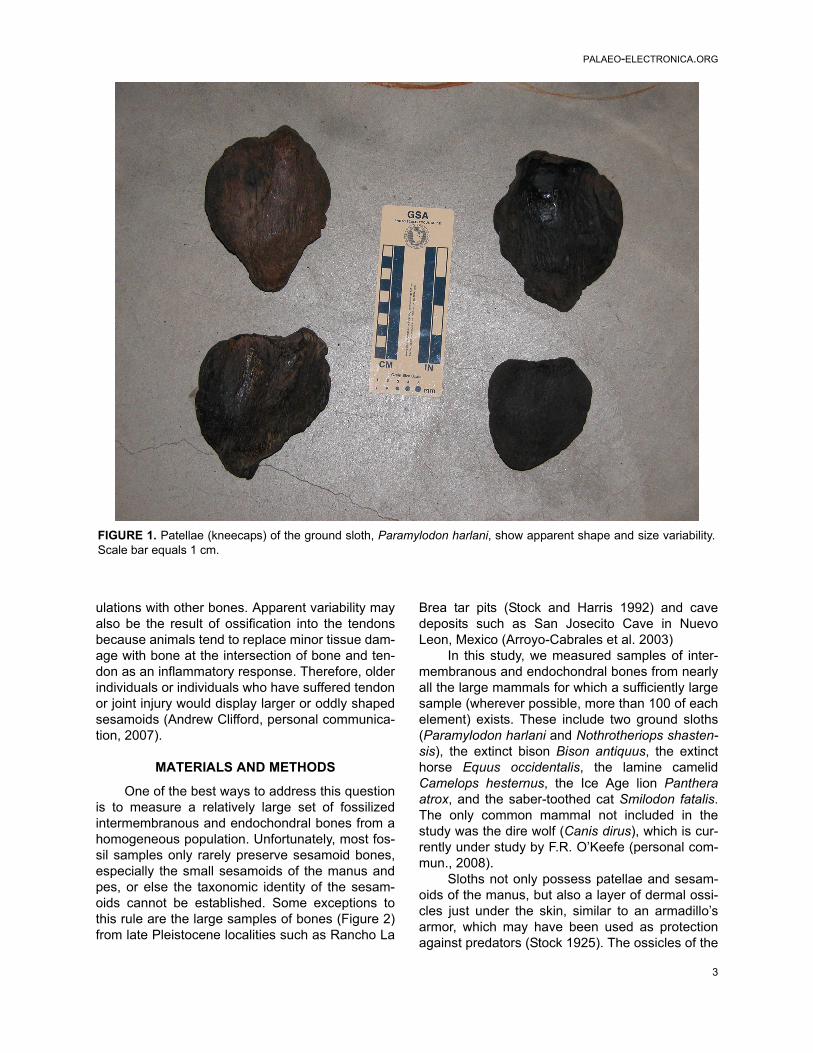
Using dial calipers, the first author measuredseveral dimensions of a grand total of over 1800bones from these species and entered data intoMicrosoft Excel spreadsheets. Measurements ofthe 989 intermembranous bones were taken fromthe maximum lateral width, proximo-distal lengthand dorso-plantar depth of patellae and inner andouter carpal sesamoids. The endochondral boneselected for study was the astragalus, which wasvery abundant and could be measured in compara-
FIGURE 2. Photographs of representative trays of the sample of Smilodon fatalis in the Page Museum. Each tray isone of many for each element, so there are typically more than 100 individual elements found in 3-7 separate trays.A. One of almost a dozen trays of patellae. B. One of many trays of astragali.
4

PALAEO-ELECTRONICA.ORG
ble dimensions and was comparable in size to thepatella. Measurements of the 811 astragali weretaken of the proximo-distal height, lateral width,and maximum dorso-plantar depth. In all cases,the measurements were taken along axes that rep-resent the strain between articular surfaces, andthus should have functional significance.
Using Microsoft Excel, means and standarddeviations of each dimensional measurement werecalculated (Table 1). The statistical analyses fol-lowed the methods of Sokal and Rohlf (1994,2009) and Plavcan and Cope (2001). These datawere then used to calculate the coefficients of vari-ation, which is used in paleontological and biologi-cal studies to determine the level of variabilitywithin a sample population. The coefficient of vari-ation is defined as 100*(standard deviation/mean).Because the units of measurement in the standarddeviation and the mean are the same, the CVbecomes a unitless measurement. This is espe-cially useful when comparing bones of significantlydifferent sizes, since the standardization of themean by the standard deviation makes the CV uni-form, regardless of absolute size. The comparisonof the coefficients of variation, which are derivedfrom different distributions, is consistently valid anduseful if the samples share a similar or relatedstructure, position or value (Simpson et al. 1960;Lande 1977; Sokal and Rohlf 1994; Polly 1998;Dayan et al. 2002; Meiri et al. 2005). Fifty years ofzoological research indicates that for most mam-mal populations, CVs will be less than 10 exceptfor features that are extremely sexually dimorphic(Kurtén 1953; Simpson et al. 1960; Yablokov1974).
Additional statistical analyses were conductedto test for significance of variability between inter-membranous and endochondral bones. However,in order to determine which tests are appropriate tothe study, we first had to determine whether thedata samples are normally distributed. Using the f-statistic, probability plots were calculated by rank-ing the measurements and assigning a z-score(individual raw score minus population mean). Z-scores were plotted on bivariate plots (on the y-axis) against the ranked data (on the x-axis), and aregression line was added. In a normal distribution,the regression line crosses the x-axis at about themean, and the slope is close to the reciprocal ofthe standard deviation. If all the data are normallydistributed, certain parametric tests are then appro-priate to analyze the variability of the samples.
The next test used to determine which statisti-cal methods would be appropriate for this study is
the f-test for equality of variances. Variance isdefined as the average of the squared deviationsfrom the mean, or the square of the standard devi-ation. Therefore, the variance is a measure of sta-tistical dispersion from the sample mean andportrays the degree of distribution. The f-test mea-sures whether the variances from two samples arestatistically equal or unequal. The null hypothesisin this test states that the variances of the two nor-mally distributed samples are equal and, therefore,comparable. The alternate hypothesis states thatthe variances are unequal. If the null hypothesis isaccepted, t-tests for equal variances and Analysisof Variance (or ANOVA) are applicable to thisstudy. If the null hypothesis is rejected, t-tests areavailable to assess the differences in means wherethe variances are assumed to be unequal. For anANOVA to be valid, the samples involved musthave a normal distribution, have equal variances,and variables must be independent. In this casethere is one measurement variable and one nomi-nal (or categorical) value. The purpose of the testis to analyze how much of the variation among theobservations is due to variation in each factor(nominal variable) influencing the character (mea-surement value) being studied. If the F value isgreater than the F-critical value, there is a statisti-cally significant difference and the null hypothesisof equal means is rejected.
In addition to these traditional methods, wealso used the modified Levene’s test (Levene1960; Lewontin 1966; Schultz 1985; Plavcan andCope 2001) to determine whether the variabilitiesof two samples were significantly different. Themodified Levene test uses natural logs to removeeffects of relative size then calculates the absolutevalues of differences between each individual mea-surement and the median, which can then be ana-lyzed for mean and standard deviation and testedfor significance using ANOVA.
RESULTS
F-statistic for Normality
The f-statistic tests a given sample for normalprobability distribution. Once all samples of thisstudy were ranked, given a z-score (individual rawscore minus population mean) and plotted onbivariate plots with regression lines, we determinedthat all samples were normally distributed.Because all of the distributions turned out to nor-mal, coefficients of variation, t-tests, and ANOVAmay be used if other standards are met.
5

RAYMOND & PROTHERO: VARIABILITY IN MAMMAL BONES
6
TABLE 1. Raw statistics of specimens measured in this study. Number of specimens in parentheses. SD = standarddeviation. CV = coefficient of variation. VAR = variance (SD squared). All measurements in mm.
Species Element (#Specimens) Dimension Mean SD CV VARPanthera atrox Patella (64) Max. Length 64.90 5.10 7.86 26.01
Max. Width 45.35 3.55 2.43 12.60
Max. Depth 27.70 7.82 8.76 61.15
Astragalus (71) Ant.-Post Length 64.60 4.05 6.27 16.40
Max Width 41.85 5.00 11.95 25.00
Max. Depth 37.80 2.69 7.11 7.24
Smilodon fatalis Patella (367) Max Length 53.10 4.03 7.59 16.24
Max Width 40.61 2.96 7.28 8.76
Max Depth 25.62 2.20 8.59 4.84
Astragalus (373) Ant.-Post Length 44 .00 7.07 5.26 49.98
Max. Width 60 .00 4.95 6.11 24.50
Max Depth 27.50 10.61 6.56 112.57
Sesamoids (174) Max Length 23.36 2.90 12.40 8.41
Max Width 9.59 1.12 11.71 12.54
Max Depth 9.75 1.18 12.11 1.39
Paramylodon harlani Patella (55) Max. Length 118.76 9.53 8.02 90.82
Max. Width 105.20 6.64 4.28 44.09Max. Depth 58.76 4.28 7.28 18.31
Astragalus (88) Ant.-Post. Length 128.21 9.14 7.12 83.53Max. Width 134.23 9.04 6.73 81.72Max. Depth 85.93 7.24 8.42 52.42
Inner sesamoid 3 (40) Max. Length 46.20 3.07 6.65 9.42Max. Width 31.87 2.29 7.21 5.24Max. Depth 20.39 1.82 8.94 3.31
Outer sesamoid 3 (38) Max. Length 48.35 3.64 7.53 13.25Max. Width 31.87 2.68 8.40 7.18
Max. Depth 20.61 2.00 9.71 4.00
Nothrotheriops shastensis Astragalus (6) Ant.-Post Length 103.83 3.65 3.52 13.32
Max. Width 99.17 4.02 4.05 16.16
Camelops hesternus Patella (37) Max. Length 99.98 8.32 8.33 69.29
Max. Width 54.91 5.87 10.67 34.50
Max. Depth 43.28 4.21 9.74 17.79
Astragalus (75) Ant.-Post Length 78.65 10.95 13.91 119.85
Max. Width 56.72 4.85 8.55 23.52
Max. Depth 42.95 10.95 13.92 119.85
Bison antiquus Patella (87) Max. Length 73.26 6.41 8.75 41.13
Max. Width 69.73 5.62 8.06 31.56
Max. Depth 44.79 4.95 11.06 24.56
Astragalus (96) Ant.-Post Length 84.59 5.34 6.31 28.48
Max. Width 52.48 4.28 8.15 18.31
Max. Depth 45.76 3.64 7.94 13.21
Equus occidentalis Patella (122) Max. Length 80.48 3.91 4.86 15.31
Max. Width 79.34 4.15 5.23 17.19
Max. Depth 45.14 6.03 13.35 31.32
Astragalus (101) Ant.-Post Length 70.83 2.67 3.77 7.12
Max. Width 65.65 3.94 5.99 15.51
Max. Depth 58.81 3.03 5.16 9.20

PALAEO-ELECTRONICA.ORG
F-test for Equal Variances
As previously discussed, the f-test for equalvariances is necessary in order to determine whichtype of t-test (assuming equal or unequal vari-ances) to use, and whether or not standards forANOVA are met. Results of the f-tests (Table 2)indicate that the comparison of variances of astra-gali to patellae of Paramylodon harlani length,Smilodon fatalis depth, Panthera atrox depth,Camelops hesternus length, width and depth, andEquus occidentalis width meet qualifications forfurther analysis through ANOVA and t-tests assum-ing equal variances because the f-values aresmaller than the f-critical values for these samples.Thus, in the aforementioned measurement com-parisons, the null hypothesis is accepted. In addi-tion, the p-values for the Paramylodon harlanilength, Panthera atrox depth, Equus occidentaliswidth, and Smilodon fatalis depth are greater thanthe 0.05 significance level.
In all other sample measurements (Paramy-lodon harlani width and depth, Smilodon fatalislength and width, Equus occidentalis length anddepth, Bison antiquus length, width, and depth,and Panthera atrox length and width), f-values arelarger than the f-critical values. This forces us toreject the null hypothesis of equal variances.Therefore, ANOVA is not applicable to these mea-surements, and only t-test assuming unequal vari-ances may be used to further analyze this data.Also, p-values for all remaining samples are lessthan the 0.05 significance level. This providesstrong evidence that the null hypothesis is not truefor these samples.
In some cases (Equus occidentalis length anddepth, Panthera atrox length and width), the vari-ances (Table 1) of the astragalus (an endochondralbone) are smaller than those of the patella (a inter-membranous bone), which is consistent with ourhypothesis. In other cases (Paramylodon harlaniwidth and depth, Bison antiquus length, width, anddepth, and Smilodon fatalis length and width), thevariances of the astragalus are larger than those ofthe patella, which is not consistent with our hypoth-esis.
T-tests
Preliminary tests for equality of variances indi-cate that the variances between astragali andpatellae in Paramylodon harlani length, Smilodonfatalis depth, Camelops hesternus length, widthand depth, Equus occidentalis width, and Pantheraatrox depth are statistically equal. Two-sample t-
tests assuming equal variances were performedand results calculated (Table 3). All equal varianceresults except the B. antiquus depth and the C.hesternus width and depth have p-values that areless than the significance level of 0.05, and t-statvalues fall outside of the range of t-critical values.
For the variances that were determined to beunequal (Paramylodon harlani width and depth,Smilodon fatalis length and width, Equus occiden-talis length and depth, Bison antiquus length,width, and depth, and Panthera atrox length andwidth), two-sample t-tests assuming unequal vari-ances were performed and results tabulated (Table4). All results from t-tests assuming unequal vari-ances fall outside of the range of t-critical values.All P-values for these taxa except for length andwidth in Panthera atrox and the depth measure-ment of Bison antiquus are less than the 0.05 sig-nificance level.
Analysis of Variance (ANOVA)
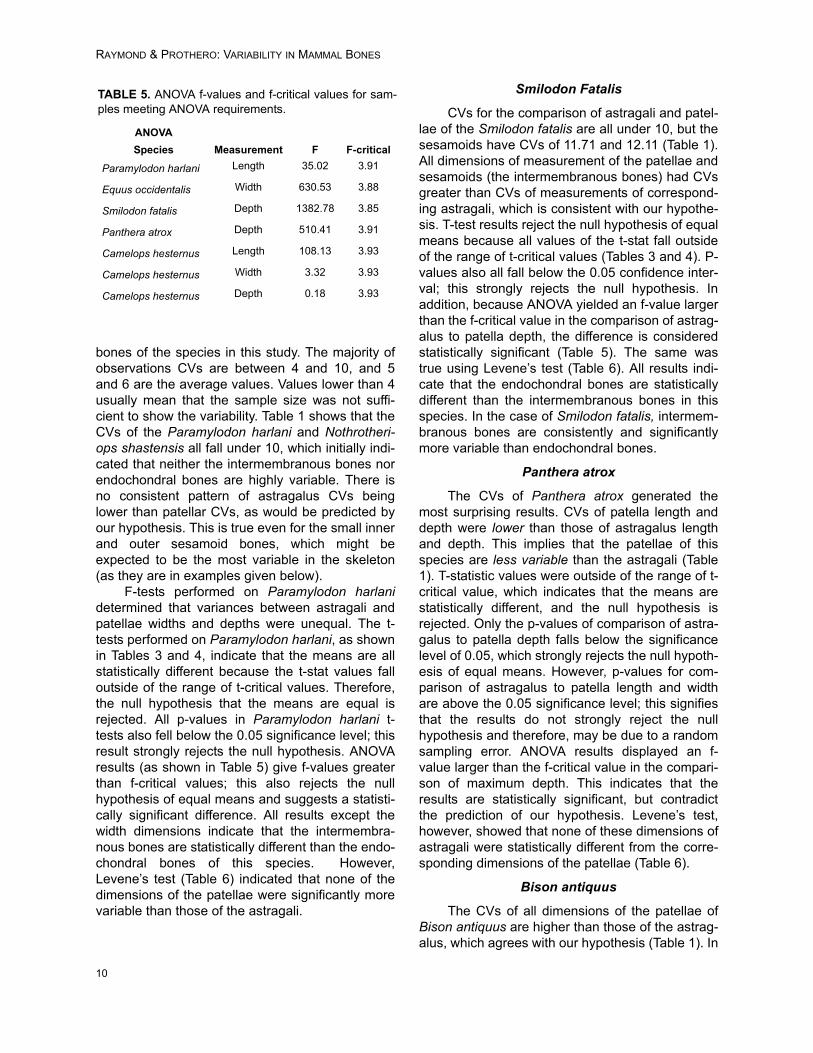
Analysis of variance was used to analyze howmuch of the variation among the observations isdue to variation in each bone type influencing thecharacter (measurement value) being studied.Most of the samples were determined to meet thestandards for ANOVA: independent variables, nor-mal distribution (calculated by f-stat), and equalvariances (calculated by f-test). These samples,which include comparisons between the astragaliand patellae of the Paramylodon harlani length,Smilodon fatalis depth, Camelops hesternuslength, Equus occidentalis width, and Pantheraatrox depth, yielded f-values higher than f-criticalvalues in each case (Table 5), so the differencesare significant. However, the depth and widthdimensions of Camelops hesternus were below thef-critical value, so they are not significantly differ-ent.
Modified Levene’s Test
As discussed above, the modified Levene test(Levene 1960; Plavcan and Cope 2001) is a popu-lar method for testing for equal variability whileusing natural logs to correct for absolute size.Using ANOVA, we found that depth and length ofbison and horse patellae were significantly morevariable than their corresponding astragali, but notwidth (Table 6). None of the camel, sloth, or lionbones showed significantly more variability ofpatellae compared to astragali. However, all of thedimensions of Smilodon patellae were significantlymore variable than those of the astragali.
7

RAYMOND & PROTHERO: VARIABILITY IN MAMMAL BONES
Coefficients of Variation (CV)
As shown in Table 1, most of the coefficientsof variation (20 out of 27) are higher for intermem-branous bones than for their corresponding mea-surements of the endochondral bones. CVs fromthe samples of Panthera atrox are less than 10with the exception of the maximum width of theastragalus, which has a CV of 11.95. However, theCVs of the endochondral bones (astragalus) aregenerally higher than those of the intermembra-nous bones (patella), in contrast to our expecta-tions. Smilodon fatalis bones have CVs within therange of 5-13. The CVs of the endochondral bonesof this species are all less than 10. Smilodon fatalispatellae CVs are also under 10. However, all threedimensions measurements of the carpal sesam-oids in this species demonstrate CVs greater than10. In addition, the CVs of both intermembranousbones (patella and sesamoids) are consistently
higher than those of the astragalus, as expected inour hypothesis.
In both species of ground sloths (Paramy-lodon harlani and Nothrotheriops shastensis), allCVs are in the range of 3-10. The highest coeffi-cient of variation in the order Xenarthra is the max-imum depth of the outer sesamoid of digit 3 of theParamylodon harlani with a value of 9.71. How-ever, the CVs of the endochondral bones are in thesame range as those of the intermembranousbones and not consistently lower. The sample sizefor Nothrotheriops shastensis is much smaller, butsimilar trends are observed. Mean, standard devia-tion, and coefficient of variation were not calculatedfor the Nothrotheriops shastensis patellae as only afew specimens were available.
In Camelops hesternus, the CVs were unusu-ally high, with three values above 10 (Table 1). Incontrast to our predictions, two out of three CVs
TABLE 2. F-test for equal variance.
Species Measurement f P(F<=f) f-critical
Paramylodon harlani Length 1.09 0.35 1.48
Width 1.85 0.01 1.52
Depth 2.86 <0.001 1.52
Smilodon fatalis Length 1.68 <0.001 1.18
Width 1.67 <0.001 1.18
Depth 1.13 0.11 1.18
Panthera atrox Length 1.59 0.03 1.5
Width 1.9 0.003 1.5
Depth 1.23 0.2 1.5
Bison antiquus Length 1.44 0.04 1.42
Width 1.72 0.005 1.42
Depth 1.86 0.002 1.42
Equus occidentalis Length 2.15 <0.001 1.38
Width 1.11 0.30 1.38
Depth 3.95 <0.001 1.38
Camelops hesternus Length 0.57 0.037 1.58
Width 1.39 0.11 1.58
Depth 1.31 0.17 1.58
8

PALAEO-ELECTRONICA.ORG
(length and depth) of the astragalus were consis-tently higher than those of the patella. In Bisonantiquus, the CVs of the astragalus were slightlylower than those of the patella, consistent with ourinitial hypothesis. The same is true of Equus occi-dentalis (Table 1).
Summarizing the CV data, 20 out of 27 of thecomparisons of the CV of an intermembranousbone to the endochondral astragalus yield a higherCV for the intermembranous bone, in agreementwith our prediction. Many of our taxa (Equus occi-dentalis, Bison antiquus, and Smilodon fatalis)show the predicted trend of greater CVs in inter-membranous bones than in endochondral bones.The data from Paramylodon harlani are equivocal,
with overlapping values of CVs for intermembra-nous and endochondral bones. But two of the taxa(Camelops hesternus and Panthera atrox) seem tohave higher CVs in their endochondral bones(astragalus) than in their intermembranous bones.
DISCUSSION
Results for each taxon are summarized belowand in Table 7.
Paramylodon harlani
Coefficients of variation yielded the initial esti-mates in determining the degree of variabilitybetween the intermembranous and endochondral
TABLE 3. Results of t-tests assuming equal variances.
TABLE 4. Results of t-tests assuming unequal variances.
T-tests Assuming Equal Variances
Species Measurement t Stat t critical values P value
Paramylodon harlani Length -5.92 1.65-1.97 <0.001
Smilodon fatalis Depth 37.18 1.64-1.96 <0.001
Equus occidentalis Width 25.11 1.65-1.97 <0.001
Panthera atrox Depth 18.07 1.65-1.97 <0.001
Camelops hesternus Length 10.40 1.66-1.98 <0.001
Camelops hesternus Width -1.82 1.66-1.98 0.07
Camelops hesternus Depth 0.42 1.66-1.98 0.33
T-tests Assuming Unequal Variances
Species Measurement t Stat t-critical values P-value
Paramylodon harlani Width 6.87 1.65-1.98 <0.001
Depth -2.93 1.65-1.98 0.002
Smilodon fatalis Length 8.73 1.65-1.96 <0.001
Width -14.48 1.65-1.96 <0.001
Panthera atrox Length 1.37 1.65-1.97 0.08
Width -1.07 1.65-1.97 0.14
Equus occidentalis Length 21.79 1.65-1.97 <0.001
Depth -21.93 1.65-1.97 <0.001
Bison antiquus Length -12.84 1.65-1.97 <0.001
Width 23.06 1.65-1.97 <0.001
Depth -1.49 1.65-1.97 0.068
9
RAYMOND & PROTHERO: VARIABILITY IN MAMMAL BONES
bones of the species in this study. The majority ofobservations CVs are between 4 and 10, and 5and 6 are the average values. Values lower than 4usually mean that the sample size was not suffi-cient to show the variability. Table 1 shows that theCVs of the Paramylodon harlani and Nothrotheri-ops shastensis all fall under 10, which initially indi-cated that neither the intermembranous bones norendochondral bones are highly variable. There isno consistent pattern of astragalus CVs beinglower than patellar CVs, as would be predicted byour hypothesis. This is true even for the small innerand outer sesamoid bones, which might beexpected to be the most variable in the skeleton(as they are in examples given below).
F-tests performed on Paramylodon harlanidetermined that variances between astragali andpatellae widths and depths were unequal. The t-tests performed on Paramylodon harlani, as shownin Tables 3 and 4, indicate that the means are allstatistically different because the t-stat values falloutside of the range of t-critical values. Therefore,the null hypothesis that the means are equal isrejected. All p-values in Paramylodon harlani t-tests also fell below the 0.05 significance level; thisresult strongly rejects the null hypothesis. ANOVAresults (as shown in Table 5) give f-values greaterthan f-critical values; this also rejects the nullhypothesis of equal means and suggests a statisti-cally significant difference. All results except thewidth dimensions indicate that the intermembra-nous bones are statistically different than the endo-chondral bones of this species. However,Levene’s test (Table 6) indicated that none of thedimensions of the patellae were significantly morevariable than those of the astragali.
Smilodon Fatalis
CVs for the comparison of astragali and patel-lae of the Smilodon fatalis are all under 10, but thesesamoids have CVs of 11.71 and 12.11 (Table 1).All dimensions of measurement of the patellae andsesamoids (the intermembranous bones) had CVsgreater than CVs of measurements of correspond-ing astragali, which is consistent with our hypothe-sis. T-test results reject the null hypothesis of equalmeans because all values of the t-stat fall outsideof the range of t-critical values (Tables 3 and 4). P-values also all fall below the 0.05 confidence inter-val; this strongly rejects the null hypothesis. Inaddition, because ANOVA yielded an f-value largerthan the f-critical value in the comparison of astrag-alus to patella depth, the difference is consideredstatistically significant (Table 5). The same wastrue using Levene’s test (Table 6). All results indi-cate that the endochondral bones are statisticallydifferent than the intermembranous bones in thisspecies. In the case of Smilodon fatalis, intermem-branous bones are consistently and significantlymore variable than endochondral bones.
Panthera atrox
The CVs of Panthera atrox generated themost surprising results. CVs of patella length anddepth were lower than those of astragalus lengthand depth. This implies that the patellae of thisspecies are less variable than the astragali (Table1). T-statistic values were outside of the range of t-critical value, which indicates that the means arestatistically different, and the null hypothesis isrejected. Only the p-values of comparison of astra-galus to patella depth falls below the significancelevel of 0.05, which strongly rejects the null hypoth-esis of equal means. However, p-values for com-parison of astragalus to patella length and widthare above the 0.05 significance level; this signifiesthat the results do not strongly reject the nullhypothesis and therefore, may be due to a randomsampling error. ANOVA results displayed an f-value larger than the f-critical value in the compari-son of maximum depth. This indicates that theresults are statistically significant, but contradictthe prediction of our hypothesis. Levene’s test,however, showed that none of these dimensions ofastragali were statistically different from the corre-sponding dimensions of the patellae (Table 6).
Bison antiquus
The CVs of all dimensions of the patellae ofBison antiquus are higher than those of the astrag-alus, which agrees with our hypothesis (Table 1). In
TABLE 5. ANOVA f-values and f-critical values for sam-ples meeting ANOVA requirements.
ANOVA
Species Measurement F F-critical
Paramylodon harlani Length 35.02 3.91
Equus occidentalis Width 630.53 3.88
Smilodon fatalis Depth 1382.78 3.85
Panthera atrox Depth 510.41 3.91
Camelops hesternus Length 108.13 3.93
Camelops hesternus Width 3.32 3.93
Camelops hesternus Depth 0.18 3.93
10

PALAEO-ELECTRONICA.ORG
the f-tests (Table 2), the f values were alwaysgreater than the f-critical value, so the variancesare not equal. In the t-tests assuming unequal vari-ances, all three t values fell outside the criticalrange, so the means are statistically different.Thus, all three dimensions are consistent with ourhypothesis and statistically significant. Using themodified Levene test (Table 6), the widths of patel-lae are not significantly more variable than those ofthe astragali, but the length and depth are signifi-cantly more variable.
Equus occidentalis
The CV values of the horses are higher for thepatella than for the astragalus in two dimensions(length and depth), consistent with our hypothesisof greater intermembranous bone variability, butnot for the width measurements. The variancesalso show the same trend (Table 1). In the f-test(Table 2), two dimensions of the horse bones(length and depth) have unequal variances, but thethird (width) has equal variances. The t-test (Tables3 and 4) shows that these differences are signifi-cant, as does the ANOVA (Table 5). Thus, the
intermembranous bones of the horse are signifi-cantly more variable than the endochondral bonesin two dimensions (length and depth), but not so inthe third dimension (width). The modified Levenetest (Table 6) gives the same result.
Camelops hesternus
As mentioned above, the CVs of the patellaeof C. hesternus are lower than those of the astra-gali for the length and depth measurements, butnot for the width (Table 1). Using the f-test, the vari-ances of all three dimensions were statisticallyequal, and the t-test (Table 3) shows that themeans are also significantly different because theyfall outside the range of critical values. In theANOVA analysis (Table 5), the length dimensionwas significantly different, but not the width ordepth dimensions. However, the modified Levenetest (Table 6) shows that none of the dimensions ofthe patellae are significantly more variable thanthose of astragali. Thus, C. hesternus gives mixedresults, with some that are consistent with ourhypothesis, and others that are not.
TABLE 6. ANOVA of data transformed by the modified Levene’s method.
Species Measurement F F-critical P-valuePatella signif.
more variable?
Bison antiquus Depth 4.894 3.897 0.029 Yes
(n = 87) Width 0.458 3.897 0.499 No
Length 11.657 3.897 0.001 Yes
Equus occidentalis Depth 79.034 3.887 0.001 Yes
(n = 102) Width 0.800 3.887 0.372 No
Length 4.158 3.887 0.043 Yes
Camelops hesternus Depth 0.004 3.974 0.949 No
(n = 37) Width 1.925 3.974 0.169 No
Length 0.165 3.974 0.686 No
Paramylodon harlani Depth 0.091 3.929 0.762 No
(n = 55) Width 0.040 3.929 0.841 No
Length 0.268 3.929 0.606 No
Smilodon fatalis Depth 26.648 3.854 0.001 Yes
(n = 366) Width 29.412 3.854 0.001 Yes
Length 13397.410 3.854 0.000 Yes
Panthera atrox Depth 0.705 3.916 0.403 No
(n = 64) Width 2.859 3.916 0.093 No
Length 1.895 3.916 0.171 No
11
RAYMOND & PROTHERO: VARIABILITY IN MAMMAL BONES
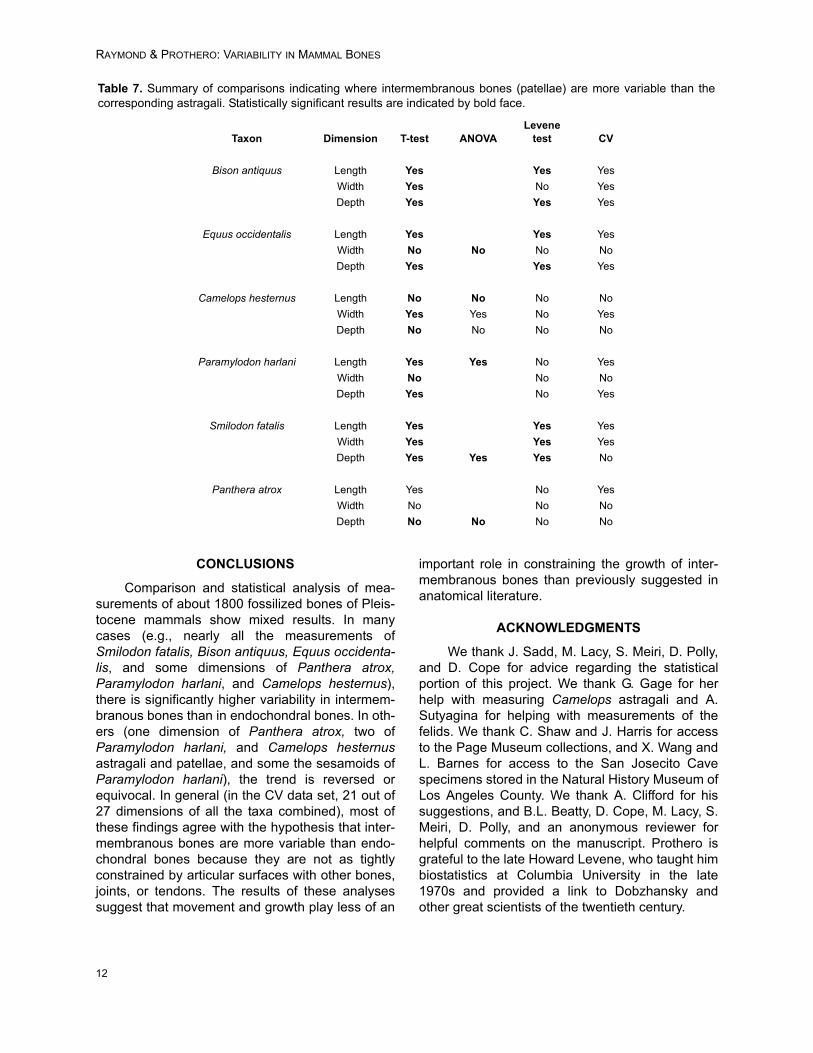
CONCLUSIONS
Comparison and statistical analysis of mea-surements of about 1800 fossilized bones of Pleis-tocene mammals show mixed results. In manycases (e.g., nearly all the measurements ofSmilodon fatalis, Bison antiquus, Equus occidenta-lis, and some dimensions of Panthera atrox,Paramylodon harlani, and Camelops hesternus),there is significantly higher variability in intermem-branous bones than in endochondral bones. In oth-ers (one dimension of Panthera atrox, two ofParamylodon harlani, and Camelops hesternusastragali and patellae, and some the sesamoids ofParamylodon harlani), the trend is reversed orequivocal. In general (in the CV data set, 21 out of27 dimensions of all the taxa combined), most ofthese findings agree with the hypothesis that inter-membranous bones are more variable than endo-chondral bones because they are not as tightlyconstrained by articular surfaces with other bones,joints, or tendons. The results of these analysessuggest that movement and growth play less of an
important role in constraining the growth of inter-membranous bones than previously suggested inanatomical literature.
ACKNOWLEDGMENTS
We thank J. Sadd, M. Lacy, S. Meiri, D. Polly,and D. Cope for advice regarding the statisticalportion of this project. We thank G. Gage for herhelp with measuring Camelops astragali and A.Sutyagina for helping with measurements of thefelids. We thank C. Shaw and J. Harris for accessto the Page Museum collections, and X. Wang andL. Barnes for access to the San Josecito Cavespecimens stored in the Natural History Museum ofLos Angeles County. We thank A. Clifford for hissuggestions, and B.L. Beatty, D. Cope, M. Lacy, S.Meiri, D. Polly, and an anonymous reviewer forhelpful comments on the manuscript. Prothero isgrateful to the late Howard Levene, who taught himbiostatistics at Columbia University in the late1970s and provided a link to Dobzhansky andother great scientists of the twentieth century.
Table 7. Summary of comparisons indicating where intermembranous bones (patellae) are more variable than thecorresponding astragali. Statistically significant results are indicated by bold face.
Taxon Dimension T-test ANOVALevene
test CV
Bison antiquus Length Yes Yes Yes
Width Yes No Yes
Depth Yes Yes Yes
Equus occidentalis Length Yes Yes Yes
Width No No No No
Depth Yes Yes Yes
Camelops hesternus Length No No No No
Width Yes Yes No Yes
Depth No No No No
Paramylodon harlani Length Yes Yes No Yes
Width No No No
Depth Yes No Yes
Smilodon fatalis Length Yes Yes Yes
Width Yes Yes Yes
Depth Yes Yes Yes No
Panthera atrox Length Yes No Yes
Width No No No
Depth No No No No
12
PALAEO-ELECTRONICA.ORG
REFERENCES
Arroyo-Cabrales, J., and Polaco, O.J. 2003. Caves andthe Pleistocene vertebrate paleontology of Mexico,pp. 273-291. In Schubert, B.W., Mead, J.I., and Gra-ham, R.W. (eds.), Ice Age Cave Faunas of NorthAmerica. Indiana University Press. Bloomington.
Bland, Y.S., and Ashhurst, D.E. 1997. Fetal and post-natal development of the patella, patellar tendon andsuprapatella in the rabbit; changes in the distributionof the fibrillar collagens. Journal of Anatomy,190:327-342.
Bongers, E., van Kampen, A., van Bokhoven, H., andKnoers, N. 2005. Human syndromes with congenitalpatellar anomalies and the underlying gene effect.Clinical Genetics, 68(4):302-319.
Currey, J.D. 2006. Bones: Structure and Mechanics.Princeton University Press, Princeton, New Jersey.
Dayan, T., Wool, D., and Simberlofff. D. 2002. Varationand covariation of skulls and teeth: modern carni-vores and the interpretation of fossil mammals. Pale-obiology 28:508-526.
De Iuliis, G., and Cartelle, C. 1999. A new giant megath-eriine ground sloth (Mammalia: Xenarthra: Megath-eriidae) from the late Blancan to early Irvingtonian ofFlorida. Zoological Journal of the Linnaean Society,127:495-515.
Goldberg, I., and Nathan, H. 2004. Anatomy and pathol-ogy of sesamoid bones. International Orthopaedics,1:141-147.
Hall, B.K. 2005. Bones and Cartilage: DevelopmentalSkeletal Biology. Academic Press, London.
Kurtén, B. 1953. On variation and population dynamicsof fossil and recent mammal populations. Acta Zoo-logica Fennica, 76:1-122.
Lande, R. 1977. On comparing coefficients of variation.Systematic Zoology 26:214-217.
Levene, H. 1960, Robust tests for equality of variances.In Olkin, I., Ghurye, G., Hoeffding, W., Madow, W.G.,and Mann, H.B. (eds.), Contributions to Probabilityand Statistics: Stanford University Press, Stanford,California, p. 278-292.
Lewontin, R.C. 1966. On the measurement of relativevariability. Systematic Zoology, 15:141-142.
Marcus, L.F., and Berger, R. 1984. The significance ofradiocarbon dates for Rancho La Brea.. In Martin,P.S., and Klein, R.G. (eds.), Quaternary Extinctions:A Prehistoric Revolution: University of ChicagoPress, Chicago, pp. 159-188.
McDonald, J.N. 1981. North American Bison: Their Clas-sification and Evolution. University of CaliforniaPress, Berkeley, California.
Meiri, S., Dayan, T., and Simberloff, D. 2005. Variabilityand correlations in carnivore crania and dentition.Functional Ecology, 19:337-343.
Merriam, J.C., and Stock, C. 1932. The Felidae of Ran-cho La Brea. Carnegie Institute of Washington Publi-cations, 422.
Plavcan, J.M., and Cope, D.A. 2001. Metric variation andspecies recognition in the fossil record. EvolutionaryAnthropology, 10:204-222.
Polly, P.D. 1998. Variability in mammalian dentitions:size-related bias in the coefficient of variation. Biolog-ical Journal of the Linnaean Society, 64:83-99.
Prothero, D.R. 2005. The Evolution of North AmericanRhinoceroses. Cambridge University Press, Cam-bridge.
Prothero, D.R., and Raymond, K.R. 2008. Variation andsexual size dimorphism in Pleistocene ground sloths(Xenarthra). New Mexico Museum of Natural Historyand Science Bulletin, 44:331-334.
Prothero, D.R., Raymond, K.R., Syverson, V., andMolina S. 2009. Stasis in late Pleistocene birds andmammals from La Brea tar pits over the last glacial-interglacial cycle. Cincinnati Museum Center Scien-tific Contributions, 3:291-292.
Sarin, V.K., Erickson, G.M., Giori, N.G., Bergman, A.G.,and Carter, D.R. 1999. Coincident development ofsesamoid bones and clues to their evolution. Ana-tomical Record, 257:174-180.
Schultz, B.B. 1985. Levene’s test for relative variation.Systematic Zoology, 34:449-456.
Simpson, G.G., Roe, A., and Lewontin, R.C. 1960. Quan-titative Zoology. Harcourt Brace and World, NewYork.
Sokal, R.R. and Rohlf, F.J. 1994. Biometry (3nd ed.).W.H. Freeman, New York.
Sokal, R.R., and Rohlf, F.J. 2009. Introduction to Biosta-tistics (2nd ed.). Dover Press, New York.
Stock, C. 1925. Cenozoic gravigrade edentates of west-ern North America, with special reference to thePleistocene Megalonychidae and Mylodontidae ofRancho La Brea. Carnegie Institute of WashingtonPublications 331.
Stock, C,. and Harris, J.M. 1992. Rancho La Brea: Arecord of Pleistocene Life in California. Natural His-tory Museum of Los Angeles County, Science Series,37:1-113.
Trinkaus, E. 2000. Human patellar articular proportions:Recent and Pleistocene patterns. Journal of Anat-omy, 196:473-483.
Trinkaus, E., and Rhoads, M.L. 1999. Neanderthalknees: power lifters of the Pleistocene? Journal ofHuman Evolution, 73:833-859.
Vickaryous, M.K., and Olson, W. 2007. Sesamoids andossicles in the appendicular skeleton, pp. 323-341. InHall. B.K. (ed.), Fins and Limbs: Evolution, Develop-ment and Transformation. University of ChicagoPress, Chicago.
Walmsley, R. 1940. The development of the patella.Journal of Anatomy 74(3):360-368.
Ward, C.V., Ruff, C.B., Walker, A., Teaford, M.F., Rose,M.D., and Nengo, I.O. 1995. Functional morphologyof Proconsul patellas from Rusinga Island, Kenya,with implications for other Miocene-Pliocene catar-rhines. Journal of Human Evolution, 29:1-19.
13

RAYMOND & PROTHERO: VARIABILITY IN MAMMAL BONES
Webb, S.D. 1965. The osteology of Camelops. Bulletinof the Los Angeles County Museum, Science Series,1:1-54.
Yablokov, A.V. 1974. Variability in Mammals. AmerindPress, New Delhi.
14