Pakuranga West Community of Learning - Kāhui Ako · 2019-08-01 · 4 Community Students in the...
23
Pakuranga West Community of Learning - Kāhui Ako Shared Achievement Challenge 2019 - 2021
Transcript of Pakuranga West Community of Learning - Kāhui Ako · 2019-08-01 · 4 Community Students in the...

Pakuranga West
Community of Learning - Kāhui Ako
Shared Achievement Challenge
2019 - 2021

1
Contents
Page
Introduction 2
Vision for Pakuranga West Kāhui Ako 3
Values for Pakuranga West Kāhui Ako 3
Community 4
Change Levers 5
Collaborative Approach 7
Rationale for selection of achievement challenges 8
Achievement Challenge 1: Wellbeing 9
Achievement Challenge 2: Writing (Years 1-8) 12
Achievement Challenge 3: NCEA Achievement 14
Process Targets 15
Monitoring and evaluation of progress towards targets 16
Reporting 17
Appendices 18
- Appendix A: NZCER Wellbeing@School Survey Data
2
Introduction
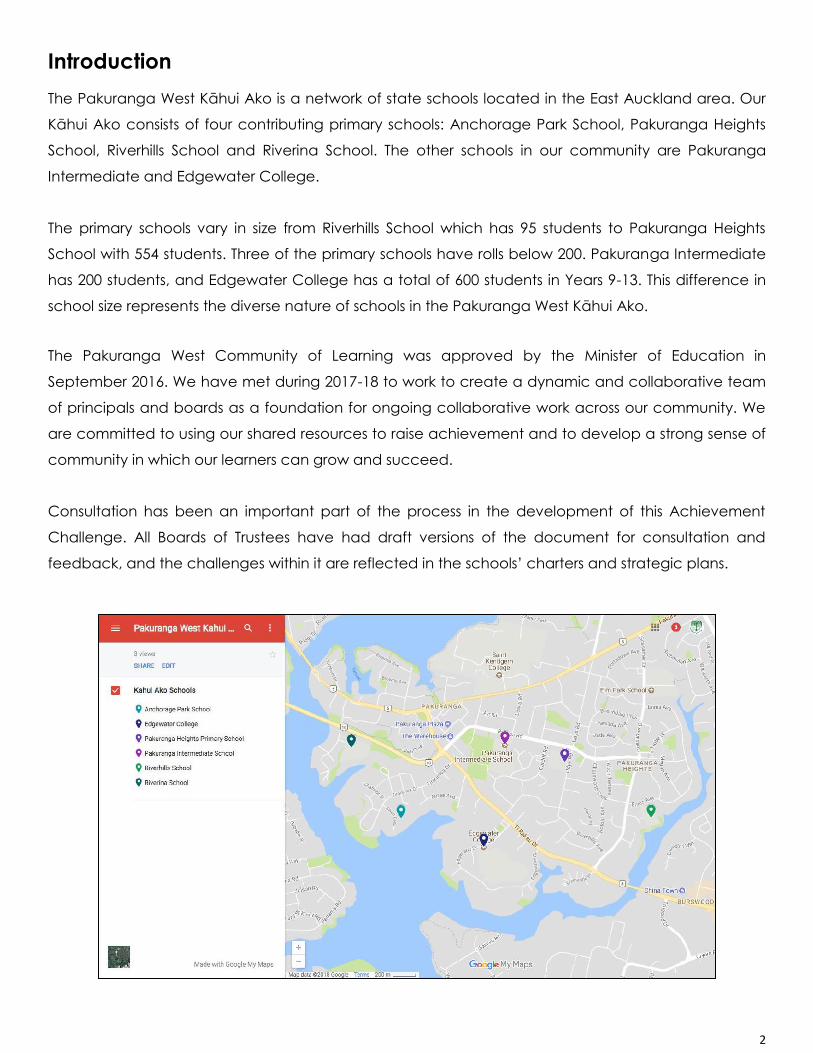
The Pakuranga West Kāhui Ako is a network of state schools located in the East Auckland area. Our
Kāhui Ako consists of four contributing primary schools: Anchorage Park School, Pakuranga Heights
School, Riverhills School and Riverina School. The other schools in our community are Pakuranga
Intermediate and Edgewater College.
The primary schools vary in size from Riverhills School which has 95 students to Pakuranga Heights
School with 554 students. Three of the primary schools have rolls below 200. Pakuranga Intermediate
has 200 students, and Edgewater College has a total of 600 students in Years 9-13. This difference in
school size represents the diverse nature of schools in the Pakuranga West Kāhui Ako.
The Pakuranga West Community of Learning was approved by the Minister of Education in
September 2016. We have met during 2017-18 to work to create a dynamic and collaborative team
of principals and boards as a foundation for ongoing collaborative work across our community. We
are committed to using our shared resources to raise achievement and to develop a strong sense of
community in which our learners can grow and succeed.
Consultation has been an important part of the process in the development of this Achievement
Challenge. All Boards of Trustees have had draft versions of the document for consultation and
feedback, and the challenges within it are reflected in the schools’ charters and strategic plans.

3
Vision for the Pakuranga West Kāhui Ako
Success for all ākonga
Vision Summary Statement:
Success for all ākonga sums up our aspirations for students, staff and community to be;
● Proud of their identity and culture
● Passionate and enthusiastic
● Resilient risks takers
● Problem finders and solvers
● Future leaders
● Communicators and collaborators
Values for the Pakuranga West Kāhui Ako
We value;
● Respect;
the Pakuranga West community of learners demonstrates a high level of respect for
themselves, others and the environment
● Inclusion;
all members of our diverse community are valued
● Collaboration;
we share our strengths and work together in a way that benefits all members of our
community
● Innovation;
we promote innovative thinking and actions

4
Community
Students in the Pakuranga West Kāhui Ako are a diverse group of individuals. To respond to our Kāhui
Ako’s challenges, we need to develop a greater understanding of our community and know our
people so that we can be responsive to them in every way.
Our geographical community forms the western part of the Howick local board. Our schools are all in
the decile 3-4 range, indicating a low-mid socio-economic community. Many of our families live in
rental accommodation, and all schools in the Kāhui Ako experience high levels of transience as
families move in, often seeking more affordable housing in other areas.
ERO identified the follow common strengths across the Kāhui Ako:
● strong inclusive school cultures
● positive relationships with school communities
● positive and settled learning environments
● good support for students requiring additional learning support
● broad curriculum and teaching and learning programmes that promote student
engagement.
(ERO, Pakuranga West Community of Learning Report, 2016)
We are a culturally diverse community and this is reflected in the ethnic composition of our schools as
shown in the table below.
Ethnic breakdown across the Kāhui Ako:
Number Percentage
NZ Māori 435 25%
Pacific 569 33%
Asian 314 18%
NZ European 288 17%
Other Ethnicities 111 6%
Total 1717 100%
5
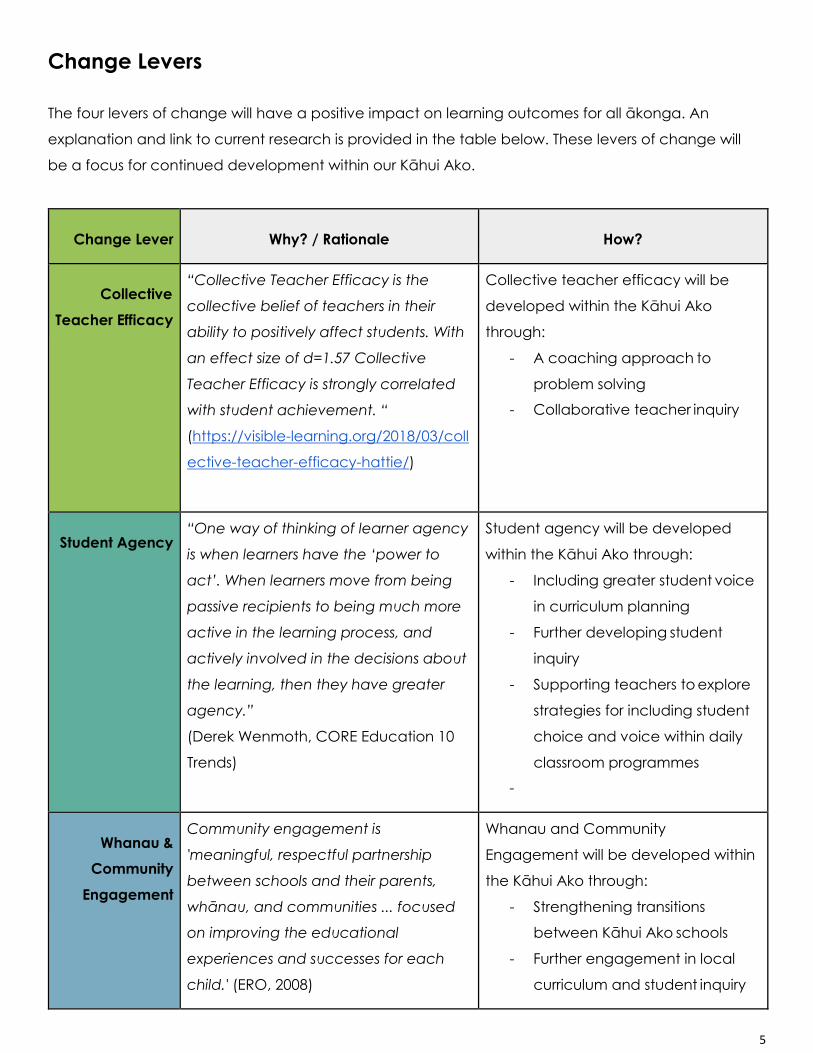
Change Levers
The four levers of change will have a positive impact on learning outcomes for all ākonga. An
explanation and link to current research is provided in the table below. These levers of change will
be a focus for continued development within our Kāhui Ako.
Change Lever
Why? / Rationale
How?
Collective
Teacher Efficacy
“Collective Teacher Efficacy is the
collective belief of teachers in their
ability to positively affect students. With
an effect size of d=1.57 Collective
Teacher Efficacy is strongly correlated
with student achievement. “
(https://visible-learning.org/2018/03/coll
ective-teacher-efficacy-hattie/)
Collective teacher efficacy will be
developed within the Kāhui Ako
through:
- A coaching approach to
problem solving
- Collaborative teacher inquiry
Student Agency
“One way of thinking of learner agency
is when learners have the ‘power to
act’. When learners move from being
passive recipients to being much more
active in the learning process, and
actively involved in the decisions about
the learning, then they have greater
agency.”
(Derek Wenmoth, CORE Education 10
Trends)
Student agency will be developed
within the Kāhui Ako through:
- Including greater student voice
in curriculum planning
- Further developing student
inquiry
- Supporting teachers to explore
strategies for including student
choice and voice within daily
classroom programmes
-
Whanau &
Community
Engagement
Community engagement is
'meaningful, respectful partnership
between schools and their parents,
whānau, and communities ... focused
on improving the educational
experiences and successes for each
child.' (ERO, 2008)
Whanau and Community
Engagement will be developed within
the Kāhui Ako through:
- Strengthening transitions
between Kāhui Ako schools
- Further engagement in local
curriculum and student inquiry
6
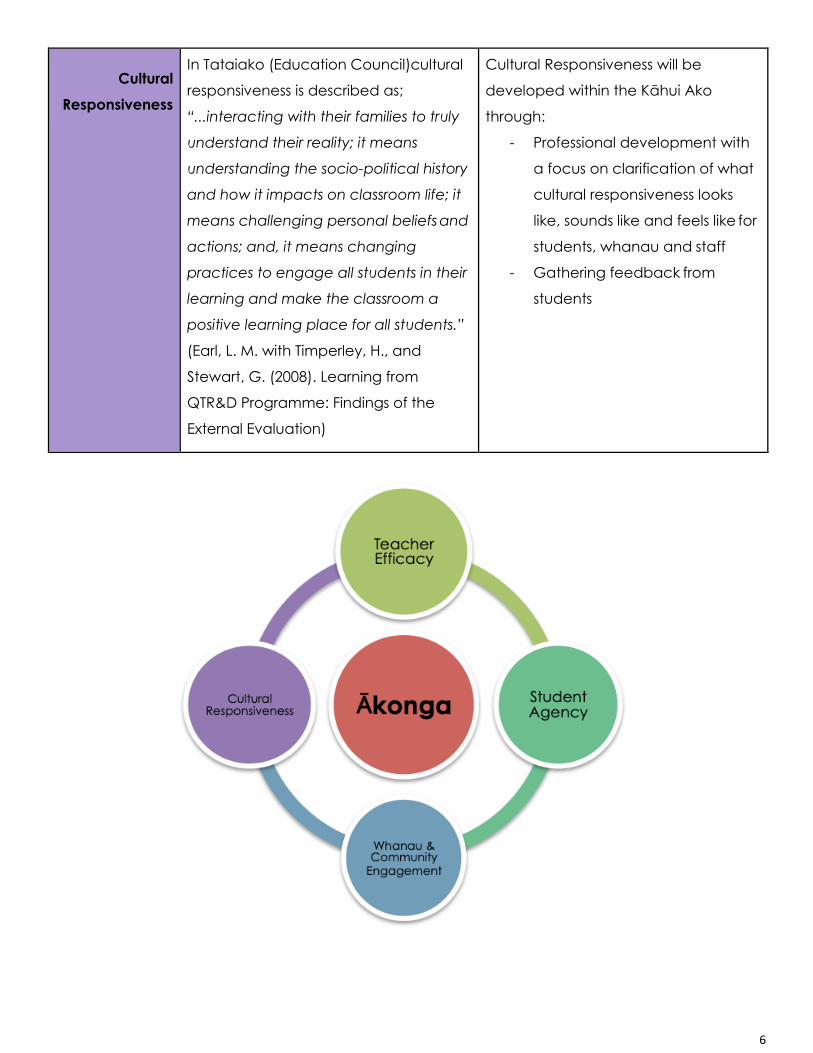
Cultural
Responsiveness
In Tataiako (Education Council)cultural
responsiveness is described as;
“...interacting with their families to truly
understand their reality; it means
understanding the socio-political history
and how it impacts on classroom life; it
means challenging personal beliefs and
actions; and, it means changing
practices to engage all students in their
learning and make the classroom a
positive learning place for all students.”
(Earl, L. M. with Timperley, H., and
Stewart, G. (2008). Learning from
QTR&D Programme: Findings of the
External Evaluation)
Cultural Responsiveness will be
developed within the Kāhui Ako
through:
- Professional development with
a focus on clarification of what
cultural responsiveness looks
like, sounds like and feels like for
students, whanau and staff
- Gathering feedback from
students

7
Collaborative Approach
An inquiry process will underpin our work, which will require a collaborative and collective approach.
Kāhui Ako appointed roles:
● The lead principal will communicate and liaise with all Kāhui Ako schools through regular
meetings with the principal’s group, as well as individually with principals and boards, with a
focus on promoting progress towards achievement challenge targets across all schools.
● The across school leaders will collaborate and liaise with the lead principal to develop action
plans to enable implementation of the achievement challenges, and will work with within
school leaders to facilitate these.
● The within school lead teachers will collaborate with school leaders and across school leaders
to co-construct school based strategies for their context, and will provide coaching and
support to classroom teachers.
A networked approach that places learners at the centre will enable effective collaboration that
supports progress towards achievement challenge targets.

8
Rationale for selection of achievement challenges
Our Kāhui Ako is made up of schools that vary greatly in decile and school size. A consistent factor
across all of the Kāhui Ako schools is the culturally diverse community that they serve.
In forming areas to focus on for this achievement challenge, school leaders surveyed students and
school communities, then gathered and analysed data in order to identify emerging themes. As a
Kāhui Ako we synthesised the emerging themes and agreed on the follow areas:
● Well-being
● Literacy - Writing
● NCEA - Level 2 and 3
These agreed areas are a reflection of the needs of our students to enable them to be successful in
the future.
Further rationale for each area is included with each achievement challenge below.
9
Achievement Challenge 1: Student Wellbeing
Rationale
Well-being is central to the vision, values and principles of the New Zealand Curriculum, Te Whāriki,
and our shared values and vision statement above. Our learning community share the belief that if
our students are to be confident, connected, actively-involved lifelong learners, they need to feel
safe and secure, have equitable learning opportunities and have their culture, language and identity
recognised and valued.
“Student wellbeing is strongly linked to learning. A student’s level of wellbeing at school is
indicated by their satisfaction with life at school, their engagement with learning and their
social-emotional behaviour. It is enhanced when evidence-informed practices are adopted by
schools in partnership with families and community. Optimal student wellbeing is a sustainable
state, characterised by predominantly positive feelings and attitude, positive relationships at
school, resilience, self-optimism and a high level of satisfaction with learning experiences”.
(ERO Wellbeing for success: A Resource for Schools, March 2016)
This achievement challenge will focus on evaluation and improvement of student wellbeing across
the Pakuranga West Kāhui Ako.
Each school in the Kāhui Ako has gathered data from their student population to identify areas of
relative strength and weakness. We used the Wellbeing@school student survey (NZCER) to gather this
baseline data from students in Year 5 to Year 10. Refer to Appendix A for further survey results.
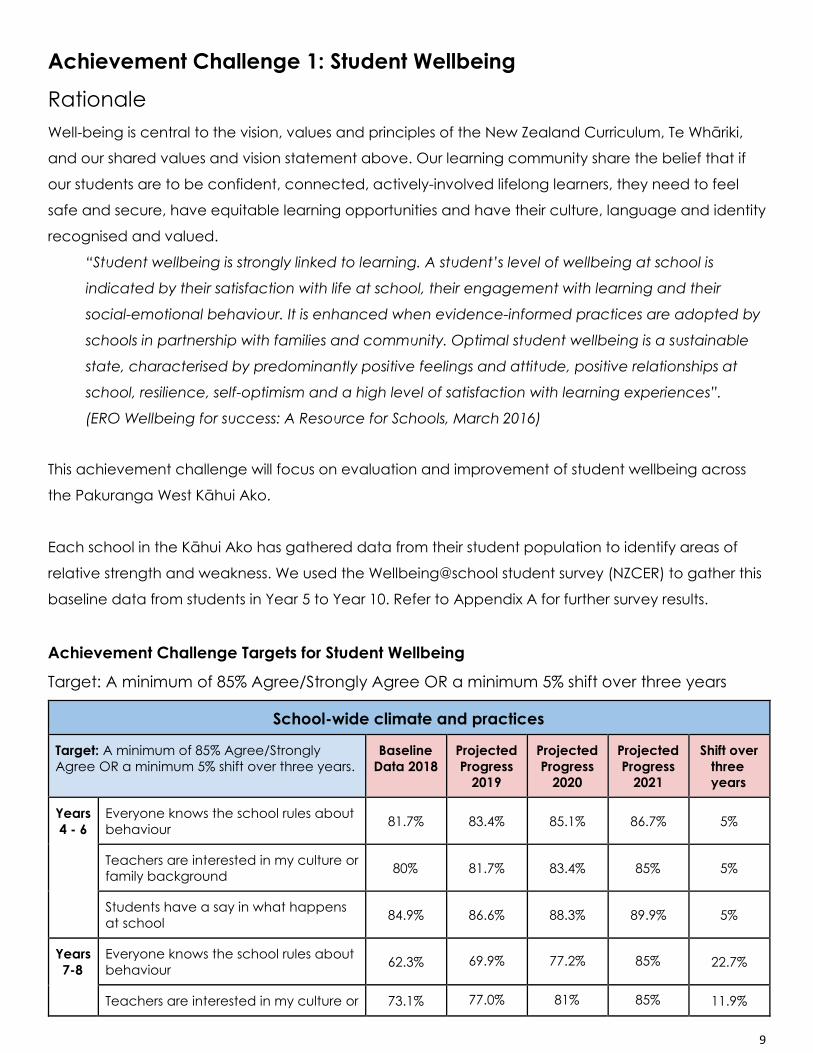
Achievement Challenge Targets for Student Wellbeing
Target: A minimum of 85% Agree/Strongly Agree OR a minimum 5% shift over three years
School-wide climate and practices
Target: A minimum of 85% Agree/Strongly
Agree OR a minimum 5% shift over three years.
Baseline
Data 2018
Projected
Progress
2019
Projected
Progress
2020
Projected
Progress
2021
Shift over
three
years
Years
4 - 6
Everyone knows the school rules about
behaviour 81.7% 83.4% 85.1% 86.7% 5%
Teachers are interested in my culture or
family background 80% 81.7% 83.4% 85% 5%
Students have a say in what happens
at school 84.9% 86.6% 88.3% 89.9% 5%
Years
7-8
Everyone knows the school rules about
behaviour 62.3% 69.9% 77.2% 85% 22.7%
Teachers are interested in my culture or 73.1% 77.0% 81% 85% 11.9%
10
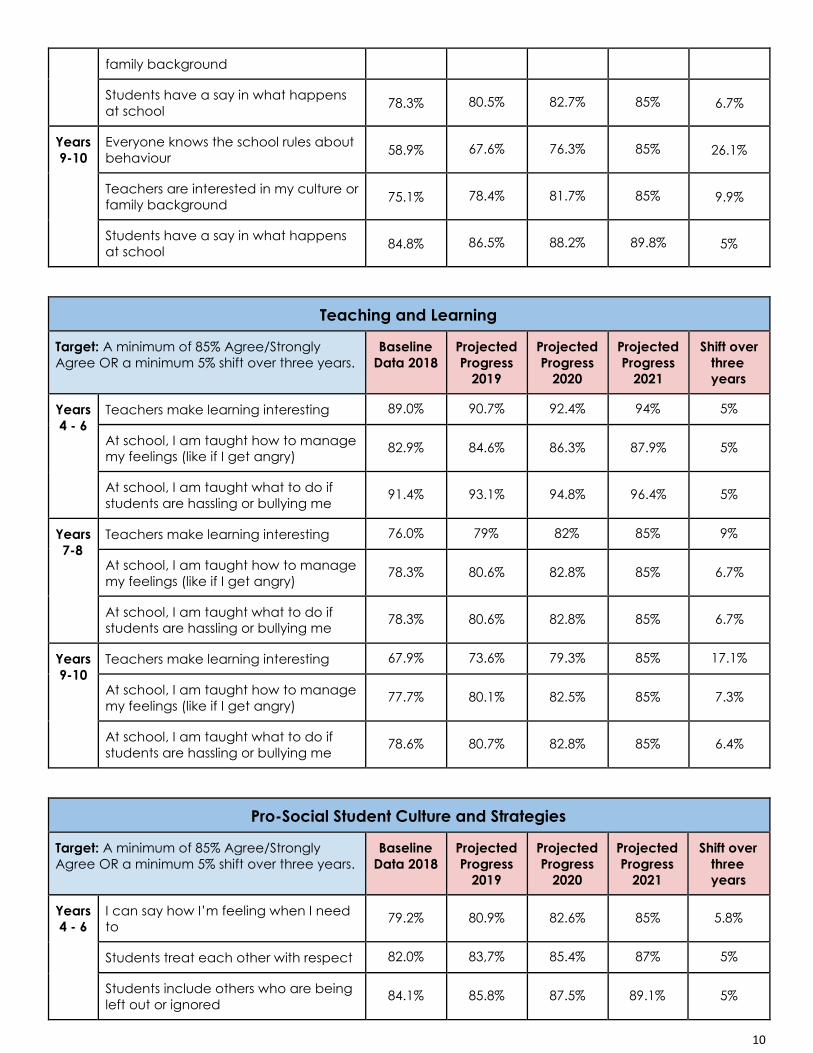
family background
Students have a say in what happens
at school 78.3% 80.5% 82.7% 85% 6.7%
Years
9-10
Everyone knows the school rules about
behaviour 58.9% 67.6% 76.3% 85% 26.1%
Teachers are interested in my culture or
family background 75.1% 78.4% 81.7% 85% 9.9%
Students have a say in what happens
at school 84.8% 86.5% 88.2% 89.8% 5%
Teaching and Learning
Target: A minimum of 85% Agree/Strongly
Agree OR a minimum 5% shift over three years.
Baseline
Data 2018
Projected
Progress
2019
Projected
Progress
2020
Projected
Progress
2021
Shift over
three
years
Years
4 - 6
Teachers make learning interesting 89.0% 90.7% 92.4% 94% 5%
At school, I am taught how to manage
my feelings (like if I get angry) 82.9% 84.6% 86.3% 87.9% 5%
At school, I am taught what to do if
students are hassling or bullying me 91.4% 93.1% 94.8% 96.4% 5%
Years
7-8
Teachers make learning interesting 76.0% 79% 82% 85% 9%
At school, I am taught how to manage
my feelings (like if I get angry) 78.3% 80.6% 82.8% 85% 6.7%
At school, I am taught what to do if
students are hassling or bullying me 78.3% 80.6% 82.8% 85% 6.7%
Years
9-10
Teachers make learning interesting 67.9% 73.6% 79.3% 85% 17.1%
At school, I am taught how to manage
my feelings (like if I get angry) 77.7% 80.1% 82.5% 85% 7.3%
At school, I am taught what to do if
students are hassling or bullying me 78.6% 80.7% 82.8% 85% 6.4%
Pro-Social Student Culture and Strategies
Target: A minimum of 85% Agree/Strongly
Agree OR a minimum 5% shift over three years.
Baseline
Data 2018
Projected
Progress
2019
Projected
Progress
2020
Projected
Progress
2021
Shift over
three
years
Years
4 - 6
I can say how I’m feeling when I need
to 79.2% 80.9% 82.6% 85% 5.8%
Students treat each other with respect 82.0% 83,7% 85.4% 87% 5%
Students include others who are being
left out or ignored 84.1% 85.8% 87.5% 89.1% 5%

11
Students treat teachers with respect 90.6% 92.3% 94% 95.6% 5%
Years
7-8
I can say how I’m feeling when I need
to 67.4% 73.2% 79% 85% 17.6%
Students treat each other with respect 53.7% 64.1% 74.5% 85% 31.3%
Students include others who are being
left out or ignored 71.4% 75.9% 80.4% 85% 13.6%
Students treat teachers with respect 63.4% 70.6% 77.8% 85% 21.6%
Years
9-10
I can say how I’m feeling when I need
to 66.1% 72.4% 78.7% 85% 18.9%
Students treat each other with respect 70.5% 75.3% 80.1% 85% 14.5%
Students include others who are being
left out or ignored 80.4% 82.1% 83.8% 85.4% 5%
Students treat teachers with respect 63.4% 70.6% 77.8% 85% 21.6%
Aggressive Student Culture
Target: A minimum of 85% Never/1-2 times per
year OR a minimum 5% shift over three years.
Baseline
Data 2018
Projected
Progress
2019
Projected
Progress
2020
Projected
Progress
2021
Shift over
three
years
Years
4 - 6
Do other students put you down, call
you names, or tease you in a mean
way?
66.1%
72.4%
78.7%
85%
18.9%
Do other students leave you out or
ignore you on purpose? 73.1% 77.1% 81% 85% 11.9%
Do other students tell lies or spread
rumours about you? 71.4% 75.9% 80.4% 85% 13.6%
Years
7-8
Do other students put you down, call
you names, or tease you in a mean
way?
56.6%
66.1%
75.6%
85%
28.4%
Do other students leave you out or
ignore you on purpose? 69.1% 74.4% 79.7% 85% 15.9%
Do other students tell lies or spread
rumours about you? 65.1% 71.7% 78.3% 85% 19.9%
Years
9-10
Do other students put you down, call
you names, or tease you in a mean
way?
71.4%
75.9%
80.4%
85%
13.6%
Do other students leave you out or
ignore you on purpose? 73.2% 77% 81% 85% 11.8%
Do other students tell lies or spread
rumours about you? 78.6% 80.7% 82.8% 85% 6.4%

12
Achievement Challenge 2: Writing (Years 1-8)
Rationale
Good literacy levels are key to so much learning, understanding, and ability to contribute in work,
family and society. For all students to become confident and capable writers there is a need for a
strong focus on writing across the Kāhui Ako.
There is a history of collaboration between the smaller primary schools in regards to moderation of
writing assessments, which will provide a strong foundation for our collaborative work.
Data from across the Kāhui Ako has highlighted a need to focus on raising achievement specifically
for:
● NZ Māori students
● Pacific students
● Male students
● Students in Year 3
Achievement Challenge Targets for Writing (Years 1-8)
Target: An aspirational target of 85% At/Above NZ Curriculum expectations for year level OR
a minimum 5% shift over three years for identified groups of students (shown in the table
below)
Years 1-8 Writing Achievement
Target: 85% Baseline Data
end of 2018
Projected
Progress 2020
Projected
Progress 2021
Projected
Progress 2022
Shift over
three years
All students 73.8% 78% 81.5% 85% 11.2%
Māori 67.6% 73.4% 79.2% 85% 17.4%
Pacific 70.4% 75.2% 80.1% 85% 14.6%
Male 69% 74.3% 79.6% 85% 16%
End of Year 5 64.1% 71% 77.9% 85% 20.9%
(An average shift of 16.02% over three years)

13
Achievement Challenge 2: Writing : Summary statements
Writing Focus
Year 1-8:
In 2018, 73.8% (817) of our students
were “At or Above” curriculum
expectation in Writing for Years 1-8.
We will lift this to 85%, (940), a 11.2%
shift by the end of 2022. This will
mean shifting 123 additional
students from “Below and Well
Below” to “At or above”.
We will achieve an average of a
3.7% shift, annually.
Within our overall goal of shifting 123 additional
students there are 4 sub goals that are a collective focus:
Māori:
We aim to lift the achievement of all our Māori students in
Writing from 67.6% (192) to 85% (241),a 17.4% shift by the
end of 2022.
This is a shift of 49 more Māori students (which is part of our
target of 123 students overall).
Pacific:
We aim to lift the achievement of Pacific students in Writing
from 70.4% (190) to 85% (230),a 14.6% shift by the end of
2022.
This is a shift of 40 more Pacific students (which is part of our
target of 123 students overall).
Male:
We aim to lift the achievement of male students in Writing
from 69% (394) to 85% (485),a 16% shift by the end of 2022.
This is a shift of 91 more boys (which is part of our target of
123 students overall).
End of Year 5:
We aim to lift the achievement of Year 5 students in Writing
from 64.1% (82) to 85% (109),a 20.9% shift by the end of 2022.
This is a shift of 27 more Year 5 students (which is part of our
target of 123 students overall).
Shifting “At to Above”
In 2018, 23.6% (261) of our students were “Above ” the curriculum expectation in Writing for Years
1-8.
We will lift this to 28.6% (310), a 5% shift by the end of 2022. This will mean shifting 49 additional
students. to ‘Above.’
We will achieve a 1.7% shift annually.
14
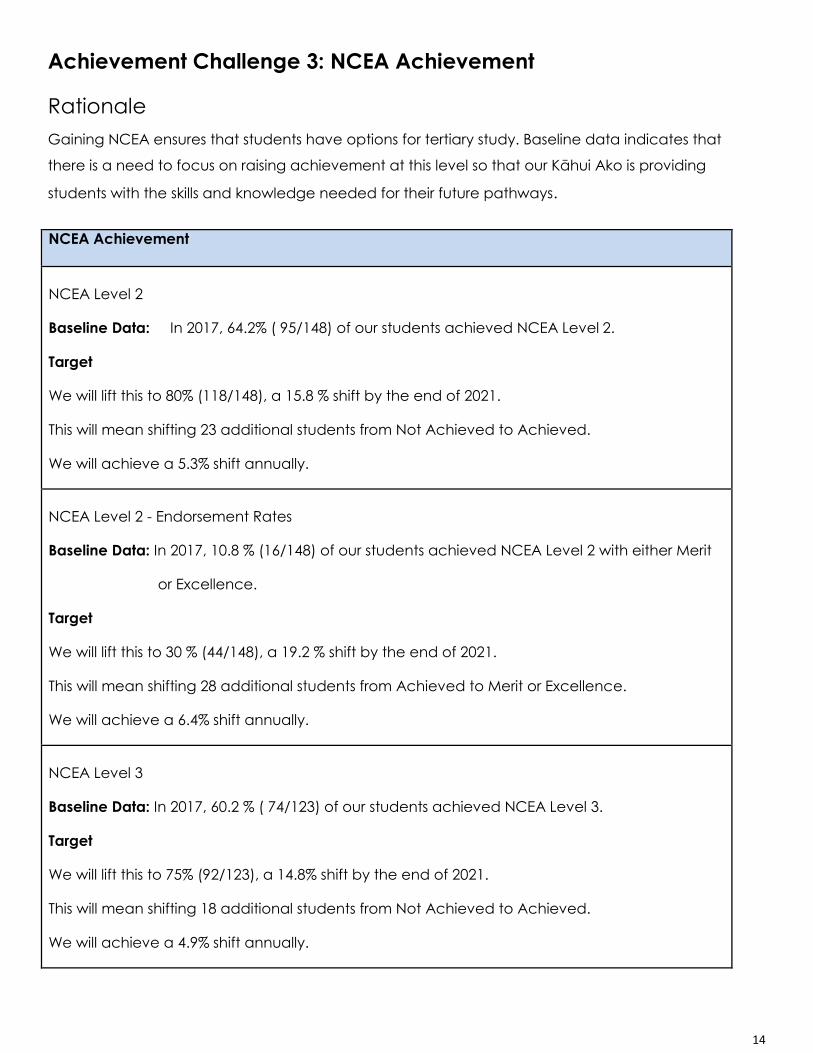
Achievement Challenge 3: NCEA Achievement
Rationale
Gaining NCEA ensures that students have options for tertiary study. Baseline data indicates that
there is a need to focus on raising achievement at this level so that our Kāhui Ako is providing
students with the skills and knowledge needed for their future pathways.
NCEA Achievement
NCEA Level 2
Baseline Data: In 2017, 64.2% ( 95/148) of our students achieved NCEA Level 2.
Target
We will lift this to 80% (118/148), a 15.8 % shift by the end of 2021.
This will mean shifting 23 additional students from Not Achieved to Achieved.
We will achieve a 5.3% shift annually.
NCEA Level 2 - Endorsement Rates
Baseline Data: In 2017, 10.8 % (16/148) of our students achieved NCEA Level 2 with either Merit
or Excellence.
Target
We will lift this to 30 % (44/148), a 19.2 % shift by the end of 2021.
This will mean shifting 28 additional students from Achieved to Merit or Excellence.
We will achieve a 6.4% shift annually.
NCEA Level 3
Baseline Data: In 2017, 60.2 % ( 74/123) of our students achieved NCEA Level 3.
Target
We will lift this to 75% (92/123), a 14.8% shift by the end of 2021.
This will mean shifting 18 additional students from Not Achieved to Achieved.
We will achieve a 4.9% shift annually.
15
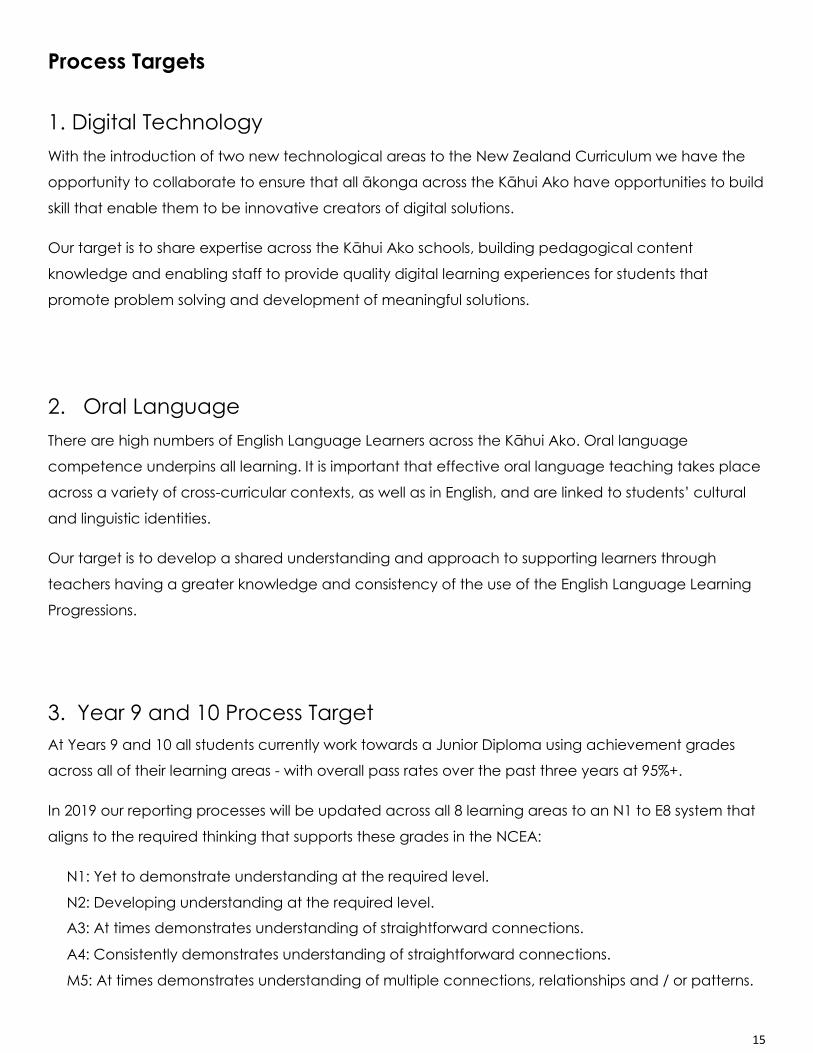
Process Targets
1. Digital Technology
With the introduction of two new technological areas to the New Zealand Curriculum we have the
opportunity to collaborate to ensure that all ākonga across the Kāhui Ako have opportunities to build
skill that enable them to be innovative creators of digital solutions.
Our target is to share expertise across the Kāhui Ako schools, building pedagogical content
knowledge and enabling staff to provide quality digital learning experiences for students that
promote problem solving and development of meaningful solutions.
2. Oral Language
There are high numbers of English Language Learners across the Kāhui Ako. Oral language
competence underpins all learning. It is important that effective oral language teaching takes place
across a variety of cross-curricular contexts, as well as in English, and are linked to students’ cultural
and linguistic identities.
Our target is to develop a shared understanding and approach to supporting learners through
teachers having a greater knowledge and consistency of the use of the English Language Learning
Progressions.
3. Year 9 and 10 Process Target
At Years 9 and 10 all students currently work towards a Junior Diploma using achievement grades
across all of their learning areas - with overall pass rates over the past three years at 95%+.
In 2019 our reporting processes will be updated across all 8 learning areas to an N1 to E8 system that
aligns to the required thinking that supports these grades in the NCEA:
N1: Yet to demonstrate understanding at the required level.
N2: Developing understanding at the required level.
A3: At times demonstrates understanding of straightforward connections.
A4: Consistently demonstrates understanding of straightforward connections.
M5: At times demonstrates understanding of multiple connections, relationships and / or patterns.

16
M6: Consistently demonstrates understanding of multiple connections, relationships and / or
patterns.
E7: At times demonstrates understanding that is integrated, comprehensive and / or perceptive.
E8: Consistently demonstrates understanding that is integrated, comprehensive, and / or
perceptive.
Alongside this change a system for evaluating and reporting against learner agency will be
implemented by assessing behaviours that are known to support learner agency.
This will support the establishment of baseline data for setting targets in 2020 and beyond in both
learning area achievement and in measures of learner agency.
Monitoring and evaluation of progress towards targets
We will monitor progress towards our targets.
Within school leaders will:
● collect relevant data annually (e.g. NZCER survey)
● Identify priority learners and track their progress in the focus areas
● collate and analyse the data from their school
● Regular meeting with across school leaders to discuss progress (based on data and anecdotal
evidence)
● Gather feedback from stakeholders (e.g. student voice, staff, parents)
Across school leaders will:
● Collate data from individual schools and analyse
● Identify emerging changes in practice and/or professional development needs
● Report back to lead principals
Lead Principal will:
● Review recommendations from across school leaders in order to align professional learning
needs of the Kāhui Ako
● Report back to school leaders, school communities and Boards of Trustees on
○ Student progress and achievement
○ Any significant shifts in school practices or culture
○ Emerging learnings and challenges
Principals will:
● Collate data as required and ensure that each school is addressing the achievement
challenges

17
● Report to their board of trustees and school community on the work, progress and
achievements of the Kāhui Ako
Reporting
The lead principal will coordinate the preparation of reports for Kāhui Ako Boards of Trustees and
community. These reports will include the following as relevant:
● Identification of strategic steps taken towards the targets set in the achievement challenge
● Student achievement data and analysis of this in relation to targets
● Emerging evidence of changes in pedagogy and school practices
● Next steps or areas of focus
● Any issues or challenges arising
Each school in the Kāhui Ako will have its own charter, strategic plan and annual plan. Within the
school documentation there will be reference to the Kāhui Ako’s achievement challenges. Schools
will report on their own annual targets in the Analysis of Variance.
(Collaboration will be the key to our work).
18
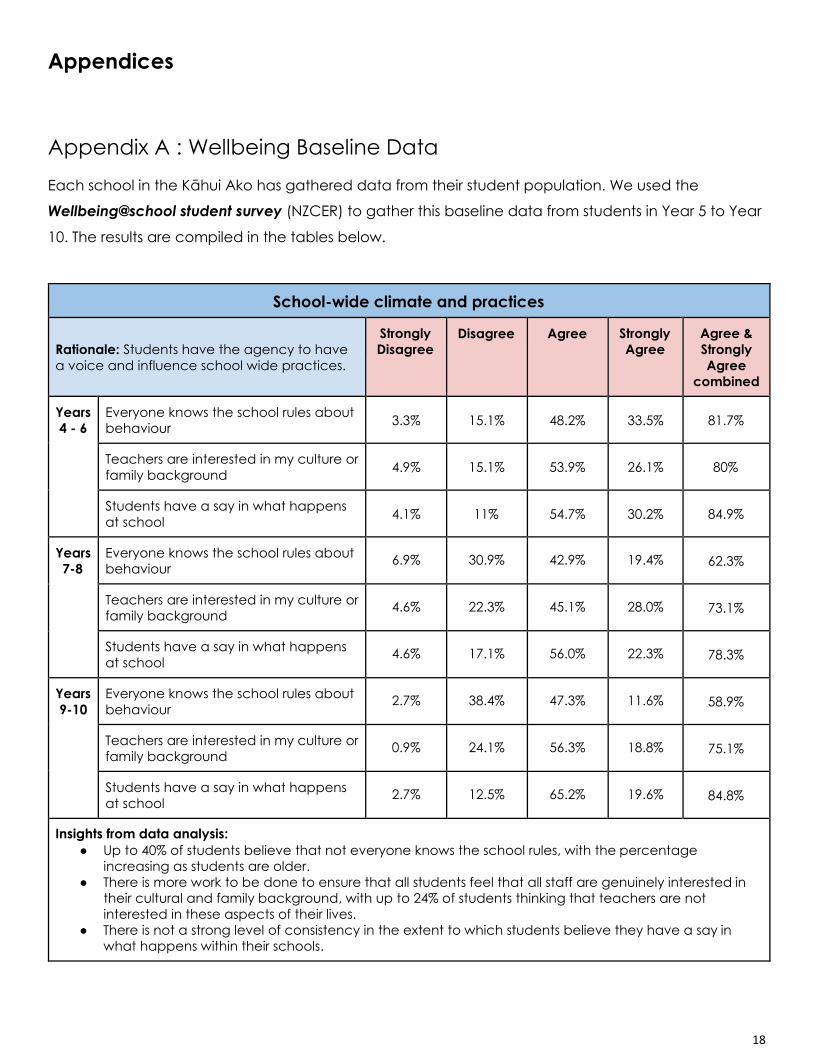
Appendices
Appendix A : Wellbeing Baseline Data
Each school in the Kāhui Ako has gathered data from their student population. We used the
Wellbeing@school student survey (NZCER) to gather this baseline data from students in Year 5 to Year
10. The results are compiled in the tables below.
School-wide climate and practices
Rationale: Students have the agency to have
a voice and influence school wide practices.
Strongly
Disagree Disagree Agree Strongly
Agree
Agree &
Strongly
Agree
combined
Years
4 - 6
Everyone knows the school rules about
behaviour 3.3% 15.1% 48.2% 33.5% 81.7%
Teachers are interested in my culture or
family background 4.9% 15.1% 53.9% 26.1% 80%
Students have a say in what happens
at school 4.1% 11% 54.7% 30.2% 84.9%
Years
7-8
Everyone knows the school rules about
behaviour 6.9% 30.9% 42.9% 19.4% 62.3%
Teachers are interested in my culture or
family background 4.6% 22.3% 45.1% 28.0% 73.1%
Students have a say in what happens
at school 4.6% 17.1% 56.0% 22.3% 78.3%
Years
9-10
Everyone knows the school rules about
behaviour 2.7% 38.4% 47.3% 11.6% 58.9%
Teachers are interested in my culture or
family background 0.9% 24.1% 56.3% 18.8% 75.1%
Students have a say in what happens
at school 2.7% 12.5% 65.2% 19.6% 84.8%
Insights from data analysis:
● Up to 40% of students believe that not everyone knows the school rules, with the percentage
increasing as students are older.
● There is more work to be done to ensure that all students feel that all staff are genuinely interested in
their cultural and family background, with up to 24% of students thinking that teachers are not
interested in these aspects of their lives.
● There is not a strong level of consistency in the extent to which students believe they have a say in
what happens within their schools.

19
Teaching and Learning
Rationale: Meaningful relationships developed
where genuine care is demonstrated between
teachers and learners.
Strongly
Disagree
Disagree Agree Strongly
Agree
Agree &
Strongly
Agree
combined
Years
4 - 6 Teachers make learning interesting 1.6% 9.4% 39.6% 49.4% 89.0%
At school, I am taught how to manage
my feelings (like if I get angry) 4.1% 13.1% 34.7% 48.2% 82.9%
At school, I am taught what to do if
students are hassling or bullying me 3.7% 4.9% 29.4% 62.0% 91.4%
Years
7-8
Teachers make learning interesting 5.7% 18.3% 44.0% 32.0% 76.0%
At school, I am taught how to manage
my feelings (like if I get angry) 7.4% 14.3% 45.7% 32.6% 78.3%
At school, I am taught what to do if
students are hassling or bullying me 9.1% 12.6% 45.1% 33.1% 78.3%
Years
9-10
Teachers make learning interesting 3.6% 28.6% 50.9% 17.0% 67.9%
At school, I am taught how to manage
my feelings (like if I get angry) 3.6% 18.8% 55.4% 22.3% 77.7%
At school, I am taught what to do if
students are hassling or bullying me 2.7% 18.8% 50.0% 28.6% 78.6%
Insights from data analysis:
● Younger students are more engaged in learning that is interesting to them than older students within
the Kāhui Ako, with over 30% of Year 9 and 10 students disagreeing that teachers make learning
interesting.
● The level of specific teaching about managing feelings and strategies for dealing with problems
involving other students is not consistent across all levels of schooling.
Pro-Social Student Culture and Strategies
Rationale: Students are empowered. They
engage in respectful relationships that value
diversity.
Strongly
Disagree
Disagree Agree Strongly
Agree
Agree &
Strongly
Agree
combined
Years
4 - 6
I can say how I’m feeling when I need
to 5.3% 15.5% 46.9% 32.2% 79.2%
Students treat each other with respect 2.9% 15.1% 58.8% 23.3% 82.0%
Students include others who are being
left out or ignored 4.1% 11.8% 49.8% 34.3% 84.1%
20
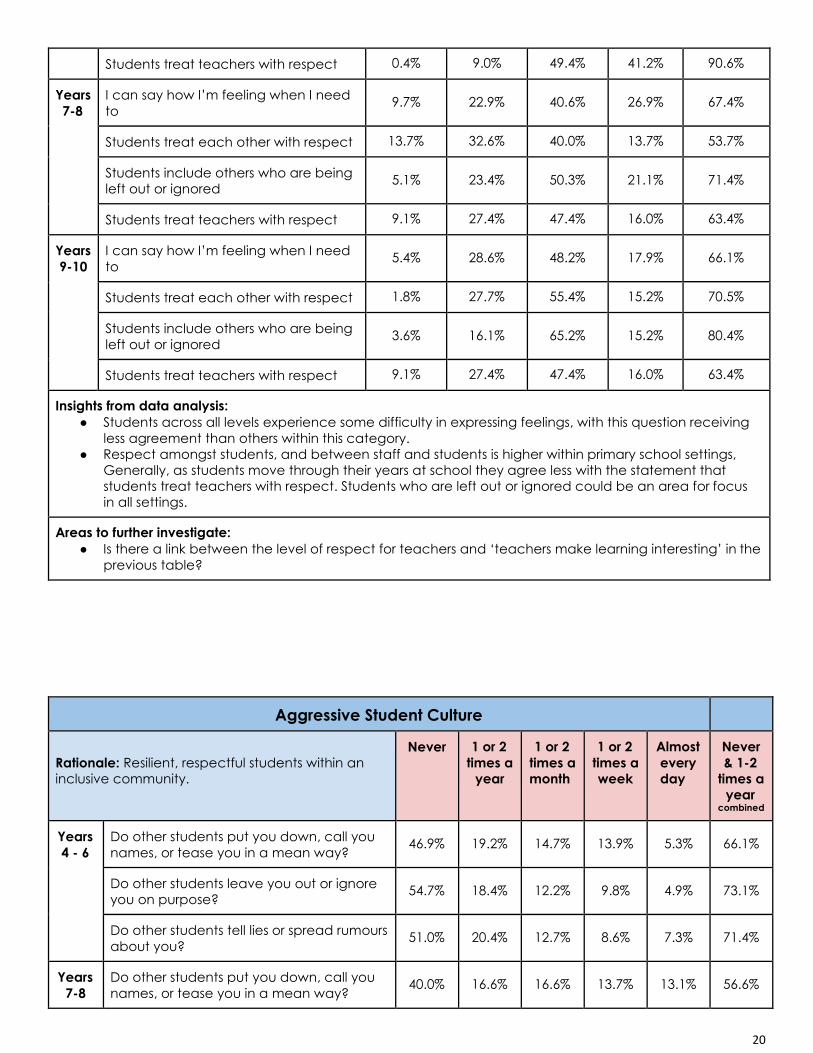
Students treat teachers with respect 0.4% 9.0% 49.4% 41.2% 90.6%
Years
7-8
I can say how I’m feeling when I need
to 9.7% 22.9% 40.6% 26.9% 67.4%
Students treat each other with respect 13.7% 32.6% 40.0% 13.7% 53.7%
Students include others who are being
left out or ignored 5.1% 23.4% 50.3% 21.1% 71.4%
Students treat teachers with respect 9.1% 27.4% 47.4% 16.0% 63.4%
Years
9-10
I can say how I’m feeling when I need
to 5.4% 28.6% 48.2% 17.9% 66.1%
Students treat each other with respect 1.8% 27.7% 55.4% 15.2% 70.5%
Students include others who are being
left out or ignored 3.6% 16.1% 65.2% 15.2% 80.4%
Students treat teachers with respect 9.1% 27.4% 47.4% 16.0% 63.4%
Insights from data analysis:
● Students across all levels experience some difficulty in expressing feelings, with this question receiving
less agreement than others within this category.
● Respect amongst students, and between staff and students is higher within primary school settings,
Generally, as students move through their years at school they agree less with the statement that
students treat teachers with respect. Students who are left out or ignored could be an area for focus
in all settings.
Areas to further investigate:
● Is there a link between the level of respect for teachers and ‘teachers make learning interesting’ in the
previous table?
Aggressive Student Culture
Rationale: Resilient, respectful students within an
inclusive community.
Never 1 or 2
times a
year
1 or 2
times a
month
1 or 2
times a
week
Almost
every
day
Never
& 1-2
times a
year combined
Years
4 - 6
Do other students put you down, call you
names, or tease you in a mean way? 46.9% 19.2% 14.7% 13.9% 5.3% 66.1%
Do other students leave you out or ignore
you on purpose? 54.7% 18.4% 12.2% 9.8% 4.9% 73.1%
Do other students tell lies or spread rumours
about you? 51.0% 20.4% 12.7% 8.6% 7.3% 71.4%
Years
7-8
Do other students put you down, call you
names, or tease you in a mean way? 40.0% 16.6% 16.6% 13.7% 13.1% 56.6%
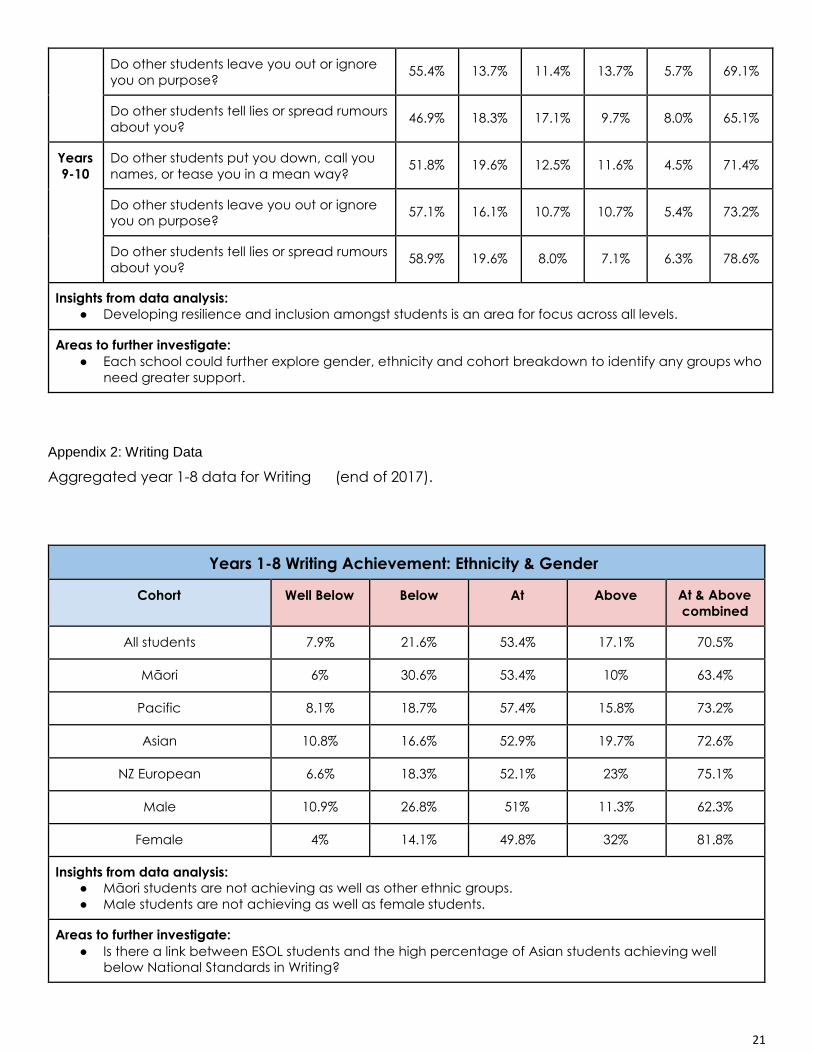
21
Do other students leave you out or ignore
you on purpose? 55.4% 13.7% 11.4% 13.7% 5.7% 69.1%
Do other students tell lies or spread rumours
about you? 46.9% 18.3% 17.1% 9.7% 8.0% 65.1%
Years
9-10
Do other students put you down, call you
names, or tease you in a mean way? 51.8% 19.6% 12.5% 11.6% 4.5% 71.4%
Do other students leave you out or ignore
you on purpose? 57.1% 16.1% 10.7% 10.7% 5.4% 73.2%
Do other students tell lies or spread rumours
about you? 58.9% 19.6% 8.0% 7.1% 6.3% 78.6%
Insights from data analysis:
● Developing resilience and inclusion amongst students is an area for focus across all levels.
Areas to further investigate:
● Each school could further explore gender, ethnicity and cohort breakdown to identify any groups who
need greater support.
Appendix 2: Writing Data
Aggregated year 1-8 data for Writing (end of 2017).
Years 1-8 Writing Achievement: Ethnicity & Gender
Cohort Well Below Below At Above At & Above
combined
All students 7.9% 21.6% 53.4% 17.1% 70.5%
Māori 6% 30.6% 53.4% 10% 63.4%
Pacific 8.1% 18.7% 57.4% 15.8% 73.2%
Asian 10.8% 16.6% 52.9% 19.7% 72.6%
NZ European 6.6% 18.3% 52.1% 23% 75.1%
Male 10.9% 26.8% 51% 11.3% 62.3%
Female 4% 14.1% 49.8% 32% 81.8%
Insights from data analysis:
● Māori students are not achieving as well as other ethnic groups.
● Male students are not achieving as well as female students.
Areas to further investigate:
● Is there a link between ESOL students and the high percentage of Asian students achieving well
below National Standards in Writing?
22
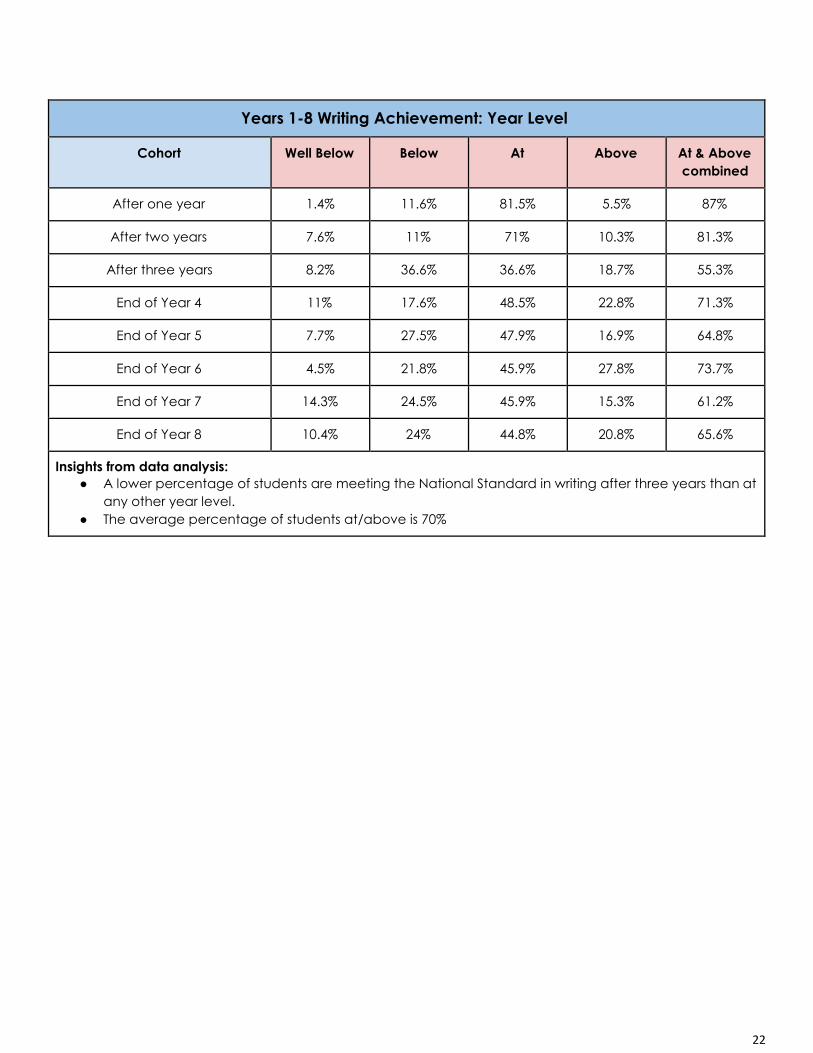
Years 1-8 Writing Achievement: Year Level
Cohort Well Below Below At Above At & Above
combined
After one year 1.4% 11.6% 81.5% 5.5% 87%
After two years 7.6% 11% 71% 10.3% 81.3%
After three years 8.2% 36.6% 36.6% 18.7% 55.3%
End of Year 4 11% 17.6% 48.5% 22.8% 71.3%
End of Year 5 7.7% 27.5% 47.9% 16.9% 64.8%
End of Year 6 4.5% 21.8% 45.9% 27.8% 73.7%
End of Year 7 14.3% 24.5% 45.9% 15.3% 61.2%
End of Year 8 10.4% 24% 44.8% 20.8% 65.6%
Insights from data analysis:
● A lower percentage of students are meeting the National Standard in writing after three years than at
any other year level.
● The average percentage of students at/above is 70%