Pakistan CEMENT SECTOR - Amazon S3€¦ · Maple Leaf Cement, 10% Others, 19% Bestway Cement, 18%....
32
March 2017 Pakistan CEMENT SECTOR JCR-VIS RESEARCH SECTOR OVERVIEW
Transcript of Pakistan CEMENT SECTOR - Amazon S3€¦ · Maple Leaf Cement, 10% Others, 19% Bestway Cement, 18%....
March 2017
Pakistan CEMENT SECTOR
JCR-VIS RESEARCH
SECTOR OVERVIEW

TABLE OF CONTENTS
Key Characteristics6
Sector Snapshot7
Cement Manufacturing Process8
Environmental Impact of Cement Production10
Global Cement Production11
13 Snapshot of Pakistan’s Cement Sector
14 Per Capita Cement Consumption
Location of Cement Companies15

TABLE OF CONTENTS
Marketing Arrangement16
Industry Production Capacity17
Existing Capacity & Expansion (North)18
Existing Capacity & Expansion (South)19
Rationale for Expansion20
21 Industry Capacity Utilization
22 Capacity Utilization (North)
Capacity Utilization (South)23

TABLE OF CONTENTS
Sales Mix - Local vs. Export24
Risk profile of the Industry25
Financial Profile of the Industry28
Gross Margin Drivers of the Industry29
Gross/Net Margins of Key Players31
32 Borrowing Profile of the Industry
CEMENT SECTOR:
GLOBAL PROFILE

A capital intensive industryA capital intensive industryThe cost of cement plants is usually above $ 160M per million tones of annual capacity, with correspondingly high
costs for modifications. The cost of a new cement plant is equivalent to around 3 years of turnover, ranking it as
one of the most capital intensive.
Energy intensive industryEnergy intensive industryEach tonne of cement produced requires 60 to 130 kg of fuel oil or its equivalent, depending on the cement variety
and the process used, and about 110 KWh of electricity. Energy on average constitutes around 40-60% of
operating expenditure.
Energy intensive industryEnergy intensive industryEach tonne of cement produced requires 60 to 130 kg of fuel oil or its equivalent, depending on the cement variety
and the process used, and about 110 KWh of electricity. Energy on average constitutes around 40-60% of
operating expenditure.
An Industry with homogenous products An Industry with homogenous products
Although produced from natural raw materials which vary from plant to plant, cement can be considered a
standard product - there are only a few classes of cement.
An Industry with homogenous products An Industry with homogenous products
Although produced from natural raw materials which vary from plant to plant, cement can be considered a
standard product - there are only a few classes of cement.
Market parameters Market parameters Consumption of cement is closely linked to both the state of economic development in any given country or
region and to the economic cycle.
Market parameters Market parameters Consumption of cement is closely linked to both the state of economic development in any given country or
region and to the economic cycle.
Logistics and distribution networkLogistics and distribution networkHeavy reliance on logistical support and distribution network to function.
Logistics and distribution networkLogistics and distribution networkHeavy reliance on logistical support and distribution network to function.
Global Cement SectorJCR-VIS Credit Rating Company Limited
KEY CHARACTERISTICS
Raw MaterialsRaw MaterialsThe raw materials needed to produce cement (calcium carbonate, silica, alumina and iron ore) are generally
extracted from limestone rock, chalk, clayey schist or clay.
.

Current Global cement production in 2016
1960 1980 2000 2020
Cement production
4.6+Billion Tons
JCR-VIS Credit Rating Company LimitedGlobal Cement Sector
SECTOR SNAPSHOT
Types of Cement: The cementing
Material is generally classified into 2 category:
Hydraulic (e.g. Portland
Cement: set and becomeadhesive due to a chemicalreaction between the dryingredients and water.
Non – Hydraulic: will not set inwet conditions or underwater;rather, it sets as it dries and reactswith carbon dioxide in the air. It isresistant to attack by chemicalsafter setting.
Capacity
286.66 mt/year217.2 mt/year176.22 mt/year121.11 mt/year87.09 mt/year76.62 mt/year71.01 mt/year63.72 mt/year45.18 mt/year45.02 mt/year
Global Employment
545,000+ employees (Cement
& Concrete)
Competitive landscape and key vendors 2016
Company1. LafargeHolcim (Switzerland)2. Anhui Conch (China) 3. CNBM Sinoma (China) 4. Heidelberg (Germany)5. CEMEX (Mexico)6. Italcementi (Italy)7. China Resource (China)8. Taiwan Cement (Taiwan)9. Eurocement (Russia)10. Votorantim (Brazil)
The global cement industry
is competitive and
contains numerous
global and
regional players

JCR-VIS Credit Rating Company LimitedGlobal Cement Sector
CEMENT MANUFACTURING PROCESS
Quarry face1. BLASTING: The raw materials that are used
to manufacture cement (mainly limestone and
clay) are blasted from the quarry.
2. TRANSPORT: The raw materials are loaded into a dumper.
dumperloader
3. CRUSHING & TRANSPORTATION: The raw materials, after crushing, are transported to the plant by conveyor. The plant stores the
materials before they are homogenized.
crushing
conveyor
storage at
the plant
conveyor Raw mix
storage at
the plantRaw mill
STAGE I: QUARRY
STAGE II: RAW GRINDING AND BURNING
kilncooling
preheating
clinker
4. RAW GRINDING : The raw materials are very finely ground in order to produce the raw mix.
5. BURNING : The raw mix is preheated before it goes into the kiln, which is heated by a flame that can be as hot as 2000 °C. The raw mix
burns at 1500 °C producing clinker which, when it leaves the kiln, is rapidly cooled with air fans. So, the raw mix is burnt to produce clinker : the
basic material needed to make cement.

JCR-VIS Credit Rating Company LimitedGlobal Cement Sector
CEMENT MANUFACTURING PROCESS
STAGE III: GRINDING, STORAGE, PACKING, DISPATCH
7. STORAGE, PACKING, DISPATCH: The cement is stored in silos before being dispatched either in bulk or in bags to its final destination.
silos
dispatch
bags
clinker
storage
Gypsum and the secondary additives are
added to the clinker.
6. GRINDING: The clinker and the gypsum are very finely grounded giving a “pure cement”. Other secondary additives and cementitious materials
can also be added to make a blended cement.
Finish
grinding
Source: http://www.lafarge.com/en

JCR-VIS Credit Rating Company LimitedGlobal Cement Sector
ENVIRONMENTAL IMPACT
The production of cement releases greenhouse gas emissions both directly and indirectly:
• The direct emissions of cement occur through a chemical process called calcination,
which occurs when limestone (made of calcium carbonate,) is heated. This process
accounts for ~50% of all emissions from cement production.
• Indirect emissions are produced when fossil fuel is burned to heat the kiln. Kilns are
usually heated by coal, natural gas, or oil, and the combustion of these fuels produces
additional CO2 emissions. This represents around 40% of cement emissions.
• Finally, the electricity used to power additional plant machinery, and the transportation
of cement, represents another source of indirect emissions and account for 5-10% of
the industry’s emissions.
Cement industry accounts for 5% of global greenhouse gasses (GHG):
Transport activities ~ (5%)
Combustion of fossil fuel required to make electricity ~ (5%)
Calcination process, which occurs when limestone (made of calcium
carbonate) is heated ~ (about 50%)
Fossil fuel combustion at cement manufacturing operation ~ (40%)
ORIGINATION OF CEMENT RELATED GREENHOUSE GASSES (GHG)
Source: http://blogs.ei.columbia.edu/2012/05/09/emissions-from-the-cement-industry/

JCR-VIS Credit Rating Company LimitedGlobal Cement Sector
GLOBAL PRODUCTION
Source: http://www.cembureau.be/about-cement/key-facts-figures

PAKISTAN CEMENT SECTOR:
OVERVIEW

38+Million tons of
dispatchesOperational capacity
44+Million tons Clinker
46+ Million tons
Cement
Rs. 250+Billion Sales
24 playersOperating in the
industry
5.8+Million tons of
export of cement & Clinker
140 kgPer Capita
Consumption
JCR-VIS Credit Rating Company LimitedPakistan’s cement sector
SNAPSHOT OF PAKISTAN’S CEMENT SECTOR
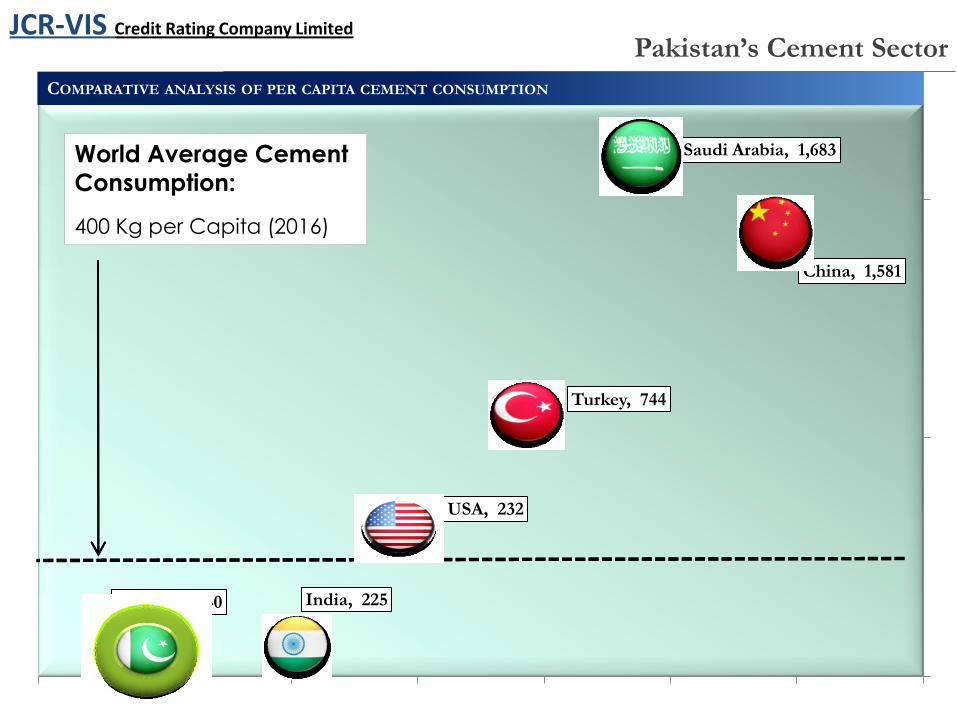
China, 1,581
Saudi Arabia, 1,683
Turkey, 744
USA, 232
India, 225 Pakistan, 140
World Average Cement
Consumption:
400
World Average Cement
Consumption:
400 Kg per Capita (2016)
JCR-VIS Credit Rating Company LimitedPakistan’s Cement Sector
COMPARATIVE ANALYSIS OF PER CAPITA CEMENT CONSUMPTION

North
JCR-VIS Credit Rating Company LimitedPakistan’s Cement Sector
LOCATION OF CEMENT PLANTS
Location of
Cement Plants –
Marked Red
NorthNorth• There’re 19 cement units operating in
North.
• North Zone includes provinces of Punjab,
Khyber Pakhtunkhwa, Azad Kashmir,
Gilgit-Baltistan and parts of Balochistan
while South Zone includes provinces of
Sindh and Balochistan.
SouthSouth• There’re 5 cement units operating in
South zone.
• South Zone comprise provinces of Sindh
and Baluchistan.

Pakistan’s Cement Sector
MARKETING ARRANGEMENT
The industry operates under a marketing
arrangement whereby there is understanding
on pricing between cement players and a
quota is assigned to each player based on
installed capacity.
The arrangement is rewritten based on
additional capacities that come online.
The marketing arrangement has matured
considerably and has been a key element of
cement sector profitability.
JCR-VIS believes that players with higher
efficiencies and presence & access to export
markets will be able to remain competitive in
the absence of marketing arrangement.
JCR-VIS Credit Rating Company Limited
JCR-VIS Credit Rating Company LimitedIndustry Production Capacity
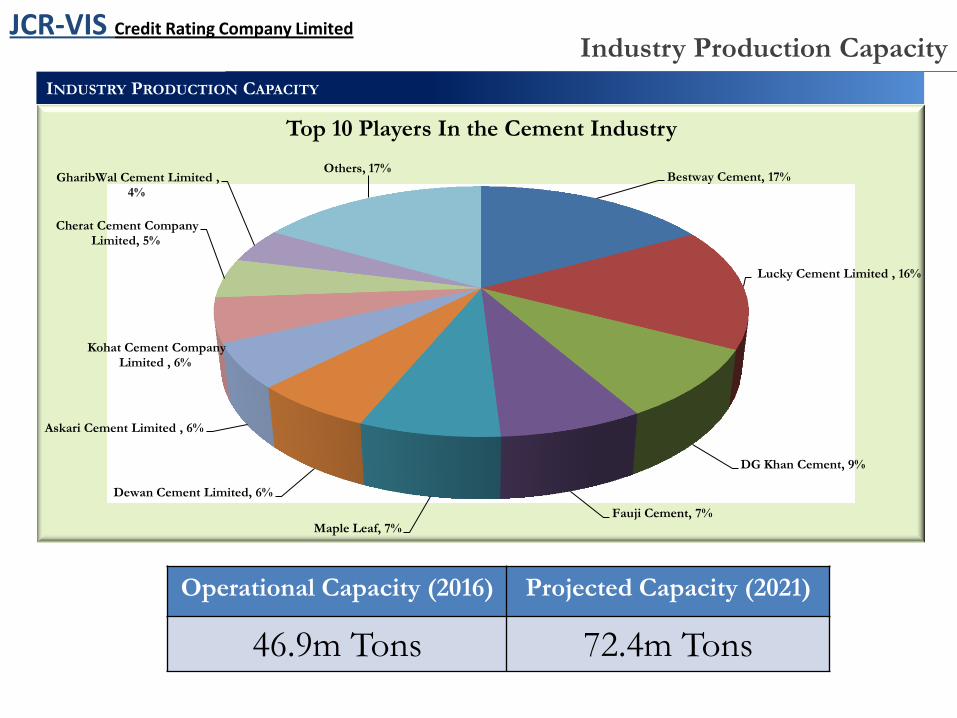
INDUSTRY PRODUCTION CAPACITY
Operational Capacity (2016) Projected Capacity (2021)
46.9m Tons 72.4m Tons
Bestway Cement, 17%
Lucky Cement Limited , 16%
DG Khan Cement, 9%
Fauji Cement, 7%Maple Leaf, 7%
Dewan Cement Limited, 6%
Askari Cement Limited , 6%
Kohat Cement Company Limited , 6%
Cherat Cement Company Limited, 5%
GharibWal Cement Limited , 4%
Others, 17%
Top 10 Players In the Cement Industry

EXISTING CAPACITY IN CEMENT SECTOR (2016)
JCR-VIS Credit Rating Company LimitedExisting Capacity & Expansion (North)
AFTER CAPACITY EXPANSION (2021)
COMPANIES & EXPANSION PLANS IN THE CEMENT SECTOR (NORTH) – CAPACITY GIVEN IN MILLION TONS
Cherat Cement6%
D.G.Khan Cement11%
Pioneer Cement5%
Lucky Cement10%
Gharibwal Cement6%
Kohat Cement7%
Maple Leaf Cement
9%
Others25%
Bestway Cement21%
-) Players – 14-) Operational Capacity – 38m Tons
-) Players – 14-) Operational Capacity – 56m Tons-) Additional capacity represents 47% of existing capacity
Cherat Cement, 8% D.G.Khan
Cement, 11%
Pioneer Cement, 8%
Lucky Cement, 11%
Gharibwal Cement, 8%
Kohat Cement, 9%
Maple Leaf Cement, 10%
Others, 19%
Bestway Cement, 18%
EXISTING CAPACITY IN CEMENT SECTOR
JCR-VIS Credit Rating Company Limited
AFTER CAPACITY EXPANSION IN 2021
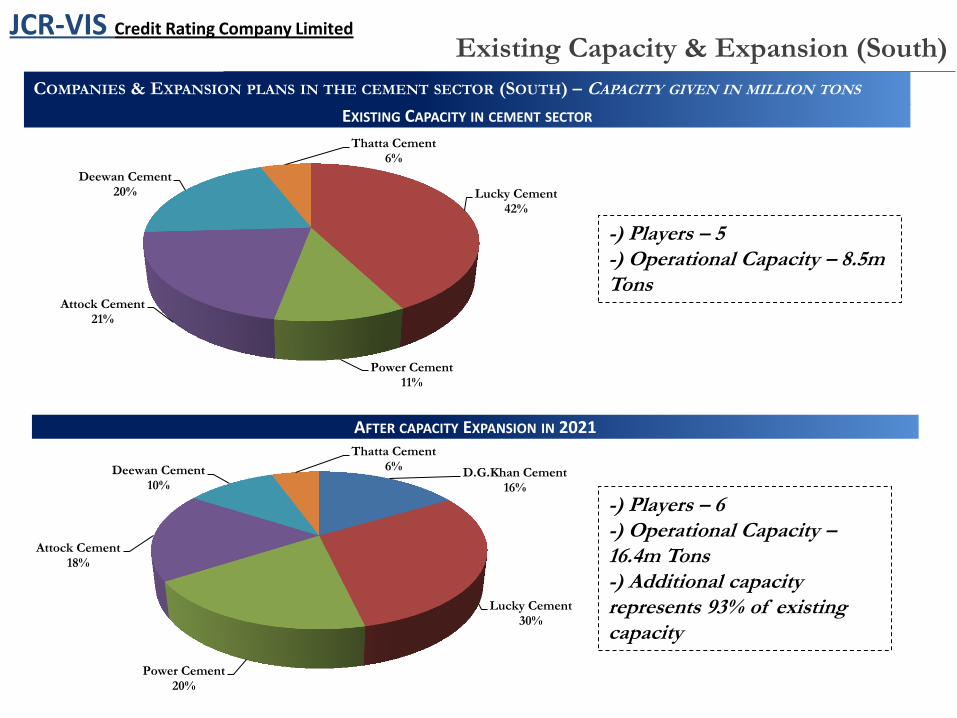
COMPANIES & EXPANSION PLANS IN THE CEMENT SECTOR (SOUTH) – CAPACITY GIVEN IN MILLION TONS
Lucky Cement42%
Power Cement11%
Attock Cement21%
Deewan Cement20%
Thatta Cement6%
D.G.Khan Cement16%
Lucky Cement30%
Power Cement20%
Attock Cement18%
Deewan Cement10%
Thatta Cement6%
-) Players – 5-) Operational Capacity – 8.5m Tons
-) Players – 6-) Operational Capacity –16.4m Tons-) Additional capacity represents 93% of existing capacity
Existing Capacity & Expansion (South)

JCR-VIS Credit Rating Company LimitedExpansion Plans
RATIONALE FOR EXPANSION
Barring few small players, almost all cement players have announced expansion.
Rationale for expansion includes
Favorable demand outlook
Retain market share
Compete in terms of efficiencies
Expansion in South
Expansion in North
TIMELINE OF EXPANSION PLAN

JCR-VIS Credit Rating Company LimitedCapacity Utilization
CAPACITY UTILIZATION IN PAKISTAN’S CEMENT SECTOR –MILLION TONS
0%
10%
20%
30%
40%
50%
60%
70%
80%
90%
100%
-
5
10
15
20
25
30
35
40
45
50
FY05 FY06 FY07 FY08 FY09 FY10 FY11 FY12 FY13 FY14 FY15 FY16
Production Capacity Total Dispatches Capacity Utilization Linear (Capacity Utilization)
DISPATCHES IN PAKISTAN'S CEMENT SECTOR – SALES GIVEN IN MILLION TONS
-
5
10
15
20
25
30
35
40
45
FY05 FY06 FY07 FY08 FY09 FY10 FY11 FY12 FY13 FY14 FY15 FY16Local Dispatches Exports Total Expon. (Total)
CAGR dispatches over the last
10 years @ 7.68%

JCR-VIS Credit Rating Company LimitedCapacity Utilization (North)
CAPACITY UTILIZATION (NORTH) –MILLION TONS
62%
64%
66%
68%
70%
72%
74%
76%
78%
80%
82%
0
5
10
15
20
25
30
35
40
45
FY12 FY13 FY14 FY15 FY16
Production Capacity Total Dispatches Capacity Utilization Linear (Capacity Utilization)
PROJECTED CAPACITY UTILIZATION (NORTH) –MILLION TONS
0%
10%
20%
30%
40%
50%
60%
70%
80%
90%
100%
0
10
20
30
40
50
60
70
FY16 FY17 FY18 FY19 FY20 FY21 FY22 FY23 FY24
Production capacity Export Sales Total Sales Capacity Utilization Linear (Capacity Utilization)
Dip in capacity utilization to 73% in FY20, as capacity
expansion by a number of player comes online

JCR-VIS Credit Rating Company LimitedCapacity Utilization (South)
CAPACITY UTILIZATION (SOUTH)–MILLION TONS
86%
88%
90%
92%
94%
96%
98%
100%
0
1
2
3
4
5
6
7
8
9
FY12 FY13 FY14 FY15 FY16
Production Capacity Total Dispatches Capacity Utilization Linear (Capacity Utilization)
PROJECTED CAPACITY UTILIZATION (SOUTH)–MILLION TONS
0%
10%
20%
30%
40%
50%
60%
70%
80%
90%
100%
0
2
4
6
8
10
12
14
16
18
FY16 FY17 FY18 FY19 FY20 FY21 FY22 FY23 FY24
Production capacity Local Sales Export Sales Total Sales Capacity Utilization Linear (Capacity Utilization)
Dip in capacity utilization to 65% in
FY18, as APCL, DGKC and Lucky
expansion come online
Further dip in capacity utilization to 62%
in FY20, as Power Cement expansion
comes online
Dewan Cement increased capacity in FY16,
which contributed to dip in capacity utilization

JCR-VIS Credit Rating Company LimitedSales Mix
SALES MIX - LOCAL VS. EXPORTS
BREAKUP OF LOCAL SALES - MILLION TONS BREAKUP OF EXPORT SALES - MILLION TONS
0% 20% 40% 60% 80% 100%
FY12
FY13
FY14
FY15
FY16
Exports Local
Increasing proportion of local sales due to favorable
demand dynamics.
Imposition of anti dumping duty on exports to
South Africa along with slowdown in dispatches to
Afghanistan has resulted in declining exports.
Emerging export markets now include Sri Lankan
and African Markets.
0
1
2
3
4
5
6
7
8
FY11 FY12 FY13 FY14 FY15 FY16North South
0
5
10
15
20
25
30
FY11 FY12 FY13 FY14 FY15 FY16North South

JCR-VIS Credit Rating Company LimitedRisk Profile
BUSINESS RISK
Business risk profile of the sector is supported
by:
1. Healthy demand outlook due to
infrastructure and housing projects
2. Mature marketing arrangement resulting
in:
Strong pricing power (increase of Rs.
34/bag passed to consumers due to
change in FED regime)
Pass through of increase in cost
Lower fuel and power cost supported by declining FO and coal prices. Recent increase in
coal prices is expected to be passed to consumers
3. Capacity expansion to further improve efficiencies and margins

JCR-VIS Credit Rating Company LimitedRisk Profile
RISK FACTORS
A. Lower than projected growth in demand due to adverse
developments on CPEC front and delay in infrastructure
projects
B. Collapse of marketing arrangement. Industry players
believe chances of the same are remote due to capital
commitment of key players and planned closure of
inefficient lines.
C. Inability to pass significant increase in input prices
D. Declining exports
E. Taxes and regulatory duties
PAKISTAN CEMENT SECTOR:
FINANCIAL ANALYSIS

Financial Performance
FINANCIAL PROFILE FOR THE OUTGOING YEAR
..
Financial profile of the sector has posted notable improvement across all key parameters including profitability,
liquidity and capitalization.
Key reasons for the improved performance has been growth in dispatches and improved gross margins.
Decline in coal and furnace oil prices has also facilitated in improved gross margins
JCR-VIS Credit Rating Company Limited
1.7
17.3
48.3
57.3
83.6
61.0
1.09
0.63
0.31
0.39
0.220.18
0.00
0.20
0.40
0.60
0.80
1.00
1.20
-
10.0
20.0
30.0
40.0
50.0
60.0
70.0
80.0
90.0
2011 2012 2013 2014 2015 2016
FFO/Total Debt Gearing
Median gearing of the
sector has declined
from1.09x at-end’2011 to
0.18x at-end’2016
-
50,000
100,000
150,000
200,000
250,000
300,000
2011 2012 2013 2014 2015 2016
Sales PBT
Sales: 5-year sales CAGR of 15.0%
Profit before Tax (PBT): 5-year CAGR of 101.5%

Gross margin
drivers
Cement dispatchesAssigned quota based on installed capacity
Retention pricePricing arrangement between key players
Cost of Sales
Raw/packaging material
Cement Dispatches
Cost of fuel & Power
Efficiency of cement plant
Cost of input (i.e. coal, gas etc)
Plant capacity utilization
Salaries & wages
CRITICAL DRIVERS OF PERFORMANCE FOR CEMENT SECTOR
Gross Margin DriversJCR-VIS Credit Rating Company Limited
Level 1 Level 2 Level 3 Value Drivers

CRITICAL DRIVERS OF PERFORMANCE FOR CEMENT SECTOR
Gross Margin Drivers
..Efficiency• Efficiency of cement plant is a function of Kcal coal consumption per kg of clinker and electricity
consumption in KWh per ton of cement.
• For top-tier players, coal consumption is around 800 Kcal per kg of clinker and electricity consumption
is 100 KWh per ton of cement, respectively.
• Expansion will result in better efficiencies given the lower electricity and coal consumption of new
plants.
Main gross margin drivers
Capacity Utilization
Retention Prices
Cost of fuel and Power
• Cost of fuel and power is the single largest component representing around half of cost of sales.
• Power cost is dependent on efficiency of cement plant, cost of input prices (coal, gas, FO or grid)
and capacity utilization.
JCR-VIS Credit Rating Company Limited

Industry Gross/Net Margins
GROSS MARGIN (%)
JCR-VIS Credit Rating Company Limited
0
10
20
30
40
50
60
FY16 FY15
NET MARGIN (%)
0
5
10
15
20
25
30
35
FY16 FY15

JCR-VIS Credit Rating Company LimitedRisk Profile
BORROWING PROFILE
Borrowings undertaken by cement manufacturers are
a function of working capital requirements and to fund
expansion.
With business in the South Zone being undertaken
largely on cash basis with major portion of sales to large
dealers, working capital requirements are limited for
players in the South Zone vis-à-vis the North Zone
where sales are largely on credit terms.
Despite expected increase in borrowings to fund
expansion, gearing levels are expected to remain within
manageable levels on account of sizeable retained
earnings.

![[ Core Values ] - ubldirect.com · [ Core Values ] [ Mission ] • Set ... Bestway Cement in Pakistan & Bestway Northern Limited in UK. ... He joined Bestway Group as a financial](https://static.fdocuments.in/doc/165x107/5b3ed4417f8b9a4b3f8b602b/-core-values-core-values-mission-set-bestway-cement-in.jpg)