Pain in the Brain: The Role of
88
Transcript of Pain in the Brain: The Role of


Pain in the Brain: The Role of Functional Neuroimaging
Biology of Nociception, Pain and Placebo– Biopsychosocial model
– Neuroanatomy of nociception
– Perception of pain
– Placebo response
Functional Neuroimaging Techniques– Positron Emission Tomography (PET)
– Functional Magnetic Resonance Imaging (fMRI)
Functional Neuroimaging of the Human Brain– Imaging the placebo response
– Imaging chronic pain (CTS)
– Imaging resting state networks

Terry R. YochumDC, DACBR, Fellow, ACCR, FICC
Graduate (Honors)
National College of Chiropractic 1972
Assistant Professor of Radiology
National College of Chiropractic
Professor, Chair Department of Radiology Logan College of Chiropractic
Head, Department of Radiology 1978
School of Chiropractic, Phillip Institute Melbourne Australia

Terry R. YochumDC, DACBR, Fellow, ACCR, FICC
Adjunct Professor of Radiology
Los Angeles College of Chiropractic
Instructor, Skeletal Radiology
Department of Radiology
University of Colorado School of Medicine, Denver, CO
Director,
Rocky Mountain Chiropractic Radiological Center, Denver, CO

The heights of great men reached and kept
Were not attained by sudden flight,
But they, while their companions slept,
Were toiling upward through the night,
Henry Wadsworth Longfellow
“The Ladder of St. Augustine”


James M. Cox, I, DC, DACBR, FICC
Purdue University
National College of Chiropractic, 1963
Radiology Residency, Lincoln & National College of Chiropractic 1967-1970
Diplomate, American Chiropractic Board of Radiology, 1970
Director, Chiropractic Associates, Inc. Fort Wayne, IN, 1970

James M. Cox, I, DC, DACBR, FICC
Fellow, International College of Chiropractic, 1978
Inventor of COX® Distraction Manipulation Instrument
Chief Radiologist, Fort Wayne Chiropractic Center, 1993
Past-President, Indiana State Chiropractic Association
Editorial Board, JMPT


Imaging the Brain in Pain: The Role of Functional
Neuroimaging
Norman W. Kettner, DC, DACBR, FICC
Chair, Department of Radiology
Logan College of Chiropractic
Chesterfield, Missouri


The Pain Revolution
Melzack R, Wall PD.Pain mechanisms: a new theory.Science. 1965 Nov 19;150(699):971-9
Engel GL. The need for a new medical model: a challenge for biomedicine.Science. 1977 Apr 8;196(4286):129-36
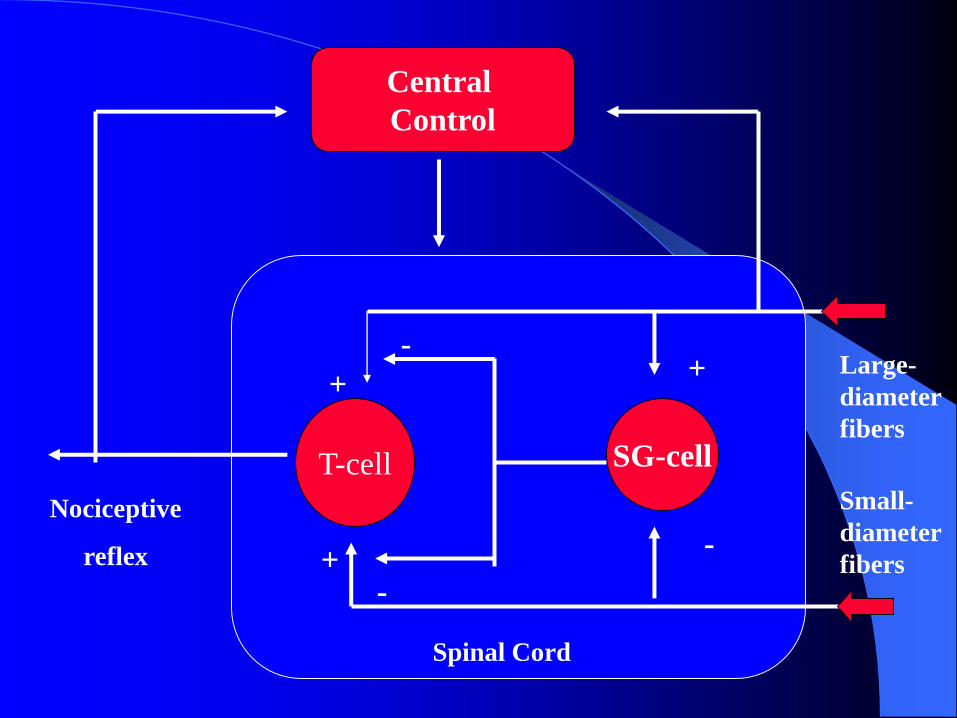
T-cell SG-cell
Central
Control
Nociceptive
reflex
Large-
diameter
fibers
Small-
diameter
fibers
Spinal Cord
+-
+
-+
-
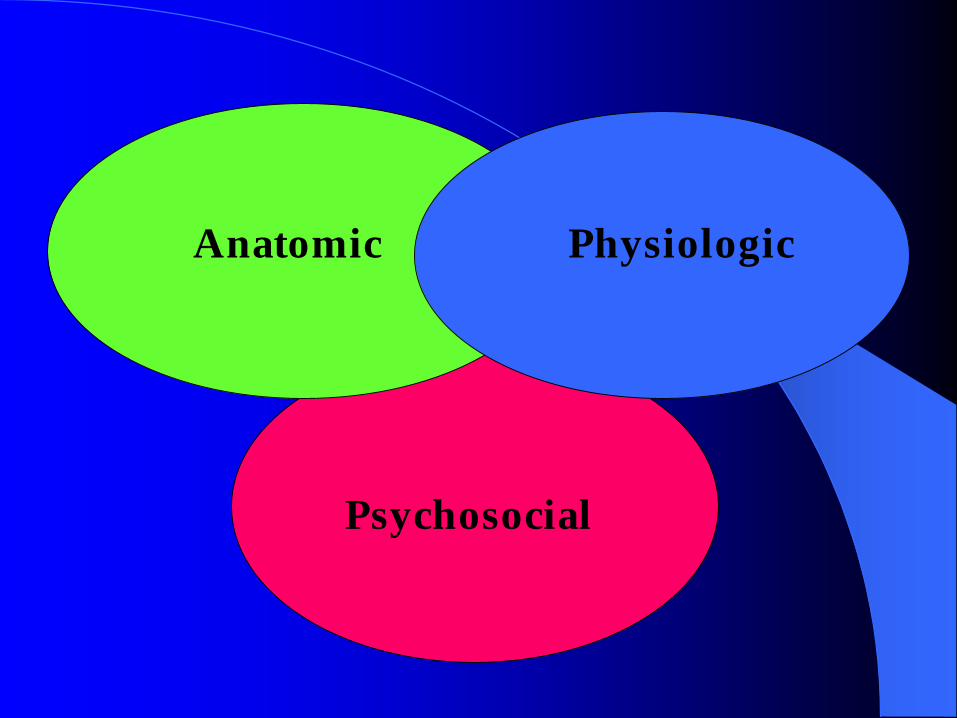
Psychosocial
Anatomic Physiologic

Classification of Fibers in Peripheral Nerves
Lloyd/Hunt
System
Diameter
(m)
Letter
System
Conduction
Velocity
(m/sec)
Myelin Receptor/ending types
I-aa 12-20 ___ 70-120 + Muscle spindle primary endings
I-ba 12-20 ___ 70-120 + Golgi tendon organs
___ 12-20 A- 70-120 + Muscle efferents (extrafusal)
II 6-12+ A-b 30-70 + Encapsulated endings (Meissner, Ruffini,
Pacinian); Merkel intraepithelial; muscle spindle
secondary endings
___ 2-10 A- 10-50 + Muscle efferents (intrafusal)
III 1-6 A- 5-30 + A- specific nociceptors; A- polymodal
receptors; cold receptors; most hair receptors;
some visceral receptors
__ <3 B 3-15 + Preganglionic autonomic
IV <1.5 C 0.5-2.0 No C-nociceptors; C-polymodal receptors; some
visceral receptors; warmth receptors; some
mechanoreceptors; postganglionic autonomic;
enteric nerve fibers


The Ascending and Descending Pain PathwaysCortex Thalamus
Hypothalamus
PAG
DLP
RVMMedulla
Pons
Mesencephalon
Spinal Cord
Periphery
NE
PAF
Dorsal Horn
NG/NC
STT
NE
DLF
5-HT

Circuitry Diagram of the Rostral Ventromedial Medulla
Opioid-Activated
EAA
EAA
ON OFF
GABA
RVM Opioid?Opioid?
Spinal Nociceptive
Processes
(+) (-)

Neural Activity Underlying FeelingsOBJECT
Early Sensory
Cortices e.g. visual
Higher Order
Cortices
Somatosensory
Cortex
Prefrontal Cortices
Amy
Anterior
Cingulate
Cortex
Hypothalamus
Autonomic
NucleiMotor
SystemEndocrine &
Peptide Systems
Neurotransmitter Nuclei
(e.g. basal forebrain &
brainstem)
Emotional Body States
BG
Damasio AR

Putative Functional Roles of Cortical Areas that are Activated
by Noxious StimuliFunctional
Correlation
Cortical Area Possible Functions
Pain intensity Primary somatosensory cortex
Secondary somatosensory cortex and its
vicinity
Sensory discriminative in general,alternatively
stimulus localization. Sensory integrative (touch,
pain, visual) Spatially directed attention Sensory
integrative (touch, pain, taste, vestibular), visceral
sensory, visceral motor, limbic integration
Temperature
sensation Insula
Pain threshold Right frontal inferior cortex
Left thalamus
Right
Response selection, motor suppression, attention,
affect
Pain
unpleasantness Left
Pain Intensity Right posterior cingulate cortex
Brainstem/periventricular gray
Prefrontal cortex
Affect, emotion, memory
Anterior cingulate cortex
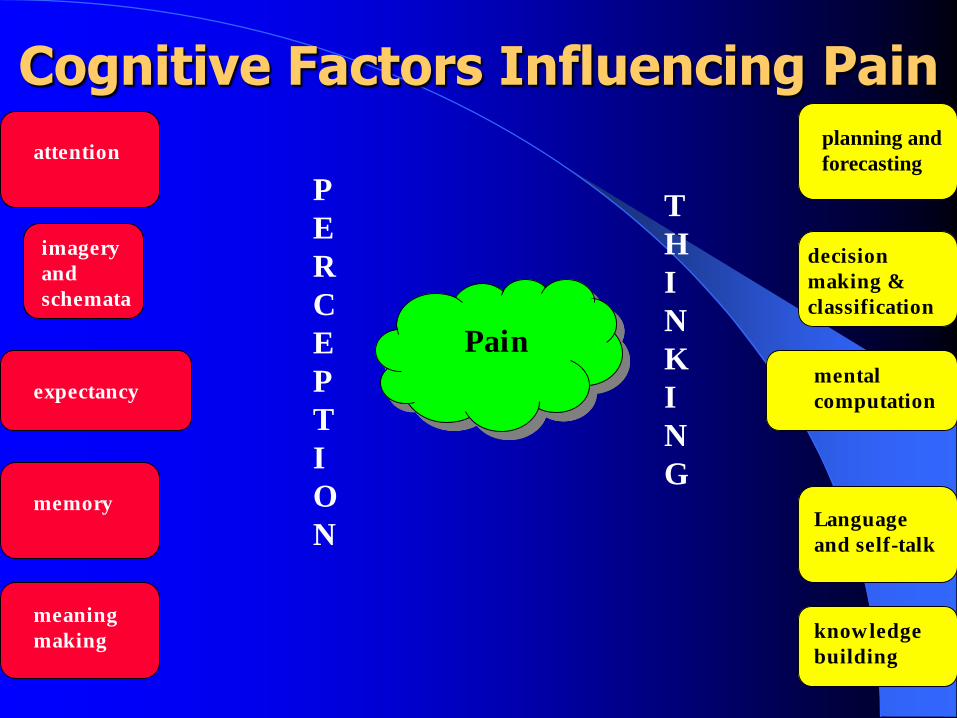
Cognitive Factors Influencing Pain
P
E
R
C
E
P
T
I
O
N
T
H
I
N
K
I
N
G
Pain
planning and
forecasting
decision
making &
classification
mental
computation
Language
and self-talk
knowledge
building
attention
imagery
and
schemata
expectancy
memory
meaning
making

Model of the Sensory, Motivational, and Central Control of Pain
CENTRAL CONTROL PROCESSES
(COGNITIVE CONTROL)
DESCENDING INHIBITION
SYSTEM
MOTOR
MECHANISMS
(ACTION
SYSTEM)
MOTIVATIONAL –AFFECTIVE
SYSTEM
(CENTRAL INTENSITY MONITOR)
SENSORY-DISCRIMINATIVE
SYSTEM
SPATIO-TEMPORAL ANALYSIS
MEDIAL
ASCENDING
PATHWAYS
LATERAL
ASCENDING
PATHWAYS
L
S


Therapy Patient’s life processes
Characteristic
factors
Incidental
treatment
factors
Target
disorder
Other facets of
the patient’s life
functions/health
Non-placebo effect
Placebo
effect
Side effects
OPTIMIZING NON-SPECIFIC EFFECTS
Grunbaum, 1989


Petrovic, P. et al,

Petrovic, P. et al,

Neuro Rehab Techniques for CNS Reorganization
Propriospinal Sensory
Discrimination
Counter
Stimulation
Electromagnetic
Stimulation
Cognitive
Therapy
Exercise Acupuncture TMS Cognitive
remediation
Manual Therapy
Mobilization
Manipulation
TENS TES Attention
modulation
Constraint
therapy
Vibration PNS Environmental
enrichment

Nelson, 2003
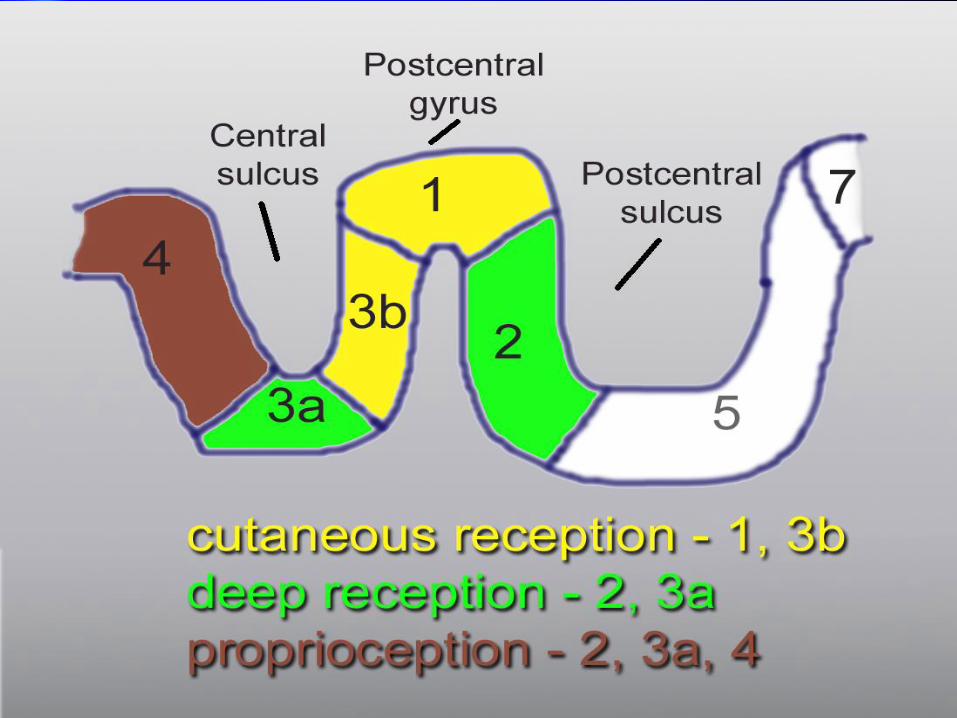

Digital Mapping – S1 Somatotopy The somatotopic digit homuncular organization in the human
primary somatosensory cortex (S1) was originally mapped by Penfield in 1937.
Martinos Imaging Center, MGH

Magnetic Resonance Imaging (MRI)
-Apply RF energy to H1 in H2O molecules at high magnetic field
(MRI B>1.5T; note: Earth B ~ 5x10⁻⁵ T, Human B ~ 10-6-10-9 T )
Martinos Imaging Center, MGH

Anatomical MRI(T1-weighted)
Angiogram(blood vessels map)
Structural MRI(gray matter thickness map)
Anatomical MRI(T2-weighted)
Functional MRI(activation to music)
Diffusion Tensor MRI(white matter tracts)
Martinos Imaging Center, MGH
MRI Examples

Cover 32
Belliveau et al., Science, Nov. 1991
Brain Activation Imaging: “fMRI”

• fMRI detects difference in signal (S = ON - OFF)
• fMRI is indirect method to infer brain activity (hemodynamic, BOLD)
Activated State (Stimulus On):Basal State (Stimulus Off):
Martinos Imaging Center, MGH
What is functional MRI?

What is fMRI?
Huettel, 2004

SYNAPSE NEURON-GLIA METABOLIC UNIT IMAGING SIGNALS
NEURONAL
ACTIVITY
Action potentials/
postsynaptic
potentials
METABOLIC
ACTIVITY
CBF / Glucose / O2
FUNCTIONAL
BRAIN IMAGING
PET / fMRI / SPECT
“Coupling”
Magistretti, et al

The Chain of Events
Increased Neural Activity
Increased Local CBF and CBV
Decreased Deoxyhemoglobin
Concentration in Veins (BOLD)
Change in Magnetic Susceptibility
Change in MRI Signal

Splitting the brain into voxels (3D pixels)
2.0mm x 2.0mm x 2.5mm fMRI voxelMartinos Center for Biomedical Imaging

Freesurfer – Brain PreProcessing
Original Skull-
Stripped
White Matter
Segmentation
Images courtesy of wideman-one.com
1 Dale, A.M., et al. (1999). Cortical Surface-Based
Analysis I: Segmentation and Surface Reconstruction.
NeuroImage 9(2):179-194
2 Fischl, B., et al. (1999). Cortical Surface-Based
Analysis II: Inflation, Flattening, and a Surface-Based
Coordinate System. NeuroImage 9(2):195-207
Martinos Imaging Center, MGH

Inflated Brain Analysis
Due to the undulating cortical topology, analyses of activation on the cortex are better visualized on an inflated brain surface which shows sulci and gyri as a greyscale texture map.
Martinos Imaging Center, MGH

Using Block Design fMRI to infer Stimulus Effect
A General Linear Model is applied to statistically test whether the MRI signal within any voxel correlates with the applied stimulus.
time
MRI signal
intensity
Martinos Imaging Center, MGH
MRI signal
from one of
~20,000 brain
voxels
demonstrates
deactivation

fMRI: Brain Processing of
Acupuncture
CTS vs. Healthy Adults
CTS Baseline vs. Post-acupuncture
Martinos Imaging Center, MGH

Acupuncture and CTS - Introduction
Martinos Imaging Center, MGH 1Papanicolaou, et al. J Hand Surg. 2001; 26(3):460-6
Carpal tunnel syndrome (CTS) is the most commonentrapment neuropathy U.S. prevalence
3.72%1.
pain + paresthesias in 1st to 4th digits
ischemia,
inflammation
damage nerve
microvasculature
↑ pressure
in carpal tunnel
exudative edema,
fibrosis
the CTS vicious cycle

CTS Doesn’t Just Affect the Wrist
Median n. injury abnormal activity within somatosensory system.
Tinazzi reported somatosensory evoked potentials (SSEPs) abnormally amplified with stimulus to affected side –spinal N13, brainstem P14, parietal N20, P271
Tecchio reported cortical ECD amplification with MEG2
Martinos Imaging Center, MGH
1 Tinazzi M., et al. Brain, 1998. 121 ( Pt 9):1785-94.
wrist
parietal (SI)
spinal
brainstem
2 Tecchio, et al. HBM, 2002. 17: 28-36.

Acupuncture Design“Semi-Individualized” Protocol
3x/week for 3 weeks + 2x/week for 2 weeks = 13x over 5 weeks:
Martinos Imaging Center, MGH
Needles: 38 guage (0.18mm), 30mm
length
Common Points (every subject):
unilateral TW-5 (interosseous) to PC-7
(median), 2Hz EA, low intensity.
Variable Points (symptom based):
acupuncturist chooses 3 of 6 based on
diagnosis: HT-3 (antebrachial
cutaneous), PC-3 (median), SI-4 (ulnar),
LI-5 (radial), LI-10 (radial), LU-5
(radial); manual even needle technique.

fMRI Digit Representations fMRI activation was observed in contralateral BA 1
for digits 2, 3, and 5 in most subjects, with digit 2 most ventral and digit 5 most dorsal, demonstrating distinct finger separation.
Digit 2Digit 3Digit 5Martinos Imaging Center, MGH

Methods
Martinos Imaging Center, MGH
5 weeks of
acupuncture
(13 Tx)
+
Clinical test
at 2 weeks
- Clinical testing
-fMRI with sensory
stim. on digits 2, 3, 5.
-fMRI w. acup & ctl
- Clinical tests
- fMRI
CTS (n=10)
baseline
- Clinical testing
- fMRI 5 weeks wait
- Clinical tests
- fMRI
Healthy Adults (n=9)baseline 5 weeks later
5 weeks later

Method:
fMRI Digit Mapping: 100Hz electro-stimulation with surface electrodes on fingers 2, 3, and 5 (pseudorandom order); 0.2 mA below pain sensitivity threshold.
Martinos Imaging Center, MGH

Clinical Results (subjective): Boston CTS Questionnaire
Acupuncture diminished neuropathic symptom severity, as measured by the Boston CTS Questionnaire (paired t-test: p<0.005***).
Martinos Imaging Center, MGH
CTS Neuropathic Symptom Severity (n=10)
1.00
1.40
1.80
2.20
2.60
3.00
Pre-Acupuncture Mid-Acupuncture Post-Acupuncture
******

M1 SI
L
(contra)R
(ipsi)
SIIMartinos Imaging Center, MGH
Digit 3
SIM1
SII
Healt
hy
CT
S

Digit 3
SI
L
(contra)R
(ipsi)
SIIMartinos Imaging Center, MGH
SIM1
SII
CT
S P
re-A
cu
pC
TS
Po
st-
Acu
p

• D2 & D3 were closer
together for CTS patients
than healthy adults
Martinos Imaging Center, MGH
Group Map SI Somatotopy
• D2 & D3 were more
separated post-acupunctureHealthy Adult
baseline
Healthy Adult
week 5
CTS baseline CTS post Acupcontralateral hemisphere
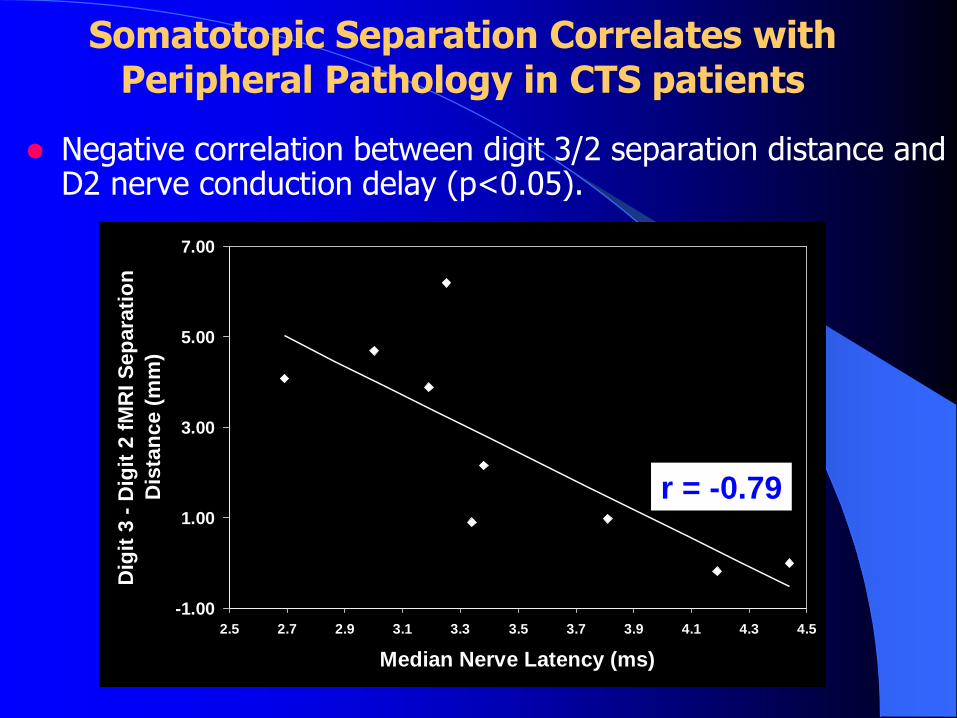
Somatotopic Separation Correlates with Peripheral Pathology in CTS patients
Negative correlation between digit 3/2 separation distance and D2 nerve conduction delay (p<0.05).
R2 = 0.6215
-1.00
1.00
3.00
5.00
7.00
2.5 2.7 2.9 3.1 3.3 3.5 3.7 3.9 4.1 4.3 4.5
Median Nerve Latency (ms)
Dig
it 3
- D
igit
2 f
MR
I S
ep
ara
tio
n
Dis
tan
ce (
mm
)
r = -0.79

CTS – A Central Manifestation of Peripheral Nerve Dysfunction
Martinos Imaging Center, MGH
pain + paresthesias
Carpal Tunnel Syndrome
more frequent and abnormal
nerve traffic to brain
more simultaneous signaling
from affected digits
more extensive
digit representations in cortex
disinhibition
overlapping and blurred digit
representation in cortex
Hebbian plasticity
mechanisms

Rupali P Dhond, Calvin Yeh, Kyungmo Park, Norman W Kettner, Vitaly Napadow
Dept. of Radiology, Logan College of Chiropractic,
Athinoula A. Martinos Center for Biomedical Imaging,
MIT, Massachusetts General Hospital, Harvard Medical School
Acupuncture Modulates Resting State Connectivity in Default and Sensorimotor
Brain Networks
Martinos Imaging Center, MGH

Background

Abnormalities in functional connectivity within inter-related brain regions may contribute to the pathophysiology of idiopathic disorders such as chronic low back pain.
Functional connectivity refers to temporal synchrony and correlation between distinct and spatially remote brain regions.

Low frequency fluctuations in cerebral hemodynamics (0.01- 0.1Hz) have been identified (Biswal 1995) in fMRI data obtained during rest, and are temporally correlated across widely separated brain regions characterizing a functional resting state network (RSN).

Fox, Raichle Nat Rev Neurosci. 2007
Seed Voxel Method

Copyright ©2005 by the National Academy of Sciences
Fox, Michael D. et al. (2005) Proc. Natl. Acad. Sci. USA 102, 9673-9678
Intrinsic correlations between a seed region in the PCC and all other voxels in the brain for a single subject during resting fixation

Craggs JG: NeuroImage 2007
SEM Method

Methods

We evaluated the functional connectivity present in non-task, resting fMRI data, both pre and post acupuncture at PC 6 with a non-insertive sham (Semmes -Weinstein filament) as sham.

Functional connectivity was evaluated with two template networks the "default mode" (DMN) and "sensory-motor networks" (SMN).

Data were collected from 15 healthy, right handed adults, 18-50. Manual acupuncture (MA) and sham acupuncture (SA) were used at left PC-6. During rest blocks there was no acupuncture intervention and subjects lay still and fixated on a centrally presented + symbol. The order of MA and SA runs were randomized across subjects.


Data were acquired using a Siemens Trio 3T MRI system equipped for echo planar imaging. Probabilistic independent component analysis (pICA) was performed on all rest runs using FSL-MELODIC to measure functional connectivity in the resting networks.

The pICA maps were in the form of a z –
statistic for temporally coherent activated or deactivated areas. Components were obtained using “best fit” (average z-
scores of voxels greatest inside /outside the template) from each rest run on all subjects.

Group analysis was performed on the selected component maps using a mixed effects model.
Paired and unpaired t-tests between resting state networks (DMN and SMN) before vs. after the acupuncture runs were obtained.

Results

Group maps of the best fitting IC for DMN and SMN showed consistent spatial distribution relative to their templates before and after acupuncture


Changes in connectivity (after vs. before) stimulation were observed in group maps for both MA and SA. The MA increased connectivity of the DMN with:

1. limbic and memory related areas (amygdala, hippocampus, middle temporal gyrus)
2. attentional (cingulate)
3. anti-nociceptive (PAG)
4. somatomotor (SMA)
5. spatial/associative (posterior parietal) regions

Following SA, the TOJ, MTG and ITG decreased connectivity with DMN.


Changes in the SMN for MA (but not SA) involved increased connectivity within the somatomotor network ( ACC, cerebellum pre-SMA).
For SA, decreased connectivity for SMN was seen in the dorsolateral prefrontal cortex


Conclusions

This study supports the modulation (increase) of the intrinsic functional connectivity of resting state networks (DMN, SMN) in the brain associated with the complex somatosensory stimulation of acupuncture. Future work will study RSN functional connectivity in chronic pain patients.

Acknowledgements
Massachusetts General Hospital, Boston, MA
Martinos Imaging Center, MGH
Spaulding Rehabilitation Hospital, Medford, MAJoseph Audette
Vitaly Napadow
Kathleen KS Hui
Nikos Makris
Bruce Rosen
Mark Vangel
Ken K Kwong
Ming Li
Jing Liu

Pain in the Brain: The Role of Functional Neuroimaging
Biology of Nociception, Pain and Placebo– Biopsychosocial model
– Neuroanatomy of nociception
– Perception of pain
– Placebo response
Functional Neuroimaging Techniques– Positron Emission Tomography (PET)
– Functional Magnetic Resonance Imaging (fMRI)
Functional Neuroimaging of the Human Brain– Imaging the placebo response
– Imaging chronic pain (CTS)
– Imaging resting state networks

Conclusion