Paid Claims Transportation Services Presented by: MCA C - Erlewine Medicaid Program... · Medicaid...
36
Medicaid Program Integrity Fraud, Waste & Abuse Presented by: Kristi Erlewine 1 DAVE YOST Ohio Auditor of State
Transcript of Paid Claims Transportation Services Presented by: MCA C - Erlewine Medicaid Program... · Medicaid...

Medicaid Program Integrity
Fraud, Waste & Abuse
Presented by: Kristi Erlewine
1
DAVE YOSTOhio Auditor of State
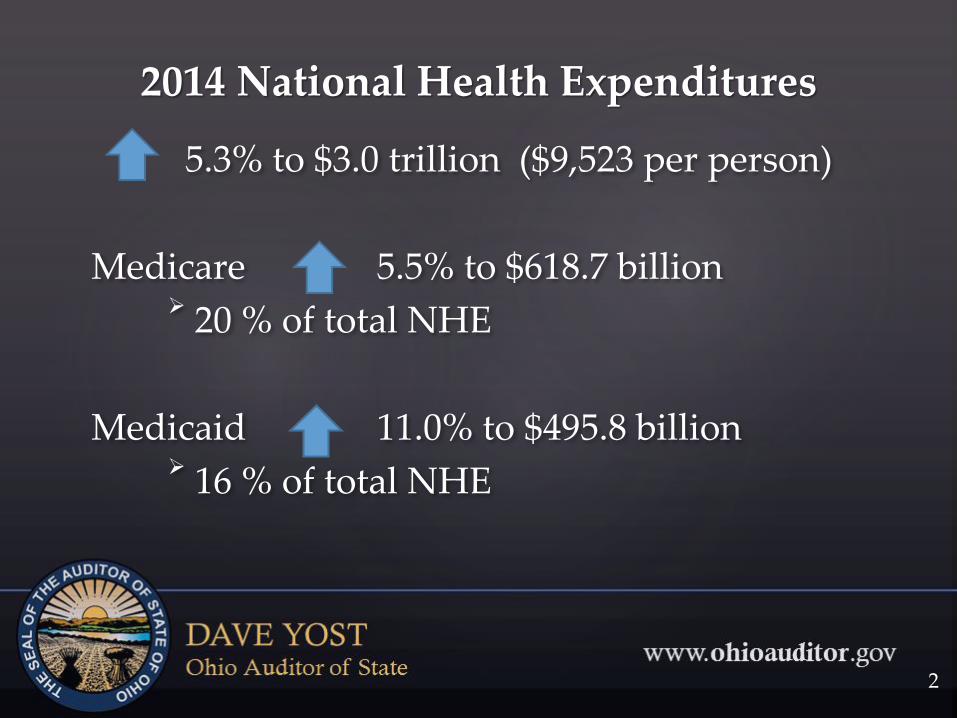
5.3% to $3.0 trillion ($9,523 per person)
Medicare 5.5% to $618.7 billion
20 % of total NHE
Medicaid 11.0% to $495.8 billion
16 % of total NHE
2014 National Health Expenditures
2

o Any payment that should not have been made or was made in an incorrect amount
o Examples:
• Duplicate payments;
• Payments to ineligible recipients;
• Incorrect amounts paid; and
• Payments for which insufficient or no documentation was found.
Improper Payment Definition
3

4
Improper Payments – Current Status
The FFY 2015 government-wide improper payment estimate totaled $136.7 billion, an increase of $12 billion from the prior year.

FFY 2015 Government-wide Improper Payment Estimates by Program
5

$21.9$19.2
$14.4$17.5
$29.1
8.1%
7.1%
5.8%6.7%
9.8%
$0
$5
$10
$15
$20
$25
$30
$35
0%
2%
4%
6%
8%
10%
12%
2011 2012 2013 2014 2015
Imp
rop
er P
aym
ent
Est
imat
e(i
n b
illi
on
s)
Err
or
Rat
e
Fiscal Year
Medicaid Improper Payments
6

CMS annually estimates the amount of improper payments in Medicaid
Payment Error Rate Measurement (PERM)
CMS randomly samples a subset of payments for review against federal and state policies
Average sample size per state : 450 Fee-for-Service & 210 managed care
Medicaid Improper Payment Overview
7

Ohio Medicaid
Ohio Department of Medicaid
Managed Care Plans Providers
Other State Agencies

Medicaid in Ohio
9
0
0.5
1
1.5
2
2.5
3
3.5
FY 2008 FY 2009 FY 2010 FY 2011 FY 2012 FY 2013 FY 2014 FY 2015 FY 2016
Medicaid Recipients by Year

Medicaid in Ohio
10
0
2,000,000,000
4,000,000,000
6,000,000,000
8,000,000,000
10,000,000,000
12,000,000,000
14,000,000,000
16,000,000,000
18,000,000,000
20,000,000,000
FY
2002 A
FY
2003 A
FY
2004 A
FY
2005 A
FY
2006 A
FY
2007 A
FY
2008 A
FY
2009 E
FY
2010 A
FY
2011 A
FY
2012 A
FY
2013 E
FY
2014 A
FY
2015 E
FY
2016-B
FY
2017-B
Medicaid Expenditures by Year

• PIG
• MCPIG
• PIGRx
• PiggyBank
• Charlotte’s Web
• O.H.I.O.
Ohio’s Program Integrity Groups
11

• Materiality
• Change in Reimbursement
• Complexity
• Strength of Rules
• Recent Rule Changes
• Recent Industry Changes
• Control Factors
• Fraud Risk Factors
Definitions of Risk Factors
12

Medicaid Contract Audit Section
13

• A cost report payment methodology “settles” payments by calculating a final actual rate
• Advantages: provides a mechanism to report certified public expenditures and to evaluate cost trends
• Disadvantages: Time consuming
What is a Cost Report and why use one?
14

Where can things go wrong?
15
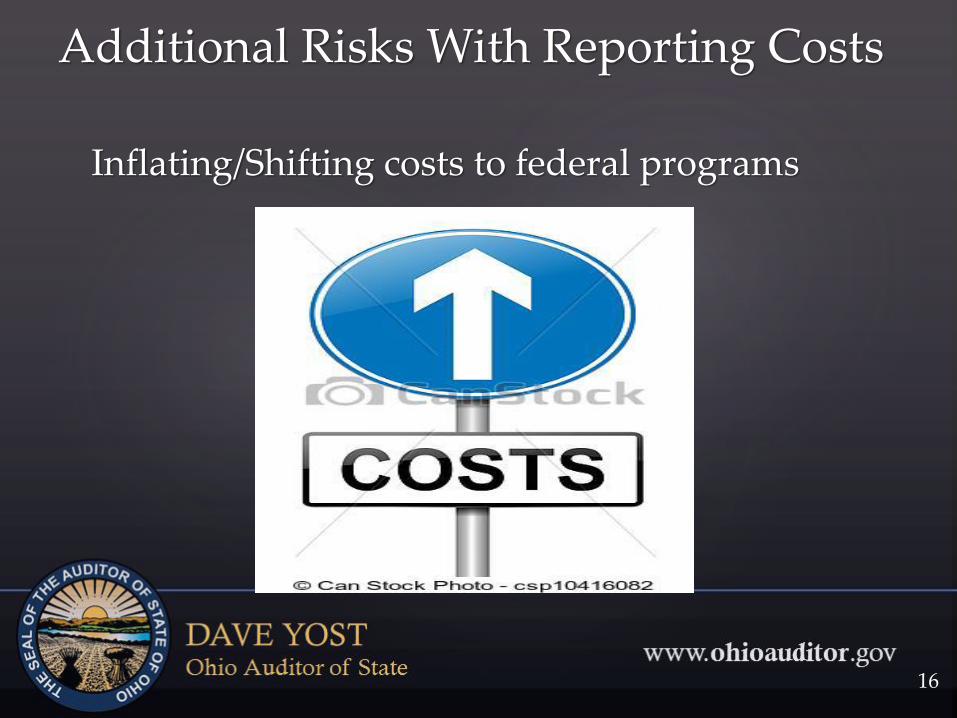
Inflating/Shifting costs to federal programs
Additional Risks With Reporting Costs
16

• Services that were never rendered
• Upcoding
• Medically unnecessary services
• Kickbacks
Common Types of Healthcare Fraud
17

• Misrepresenting non-covered treatments
• Falsifying a diagnosis
• Unbundling
Common Types of Healthcare Fraud
18

NHCAA Data
19

NHCAA Data
20

SFY 2012 through SFY 2016
• Released 98 provider examinations
• Findings of over $15.5 million
• Average of $158 K per provider
• Track ROI – average across this timespan -5:1
AOS Compliance Examinations
21


• Provider Type
• Rules/Laws/Other Applicable Criteria
• Procedure Codes
• Procedure Modifiers
• What constitutes a unit
Before Looking at Claims Data


• Reporting – Statistics, Graphing Data
• Patterns in the data –
oGap Detection
oPotential Duplicates
What Do We Do With the Data Once We Have It?

• Procedure Code/Modifier
• Date of Service
• Recipient Date of Service
oDate of Death
o Inpatient or care facility
Analyzing the Data

• Unusual modifiers
• Volume indicators
• Recipients with high number of services per date of service
• Recipients with same address receiving same type of service on the same date
Red Flags

Provider Selection Process

Provider Selection Process

# of Average %Provider Type Samples of Error
Transportation 30 77.8%Nurses 18 32.3%Home Health Agency 17 32.7%Personal Care Aide 9 50.8%School Med Program 9 50.2%Physician (& Group) 7 31.7%Psychiatric Services 6 32.0%Psychological Services 3 72.3%DME & Supplies 2 55.8%Emergency Res. Sys. 2 27.5%Podiatry 2 2.5%Dental 1 31.9%
Total: 106 50.2%
Sampling Results by Provider Type
30
Sources of Improper PaymentsDocumentation
31

Provider
Qualifications
Service
Authorization
Sources of Improper Payments
32

Sources of Improper PaymentsBilling Practices
33

Sources of Improper PaymentsNot A Covered Service
34

Contact Information
35

Ohio Auditor of StateDave Yost
88 E. Broad St.Columbus, Ohio 43215
Phone: (800) 282-0370 Fax: (614) 466-4490Email: [email protected]
www.OhioAuditor.gov