PAGE NUMBER - cdn3.yoox.bizcdn3.yoox.biz/cloud/ynap/uploads/doc/2018/YNAP_Results-FY-2017... ·...
35
Transcript of PAGE NUMBER - cdn3.yoox.bizcdn3.yoox.biz/cloud/ynap/uploads/doc/2018/YNAP_Results-FY-2017... ·...

P A G E N U M B E R
This presentation has been prepared by YOOX NET-A-PORTER GROUP S.p.A. for information purposes only and for use in presentations of the Group’s results and strategies.
For further details on YOOX NET-A-PORTER GROUP S.p.A., reference should be made to publicly available information.
Statements contained in this presentation, particularly regarding any possible or assumed future performance of the Group, are or may be forward-looking statements based on YOOX
NET-A-PORTER GROUP S.p.A.’s current expectations and projections about future events, and in this respect may involve some risks and uncertainties including those related to the
implementation of the technology roadmap.
Actual future results for any quarter, half or annual period may therefore differ materially from those expressed in or implied by these statements due to a number of different factors, many
of which are beyond the ability of YOOX NET-A-PORTER GROUP S.p.A. to control or estimate precisely, including, but not limited to, the Group’s ability to manage the effects of uncertain
current global economic conditions on the business and to predict future economic conditions, the Group’s ability to achieve and manage growth, the degree to which YOOX NET-A-
PORTER GROUP S.p.A. enters into, maintains and develops commercial and partnership agreements, the Group’s ability to successfully identify, develop and retain key employees, manage
and maintain key customer relationships and maintain key supply sources, unfavourable development affecting consumer spending, the rate of growth of the Internet and online commerce,
competition, fluctuations in exchange rates, any failure of information technology, inventory and other asset risk, credit risk on the Group’s accounts, regulatory developments and changes
in tax laws.
YOOX NET-A-PORTER GROUP S.p.A. does not undertake any obligation to publicly release any revisions to any forward-looking statements to reflect events or circumstances after the date
of this presentation.
Any reference to past performance of YOOX NET-A-PORTER GROUP S.p.A. shall not be taken as an indication of future performance.
This document does not constitute an offer or invitation to purchase or subscribe to any shares and no part of it shall form the basis of or be relied upon in connection with any contract or
commitment whatsoever.
By attending the presentation you agree to be bound by the foregoing terms.

P A G E N U M B E R
▪ YOOX NET-A-PORTER GROUP FULL YEAR RESULTS TO 31 DECEMBER 2017
– RESULTS HIGHLIGHTS AND KEY DEVELOPMENTS
– FINANCIAL REVIEW
▪ OUTLOOK FOR 2018
▪ Q&A
P A G E N U M B E R
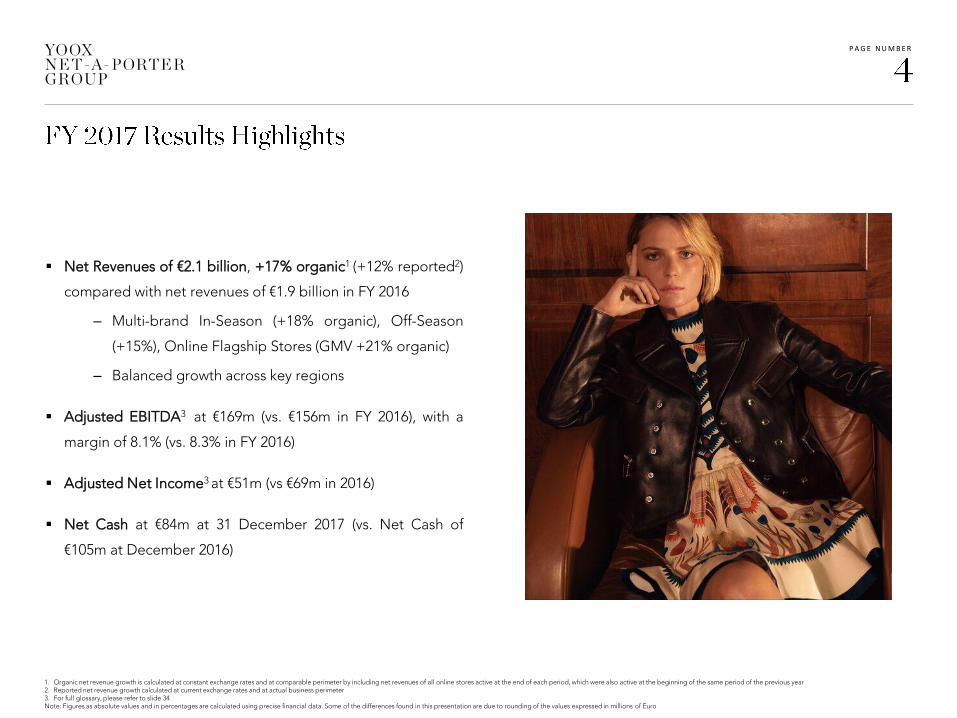
▪ Net Revenues of €2.1 billion, +17% organic1 (+12% reported2)
compared with net revenues of €1.9 billion in FY 2016
– Multi-brand In-Season (+18% organic), Off-Season
(+15%), Online Flagship Stores (GMV +21% organic)
– Balanced growth across key regions
▪ Adjusted EBITDA3 at €169m (vs. €156m in FY 2016), with a
margin of 8.1% (vs. 8.3% in FY 2016)
▪ Adjusted Net Income3 at €51m (vs €69m in 2016)
▪ Net Cash at €84m at 31 December 2017 (vs. Net Cash of
€105m at December 2016)
1. Organic net revenue growth is calculated at constant exchange rates and at comparable perimeter by including net revenues of all online stores active at the end of each period, which were also active at the beginning of the same period of the previous year2. Reported net revenue growth calculated at current exchange rates and at actual business perimeter3. For full glossary, please refer to slide 34Note: Figures as absolute values and in percentages are calculated using precise financial data. Some of the differences found in this presentation are due to rounding of the values expressed in millions of Euro

P A G E N U M B E R
▪ Further strengthening of brand portfolio exclusiveness– Debut of exclusive capsule collections, including MR PORTER X GUCCI, Chloé, Stella McCartney
and Giorgio Armani x NET-A-PORTER– Exclusive launch of Alaïa ready-to-wear collection on NET-A-PORTER
▪ Ongoing development of Fine Jewellery and Watches– Buccellati, Cartier, Chopard, Jaeger-LeCoultre and Piaget on NET-A-PORTER– Boucheron, Chopard, Jaeger-LeCoultre, Officine Panerai and TAG Heuer on MR PORTER
▪ Successful launch of MR PORTER own label, Mr P.▪ Introduction of personal shopping service “You Try, we wait”
▪ New brand additions on both YOOX and THE OUTNET including– Versace and Sergio Rossi on YOOX and Altuzarra and Tabitha Simmons on THE OUTNET
▪ Further expansion of Iris & Ink collection with activewear and beachwear▪ Strengthening of YOOX’s brand awareness
– Successful marketing campaigns encompassing innovative and diversified media mix includingsocial networks, new digital formats and radio
▪ Start of trading of the JV with Alabbar in the Middle East: launch of YOOX with on-the-groundoperations in Dubai ahead of schedule
▪ Kick-off of new Omni-channel business model “NEXT ERA” for Valentino▪ Signing of new multi-year global agreement with Ferrari▪ Launch of isabelmarant.com in Europe, US and APAC▪ Extension of Armani Exchange to Europe, addition of See by Chloé on chloé.com
ONLINE FLAGSHIP STORES
▪ Convergence towards a common Enterprise Resource Planning software (“ERP”)▪ Launch of the first Online Flagship Store on the new front-end platform▪ Completion of convergence of Off-Season business line to a shared Omni-stock platform
PLATFORM
MULTI-BRAND OFF-SEASON
MULTI-BRAND IN-SEASON

P A G E N U M B E R
▪ YOOX NET-A-PORTER GROUP FULL YEAR RESULTS TO 31 DECEMBER 2017
– RESULTS HIGHLIGHTS AND KEY DEVELOPMENTS
– FINANCIAL REVIEW
▪ OUTLOOK FOR 2018
▪ Q&A
P A G E N U M B E R
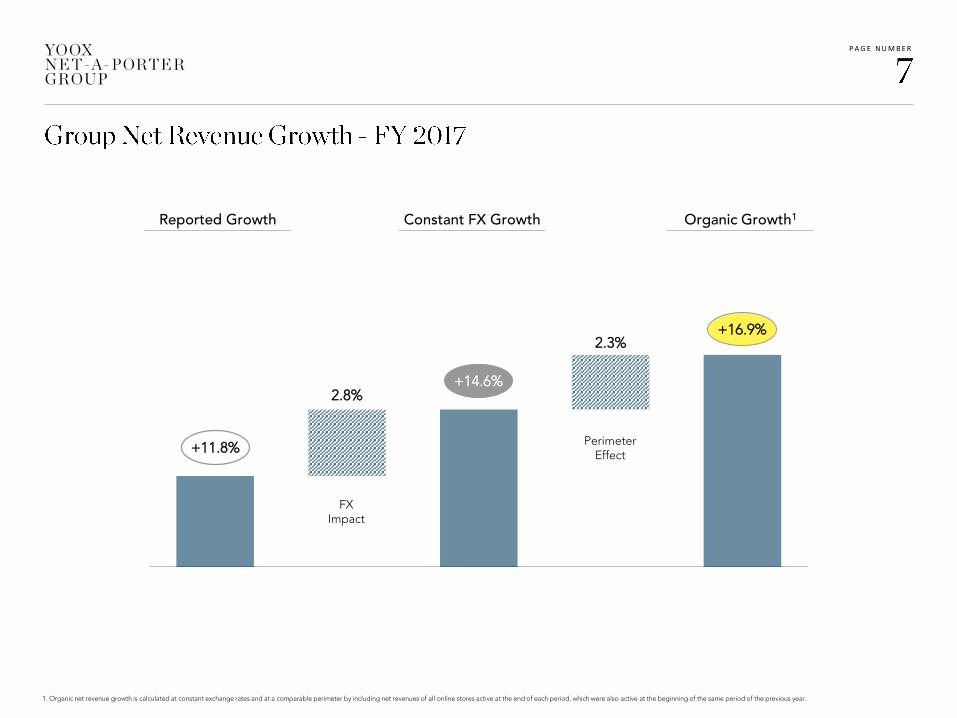
Reported Growth
2.8%
2.3%
Reported Constant Organic
1. Organic net revenue growth is calculated at constant exchange rates and at a comparable perimeter by including net revenues of all online stores active at the end of each period, which were also active at the beginning of the same period of the previous year.
+11.8%
+14.6%
+16.9%
Constant FX Growth Organic Growth1
FX Impact
Perimeter Effect
P A G E N U M B E R
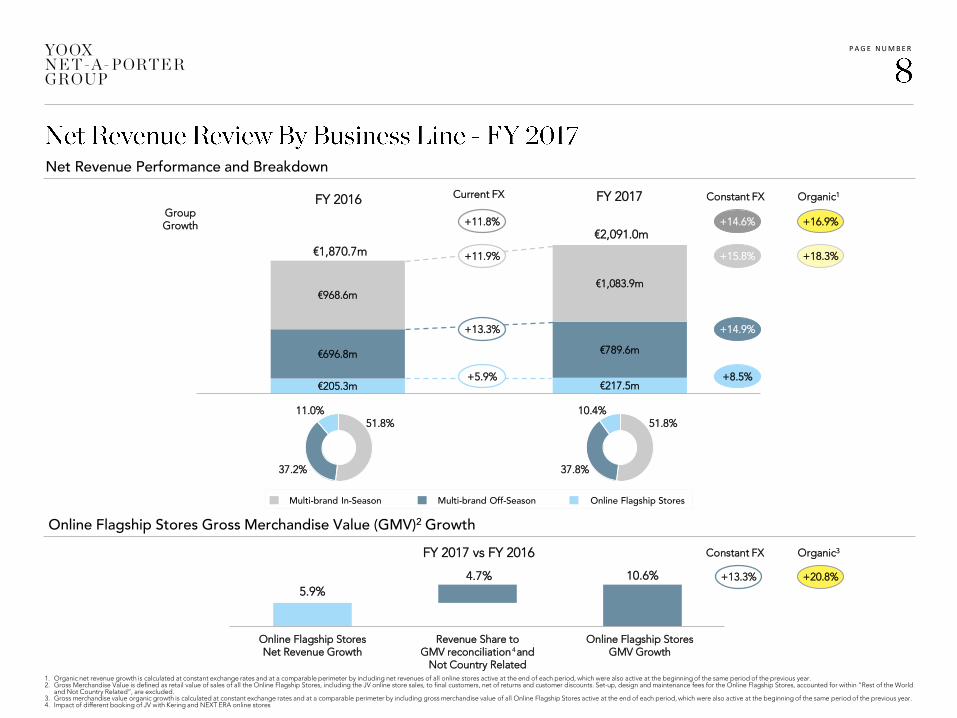
Multi-brand Off-SeasonMulti-brand In-Season Online Flagship Stores
€205.3m €217.5m
€696.8m €789.6m
€968.6m€1,083.9m
Net Revenue Performance and Breakdown
€2,091.0m
€1,870.7m
FY 2017
51.8%
37.2%
51.8%10.4%
Online Flagship Stores Gross Merchandise Value (GMV)2 Growth
11.0%
37.8%
+8.5%
+15.8%
+14.9%
+5.9%
+11.9%
+11.8%
+13.3%
FY 2016
FY 2017 vs FY 2016
+14.6%
+13.3%
Current FX
+18.3%
+16.9%
+20.8%
GroupGrowth
Constant FX Organic1
Constant FX Organic3
5.9%
4.7% 10.6%
Online Flagship StoresNet Revenue Growth
Revenue Share toGMV reconciliation and
Not Country Related
Online Flagship StoresGMV Growth
1. Organic net revenue growth is calculated at constant exchange rates and at a comparable perimeter by including net revenues of all online stores active at the end of each period, which were also active at the beginning of the same period of the previous year.2. Gross Merchandise Value is defined as retail value of sales of all the Online Flagship Stores, including the JV online store sales, to final customers, net of returns and customer discounts. Set-up, design and maintenance fees for the Online Flagship Stores, accounted for within “Rest of the World
and Not Country Related”, are excluded.3. Gross merchandise value organic growth is calculated at constant exchange rates and at a comparable perimeter by including gross merchandise value of all Online Flagship Stores active at the end of each period, which were also active at the beginning of the same period of the previous year.4. Impact of different booking of JV with Kering and NEXT ERA online stores
4
P A G E N U M B E R
(€m )
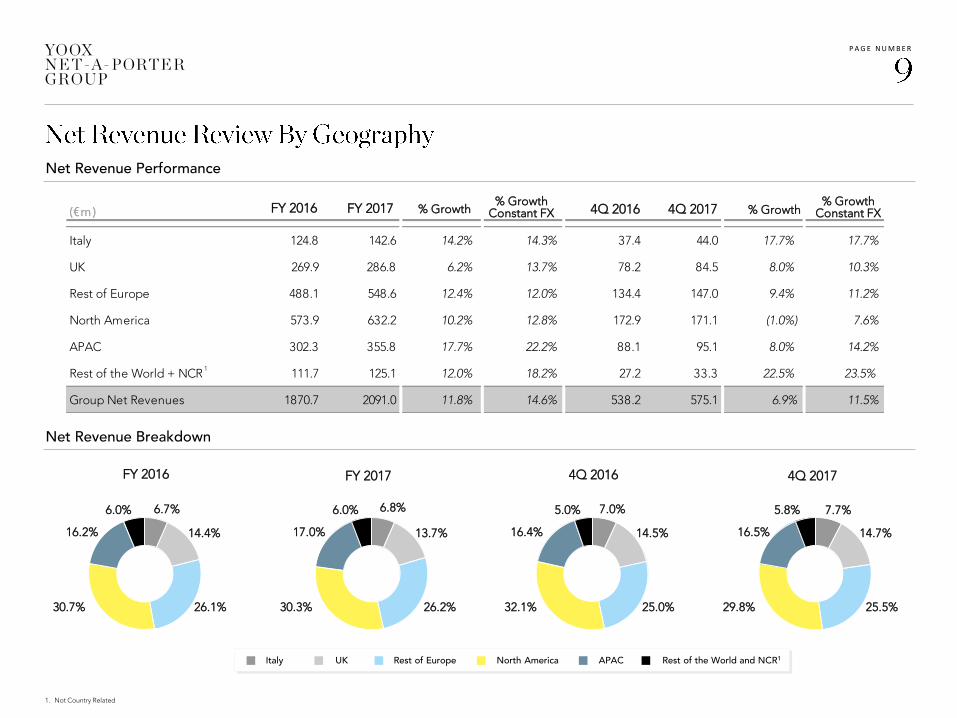
Italy 124.8 142.6 14.2% 14.3% 37.4 44.0 17.7% 17.7%
UK 269.9 286.8 6.2% 13.7% 78.2 84.5 8.0% 10.3%
Rest of Europe 488.1 548.6 12.4% 12.0% 134.4 147.0 9.4% 11.2%
North America 573.9 632.2 10.2% 12.8% 172.9 171.1 (1.0%) 7.6%
APAC 302.3 355.8 17.7% 22.2% 88.1 95.1 8.0% 14.2%
Rest of the World + NCR 111.7 125.1 12.0% 18.2% 27.2 33.3 22.5% 23.5%
Group Net Revenues 1870.7 2091.0 11.8% 14.6% 538.2 575.1 6.9% 11.5%
1. Not Country Related
32.1%
14.5%16.4%
5.0%
25.0%
7.0%
FY 2016 FY 2017
29.8%
14.7%16.5%
5.8% 7.7%
25.5%
4Q 2016 4Q 2017
Net Revenue Performance
Net Revenue Breakdown
Italy UK Rest of Europe APACNorth America Rest of the World and NCR1
FY 2016 FY 2017 % Growth% Growth
Constant FX 4Q 2016 4Q 2017 % Growth% Growth
Constant FX
1
16.2%
6.0%
14.4%
30.7%
6.7%
26.1%
17.0%
6.0%
13.7%
30.3%
6.8%
26.2%
P A G E N U M B E R
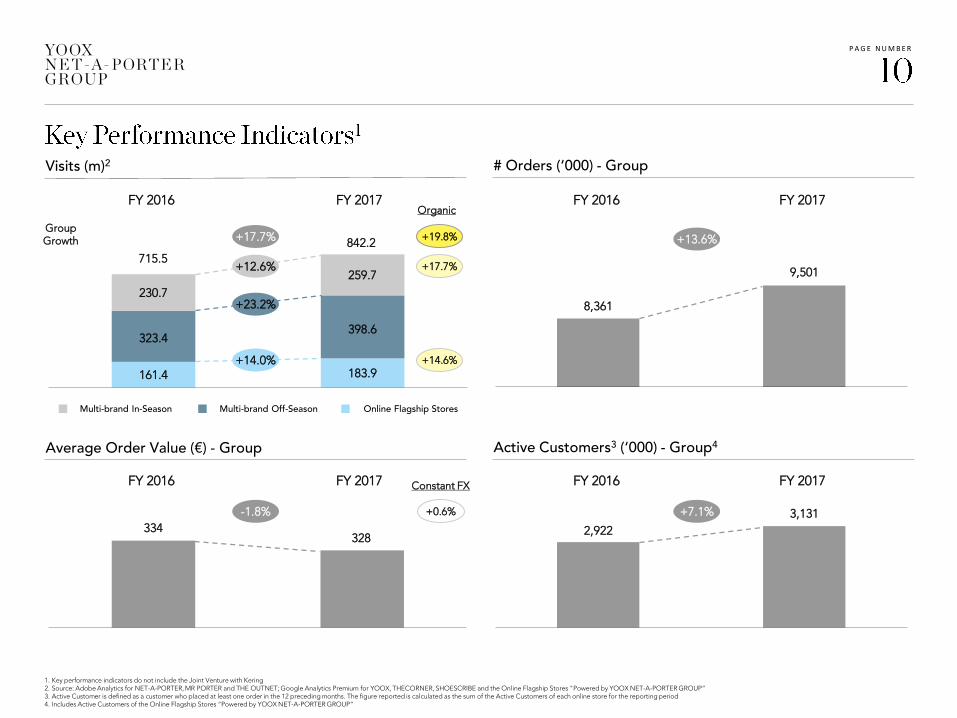
FY 2016 FY 2017
+7.1%
2,922
3,131
# Orders (‘000) - Group
Average Order Value (€) - Group Active Customers3 (‘000) - Group4
FY 2016 FY 2017
+13.6%
8,361
9,501
FY 2016 FY 2017
-1.8%
334328
161.4 183.9
323.4398.6
230.7
259.7
715.5
842.2+17.7%
Visits (m)2
Multi-brand In-Season Multi-brand Off-Season Online Flagship Stores
FY 2016 FY 2017
Constant FX
+0.6%
Organic
+17.7%+12.6%
+14.0%
+23.2%
GroupGrowth +19.8%
+14.6%
1. Key performance indicators do not include the Joint Venture with Kering2. Source: Adobe Analytics for NET-A-PORTER, MR PORTER and THE OUTNET; Google Analytics Premium for YOOX, THECORNER, SHOESCRIBE and the Online Flagship Stores "Powered by YOOX NET-A-PORTER GROUP“3. Active Customer is defined as a customer who placed at least one order in the 12 preceding months. The figure reported is calculated as the sum of the Active Customers of each online store for the reporting period4. Includes Active Customers of the Online Flagship Stores “Powered by YOOX NET-A-PORTER GROUP”
P A G E N U M B E R
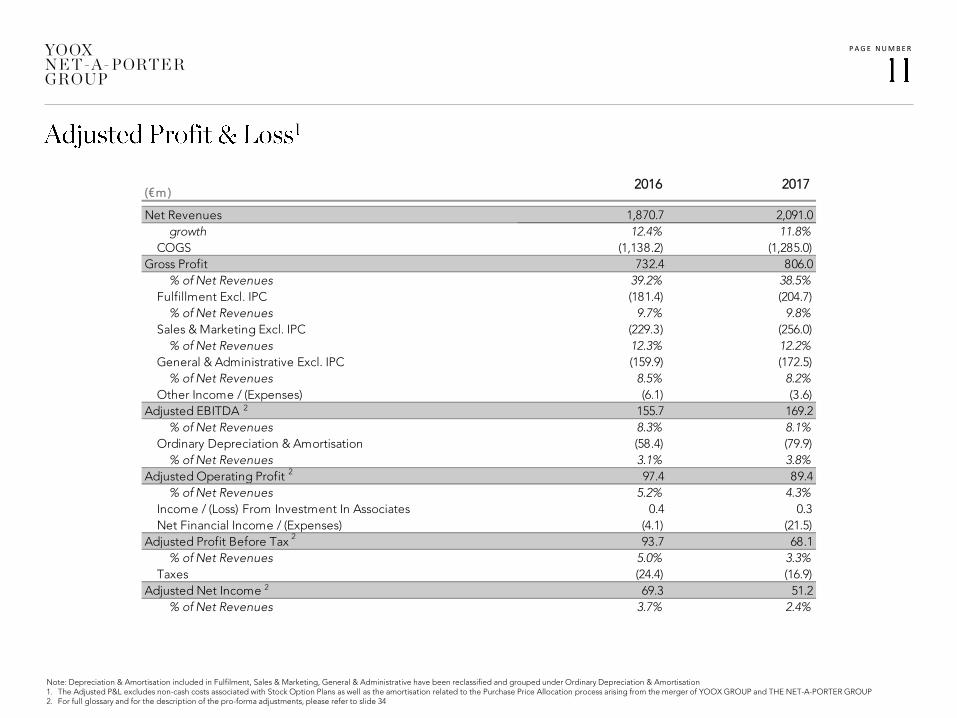
(€m )
Net Revenues 1,870.7 2,091.0
growth 12.4% 11.8%
COGS (1,138.2) (1,285.0)
Gross Profit 732.4 806.0
% of Net Revenues 39.2% 38.5%
Fulfillment Excl. IPC (181.4) (204.7)
% of Net Revenues 9.7% 9.8%
Sales & Marketing Excl. IPC (229.3) (256.0)
% of Net Revenues 12.3% 12.2%
General & Administrative Excl. IPC (159.9) (172.5)
% of Net Revenues 8.5% 8.2%
Other Income / (Expenses) (6.1) (3.6)
Adjusted EBITDA 155.7 169.2
% of Net Revenues 8.3% 8.1%
Ordinary Depreciation & Amortisation (58.4) (79.9)
% of Net Revenues 3.1% 3.8%
Adjusted Operating Profit 97.4 89.4
% of Net Revenues 5.2% 4.3%
Income / (Loss) From Investment In Associates 0.4 0.3
Net Financial Income / (Expenses) (4.1) (21.5)
Adjusted Profit Before Tax 93.7 68.1
% of Net Revenues 5.0% 3.3%
Taxes (24.4) (16.9)
Adjusted Net Income 69.3 51.2
% of Net Revenues 3.7% 2.4%
Note: Depreciation & Amortisation included in Fulfilment, Sales & Marketing, General & Administrative have been reclassified and grouped under Ordinary Depreciation & Amortisation1. The Adjusted P&L excludes non-cash costs associated with Stock Option Plans as well as the amortisation related to the Purchase Price Allocation process arising from the merger of YOOX GROUP and THE NET-A-PORTER GROUP2. For full glossary and for the description of the pro-forma adjustments, please refer to slide 34
20172016
2
2
2
2

P A G E N U M B E R
Note: Depreciation & Amortisation included in Fulfillment, Sales & Marketing, General & Administrative have been reclassified and grouped under Ordinary Depreciation & Amortisation
20172016(€m )
Net Revenues 1,870.7 2,091.0
growth 12.4% 11.8%
COGS (1,138.2) (1,285.0)
Gross Profit 732.4 806.0
% of Net Revenues 39.2% 38.5%
Fulfillment Excl. IPC (181.4) (204.7)
% of Net Revenues 9.7% 9.8%
Sales & Marketing Excl. IPC (229.3) (256.0)
% of Net Revenues 12.3% 12.2%
General & Administrative Excl. IPC (159.9) (172.5)
% of Net Revenues 8.5% 8.2%
Incentive Plan Costs (IPC) (12.4) (12.8)
Other Income / (Expenses) (6.1) (3.6)
Reported EBITDA 143.4 156.5
% of Net Revenues 7.7% 7.5%
Ordinary Depreciation & Amortisation (58.4) (79.9)
% of Net Revenues 3.1% 3.8%
PPA-related amortisation (32.8) (30.6)
% of Net Revenues 1.8% 1.5%
Reported Operating Profit 52.2 46.0
% of Net Revenues 2.8% 2.2%
Income / (Loss) From Investment In Associates 0.4 0.3
Net Financial Income / (Expenses) (4.1) (21.5)
Reported Profit Before Tax 48.5 24.8
% of Net Revenues 2.6% 1.2%
Taxes (14.6) (7.5)
Reported Net Income 33.9 17.3
% of Net Revenues 1.8% 0.8%

P A G E N U M B E R
Gross Profit by Business Line
▪ Gross profit is defined as net revenues less cost of goods sold (“COGS”), which includes shipping costs
Multi-brand In-Season Multi-brand Off-Season Online Flagship Stores
% of divisionNet revenues
41.4%
FY 2017FY 2016
41.5% 37.7%
FY 2017FY 2016
36.2% 33.5%
FY 2017FY 2016
32.4%
€401.3m€449.7m
€262.4m€285.7m
€68.7m €70.6m

P A G E N U M B E R
(€m )
Adjusted EBITDA 155.7 169.2
Realised Net Financial Income / (Expenses) & Associates (8.8) (13.2)
Taxes paid (24.9) (29.7)
Change in Ordinary Working Capital (23.4) 53.3
Capital Expenditure (136.9) (169.3)
Other (19.2) (60.8)
Free Cash Flow (57.6) (50.4)
Translation Adj. 5.5
Free Cash Flow at Constant FX (57.6) (44.9)
€104.7m
€169.2m
€(13.2)m€(29.7)m
€53.3m
€(169.3)m
€(60.8)m
€29.4m €83.7m
Dec 2016Net Cash
AdjustedEBITDA
Net FinancialIncome / (Expenses)
& Associates
Taxespaid
Change inOrdinaryWorkingCapital
CapitalExpenditure
Other AlabbarEquity
Contribution
Dec 2017Net Cash
Cash Flow Statement
Net Financial Position Evolution
2016
1
1
2017
1. Mainly refers to deferred tax assets and liabilities, exchange rate impact resulting from the consolidation of foreign subsidiaries and other reserves 2. Translation Adjustments refer to the delta FX which arises from converting Ordinary Working Capital, Capital Expenditure and Other into Euro at the exchange rates as of 31 December 2017 and as of 31 December 20163. Equity injection by Symphony, a company controlled by Mohamed Alabbar’s family, into Middle East Joint Venture
3
2

P A G E N U M B E R
(€m )
Inventories 578.2 704.2 (126.0)
Trade Receivables 32.4 52.5 (20.1)
Trade Payables (399.4) (588.7) 189.3
Other Receivables / (Payables) (91.7) (101.8) 10.2
Ordinary Net Working Capital 119.5 66.2 53.3
as % of LTM Net Revenues 6.4% 3.2%
% of Net Revenues
€136.9m
€169.3m
7.3% 8.1%
2016 2017
Net Working Capital
Capital Expenditure
Technology Operations Other
Dec 2017Dec 2016 FY 2017
Balance Sheet Cash Flow

P A G E N U M B E R
▪ YOOX NET-A-PORTER GROUP FULL YEAR RESULTS TO 31 DECEMBER 2017
– RESULTS HIGHLIGHTS AND KEY DEVELOPMENTS
– FINANCIAL REVIEW
▪ OUTLOOK FOR 2018
▪ Q&A

P A G E N U M B E R
▪ Further enrichment of In-Season product offer
− Key brand additions and capsule collections including Balenciaga exclusive capsules for
NET-A-PORTER and MR PORTER
− Expansion of Mr P. RTW offering through Shoes and Accessories
− Consolidating leading position within Hard Luxury
− Strengthening of shoe category
▪ Ongoing focus on EIPs
▪ Strengthening content to commerce proposition with the launch of PORTER Digital
▪ Further enrichment of brand offering including See by Chloé shop-in-shop on YOOX and
Stuart Weitzman on THE OUTNET
▪ Roll-out of THE OUTNET international expansion
− launch of localised versions in Middle East, Japan, Germany, France and Russia
▪ Official debut of YOOX private label
▪ New business developments
– Signed 5-year global partnership with Balmain, launching this year
– Go-live of ferrari.com
– Global partnership with Stone Island renewed for a further 5 years until 2023
▪ Capitalising on the Omni-channel opportunity
– Ongoing investments in NEXT ERA, unlocking “single view of inventory” for Valentino
– Implementation of omni-channel functionalities to more of the Group’s stores
ONLINE FLAGSHIP STORES
MULTI-BRAND OFF-SEASON
MULTI-BRAND IN-SEASON
MOBILE FIRST
▪ Ongoing investments to deliver world-class mobile experience
− Releases of new apps for all of the Group’s multi-brand online stores
− Development of omni-channel in-store app for our mono-brand partners
P A G E N U M B E R
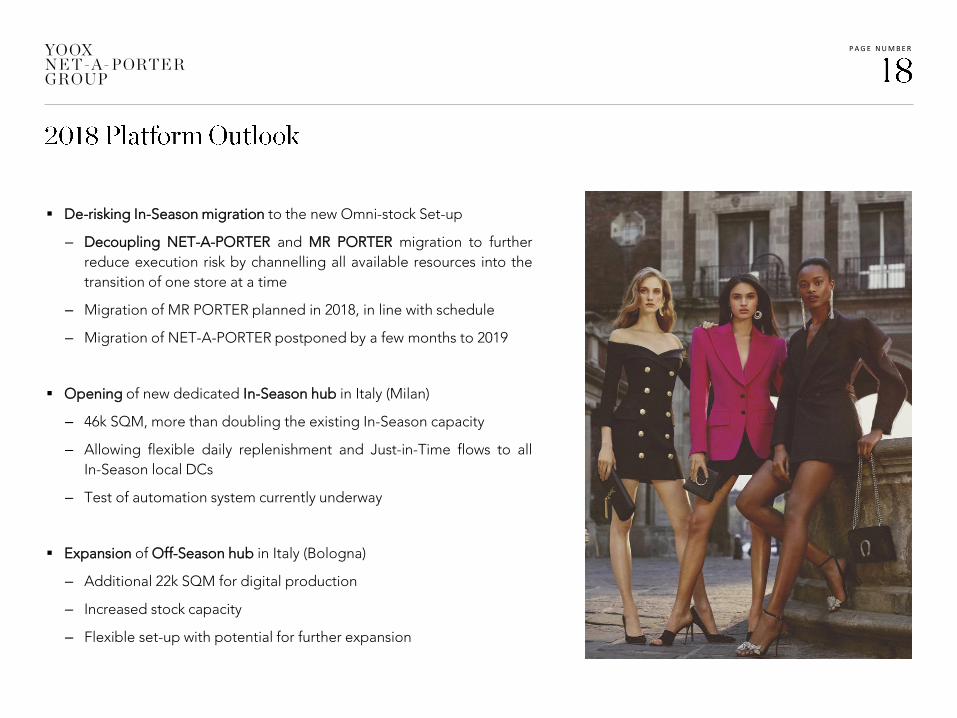
▪ De-risking In-Season migration to the new Omni-stock Set-up
– Decoupling NET-A-PORTER and MR PORTER migration to further
reduce execution risk by channelling all available resources into the
transition of one store at a time
– Migration of MR PORTER planned in 2018, in line with schedule
– Migration of NET-A-PORTER postponed by a few months to 2019
▪ Opening of new dedicated In-Season hub in Italy (Milan)
– 46k SQM, more than doubling the existing In-Season capacity
– Allowing flexible daily replenishment and Just-in-Time flows to all
In-Season local DCs
– Test of automation system currently underway
▪ Expansion of Off-Season hub in Italy (Bologna)
– Additional 22k SQM for digital production
– Increased stock capacity
– Flexible set-up with potential for further expansion
P A G E N U M B E R
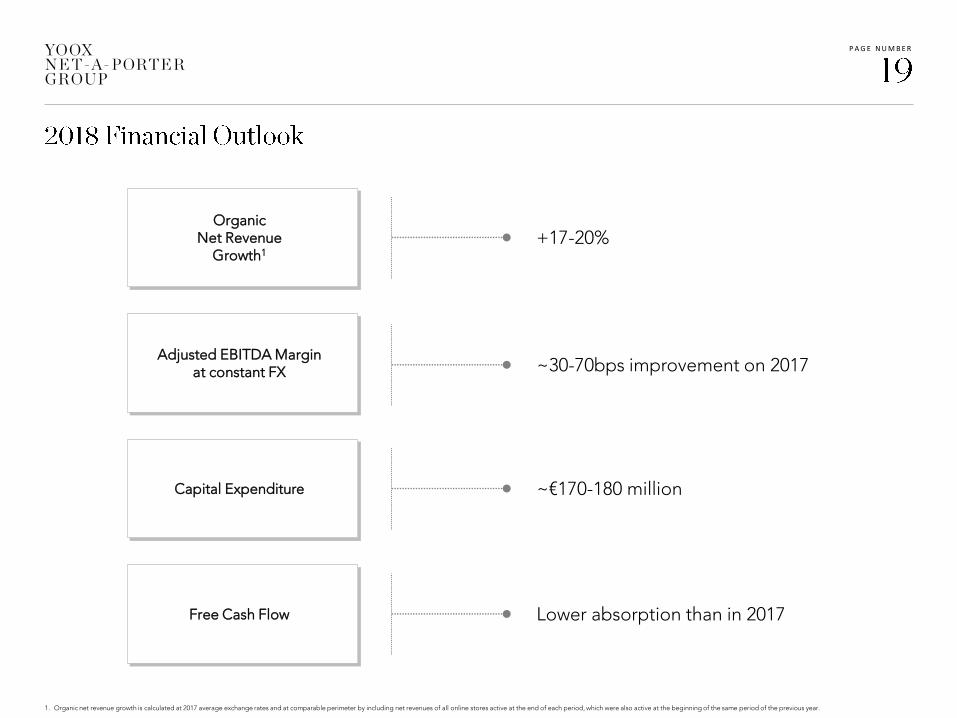
1. Organic net revenue growth is calculated at 2017 average exchange rates and at comparable perimeter by including net revenues of all online stores active at the end of each period, which were also active at the beginning of the same period of the previous year.
Organic Net Revenue
Growth1+17-20%
Capital Expenditure
Free Cash Flow
~30-70bps improvement on 2017
~€170-180 million
Lower absorption than in 2017
Adjusted EBITDA Margin at constant FX

P A G E N U M B E R
▪ YOOX NET-A-PORTER GROUP FULL YEAR RESULTS TO 31 DECEMBER 2017
– RESULTS HIGHLIGHTS AND KEY DEVELOPMENTS
– FINANCIAL REVIEW
▪ OUTLOOK FOR 2018
▪ Q&A

P A G E N U M B E R
▪ FY 2017 RESULTS
– FROM EBITDA TO NET INCOME
– FOCUS ON INCENTIVE PLAN COSTS
– NET FINANCIAL POSITION AND DEBT FACILITIES OVERVIEW
– SUMMARY BALANCE SHEET
▪ 4Q 2017 NET REVENUES BY BUSINESS LINE
▪ 2H 2017 RESULTS
▪ ONLINE FLAGSHIP STORES POWERED BY YOOX NET-A-PORTER GROUP
▪ SHAREHOLDER STRUCTURE
▪ EXCHANGE RATES

P A G E N U M B E R
% of Net Revenues
€155.7m
€(12.4)m
€143.4m
€(58.4)m
€(32.8)m
€52.2m €0.4m
€(4.1)m€(14.6)m
€33.9m
€35.4m €69.3m
AdjustedEBITDA
Incentive PlanCosts
("IPCs")
EBITDA OrdinaryD&A
PPA-relatedamortisation
EBIT Income/ (Loss)From
Associates
Net FinancialIncome /
(Expenses)
Taxes NetIncome
IPCs & PPARelated D&Anet of related
tax effects
AdjustedNet
Income
8.3% 7.7% 3.7%1.8%2.8%
€169.2m
€(12.8)m
€156.5m
€(79.9)m
€(30.6)m
€46.0m €0.3m
€(21.5)m €(7.5)m€17.3m
€34.0m €51.2m
AdjustedEBITDA
Incentive PlanCosts
("IPCs")
EBITDA OrdinaryD&A
PPA-relatedamortisation
EBIT Income/ (Loss)From
Associates
Net FinancialIncome /
(Expenses)
Taxes NetIncome
IPCs & PPARelated D&Anet of related
tax effects
AdjustedNet
Income
FY 2016
FY 2017
% of Net Revenues 8.1% 7.5% 2.4%0.8%2.2%

P A G E N U M B E R
(€m )
Fulf i l lm ent (181.417) (204.734)
of which Incentive Plan Costs (0.059) 0.5% (0.057) 0.4%
Sales & Marketing (230.775) (256.710)
of which Incentive Plan Costs (1.468 ) 11.9% (0.711) 5.6%
General & Adm inistrative (170.738) (184.462)
of which Incentive Plan Costs (10.8 23 ) 87.6% (11.991) 94.0%
Incentive Plan Costs (12.3 51) 100.0% (12.759) 100.0%
EBITDA 143 .3 52 156.48 9
% of Net Revenues 7.7% 7.5%
Incentive Plan Costs (12.351) (12.759)
Adjusted EBITDA 1 155.703 169.248
% of Net Revenues 8.3% 8.1%
FY 2016% of Total
FY 2017% of Total
1. For full glossary and the description of the pro-forma adjustments, please refer to slide 34
P A G E N U M B E R
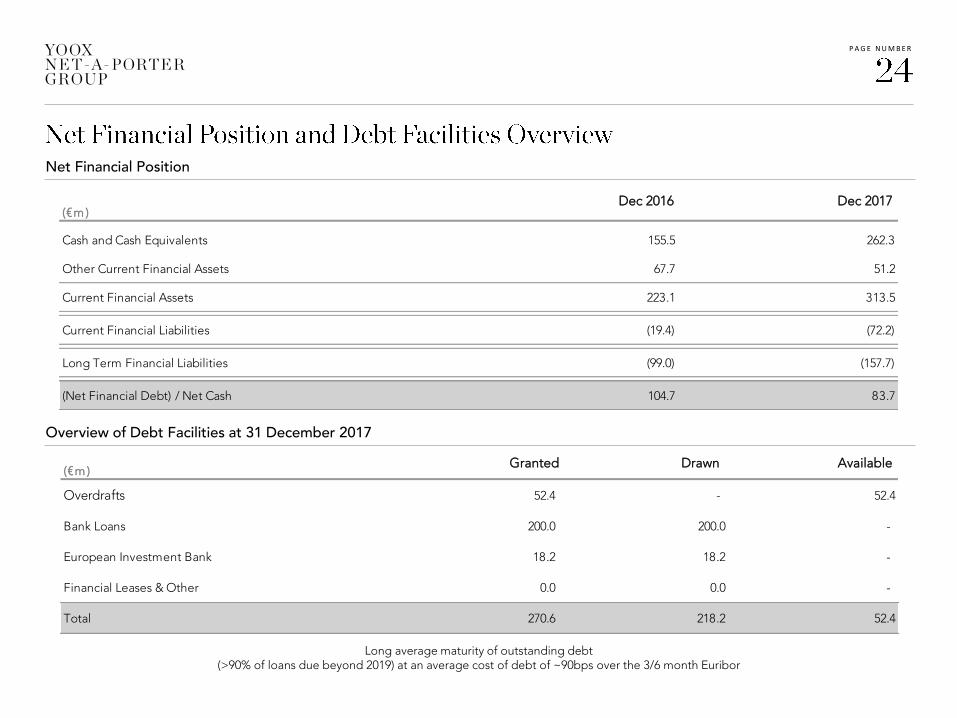
(€m )
Cash and Cash Equivalents 155.5 262.3
Other Current Financial Assets 67.7 51.2
Current Financial Assets 223.1 313.5
Current Financial Liabilities (19.4) (72.2)
Long Term Financial Liabilities (99.0) (157.7)
(Net Financial Debt) / Net Cash 104.7 83.7
(€m )
Overdrafts 52.4 - 52.4
Bank Loans 200.0 200.0 -
European Investment Bank 18.2 18.2 -
Financial Leases & Other 0.0 0.0 -
Total 270.6 218.2 52.4
Dec 2017Dec 2016
Long average maturity of outstanding debt (>90% of loans due beyond 2019) at an average cost of debt of ~90bps over the 3/6 month Euribor
AvailableDrawnGranted
Net Financial Position
Overview of Debt Facilities at 31 December 2017
P A G E N U M B E R
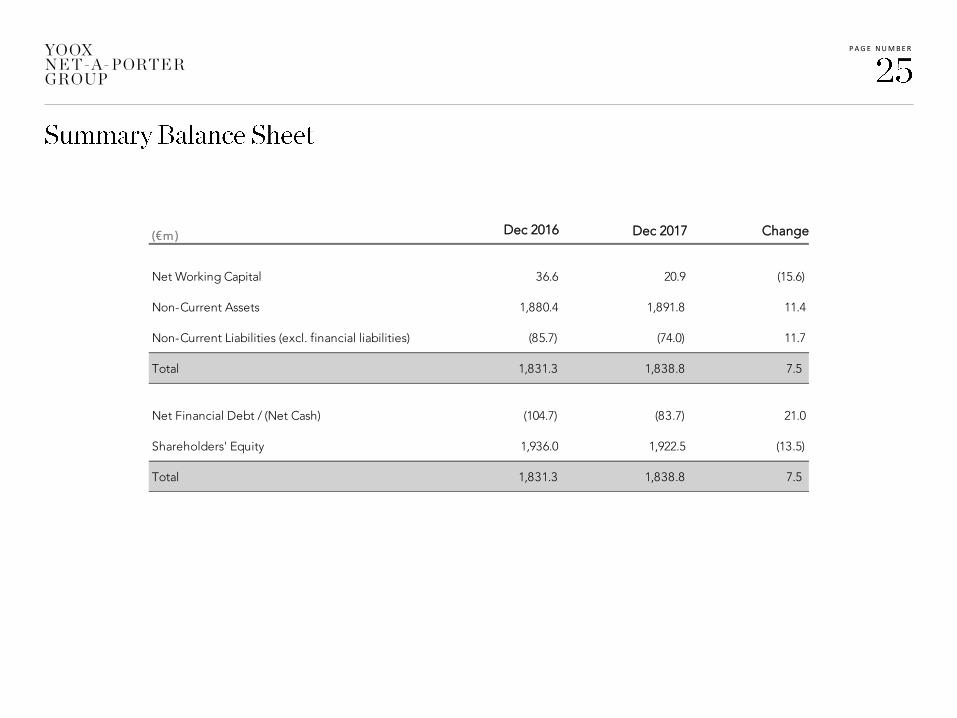
(€m )
Net Working Capital 36.6 20.9 (15.6)
Non-Current Assets 1,880.4 1,891.8 11.4
Non-Current Liabilities (excl. financial liabilities) (85.7) (74.0) 11.7
Total 1,831.3 1,838.8 7.5
Net Financial Debt / (Net Cash) (104.7) (83.7) 21.0
Shareholders' Equity 1,936.0 1,922.5 (13.5)
Total 1,831.3 1,838.8 7.5
ChangeDec 2016 Dec 2017

P A G E N U M B E R
Reported Growth
4.6%
1.7%
Reported Constant Organic
1. Organic net revenue growth is calculated at constant exchange rates and at a comparable perimeter by including net revenues of all online stores active at the end of each period, which were also active at the beginning of the same period of the previous year.
+6.9%
+11.5%
+13.2%
Constant FX Growth Organic Growth1
FX Impact
Perimeter Effect

P A G E N U M B E R
€74.3m €75.7m
€200.6m €204.4m
€263.4m €295.1m
Net Revenue Performance and Breakdown
Constant FX4Q 2017GroupGrowth
48.9%13.8%
51.3%
35.5%
1. Organic net revenue growth is calculated at constant exchange rates and at a comparable perimeter by including net revenues of all online stores active at the end of each period, which were also active at the beginning of the same period of the previous year.2. Gross Merchandise Value is defined as retail value of sales of all the Online Flagship Stores, including the JV online store sales, to final customers, net of returns and customer discounts. Set-up, design and maintenance fees for the Online Flagship Stores, accounted for within “Rest of the World
and Not Country Related”, are excluded.3. Gross merchandise value organic growth is calculated at constant exchange rates and at a comparable perimeter by including gross merchandise value of all Online Flagship Stores active at the end of each period, which were also active at the beginning of the same period of the previous year.4. Impact of different booking of JV with Kering and NEXT ERA online stores
37.3%
13.2%
+5.9%
+16.8%
+6.6%
€575.1m
+1.9%
+6.9%
+1.9%
+12.0%
4Q 2016
4Q 2017 vs 4Q 2016
+11.5%
Constant FX
+12.0%
Organic1
+13.2%
Organic3
+22.1%
Current FX
€538.2m
Online Flagship Stores Gross Merchandise Value (GMV)2 Growth
Multi-brand Off-SeasonMulti-brand In-Season Online Flagship Stores
1.9%
5.5% 7.4%
Online Flagship StoresNet Revenue Growth
Revenue Share toGMV reconciliation and
Not Country Related
Online Flagship Stores GMV Growth4

P A G E N U M B E R
(€m )
Net Revenues 973.6 1,056.9
growth 11.5% 8.6%
COGS (596.1) (665.4)
Gross Profit 377.5 391.5
% of Net Revenues 38.8% 37.0%
Fulfillment Excl. IPC (92.9) (104.8)
% of Net Revenues 9.5% 9.9%
Sales & Marketing Excl. IPC (123.3) (131.6)
% of Net Revenues 12.7% 12.4%
General & Administrative Excl. IPC (78.9) (84.9)
% of Net Revenues 8.1% 8.0%
Other Income / (Expenses) (3.3) 1.1
Adjusted EBITDA 79.2 71.3
% of Net Revenues 8.1% 6.7%
Ordinary Depreciation & Amortisation (34.0) (43.4)
% of Net Revenues 3.5% 4.1%
Adjusted Operating Profit 45.2 27.9
% of Net Revenues 4.6% 2.6%
Income / (Loss) From Investment In Associates 0.1 0.2
Net Financial Income / (Expenses) (3.0) (11.5)
Adjusted Profit Before Tax 42.3 16.5
% of Net Revenues 4.3% 1.6%
Taxes (10.0) (3.4)
Adjusted Net Income 32.2 13.2
% of Net Revenues 3.3% 1.2%
Note: Depreciation & Amortisation included in Fulfilment, Sales & Marketing, General & Administrative have been reclassified and grouped under Ordinary Depreciation & Amortisation1. The Adjusted P&L excludes non-cash costs associated with Stock Option Plans as well as the amortisation related to the Purchase Price Allocation process arising from the merger of YOOX GROUP and THE NET-A-PORTER GROUP2. For full glossary and for the description of the pro-forma adjustments, please refer to slide 34
2H 20172H 2016
2
2
2
2

P A G E N U M B E R
(€m )
Net Revenues 973.6 1,056.9
growth 11.5% 8.6%
COGS (596.1) (665.4)
Gross Profit 377.5 391.5
% of Net Revenues 38.8% 37.0%
Fulfillment Excl. IPC (92.9) (104.8)
% of Net Revenues 9.5% 9.9%
Sales & Marketing Excl. IPC (123.3) (131.6)
% of Net Revenues 12.7% 12.4%
General & Administrative Excl. IPC (78.9) (84.9)
% of Net Revenues 8.1% 8.0%
Incentive Plan Costs (IPC) (6.4) (6.2)
Other Income / (Expenses) (3.3) 1.1
Reported EBITDA 72.7 65.0
% of Net Revenues 7.5% 6.2%
Ordinary Depreciation & Amortisation (34.0) (43.4)
% of Net Revenues 3.5% 4.1%
PPA-related amortisation (15.6) (15.0)
% of Net Revenues 1.6% 1.4%
Reported Operating Profit 23.2 6.7
% of Net Revenues 2.4% 0.6%
Income / (Loss) From Investment In Associates 0.1 0.2
Net Financial Income / (Expenses) (3.0) (11.5)
Reported Profit Before Tax 20.3 -4.6
% of Net Revenues 2.1% (0.4)%
Taxes (5.2) 1.3
Reported Net Income 15.1 -3.3
% of Net Revenues 1.6% (0.3)%
Note: Depreciation & Amortisation included in Fulfillment, Sales & Marketing, General & Administrative have been reclassified and grouped under Ordinary Depreciation & Amortisation
2H 20172H 2016

P A G E N U M B E R
(€m )
Adjusted EBITDA 79.2 71.3
Realised Net Financial Income / (Expenses) & Associates (6.2) (7.6)
Taxes paid (14.0) (13.2)
Change in Ordinary Working Capital (0.2) 59.5
Capital Expenditure (88.8) (89.0)
Other (4.2) (31.3)
Free Cash Flow 32.9 (10.4)
Translation Adj. 1.2
Free Cash Flow at Constant FX (34.3) (9.1)
€84.7m
€71.3m
€(7.6)m€(13.2)m
€59.5m
€(89.0)m €(31.3)m
€9.3m €83.7m
Jun 2017Net Cash
AdjustedEBITDA
Net FinancialIncome / (Expenses)
& Associates
Taxespaid
Change inOrdinaryWorkingCapital
CapitalExpenditure
Other AlabbarEquity
Contribution
Dec 2017Net Cash
Cash Flow Statement
Net Financial Position Evolution
2H 2017
1
1
2H 2016
1. Mainly refers to deferred tax assets and liabilities, exchange rate impact resulting from the consolidation of foreign subsidiaries and other reserves 2. Translation Adjustments refer to the delta FX which arises from converting Ordinary Working Capital, Capital Expenditure and Other into Euro at the exchange rates as of 31 December 2017 and as of 31 December 20163. Equity injection by Symphony, a company controlled by Mohamed Alabbar’s family, into Middle East Joint Venture
3
2
P A G E N U M B E R
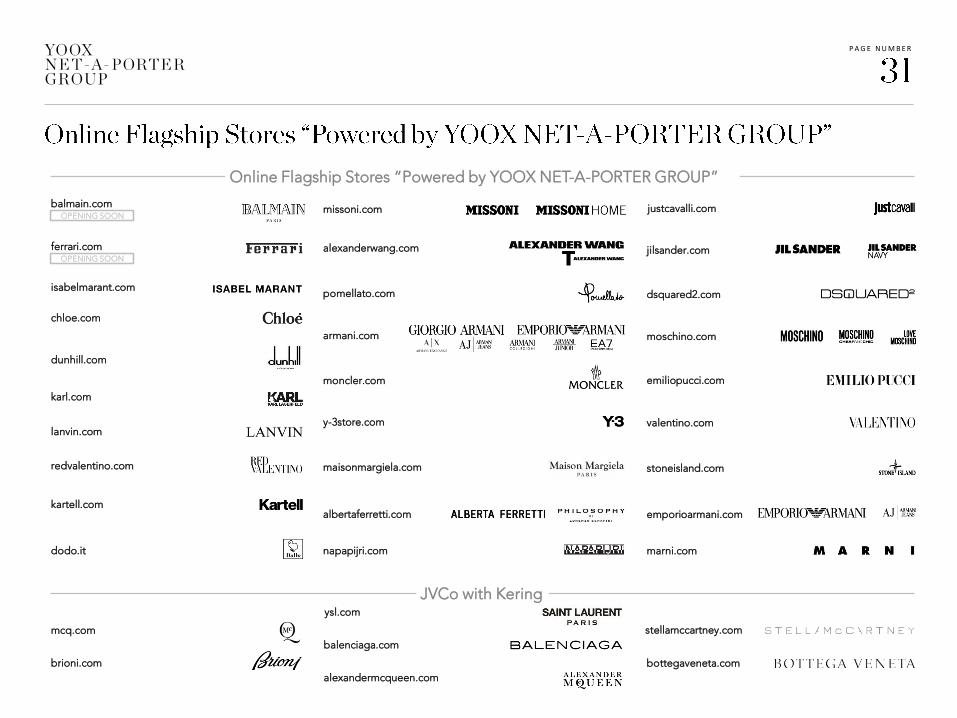
Online Flagship Stores “Powered by YOOX NET-A-PORTER GROUP”
JVCo with Kering
alexanderwang.com
pomellato.com
moncler.com
dodo.it
dsquared2.com
moschino.com
emiliopucci.com
stoneisland.com
marni.com
jilsander.com
valentino.com
emporioarmani.comalbertaferretti.com
justcavalli.com
y-3store.com
kartell.com
ysl.com
mcq.com
bottegaveneta.com
alexandermcqueen.com
stellamccartney.com
balenciaga.com
missoni.com
redvalentino.com
lanvin.com
brioni.com
chloe.com
dunhill.com
karl.com
maisonmargiela.com
napapijri.com
isabelmarant.com
armani.com
OPENING SOON
ferrari.com
OPENING SOON
balmain.com

P A G E N U M B E R
Feder ico Marchet t i 7 ,581,814 5.4% 5,164,667 3.8% 7,581,814 7.5% 5,164,667 5.6%
YNAP Managem ent team and other stock option holders 3,886,528 2.8% 3,886,528 3.9%
Sub-total 11,468,342 8.1% 5,164,667 3.8% 11,468,342 11.4% 5,164,667 5.6%
Richem ont 65,599,597 46.5% 65,599,597 48.7% 25,155,391 25.0% 22,786,452 24.8%
Renzo Rosso 5,186,321 3.7% 5,186,321 3.8% 5,186,321 5.2% 5,186,321 5.6%
Alabbar Enterprises 3,571,428 2.5% 3,571,428 2.6% 3,571,428 3.5% 3,571,428 3.9%
Schroders 3,508,554 2.5% 3,508,554 2.6% 3,508,554 3.5% 3,508,554 3.8%
T. Rowe Price Associates 3,504,210 2.5% 3,504,210 2.6% 3,504,210 3.5% 3,504,210 3.8%
Capital Research and Managem ent Com pany 2,810,960 2.0% 2,810,960 2.1% 2,810,960 2.8% 2,810,960 3.1%
Fidelity International 2,418,091 1.7% 2,418,091 1.8% 2,418,091 2.4% 2,418,091 2.6%
Market 42,998,266 30.5% 42,998,266 31.9% 42,998,266 42.7% 42,998,266 46.8%
Tota l Outs tanding Shares 141,065,769 100.0% 134,762,094 100.0% 100,621,563 100.0% 91,948,949 100.0%
Treasury Shares 17,339 0.0% 17,339 0.0% 17,339 0.0% 17,339 0.0%
Tota l Issued Shares 141,083,108 100.0% 134,779,433 100.0% 100,638,902 100.0% 91,966,288 100.0%
Shareholders
Total Ordinary Capital (Voting)
Total Share Capital (Ordinary + Non-voting)
1 1
Updated as of 6 March 20181. Computed assuming that all of the stock options granted and not lapsed under the YOOX NET-A-PORTER GROUP S.p.A.’s stock option plans (6,295,147 options related to the 2015-2025 Plan in the ratio of 1 share for each option and 164
options related to the 2007-2012 Plan in the ratio of 52 shares for each option) are exercised2. Excludes Federico Marchetti3. The number of ordinary shares is calculated assuming that Richemont converts 2,368,938 non-voting shares to ordinary shares (ratio of 1:1) in order to re-establish the maximum of 25% of shares with voting rights as stipulated by the Bylaws
3
2
Diluted Current Diluted Current
P A G E N U M B E R
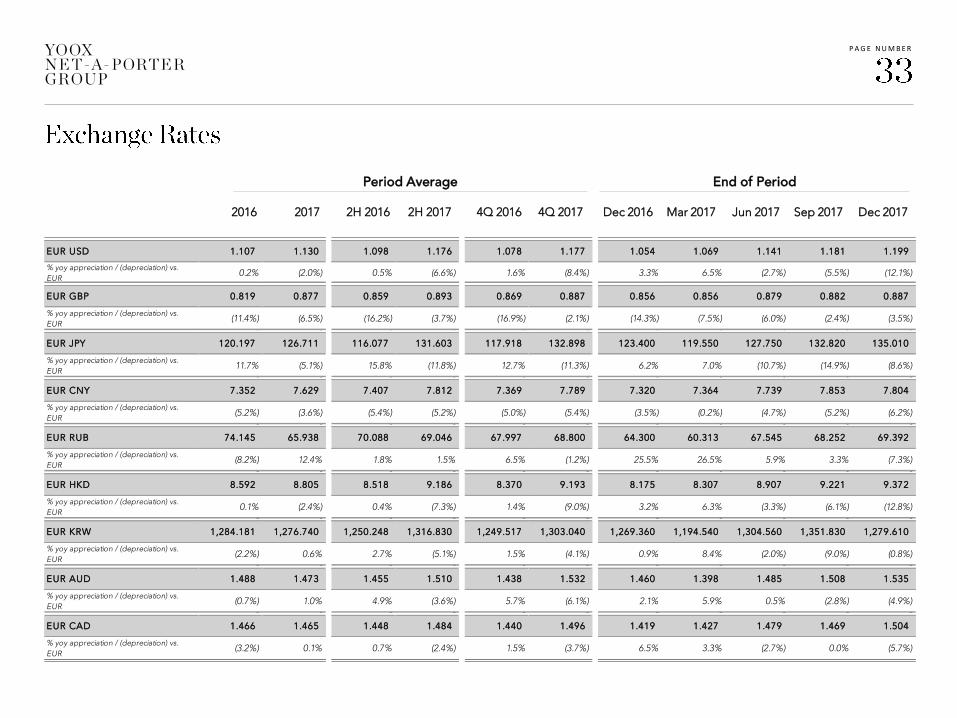
EUR USD 1.107 1.130 1.098 1.176 1.078 1.177 1.054 1.069 1.141 1.181 1.199
% yoy appreciation / (depreciation) vs.
EUR0.2% (2.0%) 0.5% (6.6%) 1.6% (8.4%) 3.3% 6.5% (2.7%) (5.5%) (12.1%)
0 0 0 0 0 0 0 0 0 0 0
EUR GBP 0.819 0.877 0.859 0.893 0.869 0.887 0.856 0.856 0.879 0.882 0.887
% yoy appreciation / (depreciation) vs.
EUR(11.4%) (6.5%) (16.2%) (3.7%) (16.9%) (2.1%) (14.3%) (7.5%) (6.0%) (2.4%) (3.5%)
0 0 0 0 0 0 0 0 0 0 0
EUR JPY 120.197 126.711 116.077 131.603 117.918 132.898 123.400 119.550 127.750 132.820 135.010
% yoy appreciation / (depreciation) vs.
EUR11.7% (5.1%) 15.8% (11.8%) 12.7% (11.3%) 6.2% 7.0% (10.7%) (14.9%) (8.6%)
0 0 0 0 0 0 0 0 0 0 0
EUR CNY 7.352 7.629 7.407 7.812 7.369 7.789 7.320 7.364 7.739 7.853 7.804
% yoy appreciation / (depreciation) vs.
EUR(5.2%) (3.6%) (5.4%) (5.2%) (5.0%) (5.4%) (3.5%) (0.2%) (4.7%) (5.2%) (6.2%)
0 0 0 0 0 0 0 0 0 0 0
EUR RUB 74.145 65.938 70.088 69.046 67.997 68.800 64.300 60.313 67.545 68.252 69.392
% yoy appreciation / (depreciation) vs.
EUR(8.2%) 12.4% 1.8% 1.5% 6.5% (1.2%) 25.5% 26.5% 5.9% 3.3% (7.3%)
0 0 0 0 0 0 0 0 0 0 0
EUR HKD 8.592 8.805 8.518 9.186 8.370 9.193 8.175 8.307 8.907 9.221 9.372
% yoy appreciation / (depreciation) vs.
EUR0.1% (2.4%) 0.4% (7.3%) 1.4% (9.0%) 3.2% 6.3% (3.3%) (6.1%) (12.8%)
0 0 0 0 0 0 0 0 0 0 0
EUR KRW 1,284.181 1,276.740 1,250.248 1,316.830 1,249.517 1,303.040 1,269.360 1,194.540 1,304.560 1,351.830 1,279.610
% yoy appreciation / (depreciation) vs.
EUR(2.2%) 0.6% 2.7% (5.1%) 1.5% (4.1%) 0.9% 8.4% (2.0%) (9.0%) (0.8%)
0 0 0 0 0 0 0 0 0 0 0
EUR AUD 1.488 1.473 1.455 1.510 1.438 1.532 1.460 1.398 1.485 1.508 1.535
% yoy appreciation / (depreciation) vs.
EUR(0.7%) 1.0% 4.9% (3.6%) 5.7% (6.1%) 2.1% 5.9% 0.5% (2.8%) (4.9%)
0 0 0 0 0 0 0 0 0 0 0
EUR CAD 1.466 1.465 1.448 1.484 1.440 1.496 1.419 1.427 1.479 1.469 1.504
% yoy appreciation / (depreciation) vs.
EUR(3.2%) 0.1% 0.7% (2.4%) 1.5% (3.7%) 6.5% 3.3% (2.7%) 0.0% (5.7%)
Period Average End of Period
2016 4Q 2016 4Q 2017 Mar 2017Dec 2016 Jun 2017 Sep 20172017 Dec 20172H 2016 2H 2017

P A G E N U M B E R
▪ Gross Merchandise Value (GMV): GMV is defined as retail value of sales of all the Online Flagship Stores, including the JV online store sales to
final customers, net of returns and customer discounts. Set-up, design and maintenance fees for the Online Flagship Stores, accounted for
within “Rest of the World and Not Country Related”, are excluded
▪ Adjusted EBITDA: Adjusted EBITDA is defined as reported EBITDA before the non-cash costs associated with the existing Stock Option Plans
▪ Adjusted Operating Profit: Adjusted Operating Profit is defined as reported Operating Profit before the non-cash costs associated with the
existing Stock Option Plans and the non-cash amortisation related to the Purchase Price Allocation (“PPA”) arising from the merger
▪ Adjusted Profit Before Tax: Adjusted Profit Before Tax is defined as reported Profit Before Tax before the non-cash costs associated with the
existing Stock Option Plans and the non-cash amortisation related to the Purchase Price Allocation (“PPA”) arising from the merger
▪ Adjusted Net Income: Adjusted Net Income is defined as reported net income before the non-cash costs associated with the existing Stock
Option Plans, net of their related tax effects, and before the non-cash amortisation related to the Purchase Price Allocation (“PPA”) arising
from the merger, net of its related tax effect
T H I S D O C U M E N T I S P R O P R I E T A R Y A N D C O N F I D E N T I A L . N O P A R T O F T H I S D O C U M E N T M A Y B E D I S C L O S E D I N
A N Y M A N N E R T O A T H I R D P A R T Y W I T H O U T T H E P R I O R W R I T T E N C O N S E N T O F Y O O X N E T - A - P O R T E R G R O U P
@ynap
www.ynap.com
Follow us:
YOOX NET-A-PORTER GROUP