
Page 1 of 2 - Mission...
96
hhfma02.qc14.1_sh.tdxex Corporation reported the following figures: (Click the icon to view the figures.) Horizontal analysis of 's balance sheet for 2011 would report Page 1 of 2
Transcript of Page 1 of 2 - Mission...
hhfma02.qc14.1_sh.tdxex
Corporation reported the following figures:
(Click the icon to view the figures.)
Horizontal analysis of 's balance sheet for 2011 would report
Page 1 of 2

hhfma02.qc14.1_sh.tdxex
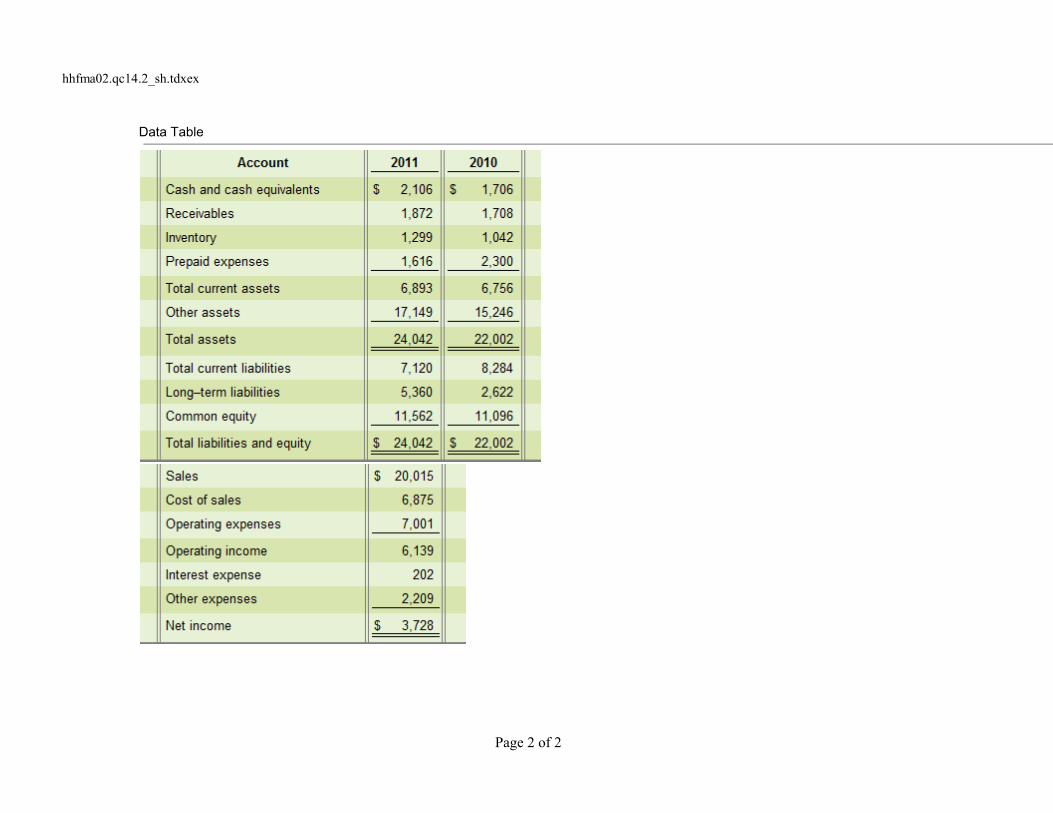
Data Table
Page 2 of 2

hhfma02.qc14.2_sh.tdxex
Corporation reported the following figures:
(Click the icon to view the figures.)
Vertical analysis of 's balance sheet for 2011 would report
Page 1 of 2
hhfma02.qc14.2_sh.tdxex
Data Table
Page 2 of 2
hhfma02.qc14.3_sh.tdxex
Corporation reported the following figures:
(Click the icon to view the figures.)
A common-size income statement for would report (amounts rounded)
Page 1 of 2

hhfma02.qc14.3_sh.tdxex
Data Table
Page 2 of 2
hhfma02.qc14.4_sh.tdxex
Corporation reported the following figures:
(Click the icon to view the figures.)
Which statement best describes 's acid-test ratio?
Page 1 of 2

hhfma02.qc14.4_sh.tdxex
Data Table
Page 2 of 2

hhfma02.qc14.5_sh.tdxex
Corporation reported the following figures:
(Click the icon to view the figures.)
's inventory turnover during 2011 was
(Round all calculations to the nearest whole number.)
Page 1 of 2

hhfma02.qc14.5_sh.tdxex
Data Table
Page 2 of 2

hhfma02.qc14.6_sh.tdxex
Corporation reported the following figures:
(Click the icon to view the figures.)
During 2011, 's days' sales in receivables ratio was
(Use a 365-day year. Round interim calculations to the nearest whole dollar and round your final answer to the nearest wholenumber.)
Page 1 of 2

hhfma02.qc14.6_sh.tdxex
Data Table
Page 2 of 2

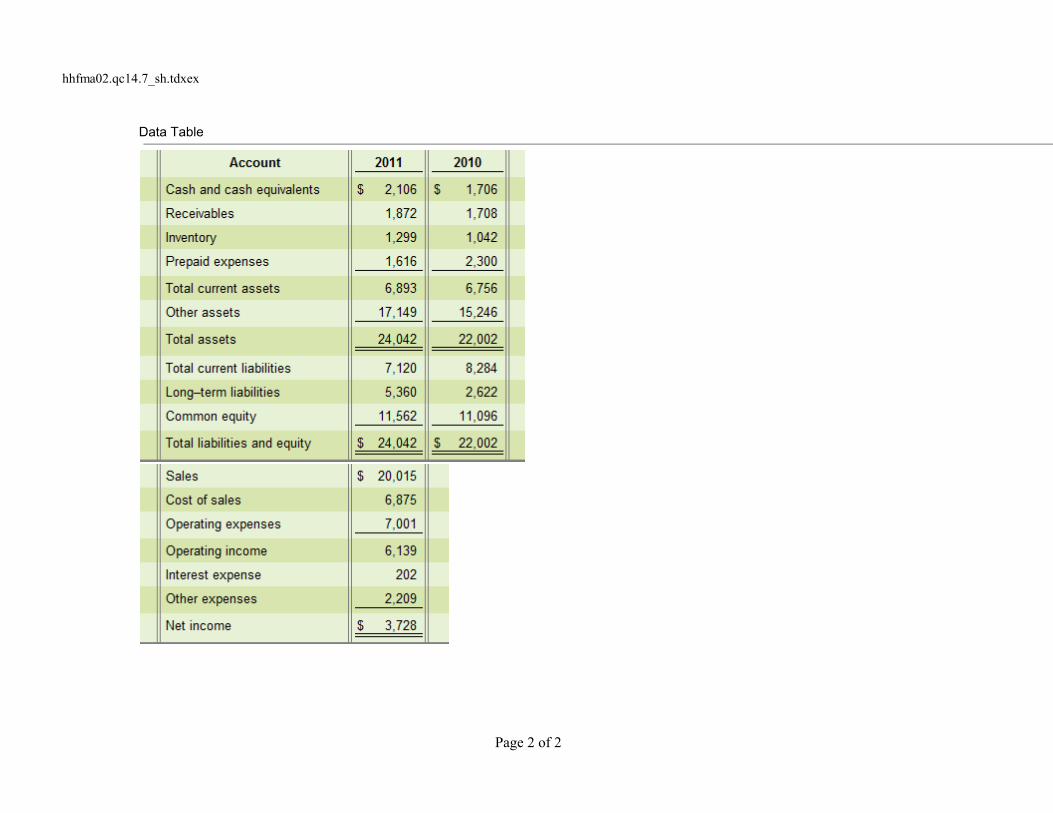
hhfma02.qc14.7_sh.tdxex
Corporation reported the following figures:
(Click the icon to view the figures.)
Which measure expresses 's times-interest-earned ratio?
Page 1 of 2
hhfma02.qc14.7_sh.tdxex
Data Table
Page 2 of 2

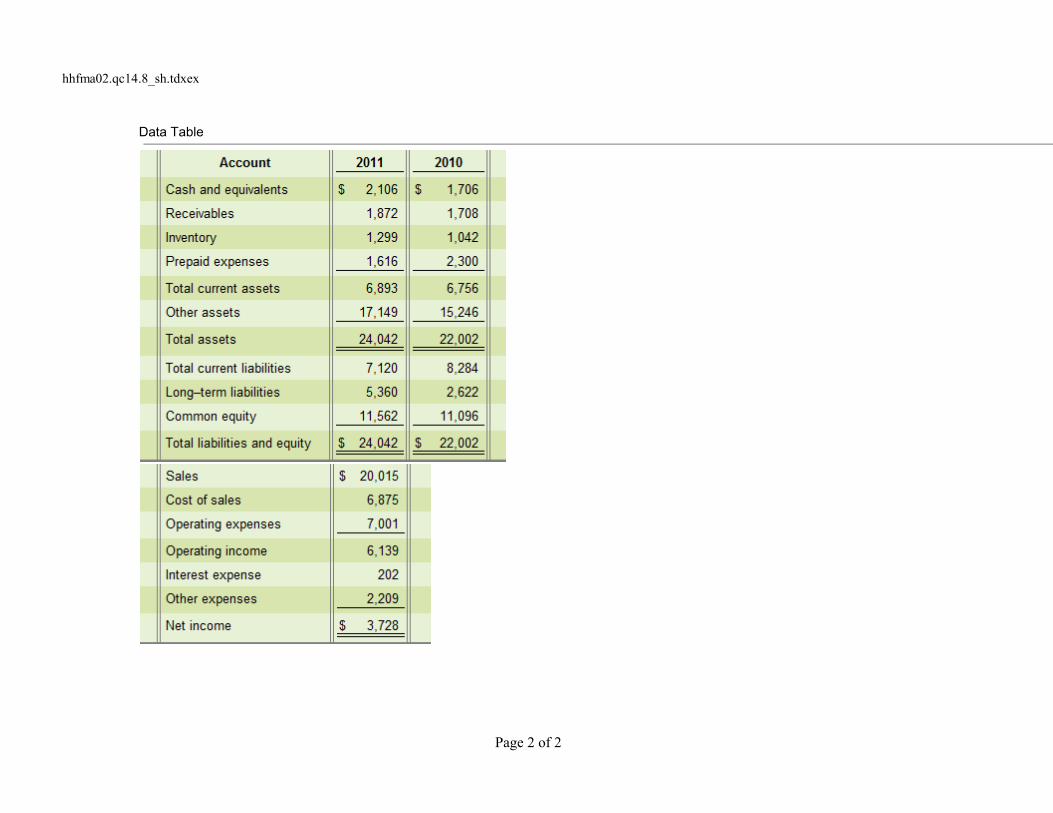
hhfma02.qc14.8_sh.tdxex
Corporation reported these figures:
(Click the icon to view the figures.)
's return on common stockholders' equity can be described as
Page 1 of 2
hhfma02.qc14.8_sh.tdxex
Data Table
Page 2 of 2
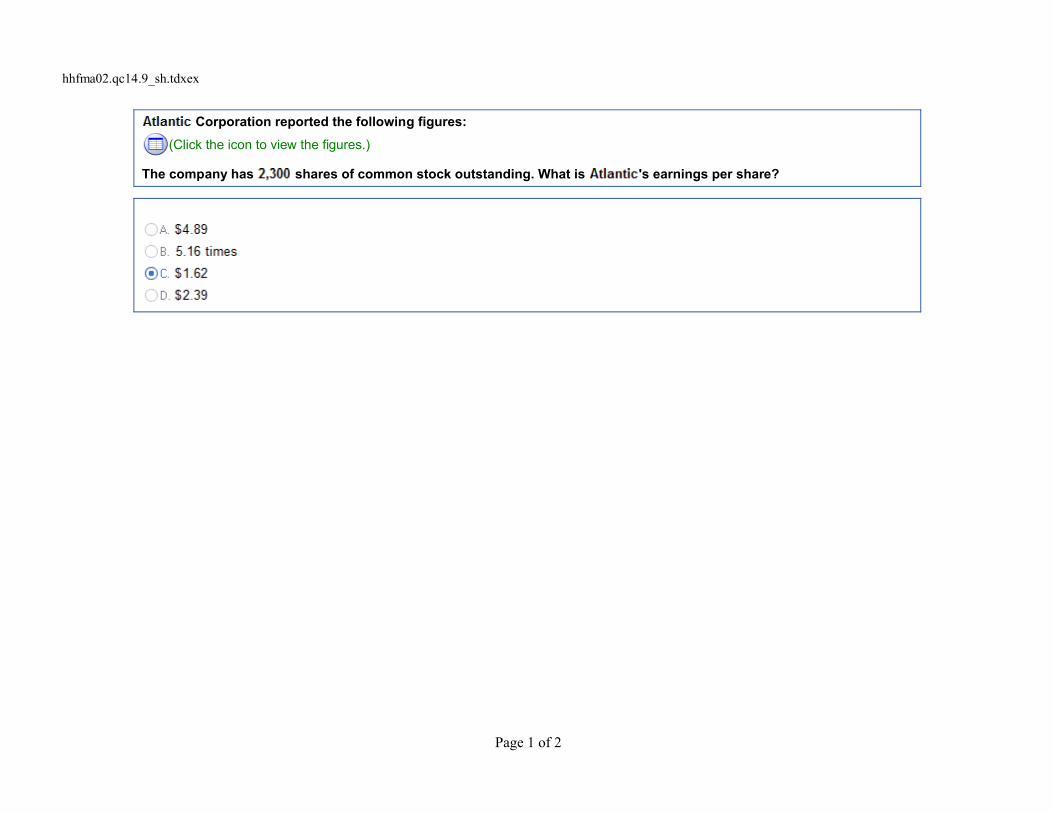
hhfma02.qc14.9_sh.tdxex
Corporation reported the following figures:
(Click the icon to view the figures.)
The company has shares of common stock outstanding. What is 's earnings per share?
Page 1 of 2

hhfma02.qc14.9_sh.tdxex
Data Table
Page 2 of 2
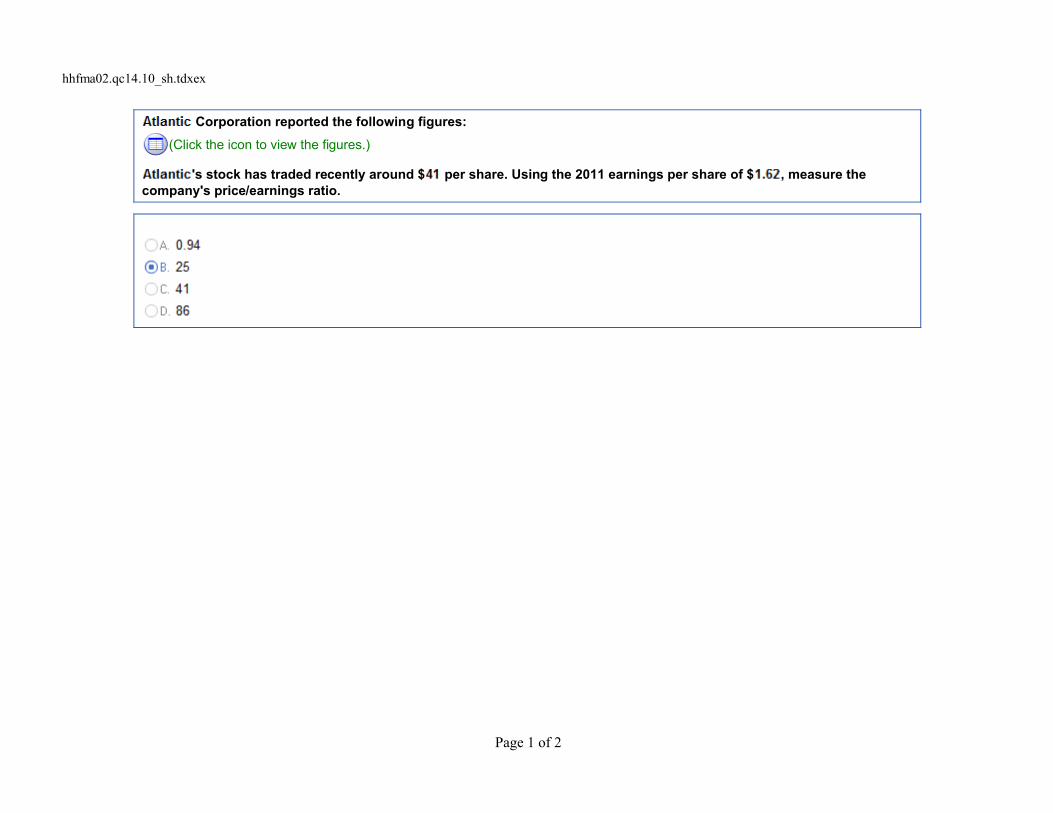
hhfma02.qc14.10_sh.tdxex
Corporation reported the following figures:
(Click the icon to view the figures.)
's stock has traded recently around $ per share. Using the 2011 earnings per share of $ , measure thecompany's price/earnings ratio.
Page 1 of 2

hhfma02.qc14.10_sh.tdxex
Data Table
Page 2 of 2
hhfma02.s14.1_sh.tdxex
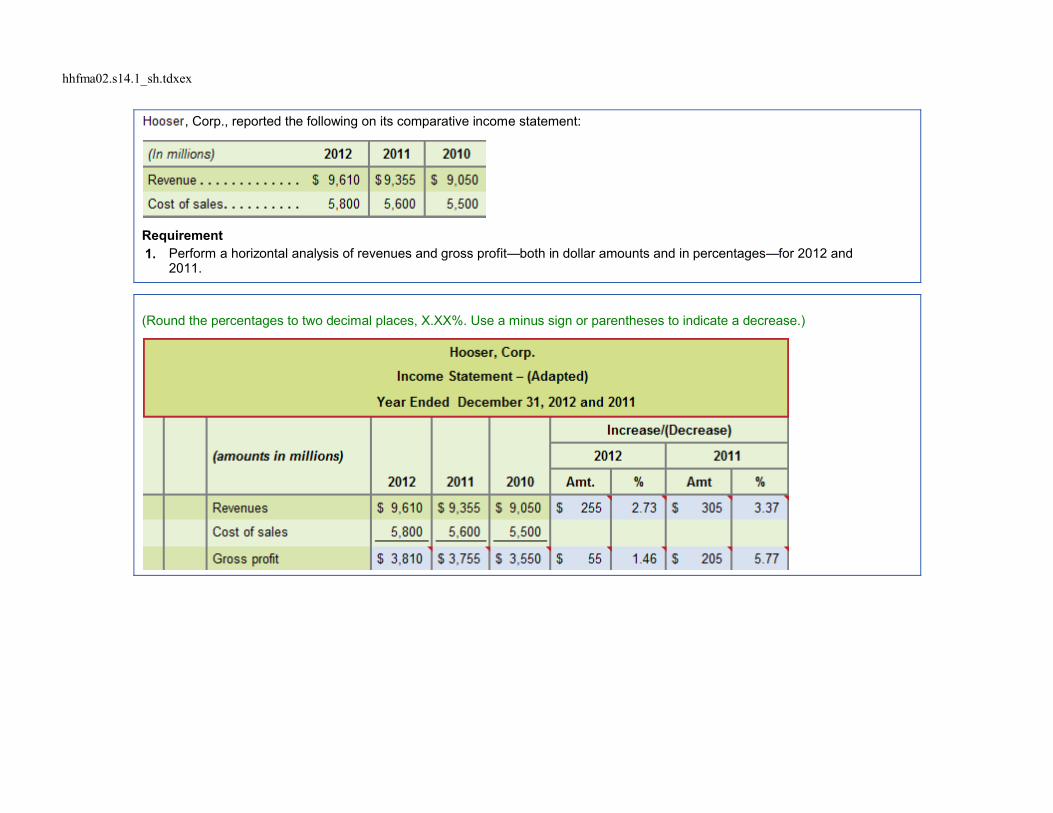
, Corp., reported the following on its comparative income statement:
Requirement1. Perform a horizontal analysis of revenues and gross profit both in dollar amounts and in percentages for 2012 and
2011.
(Round the percentages to two decimal places, X.XX%. Use a minus sign or parentheses to indicate a decrease.)
hhfma02.s14.2_sh.tdxex
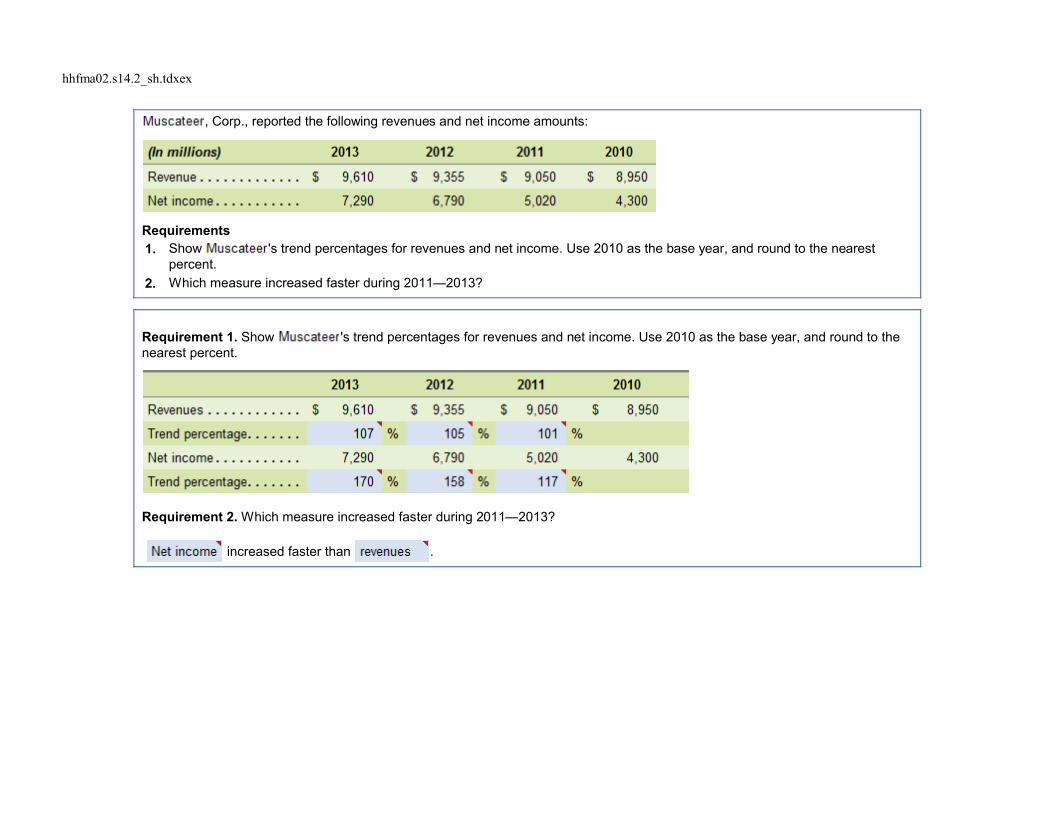
, Corp., reported the following revenues and net income amounts:
Requirements1. Show 's trend percentages for revenues and net income. Use 2010 as the base year, and round to the nearest
percent.
2. Which measure increased faster during 2011 2013?
Requirement 1. Show 's trend percentages for revenues and net income. Use 2010 as the base year, and round to thenearest percent.
Requirement 2. Which measure increased faster during 2011 2013?
increased faster than .

hhfma02.s14.3_sh.tdxex
Optical Company reported the following amounts on its balance sheet at December 31, 2010:
(Click the icon to view the amounts.)
Requirement1. Perform a vertical analysis of assets at the end of 2010.
(Round the percent of total amounts to one decimal place, X.X%.)
Data Table
hhfma02.s14.4_sh.tdxex
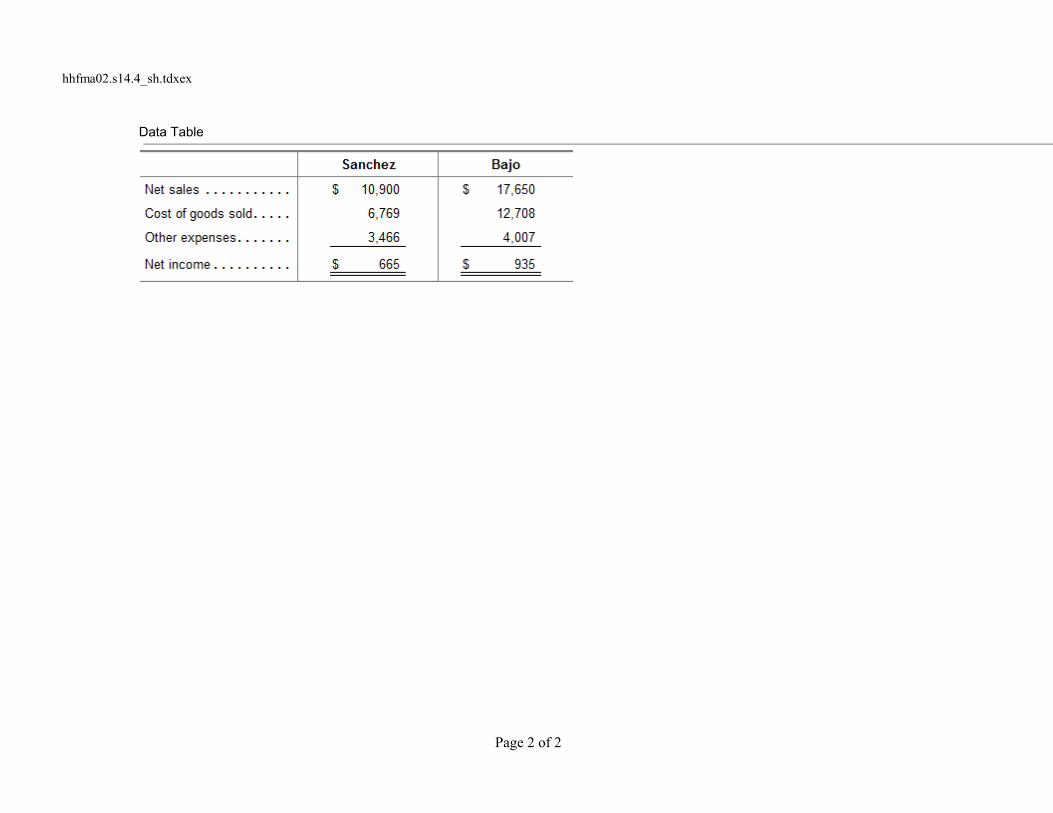
Data for , Inc., and , Corp., follow:
(Click the icon to view the data.)
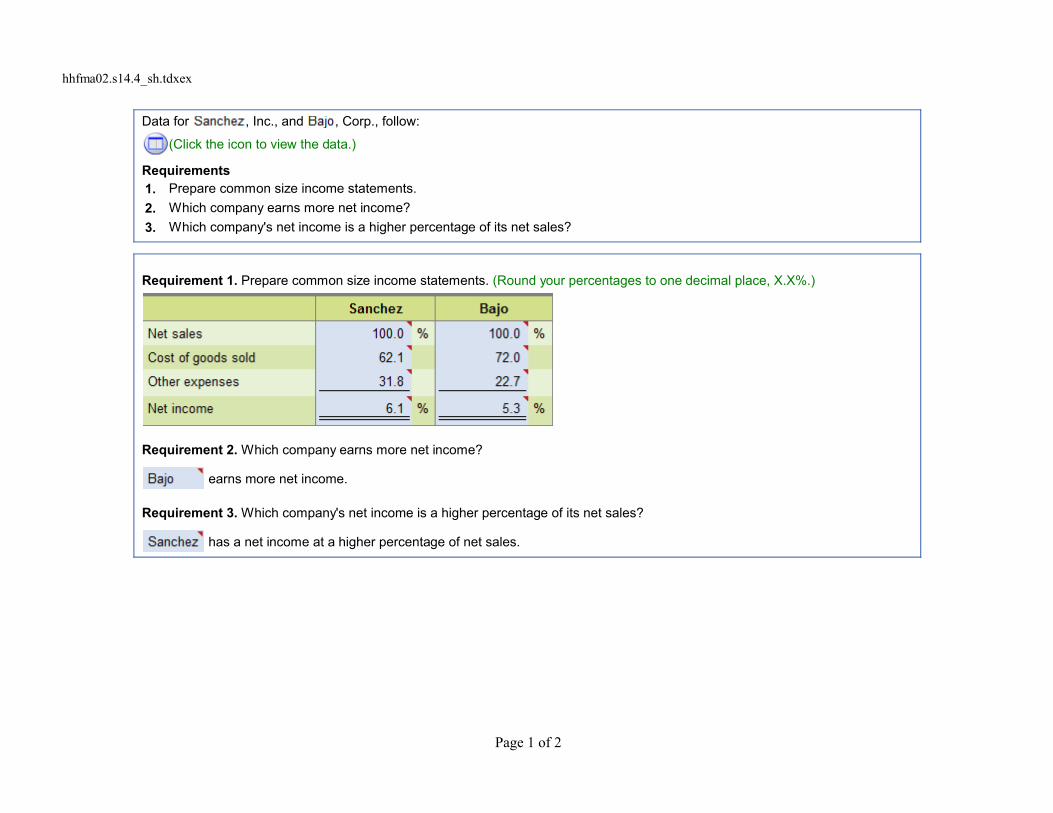
Requirements1. Prepare common size income statements.
2. Which company earns more net income?
3. Which company's net income is a higher percentage of its net sales?
Requirement 1. Prepare common size income statements. (Round your percentages to one decimal place, X.X%.)
Requirement 2. Which company earns more net income?
earns more net income.
Requirement 3. Which company's net income is a higher percentage of its net sales?
has a net income at a higher percentage of net sales.
Page 1 of 2
hhfma02.s14.4_sh.tdxex
Data Table
Page 2 of 2

hhfma02.s14.5_sh.tdxex
's Companies, the home-improvement-store chain, reported the following summarized figures (in billions):
(Click the icon to view the income statement.) (Click the icon to view the balance sheets.)
Requirements1. Compute 's Companies' current ratio at 31, 2011 and 2010. 2. Did 's Companies' current ratio improve, deteriorate, or hold steady during 2011?
Requirement 1. Compute 's Companies' current ratio at 31, 2011 and 2010. (Round your answers to two decimalplaces.)
The current ratio is for 2011 and for 2010.
Requirement 2. Did 's Companies' current ratio improve, deteriorate, or hold steady during 2011?
's Companies' current ratio .
Page 1 of 3

hhfma02.s14.5_sh.tdxex
Data Table
Data Table
Page 2 of 3

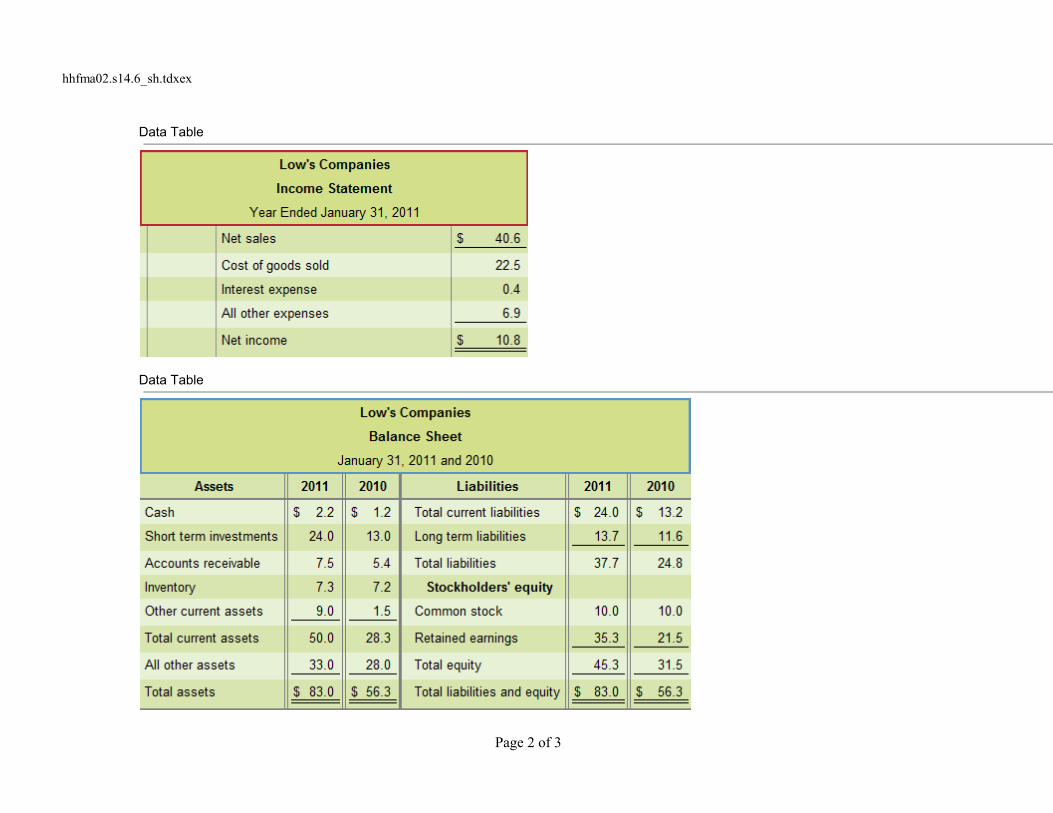
hhfma02.s14.6_sh.tdxex
's Companies, the home-improvement-store chain, reported the following summarized figures (in billions):
(Click the icon to view the income statement.) (Click the icon to view the balance sheets.)
Requirements1. Compute the rate of inventory turnover for 2011.2. Compute days' sales in average receivables during 2011. Round dollar amounts to three decimal places.
Requirement 1. Compute the rate of inventory turnover for 2011. (Round all amounts to two decimal places.)
The rate of inventory turnover for 2011 is times.
Requirement 2. Compute days' sales in average receivables during 2011. Round dollar amounts to three decimal places. (Roundyour final answer to three decimal places.)
Days' sales in average receivables during 2011 is days.
Page 1 of 3
hhfma02.s14.6_sh.tdxex
Data Table
Data Table
Page 2 of 3

hhfma02.s14.6_sh.tdxex
Page 3 of 3

hhfma02.s14.7_sh.tdxex
's Companies, the home-improvement-store chain, reported the following summarized figures (in billions):
(Click the icon to view the income statement.) (Click the icon to view the balance sheets.)
Requirements1. Compute the debt ratio at 31, 2011. 2. Is 's ability to pay its liabilities strong or weak? Explain your reasoning.
Requirement 1. Compute the debt ratio at 31, 2011. (Round your answer to two decimal places.)
's debt ratio is .
Requirement 2. Is 's ability to pay its liabilities strong or weak? Explain your reasoning.
The company's ability to pay its liabilities appears since the debt ratio is fairly .
Page 1 of 3

hhfma02.s14.7_sh.tdxex
Data Table
Data Table
Page 2 of 3

hhfma02.s14.7_sh.tdxex
Page 3 of 3
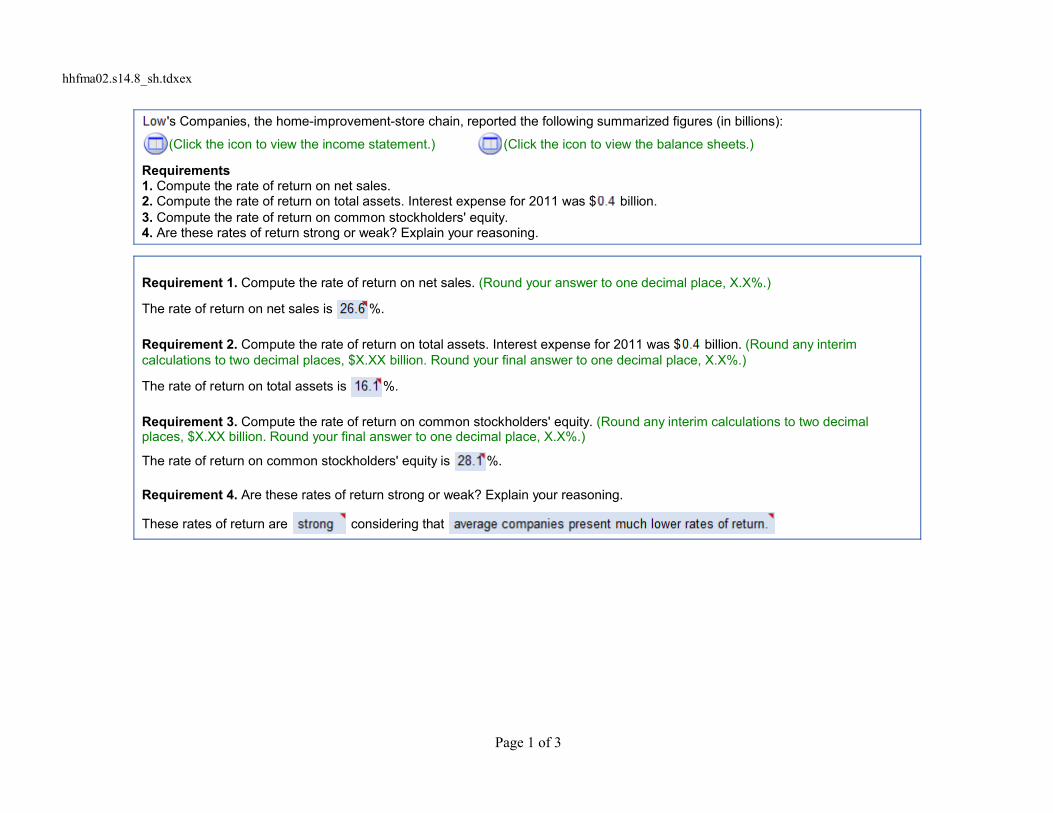
hhfma02.s14.8_sh.tdxex
's Companies, the home-improvement-store chain, reported the following summarized figures (in billions):
(Click the icon to view the income statement.) (Click the icon to view the balance sheets.)
Requirements1. Compute the rate of return on net sales. 2. Compute the rate of return on total assets. Interest expense for 2011 was $ billion.3. Compute the rate of return on common stockholders' equity.4. Are these rates of return strong or weak? Explain your reasoning.
Requirement 1. Compute the rate of return on net sales. (Round your answer to one decimal place, X.X%.)
The rate of return on net sales is %.
Requirement 2. Compute the rate of return on total assets. Interest expense for 2011 was $ billion. (Round any interimcalculations to two decimal places, $X.XX billion. Round your final answer to one decimal place, X.X%.)
The rate of return on total assets is %.
Requirement 3. Compute the rate of return on common stockholders' equity. (Round any interim calculations to two decimalplaces, $X.XX billion. Round your final answer to one decimal place, X.X%.)
The rate of return on common stockholders' equity is %.
Requirement 4. Are these rates of return strong or weak? Explain your reasoning.
These rates of return are considering that
Page 1 of 3

hhfma02.s14.8_sh.tdxex
Data Table
Data Table
Page 2 of 3

hhfma02.s14.8_sh.tdxex
Page 3 of 3
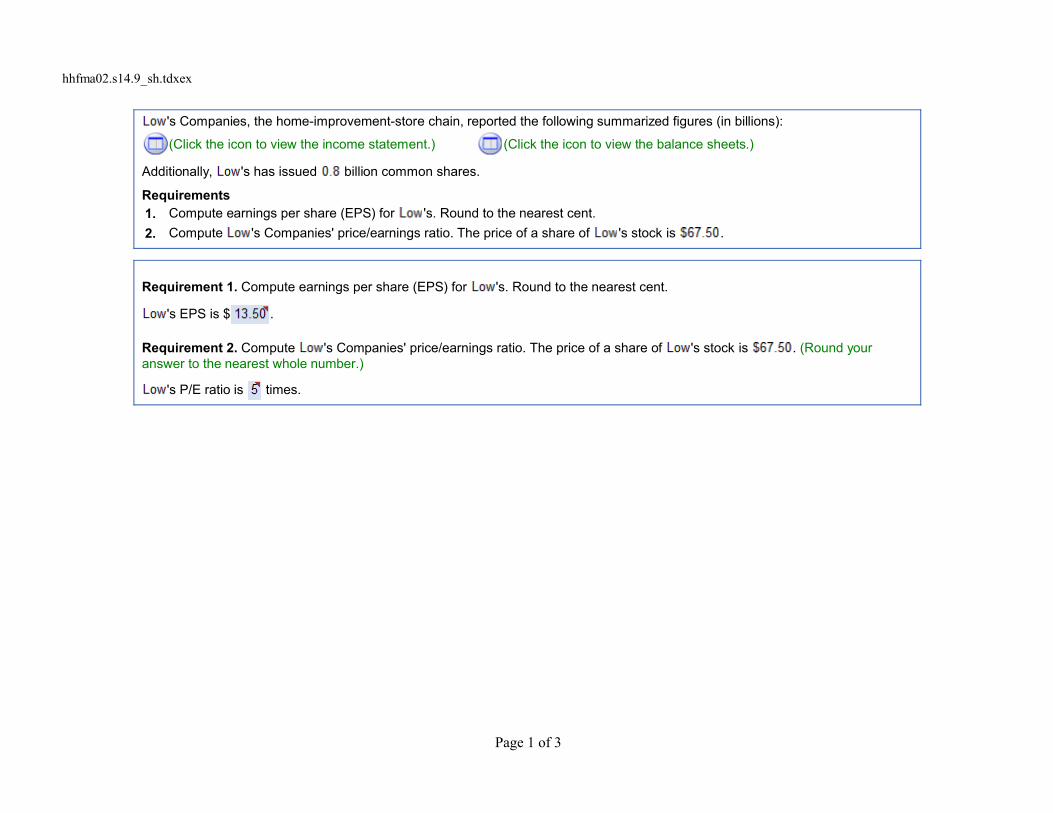
hhfma02.s14.9_sh.tdxex
's Companies, the home-improvement-store chain, reported the following summarized figures (in billions):
(Click the icon to view the income statement.) (Click the icon to view the balance sheets.)
Additionally, 's has issued billion common shares.
Requirements1. Compute earnings per share (EPS) for 's. Round to the nearest cent.
2. Compute 's Companies' price/earnings ratio. The price of a share of 's stock is .
Requirement 1. Compute earnings per share (EPS) for 's. Round to the nearest cent.
's EPS is $ .
Requirement 2. Compute 's Companies' price/earnings ratio. The price of a share of 's stock is . (Round youranswer to the nearest whole number.)
's P/E ratio is times.
Page 1 of 3

hhfma02.s14.9_sh.tdxex
Data Table
Data Table
Page 2 of 3

hhfma02.s14.9_sh.tdxex
Page 3 of 3

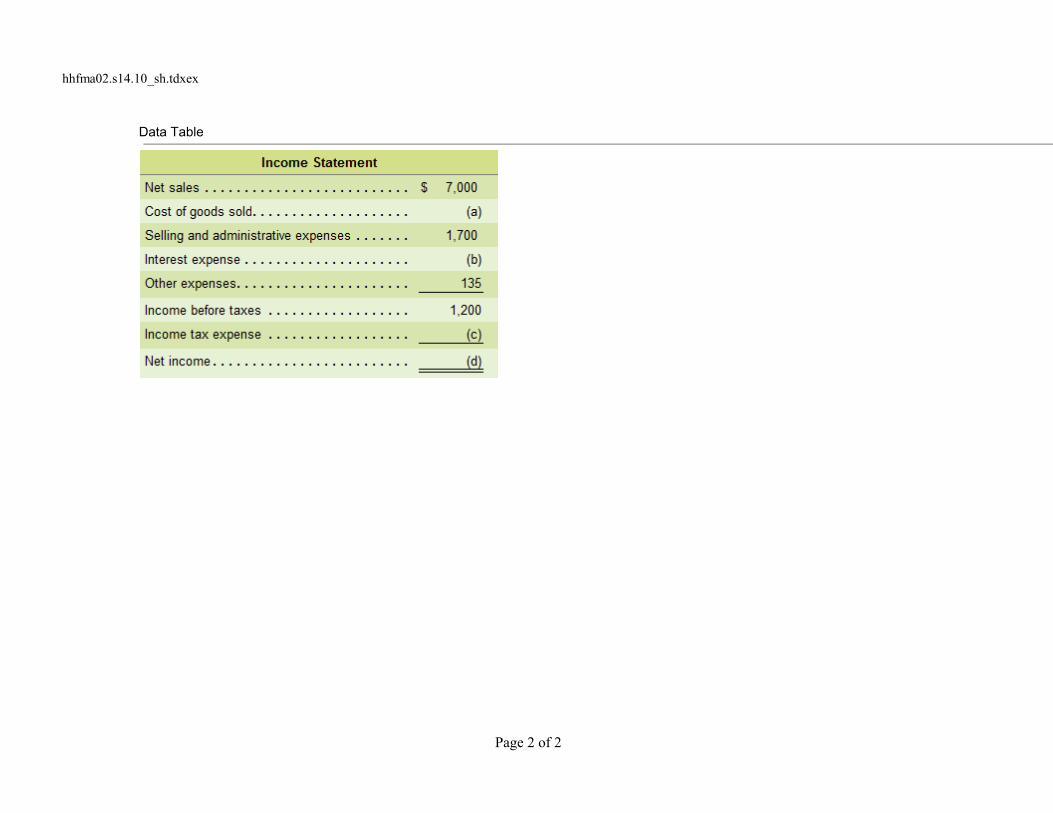
hhfma02.s14.10_sh.tdxex
A skeleton of Mills' income statement appears as follows (amounts in thousands):
(Click the icon to view the data.)
Requirement1. Use the following ratio data to complete Mills' income statement: a. Inventory turnover was (beginning inventory was $790; ending inventory was $750). b. Rate of return on sales is .
(Enter amounts in thousands and round to the nearest thousand.)
Page 1 of 2
hhfma02.s14.10_sh.tdxex
Data Table
Page 2 of 2
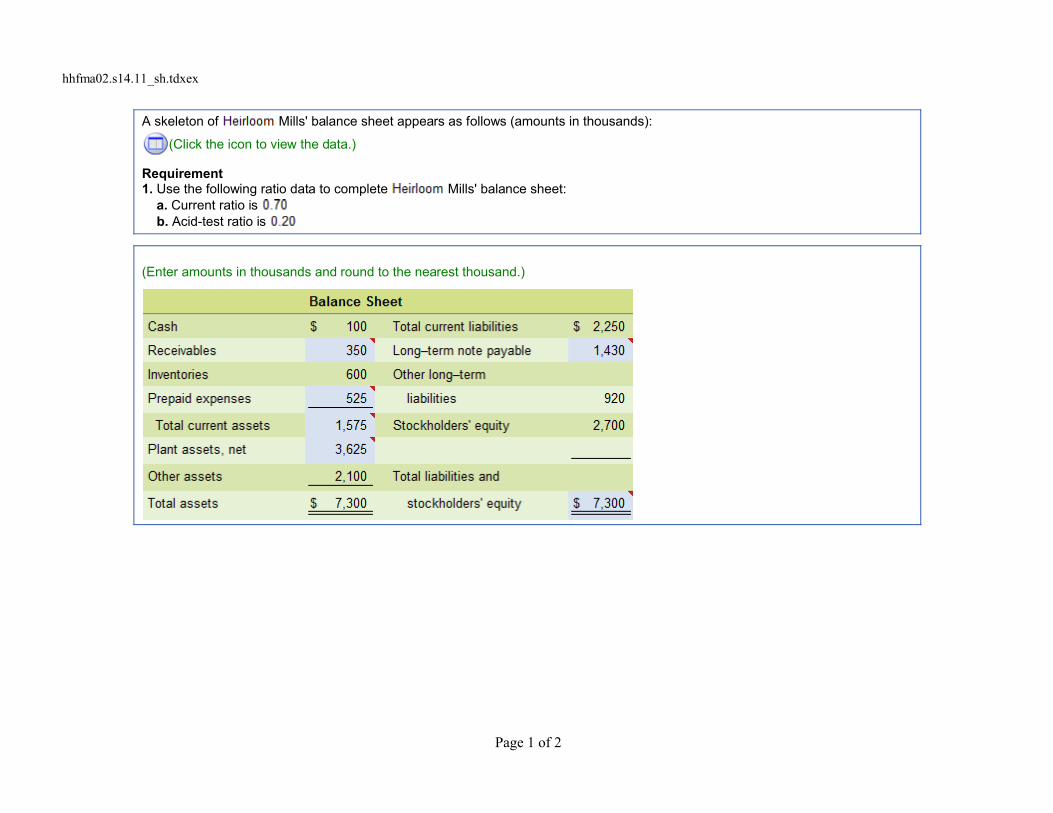
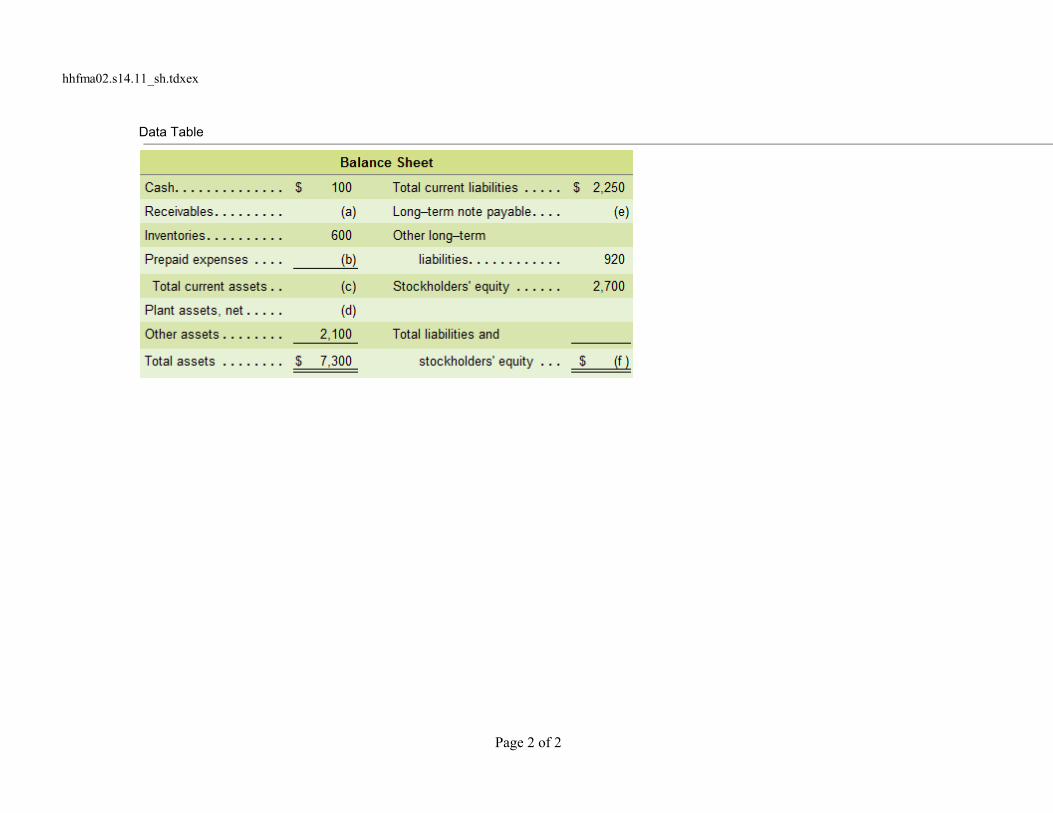
hhfma02.s14.11_sh.tdxex
A skeleton of Mills' balance sheet appears as follows (amounts in thousands):
(Click the icon to view the data.)
Requirement1. Use the following ratio data to complete Mills' balance sheet: a. Current ratio is b. Acid-test ratio is
(Enter amounts in thousands and round to the nearest thousand.)
Page 1 of 2
hhfma02.s14.11_sh.tdxex
Data Table
Page 2 of 2

hhfma02.e14.12_sh.tdxex
Data for Enterprises follows:
(Click the icon to view the data.)
Requirement1. Compute the dollar amount of change and the percentage of change in Enterprises' working capital each year during
2008 and 2009. Is this trend favorable or unfavorable?
Requirement 1. Compute the dollar amount of change and the percentage of change in Enterprises' working capital eachyear during 2008 and 2009. Is this trend favorable or unfavorable?
First, calculate the amount and percentage of change in working capital in 2008. (Round the percentage to one decimal place,X.X%.)
The amount of change in working capital is $ .
The percentage of change in working capital is %.
Next, calculate the amount and percentage of change in working capital in 2009. (Round the percentage to one decimal place,X.X%.)
The amount of change in working capital is $ .
The percentage of change in working capital is %.
Finally, based on what you have calculated above, determine whether the trend is favorable or unfavorable:
The trend of working capital is .
Data Table

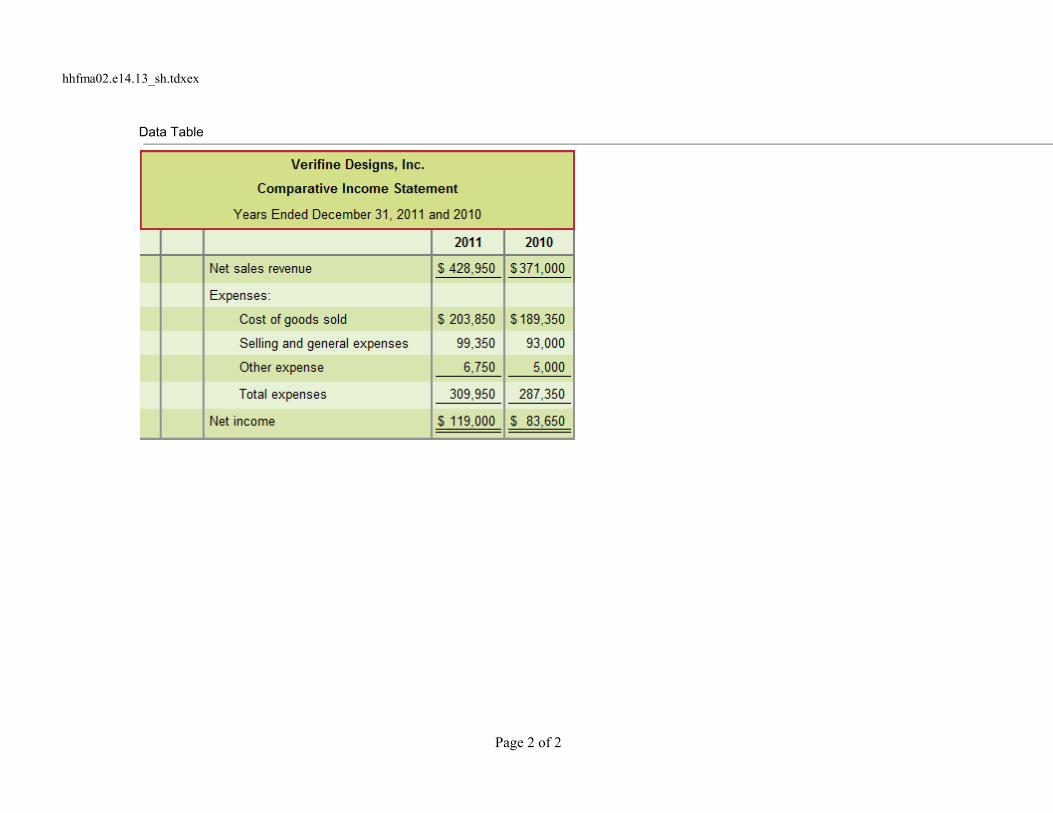
hhfma02.e14.13_sh.tdxex
Data for Designs, Inc., follow:
(Click the icon to view the data.)
Requirements1. Prepare a horizontal analysis of the comparative income statement of Designs, Inc. Round percentage changes to
the nearest one-tenth percent (three decimal places).
2. Why did net income increase by a higher percentage than net sales revenue during 2011?
Requirement 1. Prepare a horizontal analysis of the comparative income statement of Designs, Inc. (Round percentagechanges to the nearest one-tenth percent, X.X%.)
Requirement 2. Why did net income increase by a higher percentage than net sales revenue during 2011?
Net income increased by a higher percentage than total revenues during 2011 because
.
Page 1 of 2
hhfma02.e14.13_sh.tdxex
Data Table
Page 2 of 2

hhfma02.e14.14_sh.tdxex
Realty's net revenue and net income for the following five-year period, using 2010 as the base year, follow:
(Click the icon to view net revenue and net income for the five years.)
Requirements1. Compute trend percentages for net revenue and net income. Round to the nearest full percent.
2. Which grew faster during the period, net revenue or net income?
Requirement 1. Compute trend percentages for net revenue and net income using 2010 as the base year. Round to the nearestfull percent.
Requirement 2. Which grew faster during the period, net revenue or net income?
Total revenue grew by % during the period, compared to % for net income. Therefore, grew faster.
Data Table

hhfma02.e14.15_sh.tdxex
Graphics, Inc., has the following data:
(Click the icon to view the data.)
Requirement1. Perform a vertical analysis of 's balance sheet.
(Round the percentages to the nearest tenth percent, X.X%.)
Page 1 of 2

hhfma02.e14.15_sh.tdxex
Data Table
Page 2 of 2
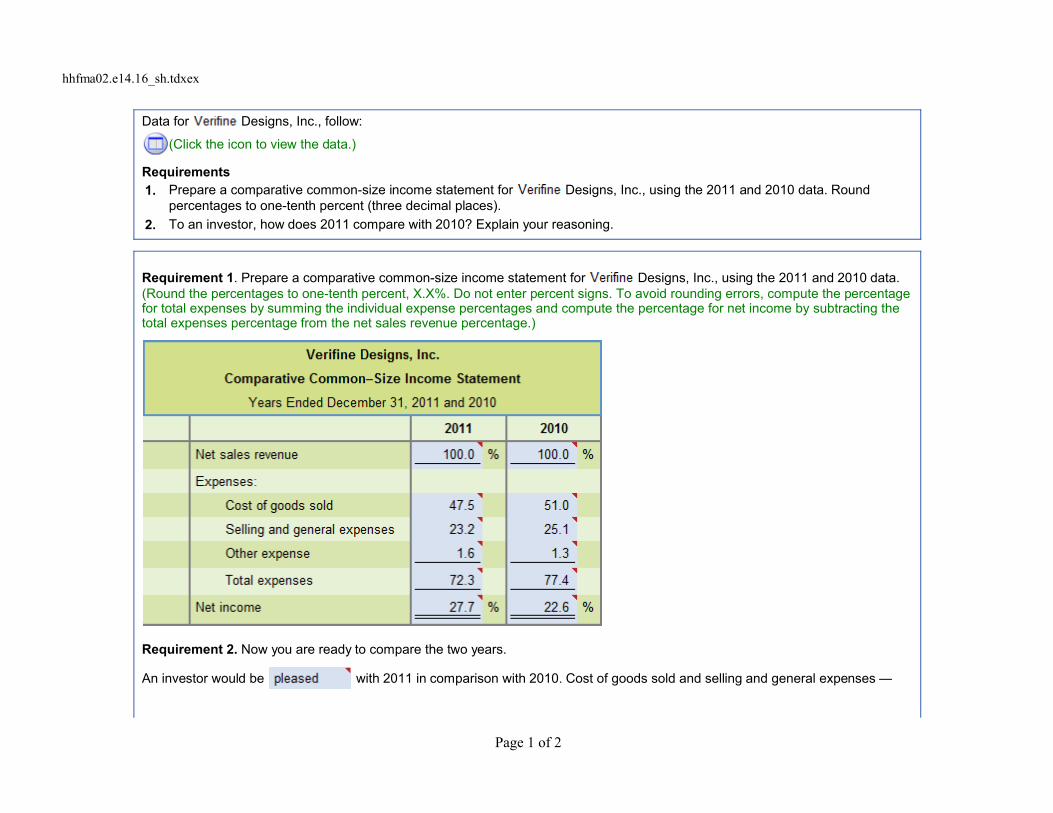
hhfma02.e14.16_sh.tdxex
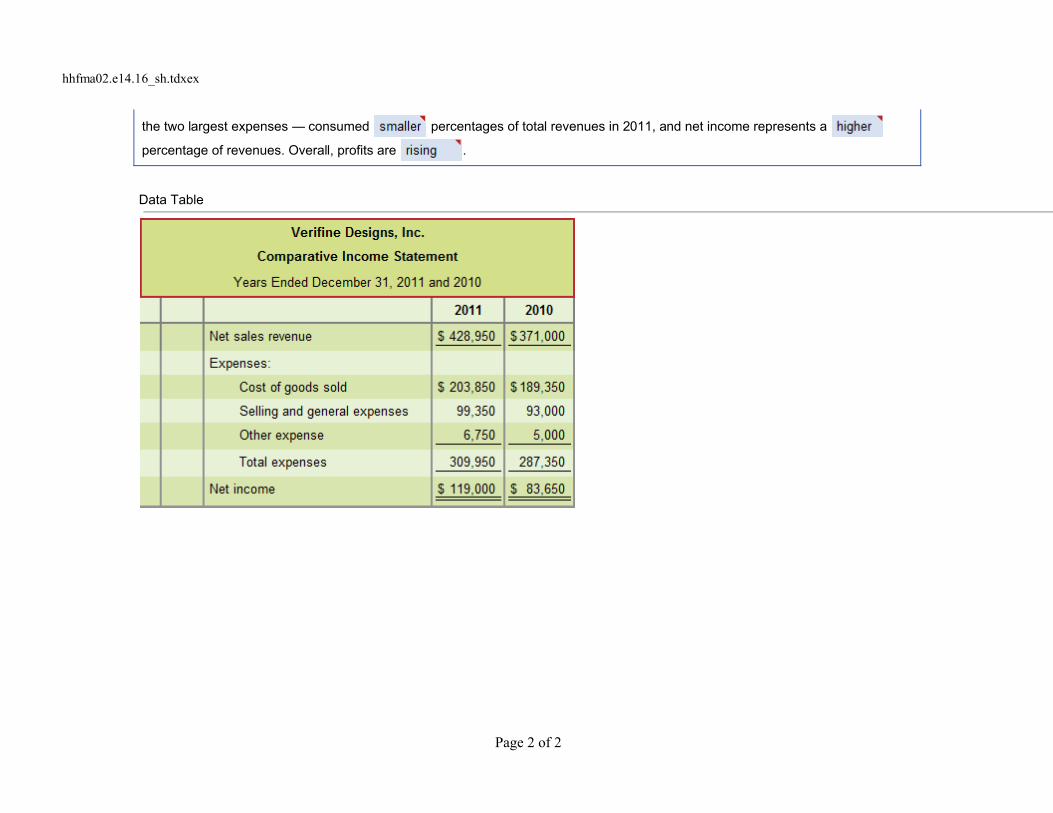
Data for Designs, Inc., follow:
(Click the icon to view the data.)
Requirements1. Prepare a comparative common-size income statement for Designs, Inc., using the 2011 and 2010 data. Round
percentages to one-tenth percent (three decimal places).
2. To an investor, how does 2011 compare with 2010? Explain your reasoning.
Requirement 1. Prepare a comparative common-size income statement for Designs, Inc., using the 2011 and 2010 data.(Round the percentages to one-tenth percent, X.X%. Do not enter percent signs. To avoid rounding errors, compute the percentagefor total expenses by summing the individual expense percentages and compute the percentage for net income by subtracting thetotal expenses percentage from the net sales revenue percentage.)
Requirement 2. Now you are ready to compare the two years.
An investor would be with 2011 in comparison with 2010. Cost of goods sold and selling and general expenses
Page 1 of 2
hhfma02.e14.16_sh.tdxex
the two largest expenses consumed percentages of total revenues in 2011, and net income represents a
percentage of revenues. Overall, profits are .
Data Table
Page 2 of 2

hhfma02.e14.17_sh.tdxex
The financial statements of Health Foods include the following items:
(Click the icon to view the financial statements.)
Requirement1. Compute the following ratios for the current year: a. Current ratio b. Acid-test ratio c. Inventory turnover d. Days' sales in average receivables
a. Compute the current ratio for the current year. (Round your answer to two decimal places.)
The current ratio is .
b. Compute the acid-test ratio for the current year. (Round your answer to two decimal places.)
The acid-test ratio is .
c. Compute the inventory turnover for the current year. (Round your answer to two decimal places.)
The inventory turnover is times.
d. Compute the days' sales in average receivables for the current year. (Round all calculations to the nearest whole number.)
The days' sales in average receivables ratio is days.
Page 1 of 2

hhfma02.e14.17_sh.tdxex
Data Table
Page 2 of 2

hhfma02.e14.18_sh.tdxex
Picture Frames has asked you to determine whether the company's ability to pay current liabilities and total liabilitiesimproved or deteriorated during 2009. To answer this question, you gather the following data:
(Click the icon to view the data.)
Requirement1. Compute the following ratios for 2009 and 2008: a. Current ratio b. Acid-test ratio c. Debt ratio d. Times-interest-earned ratio
a. Calculate the current ratio for both years. (Round your answers to two decimal places.)
2009:
2008:
b. Calculate the acid-test ratio for both years. (Round your answers to two decimal places.)
2009:
2008:
c. Calculate the debt ratio for both years. (Round your answers to two decimal places.)
2009:
2008:
d. Calculate the times-interest-earned ratio for both years. (Round your answers to two decimal places.)
2009: times
2008: times
Did the company's ability to pay current liabilities and total liabilities improve or deteriorate during 2009?
Page 1 of 2

hhfma02.e14.18_sh.tdxex
The company's ability to pay its current liabilities, total liabilities, and interest expense during 2009, as shown by the
of all four ratios during the year.
Data Table
Page 2 of 2
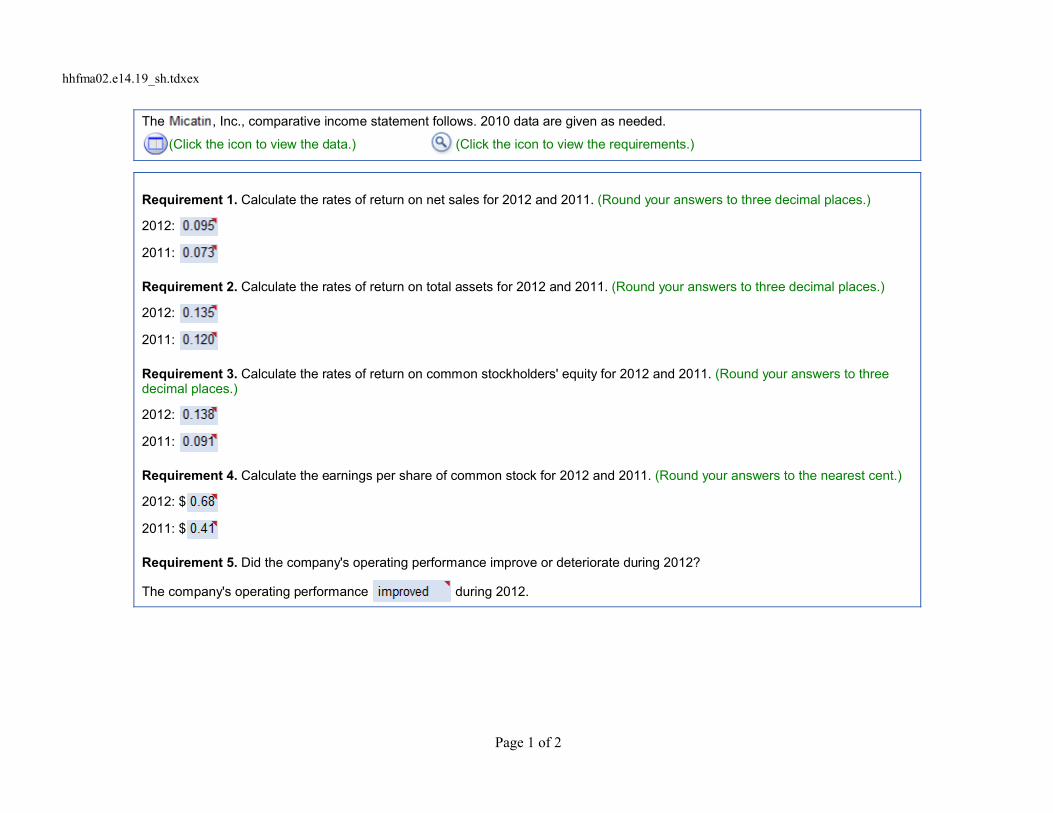
hhfma02.e14.19_sh.tdxex
The , Inc., comparative income statement follows. 2010 data are given as needed.
(Click the icon to view the data.) (Click the icon to view the requirements.)
Requirement 1. Calculate the rates of return on net sales for 2012 and 2011. (Round your answers to three decimal places.)
2012:
2011:
Requirement 2. Calculate the rates of return on total assets for 2012 and 2011. (Round your answers to three decimal places.)
2012:
2011:
Requirement 3. Calculate the rates of return on common stockholders' equity for 2012 and 2011. (Round your answers to threedecimal places.)
2012:
2011:
Requirement 4. Calculate the earnings per share of common stock for 2012 and 2011. (Round your answers to the nearest cent.)
2012: $
2011: $
Requirement 5. Did the company's operating performance improve or deteriorate during 2012?
The company's operating performance during 2012.
Page 1 of 2
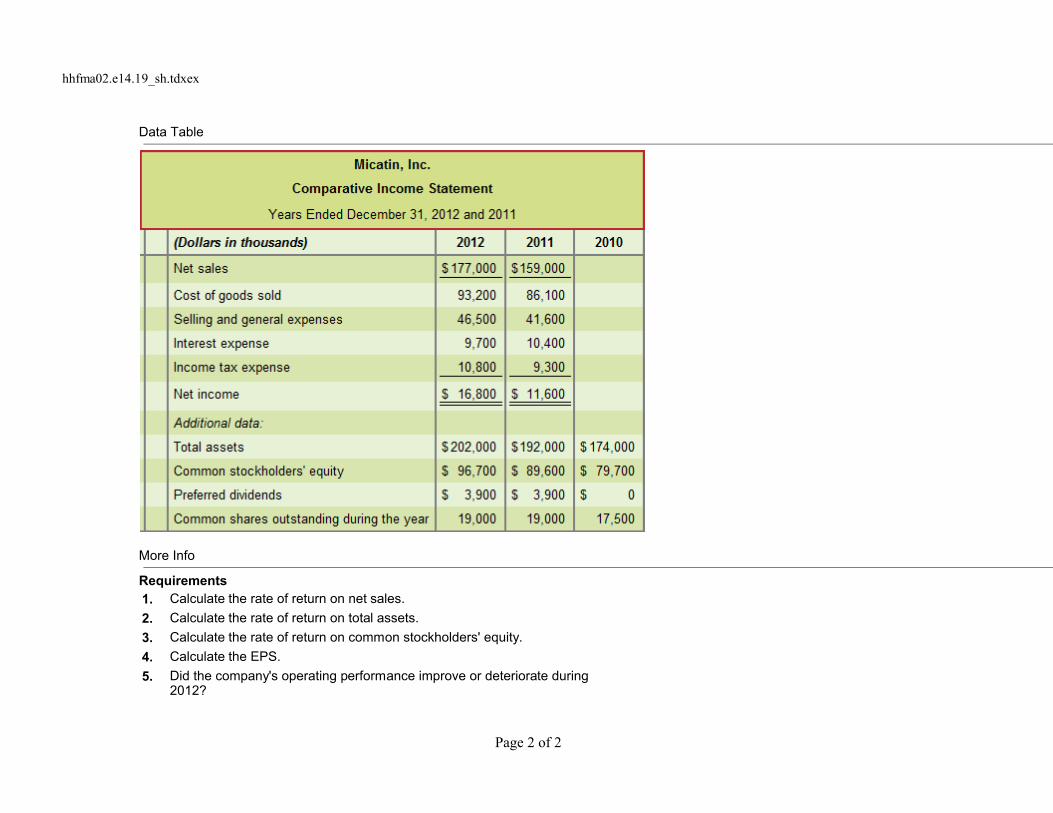
hhfma02.e14.19_sh.tdxex
Data Table
More Info
Requirements1. Calculate the rate of return on net sales.
2. Calculate the rate of return on total assets.
3. Calculate the rate of return on common stockholders' equity.
4. Calculate the EPS.
5. Did the company's operating performance improve or deteriorate during2012?
Page 2 of 2

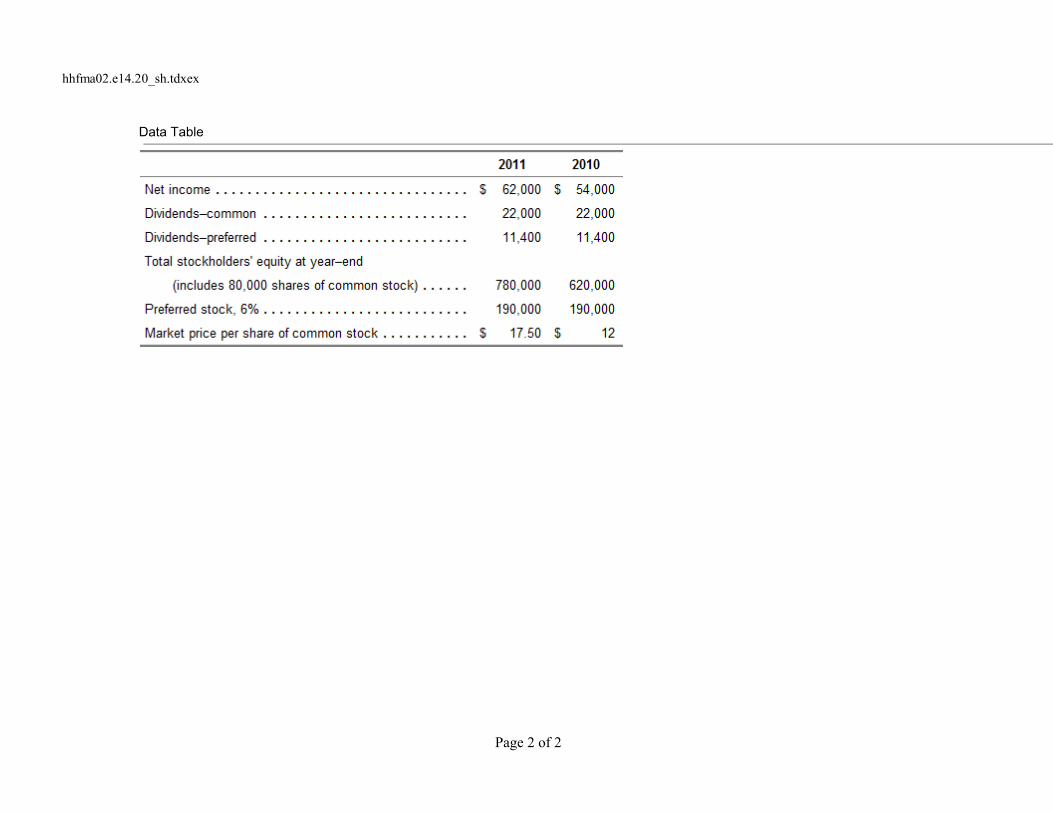
hhfma02.e14.20_sh.tdxex
Data for State Bank follows:
(Click the icon to view the financial information.)
Requirement1. Evaluate the common stock of State Bank as an investment. Specifically, use the three stock ratios to determine
whether the common stock has increased or decreased in attractiveness during the past year.
Begin by calculating the price/earnings ratio for both years. (Round interim calculations to two decimal places and your finalanswers to one decimal place.)
2011:
2010:
Calculate the dividend yield on common stock for both years. (Round interim calculations to two decimal places and your finalanswers to three decimal places.)
2011:
2010:
Calculate the book value per share of common stock for both years. (Round your answers to the nearest cent.)
2011: $
2010: $
Determine whether the common stock has increased or decreased in attractiveness during the past year.
The stock's attractiveness during 2011, as shown by the in the price/earnings ratio and in book value per
share. The dividend yield , but that would be important only to investors who want dividends. Overall, the common stock
looks than it did a year ago.
Page 1 of 2
hhfma02.e14.20_sh.tdxex
Data Table
Page 2 of 2

hhfma02.e14.21_sh.tdxex
The following data (dollar amounts in millions) are adapted from the financial statements of Stores, Inc.:
(Click the icon to view the data.)
Requirement1. Complete condensed balance sheet.
(Enter amounts in millions and round your answers to the nearest whole million.)
Data Table

hhfma02.p14.22a_sh.tdxex
Net sales revenue, net income, and common stockholders'equity for Mission Corporation, a manufacturer ofcontact lenses, follow for a four-year period. Requirements
1. Compute trend percentages for each item for 2011 2013.Use 2010 as the base year, and round to the nearestwhole percent.
2. Compute the rate of return on common stockholders'equity for 2011 2013, rounding to three decimal places.
Requirement 1. Compute trend percentages for 2011 2013. Use 2010 as the base year, and round to the nearest whole percent.
Requirement 2. Compute the rate of return on common stockholders' equity for 2011 2013, rounding to three decimal places.Begin with 2011.
2011 rate of return on common stockholders' equity:
2012 rate of return on common stockholders' equity:
2013 rate of return on common stockholders' equity:
hhfma02.p14.23a_sh.tdxex
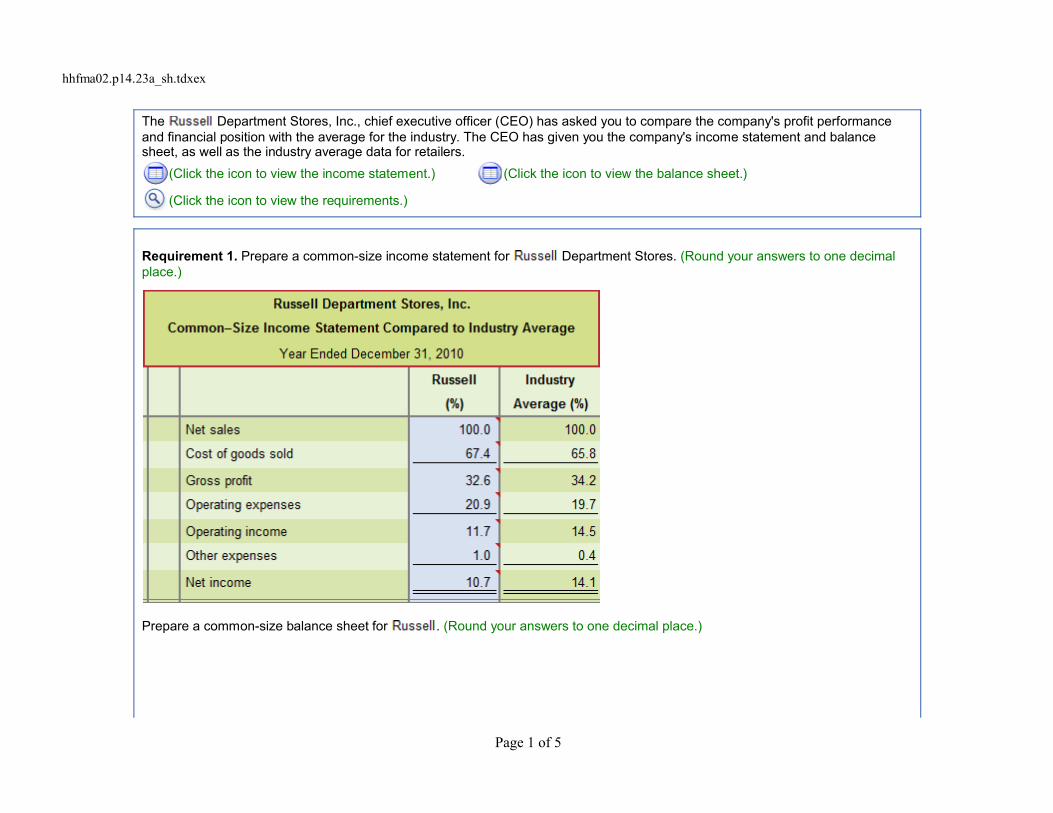
The Department Stores, Inc., chief executive officer (CEO) has asked you to compare the company's profit performanceand financial position with the average for the industry. The CEO has given you the company's income statement and balancesheet, as well as the industry average data for retailers.
(Click the icon to view the income statement.) (Click the icon to view the balance sheet.)
(Click the icon to view the requirements.)
Requirement 1. Prepare a common-size income statement for Department Stores. (Round your answers to one decimalplace.)
Prepare a common-size balance sheet for . (Round your answers to one decimal place.)
Page 1 of 5

hhfma02.p14.23a_sh.tdxex
Requirement 2. For the profitability analysis, compute 's (a) ratio of gross profit to net sales, (b) ratio of operating income tonet sales, and (c) ratio of net income to net sales. Compare these figures with the industry averages.
's common-size income statement shows that its ratios of gross profit, operating income and net income to net sales are
than the industry averages. Overall, 's profit performance is than average for the industry.
Requirement 3. For the analysis of financial position, compute 's (a) ratio of current assets to total assets and (b) ratio ofstockholders' equity to total assets. Compare these ratios with the industry averages.
's common-size balance sheet shows that its ratio of current assets to total assets and its ratio of stockholders' equity to
total assets are than the industry averages. Overall, 's financial position is than average for the industry.
Page 2 of 5

hhfma02.p14.23a_sh.tdxex
Data Table
Data Table
Page 3 of 5

hhfma02.p14.23a_sh.tdxex
More Info
Requirements1. Prepare a common-size income statement and balance sheet for . The first
column of each statement should present 's common-size statement, and thesecond column, the industry averages.
2. For the profitability analysis, compute 's (a) ratio of gross profit to net sales, (b)ratio of operating income to net sales, and (c) ratio of net income to net sales.Compare these figures with the industry averages. Is 's profit performancebetter or worse than the industry average?
3. For the analysis of financial position, compute 's (a) ratio of current assets tototal assets and (b) ratio of stockholders' equity to total assets. Compare these ratioswith the industry averages. Is 's financial position better or worse than theindustry averages?
Page 4 of 5

hhfma02.p14.23a_sh.tdxex
Page 5 of 5
hhfma02.p14.24a_sh.tdxex
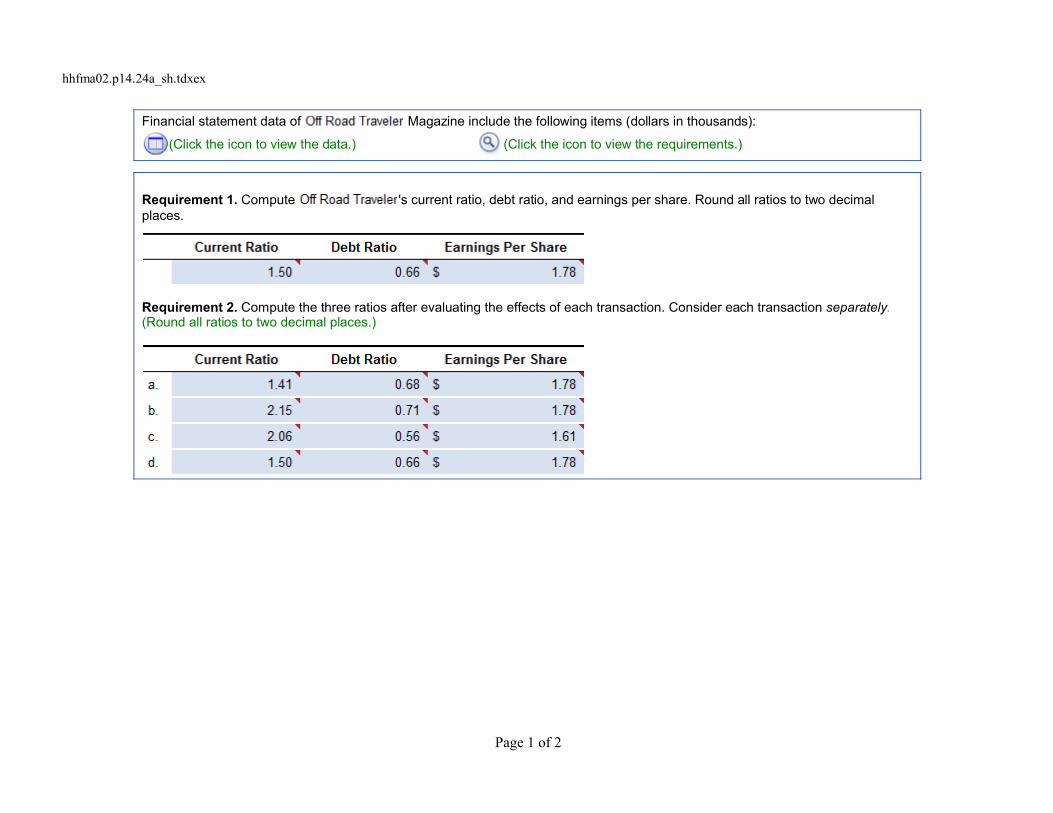
Financial statement data of Magazine include the following items (dollars in thousands):
(Click the icon to view the data.) (Click the icon to view the requirements.)
Requirement 1. Compute 's current ratio, debt ratio, and earnings per share. Round all ratios to two decimalplaces.
Requirement 2. Compute the three ratios after evaluating the effects of each transaction. Consider each transaction separately.(Round all ratios to two decimal places.)
Page 1 of 2
hhfma02.p14.24a_sh.tdxex
Data Table
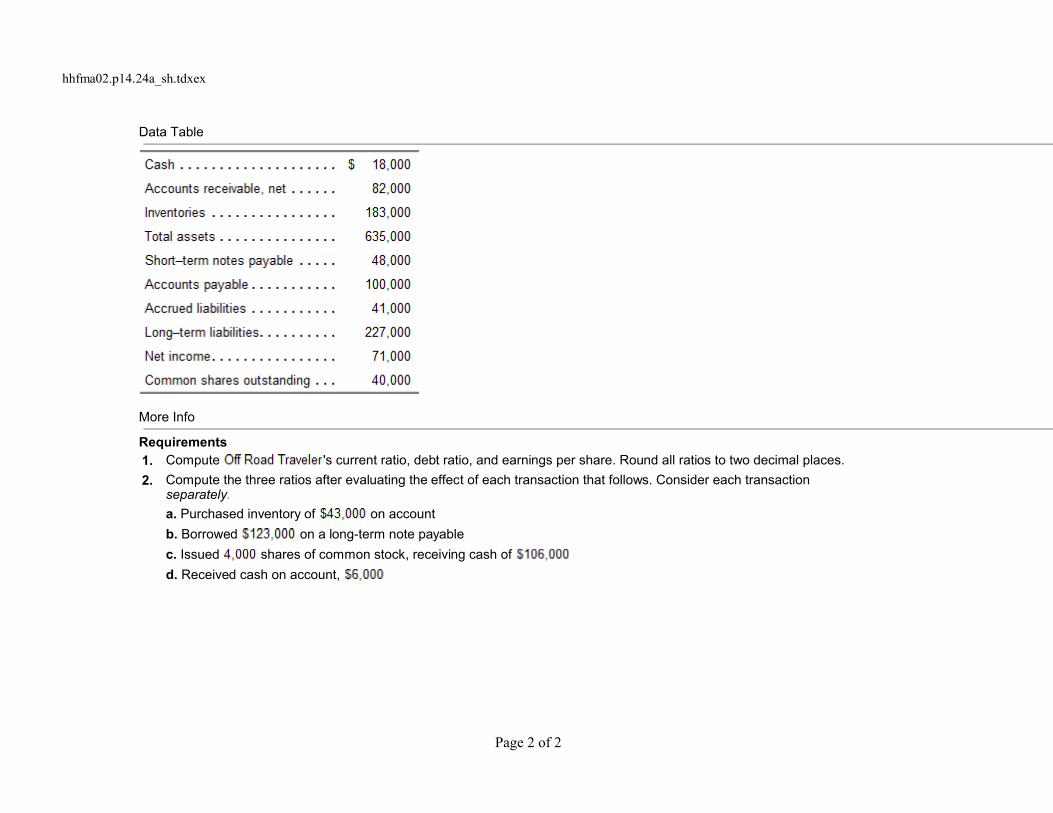
More Info
Requirements1. Compute 's current ratio, debt ratio, and earnings per share. Round all ratios to two decimal places.
2. Compute the three ratios after evaluating the effect of each transaction that follows. Consider each transaction separately.
a. Purchased inventory of on account
b. Borrowed on a long-term note payable
c. Issued shares of common stock, receiving cash of
d. Received cash on account,
Page 2 of 2
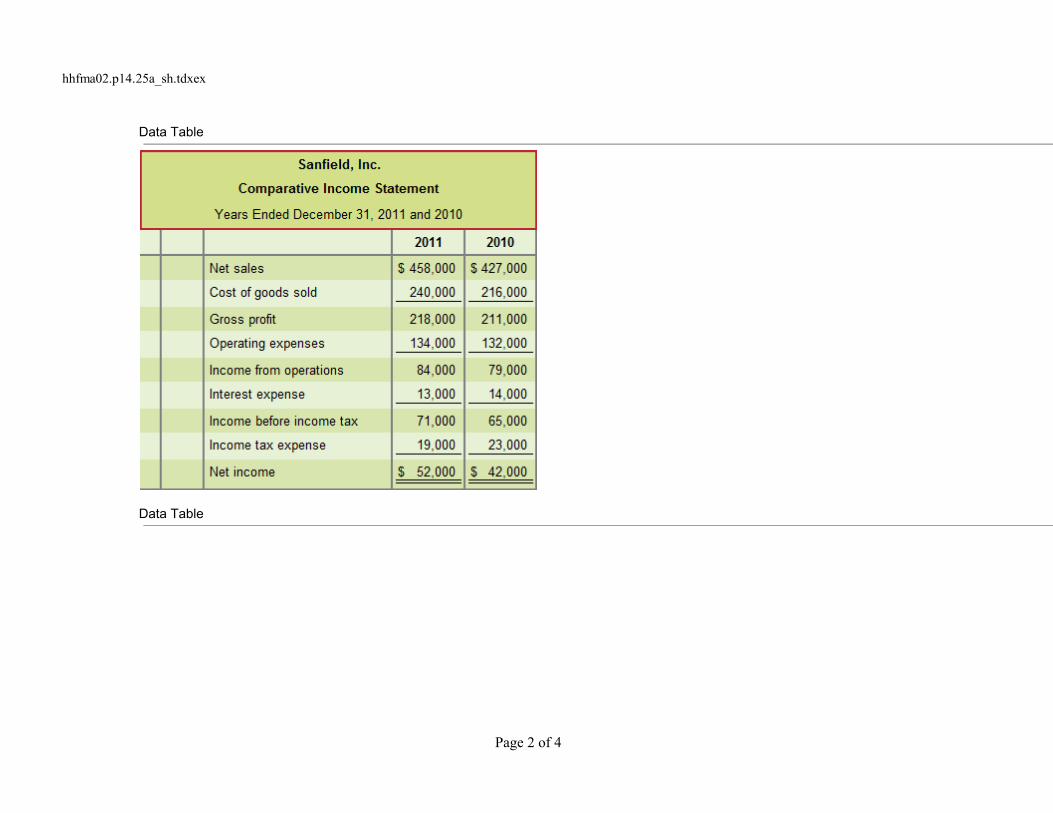
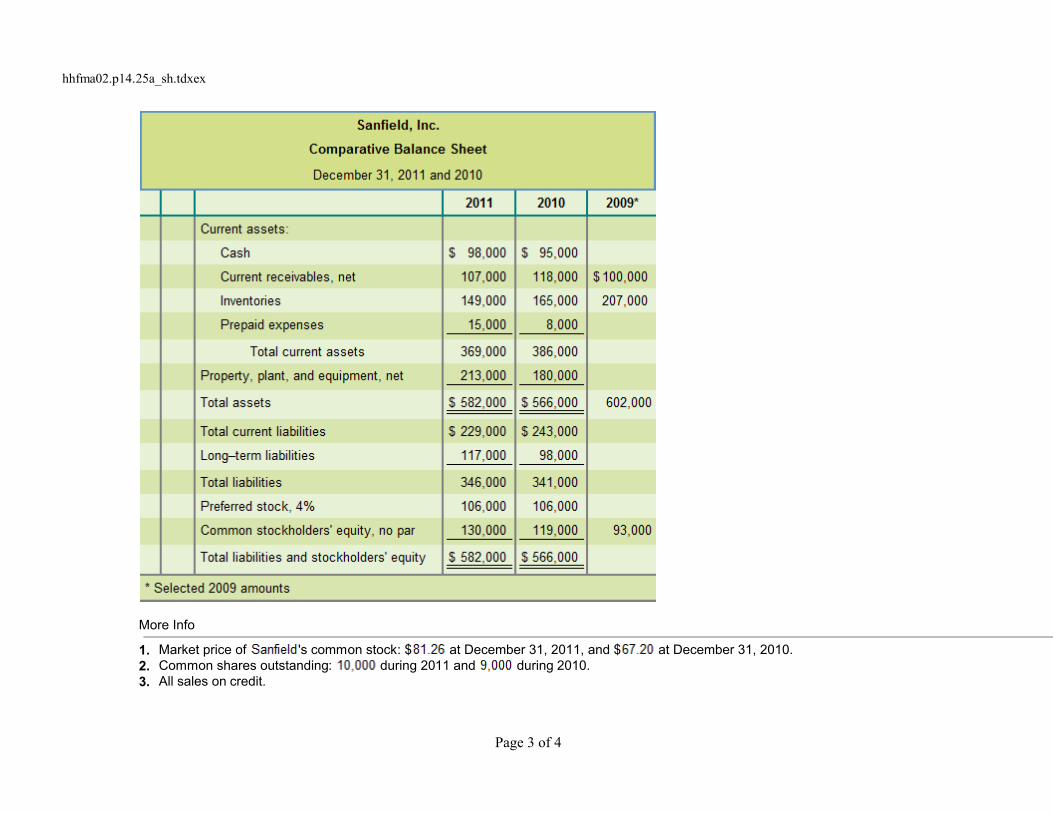
hhfma02.p14.25a_sh.tdxex
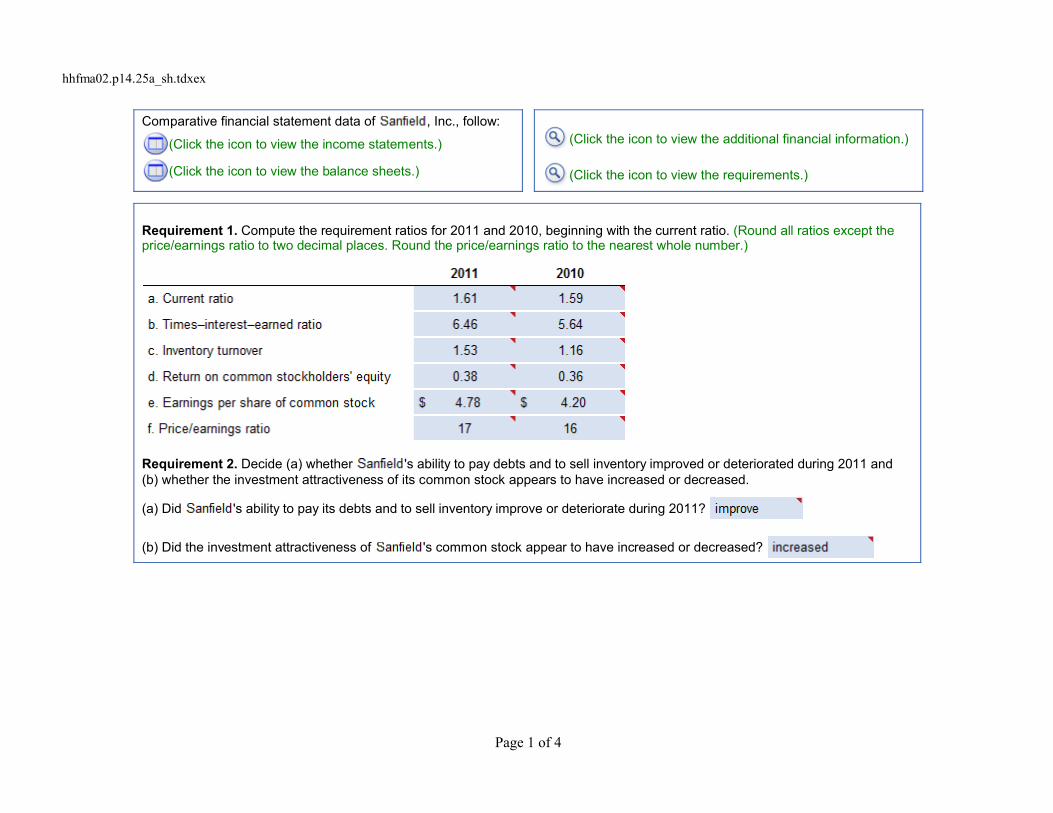
Comparative financial statement data of , Inc., follow:
(Click the icon to view the income statements.)
(Click the icon to view the balance sheets.)
(Click the icon to view the additional financial information.)
(Click the icon to view the requirements.)
Requirement 1. Compute the requirement ratios for 2011 and 2010, beginning with the current ratio. (Round all ratios except theprice/earnings ratio to two decimal places. Round the price/earnings ratio to the nearest whole number.)
Requirement 2. Decide (a) whether 's ability to pay debts and to sell inventory improved or deteriorated during 2011 and(b) whether the investment attractiveness of its common stock appears to have increased or decreased.
(a) Did 's ability to pay its debts and to sell inventory improve or deteriorate during 2011?
(b) Did the investment attractiveness of 's common stock appear to have increased or decreased?
Page 1 of 4
hhfma02.p14.25a_sh.tdxex
Data Table
Data Table
Page 2 of 4
hhfma02.p14.25a_sh.tdxex
More Info
1. Market price of 's common stock: $ at December 31, 2011, and $ at December 31, 2010.2. Common shares outstanding: during 2011 and during 2010.3. All sales on credit.
Page 3 of 4
hhfma02.p14.25a_sh.tdxex
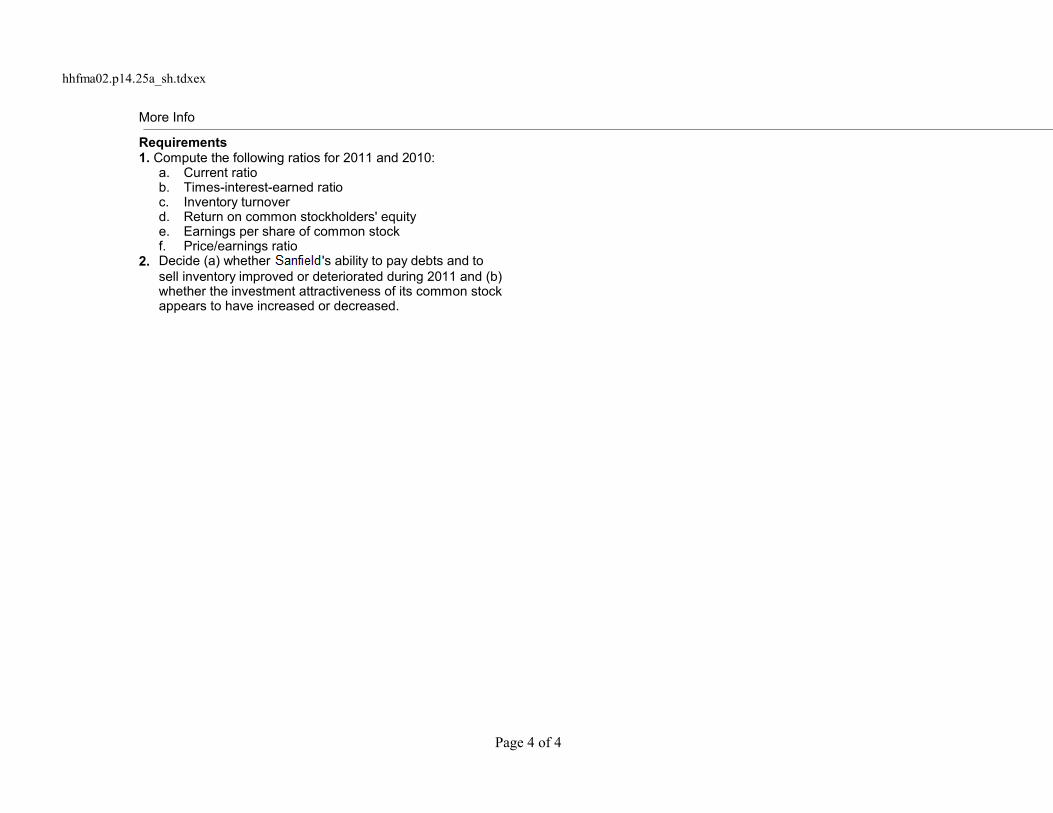
More Info
Requirements1. Compute the following ratios for 2011 and 2010:
a. Current ratiob. Times-interest-earned ratioc. Inventory turnoverd. Return on common stockholders' equitye. Earnings per share of common stockf. Price/earnings ratio
2. Decide (a) whether 's ability to pay debts and tosell inventory improved or deteriorated during 2011 and (b)whether the investment attractiveness of its common stockappears to have increased or decreased.
Page 4 of 4

hhfma02.p14.26a_sh.tdxex
Assume that you purchasing an investment and have decidedto invest in a company in the digital phone business. You havenarrowed the choice to , Corp. and ,Inc., and have assembled the following data:
(Click to view the income statement data.)
(Click to view the balance sheet and market price data.)
Your strategy is to invest in companies that have lowprice/earnings ratios but appear to be in good shape financially.Assume that you have analyzed all other factors and that yourdecision depends on the results of ratio analysis.
(Click the icon to view the requirement.)
Requirement 1. Compute the following ratios for both companies for the current year, and decide which company's stock better fitsyour investment strategy.
a. Compute the acid-test ratio for both companies. (Round your answers to two decimal places.)
b. Compute the inventory turnover for both companies. (Round average inventory to the nearest whole dollar, and your finalanswers to two decimal places.)
c. Compute the days' sales in average receivables for both companies. (Round all interim calculations and your final answers to thenearest whole number.)
d. Compute the debt ratio for both companies. (Round your answers to two decimal places.)
Page 1 of 5
hhfma02.p14.26a_sh.tdxex
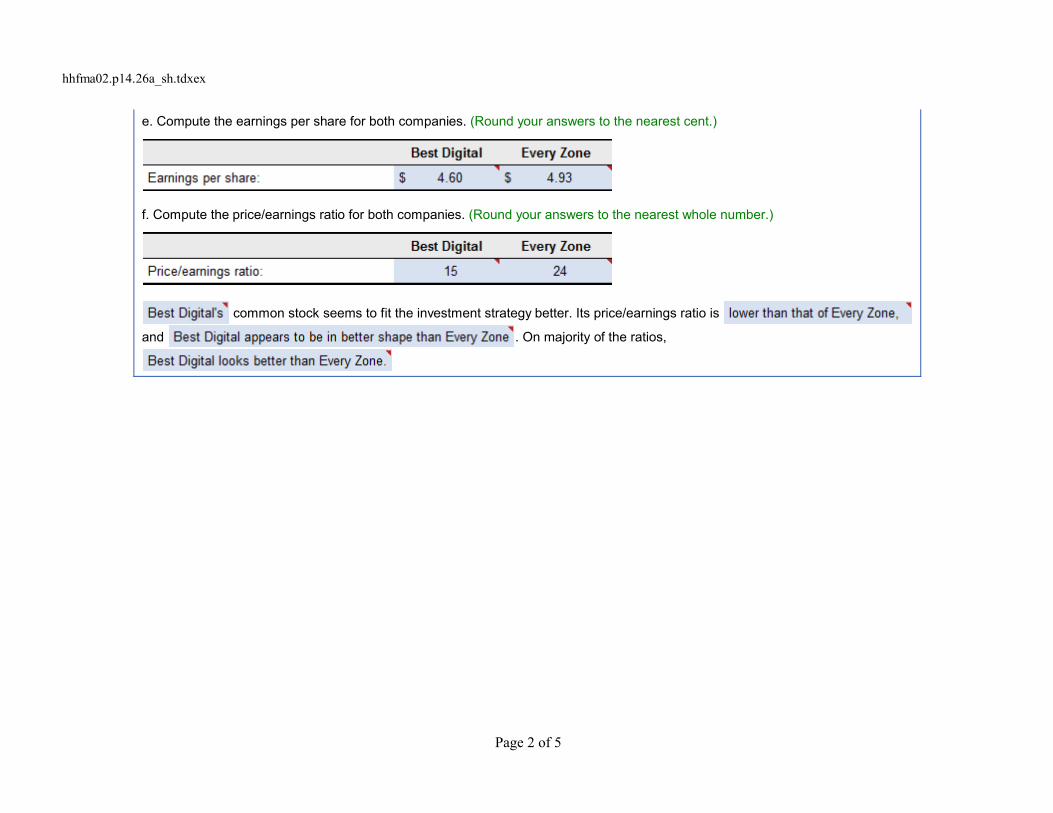
e. Compute the earnings per share for both companies. (Round your answers to the nearest cent.)
f. Compute the price/earnings ratio for both companies. (Round your answers to the nearest whole number.)
common stock seems to fit the investment strategy better. Its price/earnings ratio is
and . On majority of the ratios,
Page 2 of 5

hhfma02.p14.26a_sh.tdxex
Data Table
Selected income-statement data for the current year
Data Table
Selected balance-sheet and market-price data at the end of the current year
Page 3 of 5

hhfma02.p14.26a_sh.tdxex
Selected balance-sheet data at the beginning of the current year
Page 4 of 5
hhfma02.p14.26a_sh.tdxex
More Info
Requirement1. Compute the following ratios for both companies for the current year,
and decide which company's stock better fits your investment strategy.
a. Acid-test ratio
b. Inventory turnover
c. Days' sales in average receivables
d. Debt ratio
e. Earnings per share of common stock
f. Price/earnings ratio
Page 5 of 5
hhfma02.p14.27b_sh.tdxex
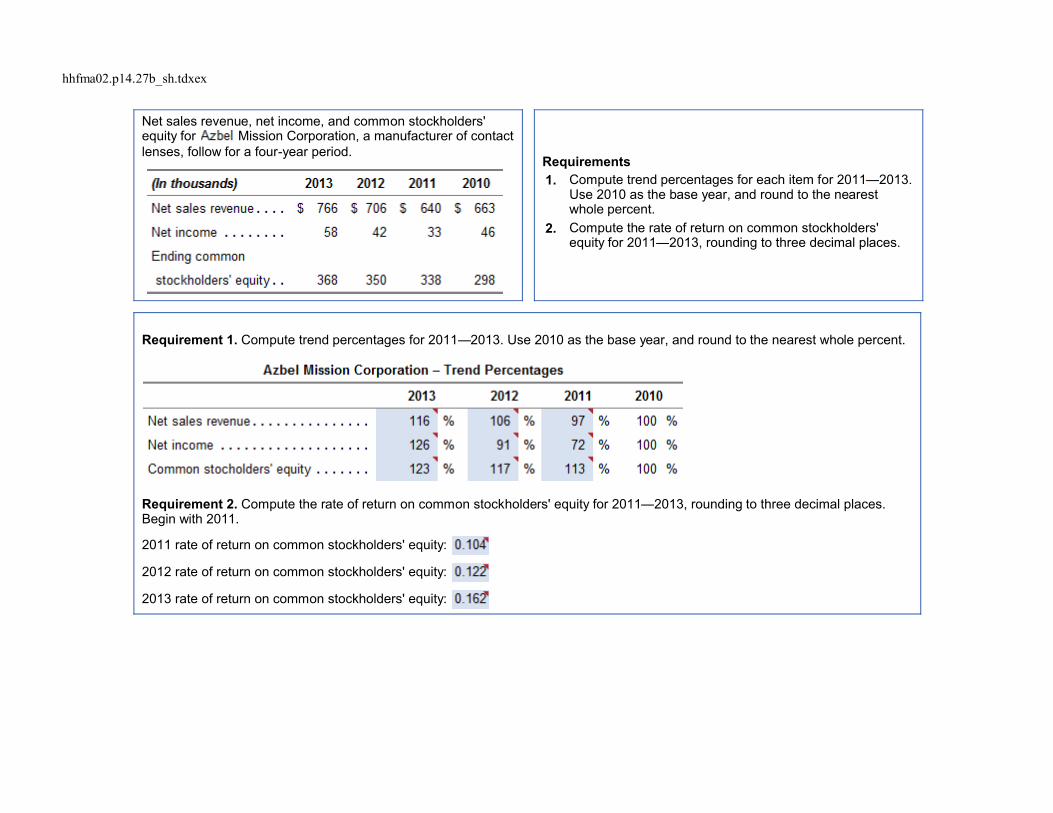
Net sales revenue, net income, and common stockholders'equity for Mission Corporation, a manufacturer of contactlenses, follow for a four-year period. Requirements
1. Compute trend percentages for each item for 2011 2013.Use 2010 as the base year, and round to the nearestwhole percent.
2. Compute the rate of return on common stockholders'equity for 2011 2013, rounding to three decimal places.
Requirement 1. Compute trend percentages for 2011 2013. Use 2010 as the base year, and round to the nearest whole percent.
Requirement 2. Compute the rate of return on common stockholders' equity for 2011 2013, rounding to three decimal places.Begin with 2011.
2011 rate of return on common stockholders' equity:
2012 rate of return on common stockholders' equity:
2013 rate of return on common stockholders' equity:

hhfma02.p14.28b_sh.tdxex
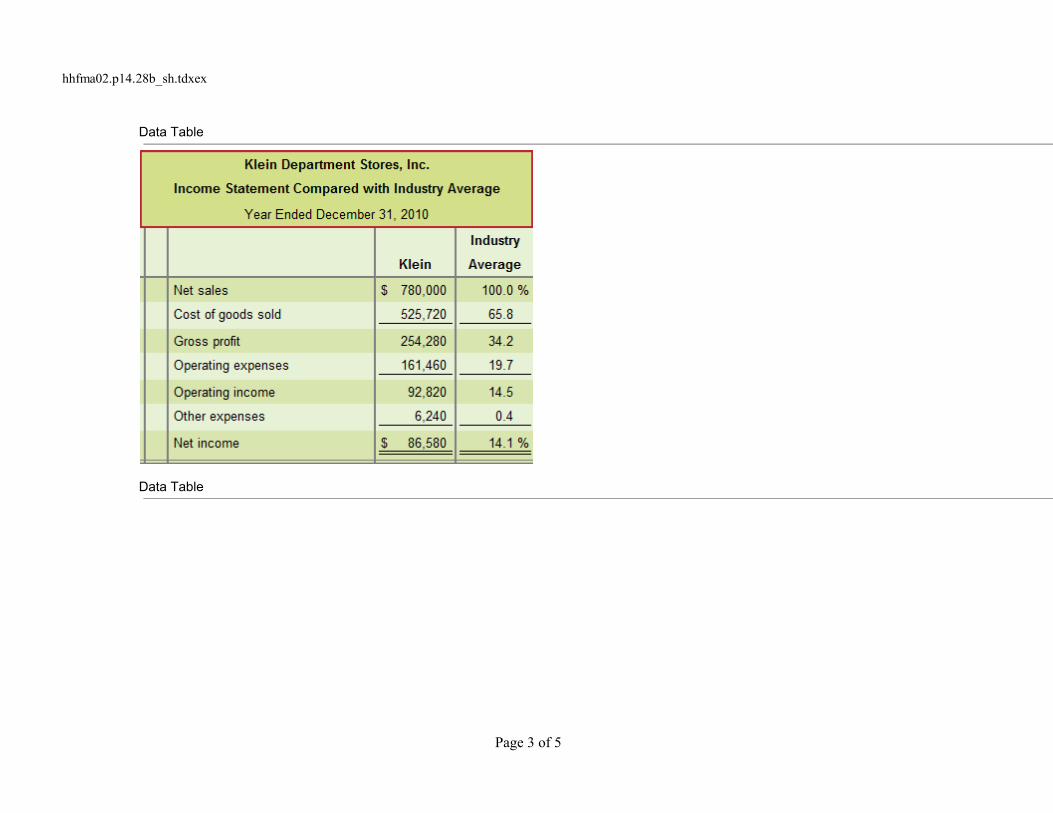
The Department Stores, Inc., chief executive officer (CEO) has asked you to compare the company's profit performance andfinancial position with the average for the industry. The CEO has given you the company's income statement and balance sheet, aswell as the industry average data for retailers.
(Click the icon to view the income statement.) (Click the icon to view the balance sheet.)
(Click the icon to view the requirements.)
Requirement 1. Prepare a common-size income statement for Department Stores. (Round your answers to one decimalplace.)
Prepare a common-size balance sheet for . (Round your answers to one decimal place.)
Page 1 of 5

hhfma02.p14.28b_sh.tdxex
Requirement 2. For the profitability analysis, compute 's (a) ratio of gross profit to net sales, (b) ratio of operating income tonet sales, and (c) ratio of net income to net sales. Compare these figures with the industry averages.
's common-size income statement shows that its ratios of gross profit, operating income and net income to net sales are
than the industry averages. Overall, 's profit performance is than average for the industry.
Requirement 3. For the analysis of financial position, compute 's (a) ratio of current assets to total assets and (b) ratio ofstockholders' equity to total assets. Compare these ratios with the industry averages.
's common-size balance sheet shows that its ratio of current assets to total assets and its ratio of stockholders' equity to total
assets are than the industry averages. Overall, 's financial position is than average for the industry.
Page 2 of 5
hhfma02.p14.28b_sh.tdxex
Data Table
Data Table
Page 3 of 5

hhfma02.p14.28b_sh.tdxex
More Info
Requirements1. Prepare a common-size income statement and balance sheet for . The first
column of each statement should present 's common-size statement, and thesecond column, the industry averages.
2. For the profitability analysis, compute 's (a) ratio of gross profit to net sales, (b)ratio of operating income to net sales, and (c) ratio of net income to net sales.Compare these figures with the industry averages. Is Department Stores' profitperformance better or worse than the industry average?
3. For the analysis of financial position, compute 's (a) ratio of current assets tototal assets and (b) ratio of stockholders' equity to total assets. Compare these ratioswith the industry averages. Is Department Stores' financial position better orworse than the industry averages?
Page 4 of 5

hhfma02.p14.28b_sh.tdxex
Page 5 of 5
hhfma02.p14.29b_sh.tdxex
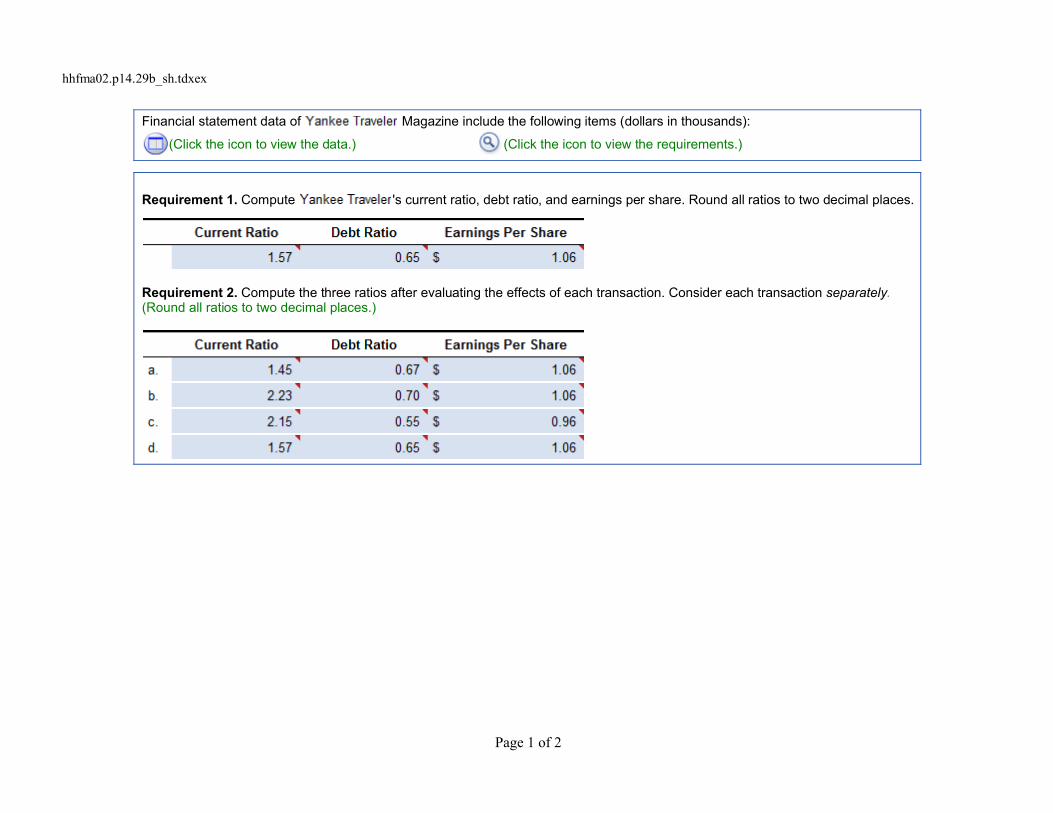
Financial statement data of Magazine include the following items (dollars in thousands):
(Click the icon to view the data.) (Click the icon to view the requirements.)
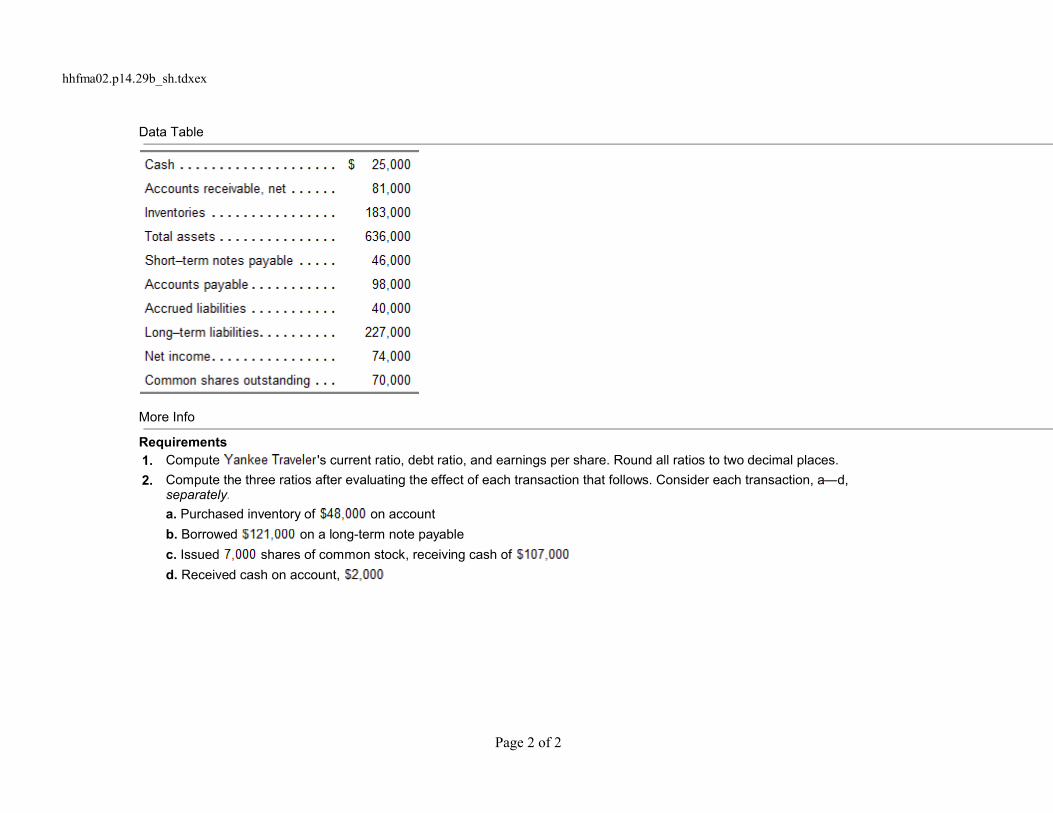
Requirement 1. Compute 's current ratio, debt ratio, and earnings per share. Round all ratios to two decimal places.
Requirement 2. Compute the three ratios after evaluating the effects of each transaction. Consider each transaction separately.(Round all ratios to two decimal places.)
Page 1 of 2
hhfma02.p14.29b_sh.tdxex
Data Table
More Info
Requirements1. Compute 's current ratio, debt ratio, and earnings per share. Round all ratios to two decimal places.
2. Compute the three ratios after evaluating the effect of each transaction that follows. Consider each transaction, a d,separately.
a. Purchased inventory of on account
b. Borrowed on a long-term note payable
c. Issued shares of common stock, receiving cash of
d. Received cash on account,
Page 2 of 2

hhfma02.p14.30b_sh.tdxex
Comparative financial statement data of , Inc., follow:
(Click the icon to view the income statements.)
(Click the icon to view the balance sheets.)
(Click the icon to view the additional financial information.)
(Click the icon to view the requirements.)
Requirement 1. Compute the requirement ratios for 2011 and 2010, beginning with the current ratio. (Round all ratios except theprice/earnings ratio to two decimal places. Round the price/earnings ratio to the nearest whole number.)
Requirement 2. Decide (a) whether 's ability to pay debts and to sell inventory improved or deteriorated during 2011 and(b) whether the investment attractiveness of its common stock appears to have increased or decreased.
(a) Did 's ability to pay its debts and to sell inventory improve or deteriorate during 2011?
(b) Did the investment attractiveness of 's common stock appear to have increased or decreased?
Page 1 of 4

hhfma02.p14.30b_sh.tdxex
Data Table
Data Table
Page 2 of 4

hhfma02.p14.30b_sh.tdxex
More Info
1. Market price of 's common stock: $ at December 31, 2011, and $ at December 31, 2010.2. Common shares outstanding: during 2011 and during 2010.3. All sales on credit.
Page 3 of 4

hhfma02.p14.30b_sh.tdxex
More Info
Requirements1. Compute the following ratios for 2011 and 2010:
a. Current ratiob. Times-interest-earned ratioc. Inventory turnoverd. Return on common stockholders' equitye. Earnings per share of common stockf. Price/earnings ratio
2. Decide (a) whether 's ability to pay debts and tosell inventory improved or deteriorated during 2011 and (b)whether the investment attractiveness of its common stockappears to have increased or decreased.
Page 4 of 4
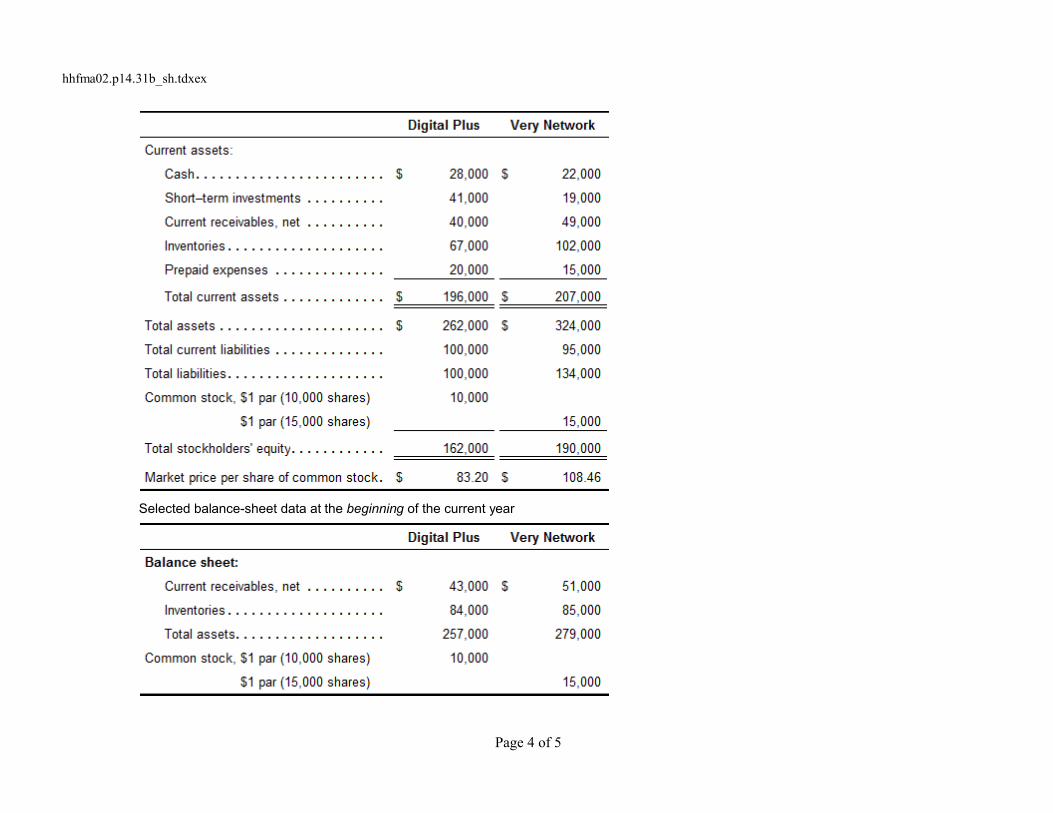
hhfma02.p14.31b_sh.tdxex
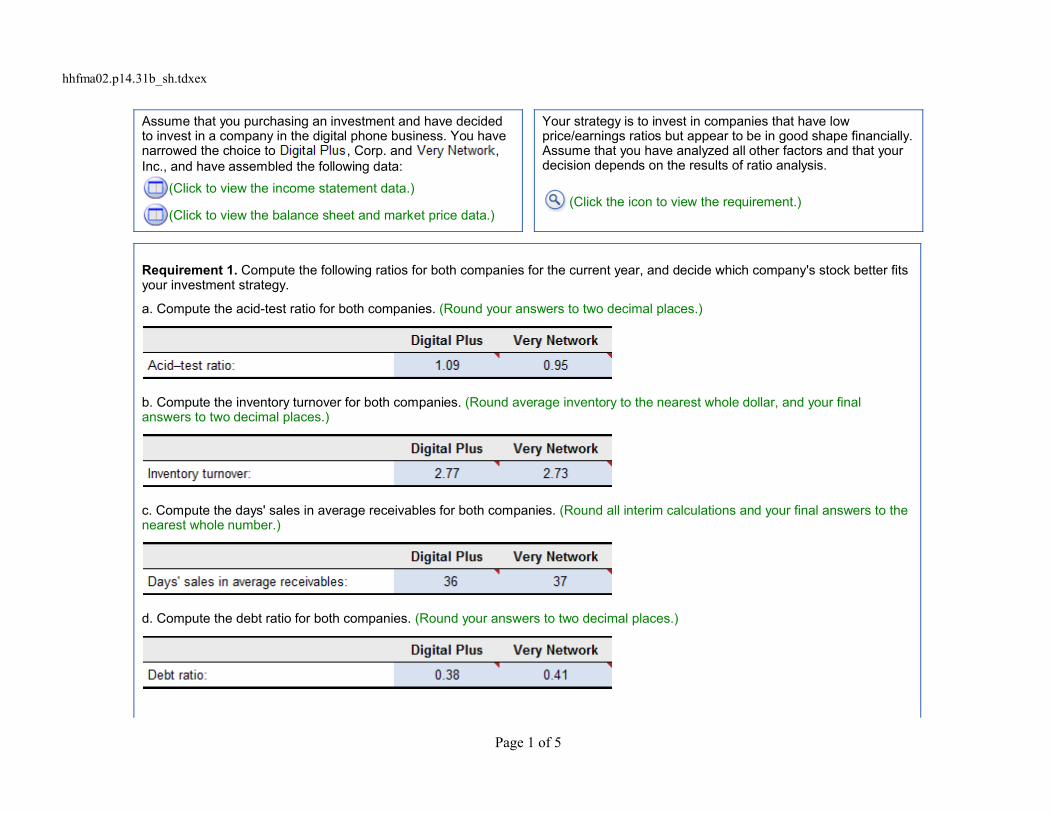
Assume that you purchasing an investment and have decidedto invest in a company in the digital phone business. You havenarrowed the choice to , Corp. and ,Inc., and have assembled the following data:
(Click to view the income statement data.)
(Click to view the balance sheet and market price data.)
Your strategy is to invest in companies that have lowprice/earnings ratios but appear to be in good shape financially.Assume that you have analyzed all other factors and that yourdecision depends on the results of ratio analysis.
(Click the icon to view the requirement.)
Requirement 1. Compute the following ratios for both companies for the current year, and decide which company's stock better fitsyour investment strategy.
a. Compute the acid-test ratio for both companies. (Round your answers to two decimal places.)
b. Compute the inventory turnover for both companies. (Round average inventory to the nearest whole dollar, and your finalanswers to two decimal places.)
c. Compute the days' sales in average receivables for both companies. (Round all interim calculations and your final answers to thenearest whole number.)
d. Compute the debt ratio for both companies. (Round your answers to two decimal places.)
Page 1 of 5
hhfma02.p14.31b_sh.tdxex
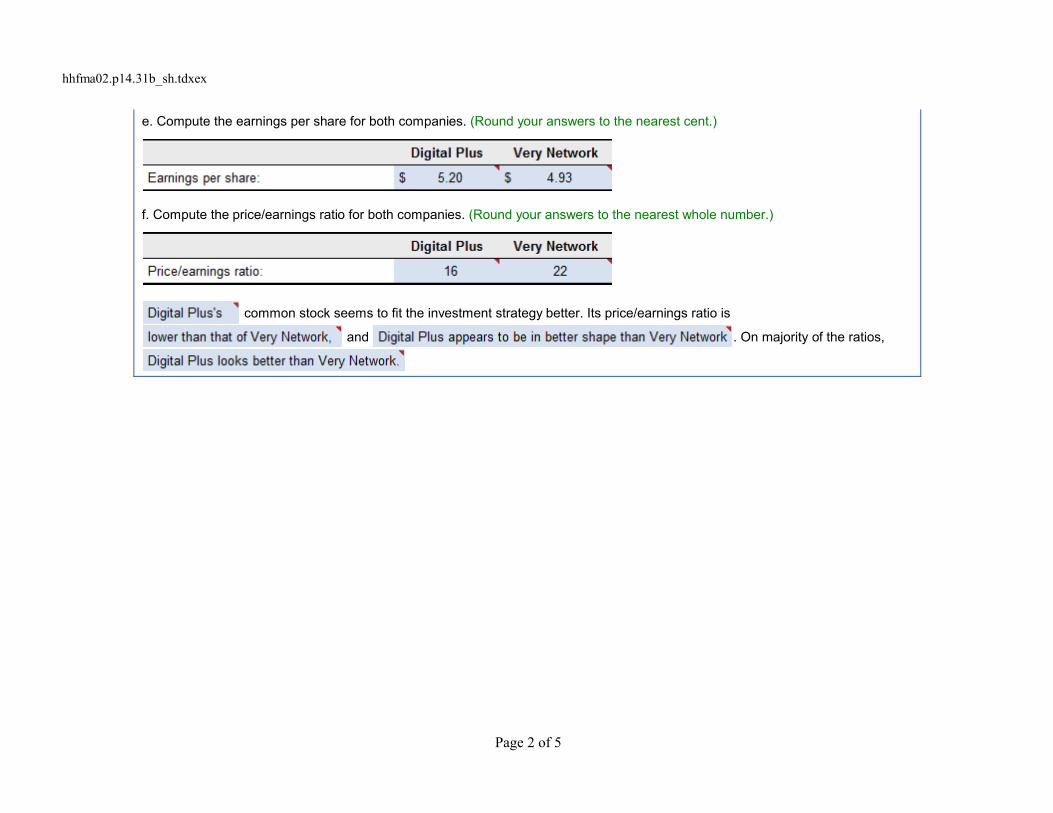
e. Compute the earnings per share for both companies. (Round your answers to the nearest cent.)
f. Compute the price/earnings ratio for both companies. (Round your answers to the nearest whole number.)
common stock seems to fit the investment strategy better. Its price/earnings ratio is
and . On majority of the ratios,
Page 2 of 5
hhfma02.p14.31b_sh.tdxex
Data Table
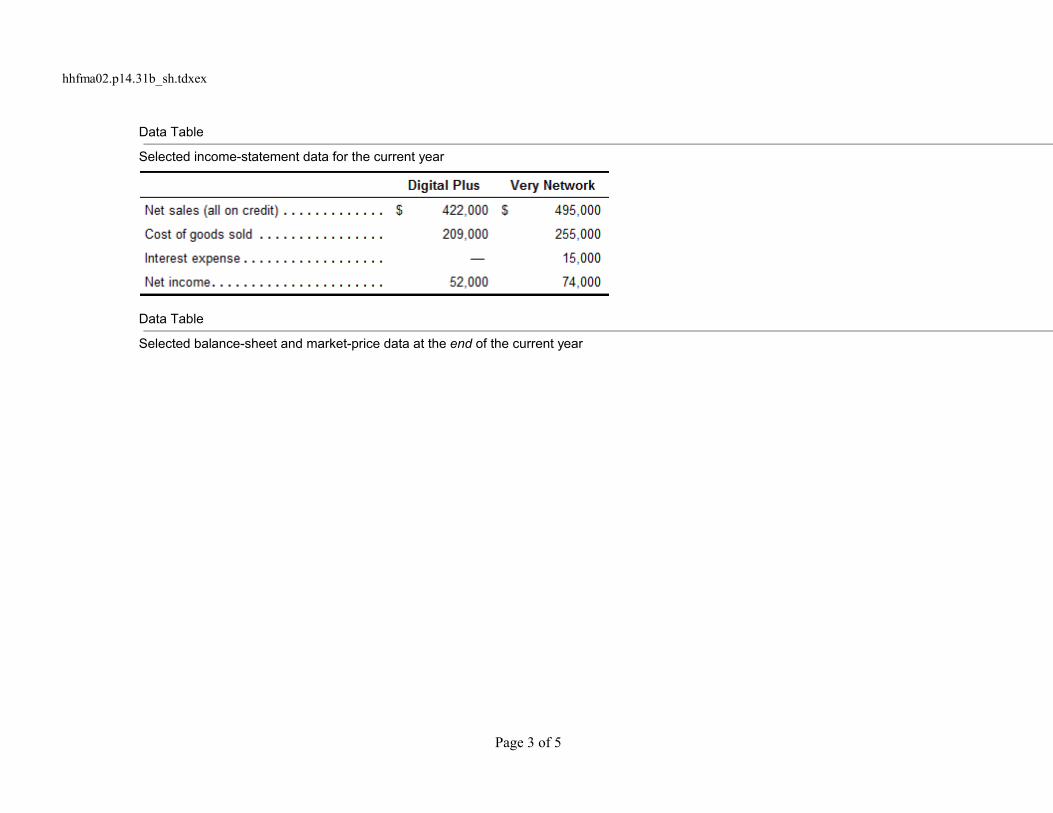
Selected income-statement data for the current year
Data Table
Selected balance-sheet and market-price data at the end of the current year
Page 3 of 5
hhfma02.p14.31b_sh.tdxex
Selected balance-sheet data at the beginning of the current year
Page 4 of 5

hhfma02.p14.31b_sh.tdxex
More Info
Requirement1. Compute the following ratios for both companies for the current year,
and decide which company's stock better fits your investment strategy.
a. Acid-test ratio
b. Inventory turnover
c. Days' sales in average receivables
d. Debt ratio
e. Earnings per share of common stock
f. Price/earnings ratio
Page 5 of 5
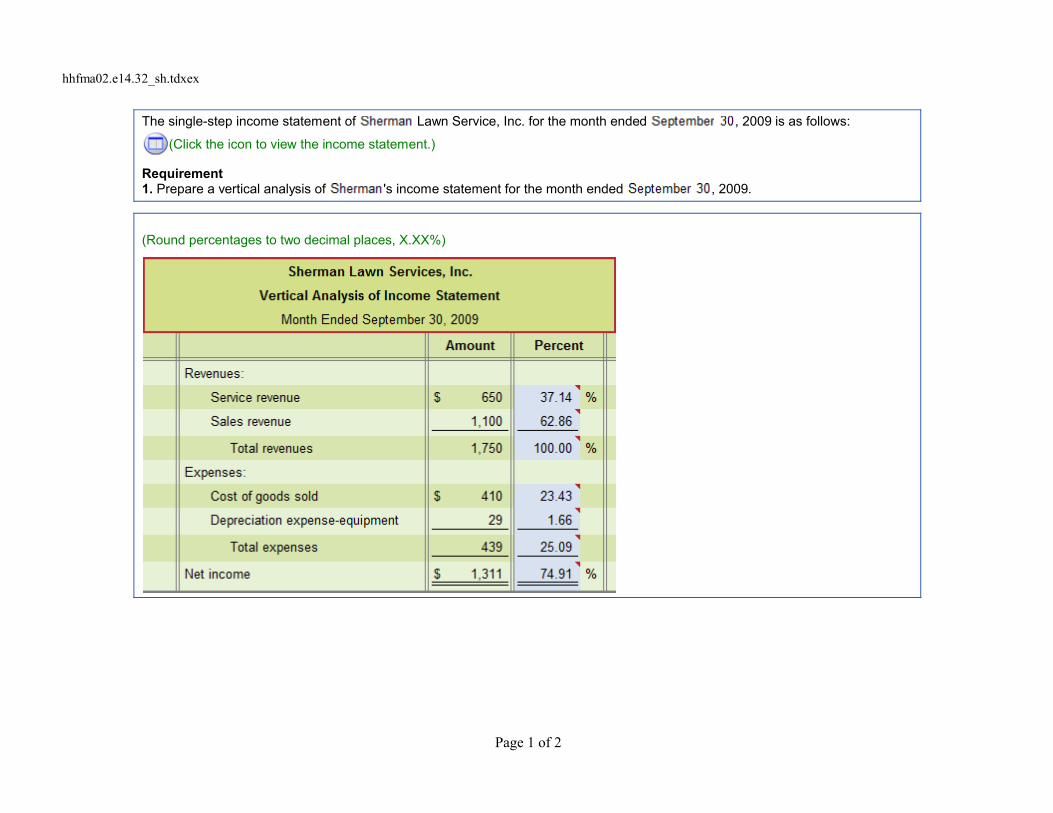
hhfma02.e14.32_sh.tdxex
The single-step income statement of Lawn Service, Inc. for the month ended , 2009 is as follows:
(Click the icon to view the income statement.)
Requirement1. Prepare a vertical analysis of 's income statement for the month ended , 2009.
(Round percentages to two decimal places, X.XX%)
Page 1 of 2
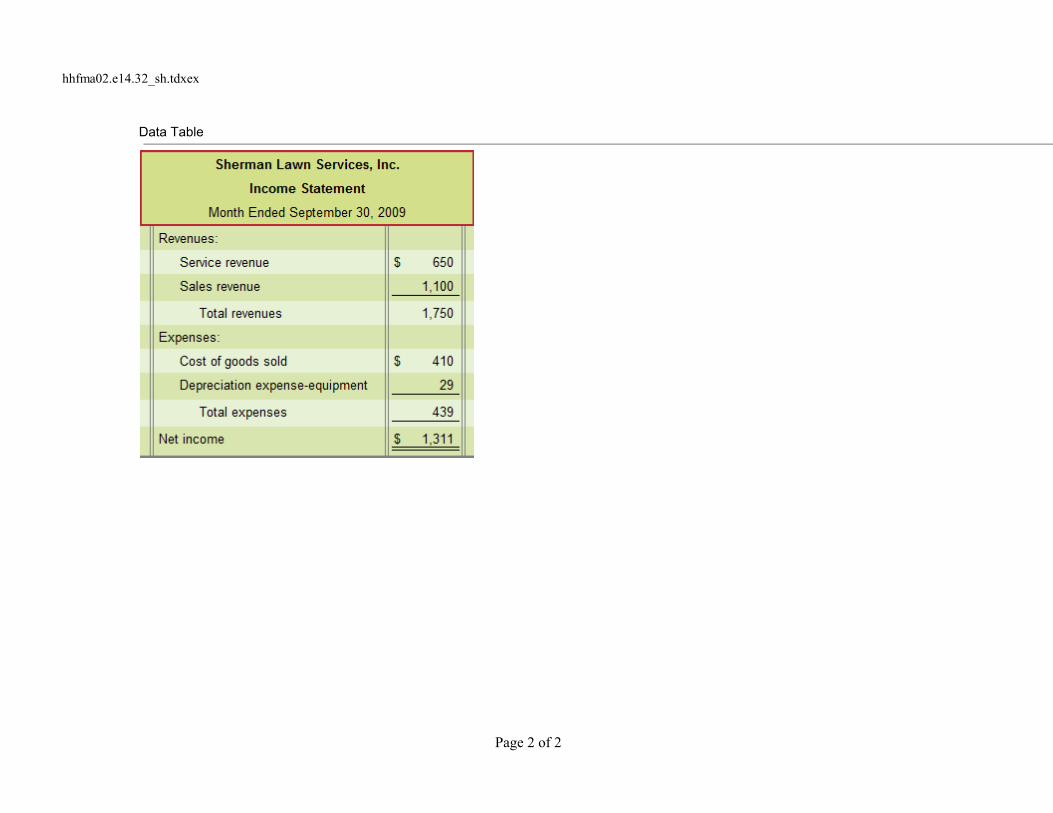
hhfma02.e14.32_sh.tdxex
Data Table
Page 2 of 2


![streaming.missioncollege.orgstreaming.missioncollege.org/jhui/media/ACCTG_034_34408/...754 Chapter 1 5 S15-9 Computing EPS and P/E ratio [5—10 min] Use the financial statements of](https://static.fdocuments.in/doc/165x107/5aa689457f8b9afa758e9417/chapter-1-5-s15-9-computing-eps-and-pe-ratio-510-min-use-the-financial-statements.jpg)


