Page 1 CONSULTANCY AND RESEARCH IN AQUACULTURE AND THE AQUATIC ENVIRONMENT A Company in the...
55
Page 1 CONSULTANCY AND RESEARCH IN AQUACULTURE AND THE AQUATIC ENVIRONMENT A Company in the NIVA-group Methodology for Environmental monitoring of aquaculture
-
Upload
doreen-casey -
Category
Documents
-
view
218 -
download
2
Transcript of Page 1 CONSULTANCY AND RESEARCH IN AQUACULTURE AND THE AQUATIC ENVIRONMENT A Company in the...

Page 1
CONSULTANCY AND RESEARCH IN AQUACULTURE AND THE AQUATIC ENVIRONMENT
A Company in the NIVA-group
Methodology for Environmental monitoring of aquaculture

Page 2
Environmental monitoring and modelling
What information do we need?
Physical parametersChemical parametersBiological parametersDetailed survey of production in the area (area of pens and annual production)
Historical data Collecting new data
Predictive modelling of the areas
Environmental data

Page 3
Survey for mapping the environmental condition
Weather datawind direction, speed, temperature
Bathymetry of the areaSea map information
New mapping
Tidal range and current speed, direction and dispersion
Temperature, turbidity, salinity, oxygen, chlorophyll profile through the water column
Water chemistry
Sediment analysis (biological and chemical)

Page 4
Equipment required
2 Grab – freshwater Ekman grab and modified marine Van Veen grab
2 Sieve for the sieving the sediment samples
4 standard current meters – current and temp
2 enhanced current meters – current, temp, conductivity, oxygen, turbidity, depth
CTD probe – conductivity, temperature, depth, chlorophyll, oxygen, turbidity
2 handheld Garmin GPS
2 handheld echo sounders
Garmin GPS and echo sounder
2 portable computers
Total value of US$ 100,000

Page 5
Bathymetry
• The bathymetry is done by using a Garmin echo-sounder which contains a GPS and a chart plotter (GPSmap 178C sounder)
• GPS store the tracks automatically tagged with the date and time of creation, as well as water temperature and depth
• It can be set up on a small boat
• It usually takes a full day to complete depending on the size of the area surveyed

Page 6

Page 7
Bathymetry
Page 8
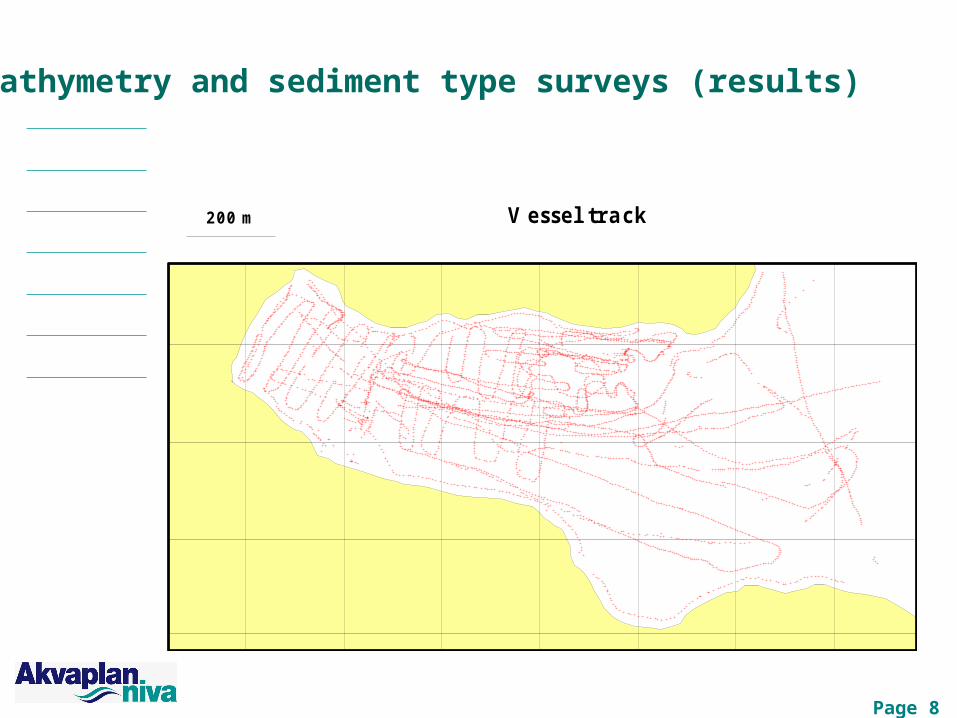
Bathymetry and sediment type surveys (results)
V esse l track2 0 0 m

Page 9
Bathymetry survey (results)
-1 0 0
-9 0
-8 0
-7 0
-6 0
-5 0
-4 0
-3 0
-2 0
-1 0
0
D ep th (m )
D ep th (m ) an d cage p osition s2 0 0 m

Page 10
Current meter deployments
These measurements are made to measure the general hydrodynamic conditions at each site. The main factors of interest are:• the distribution of the currents and the extremes
measured at the site
• how current speed and direction are affected by wind conditions
• the use of these measurements in modelling the dispersion of wastes from the cages
• Two of the current meters have sensor that are measuring turbidity, conductivity, depth, oxygen
Page 11
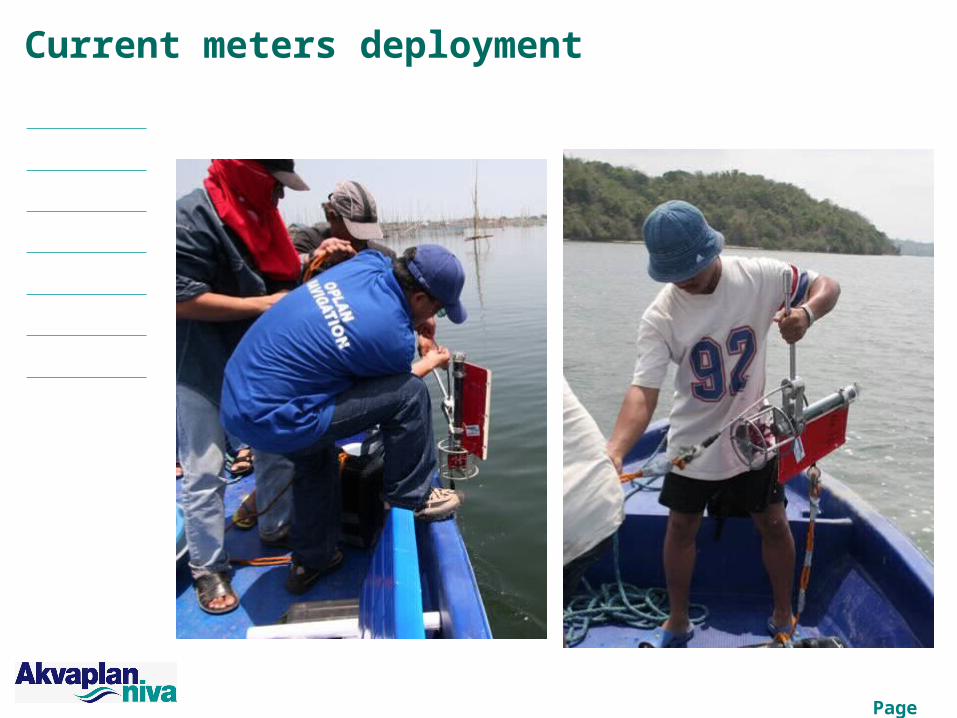
Current meters deployment

Page 12
Current meter deployment
•A typical mooring•current meters placed at 5m and 10m depths for areas with 20m deep•at 3.5 and 7.5m depths for areas 15m deep•Set up are often modified for site specific conditions•Deployed for 24 hours to one month

Page 13
Equipment – Current meter

Page 14

Page 15

Page 16
Downloading and processing data

Page 17
Current meter deployments (results)
The plots show current speed and direction for a site measured over a one month period at the surface
0
10
20
30
40
17
-Se
p
18
-Se
p
19
-Se
p
20
-Se
p
21
-Se
p
22
-Se
p
23
-Se
p
24
-Se
p
25
-Se
p
26
-Se
p
27
-Se
p
28
-Se
p
29
-Se
p
30
-Se
p
1-O
ct
2-O
ct
3-O
ct
4-O
ct
5-O
ct
6-O
ct
7-O
ct
8-O
ct
9-O
ct
10
-Oct
11
-Oct
12
-Oct
13
-Oct
14
-Oct
15
-Oct
16
-OctSp
ee
d c
m s
ec
-1
0
90
180
270
360
17
-Se
p
18
-Se
p
19
-Se
p
20
-Se
p
21
-Se
p
22
-Se
p
23
-Se
p
24
-Se
p
25
-Se
p
26
-Se
p
27
-Se
p
28
-Se
p
29
-Se
p
30
-Se
p
1-O
ct
2-O
ct
3-O
ct
4-O
ct
5-O
ct
6-O
ct
7-O
ct
8-O
ct
9-O
ct
10
-Oct
11
-Oct
12
-Oct
13
-Oct
14
-Oct
15
-Oct
16
-OctDir
ec
tio
n °
ma
g
MHM LAMLASH CURRENT SPEED AND DIRECTION, SURFACE METER, 1345Z 17 SEP 1997 TO 1040Z 15 OCT 1997

Page 18
Plots from the current meters at different depths. Analysis will also give the current speed and direction distribution
[0,3) [3,6) [6,9) [9,12) [12,15) [15,18) [18,21) [21,24) [24,27) [27,30) [30,33) [33,36) 360
100
200
300
400
500
600
700
800
900F
RE
QU
EN
CY
CURRENT SPEED (cm s-1)
MHM CAIRIDH CURRENT SPEED HISTOGRAM SURFACE METER, 1354Z 16 DEC 1998 TO 1204Z 4 JAN 1999
[0,1
5)
[15,3
0)
[30,4
5)
[45,6
0)
[60,7
5)
[75,9
0)
[90,1
05)
[105,1
20)
[120,1
35)
[135,1
50)
[150,1
65)
[165,1
80)
[180,1
95)
[195,2
10)
[210,2
25)
[225,2
40)
[240,2
55)
[255,2
70)
[270,2
85)
[285,3
00)
[300,3
15)
[315,3
30)
[330,3
45)
[345,3
60)
0
50
100
150
200
250
300
350
400
450
FR
EQ
UE
NC
Y
CURRENT DIRECT (° mag)
MHM CAIRIDH CURRENT DIRECTION HISTOGRAM, SURFACE METER, 1354Z 16 DEC 1998 TO 1204Z 4 JAN 1999
Current meter deployments (results)

Page 19
Current measurements in Bolinao

Page 20
Current measurements in Lake Taal – at 10 meters
3/30/06 9:36 3/30/06 19:12 3/31/06 4:48 3/31/06 14:24 4/1/06 0:00 4/1/06 9:36D a te Tim e
0
2
4
6
8
10
12
14C
urr
ent
sp
eed
(cm
/s)
0
45
90
135
180
225
270
315
360
Dir
ecti
on

Page 21
Oxygen and temperature in Lake Taal – at 10 meters
3/30/06 9:36 3/30/06 19:12 3/31/06 4:48 3/31/06 14:24 4/1/06 0:00 4/1/06 9:36D a te Tim e
23.2
23.6
24
24.4
24.8
25.2
Te
mp
era
ture
°C
120
160
200
240
280
320
Oxy
gen

Page 22
Drifting buoy surveys (objectives)
The level of water dispersion near a fish farm is an important factor as it determines how well wastes are dispersed and water bodies are reoxygenated. The main factors of interest are:
• how quickly released drifters spread out relative to one another
• How far apart the drifters have spread out at the end of the release period
• the measurement of unusual hydrodynamic conditions in the surrounding area

Page 23
Drifting buoy surveys (drogues)
The drifting buoys are buoys marked with flags that are pulled along by subsurface water currents by sails. They are released in a group and their movement monitored

Page 24

Page 25

Page 26

Page 27
Drifting buoy surveys (results)
An example of a release made from a cage group. The drifters show a clockwise circulation which would be difficult to measure with a single current meter mooring
1 2 3 4 5 6 Cage group
100 m
N
Release start: 11:56Release end: 15:13

Page 28
Turbidity and measurements
Water depth is recorded when secci disc can no longer been seen

Page 29
Conductivity, Temperature and Dissolved oxygen (CTDO)
The CTDO measures, calculates and records:
•Water salinity (conductivity) •Temperature•Oxygen level•Turbidity
•Possibilities to make isoplets and profiles for the different parameters
Also can add•Chlorophyll

Page 30
Water column sampling by CTD

Page 31
Water column measurements
CTD is dropped to the bottom (seabed) and retrieved slowly to the surface (records data every 5th second)

Page 32
Water column sampling
Water column is sampled for dissolved oxygen, salinity and temperature

Page 33
CTD transect

Page 34
CTD transectCTD transect

Page 35
Horizontal plot of oxygen in Lake Taal at 1 meter

Page 36
Horizontal plot of oxygen in Lake Taal at 2 meter

Page 37
Horizontal plot of oxygen in Lake Taal at 7 meter

Page 38
Horizontal plot of oxygen in Lake Taal at 20 meter

Page 39
CTD-profile in Lake Taal - April 2006
26 27 28 29 30
Tem perature °C
100
80
60
40
20
0
De
pth
0 40 80 120 160Oxygen %
0 2 4 6 8C hlorophyll (µg/l)
0 1 2 3 4 5Turbidity FTU

Page 40
Transects – vertical profiles in Bolinao
1 61 41 21 0
86420
35.38
35.48
35.58
35.68
35.78
35.80
Salinity, transect 1
1 61 41 21 0
86420
30.0
30.2
30.4
30.6
30.8
31.0
31.1
Temperature, transect 1

Page 41
Water quality
Water samples are taken and analyzed for parameters that relevant for measuring the environmental conditions
•chlorophyll-a
•ammonia
•nitrate
•nitrite
•phosphate

Page 42
Chlorophyll

Page 43
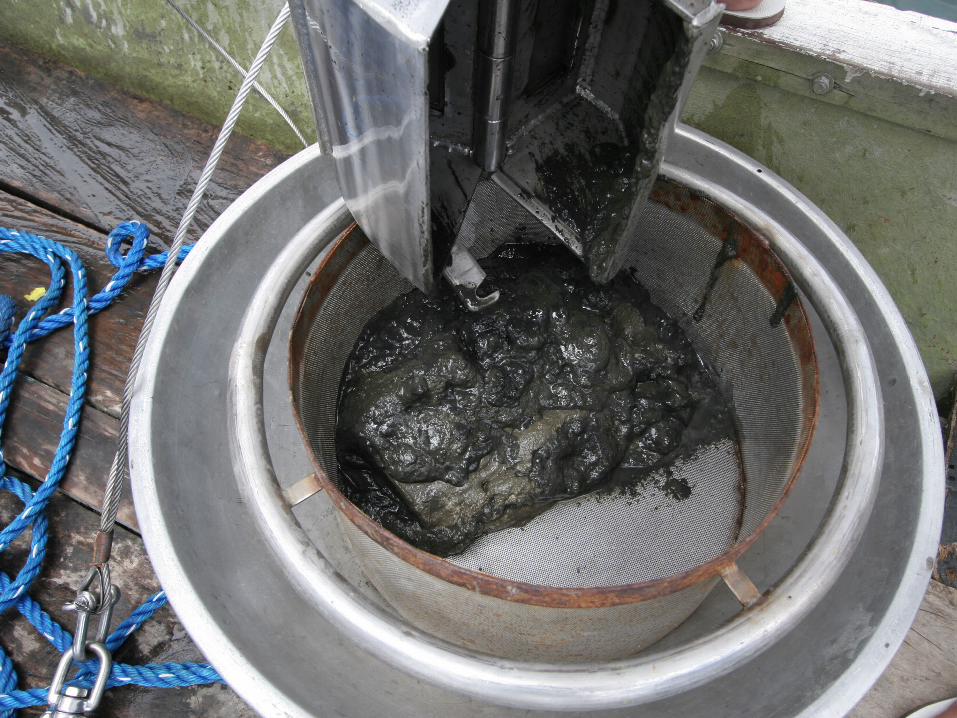
Sediment studies - sampling
Samples or taken by grab

Page 44

Page 45
Page 46

Page 47
Page 48
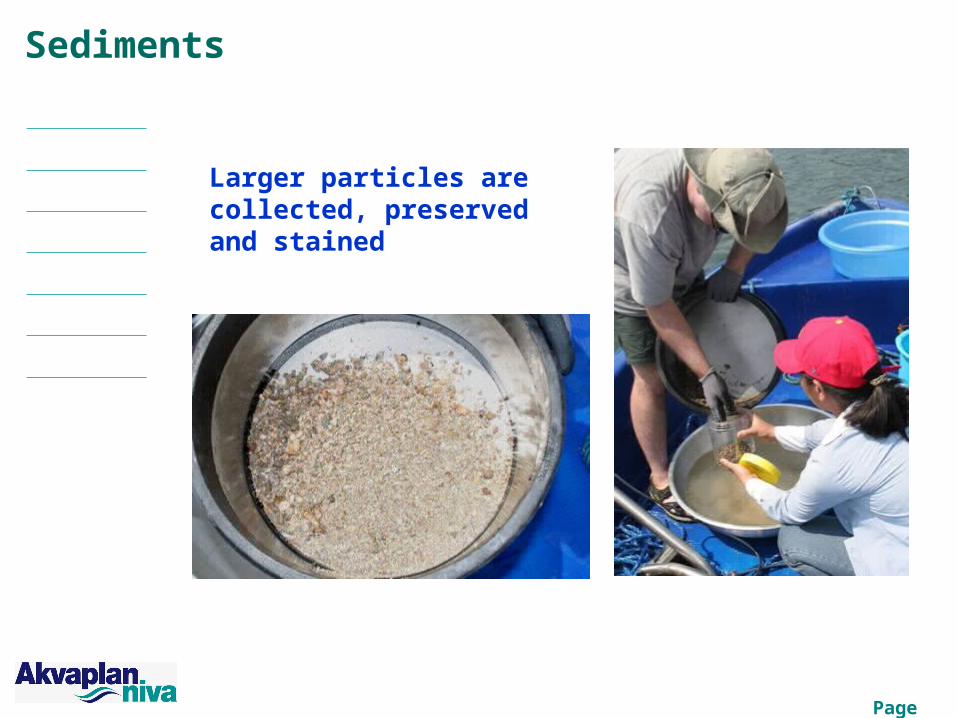
Sediments
Larger particles are collected, preserved and stained

Page 49
High organic content- close to a fish cage
Low organic content- far away from a fish cage

Page 50
Bolinao – station with bad conditions

Page 51
Bolinao – marine station with good conditions

Page 52
Grab movie

Page 53
Sediment sample analysis - taxonomy
Samples are analysed for benthic diversity Station 1:
Taxon Number
1. Cirratulus sp. (polychaeta) 338
2. Dorvillea sp. (polychaeta) 1763. Nereis sp. (polychaeta) 1234. Cirratulidae indet (polychaeta) 36
5. Loripes lucinalis (mollusca) 146. Paguridae indet (crustacea) 8
7. Lumbrineris sp. (polychaeta) 8
8. Paraonis sp. (polychaeta) 8
9. Typosyllis sp. (polychaeta) 8
10. Tellina donacina (mollusca) 7
Reference station:
Taxon Number
1. Tellina donacina (mollusca) 39
2. Lucinella divaricata (mollusca) 23
3. Gouldia minima (mollusca) 21
4. Owenia fusiformis (polychaeta) 20
5. Aspidosiphon mulleri (polychaeta) 196. Ascidiacea indet (tunicata) 17
7. Nuculana pella (mollusca) 15
8. Gonilia calliglypta (mollusca) 159. Tanaidacea indet (crustacea) 13
10. Lumbrineris sp. (polychaeta) 13

Page 54
Sediments – chemical samples
Samples are taken of the surface layer for chemical analysis (TOC, grain size, ++)
Page 55
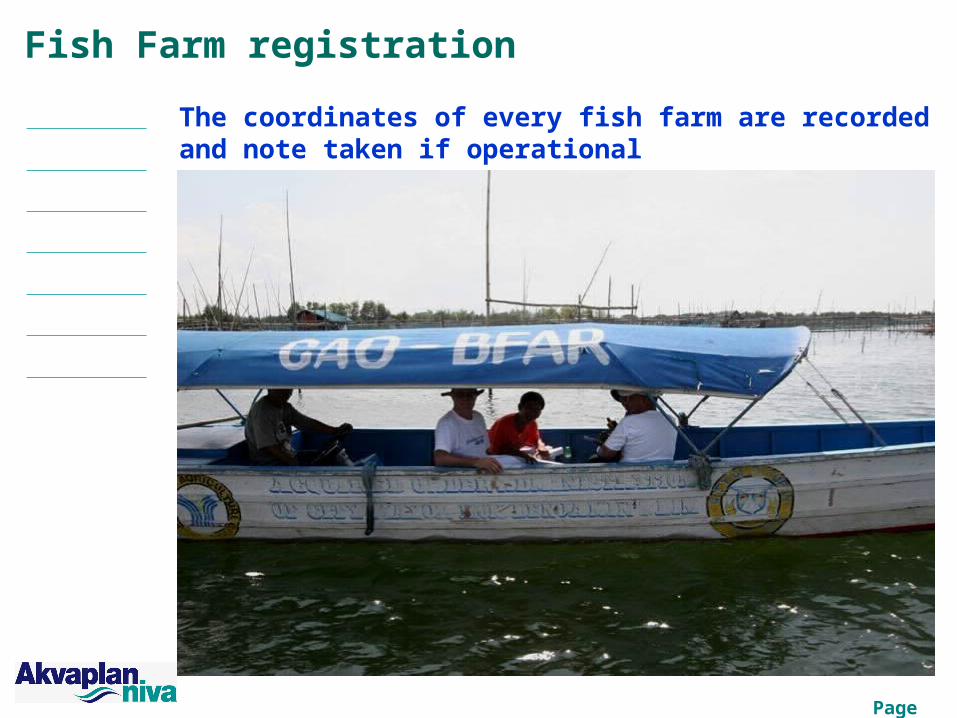
Fish Farm registration
The coordinates of every fish farm are recorded and note taken if operational